updated district level-database
TRANSCRIPT

Updated District Level-Database
(Apportioned)
Documentation of Files: 1966-67 to
2017-18
(1966 district boundaries)

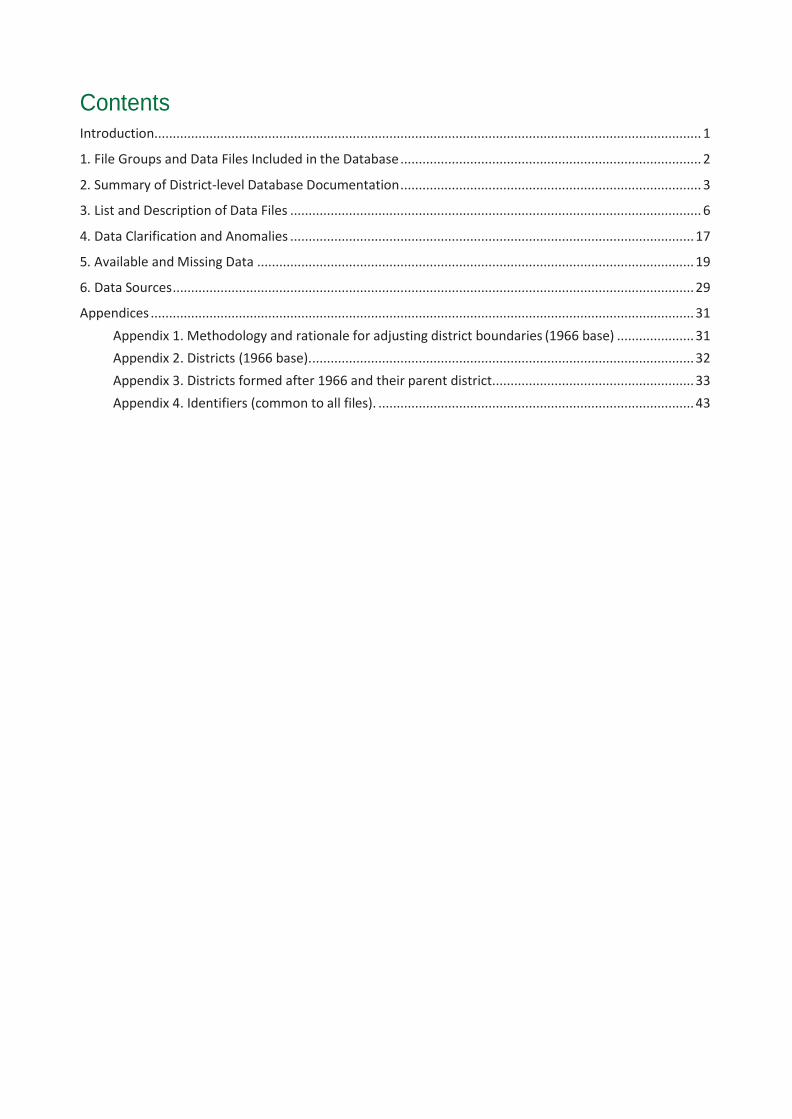
Contents Introduction..................................................................................................................................................... 1
1. File Groups and Data Files Included in the Database .................................................................................. 2
2. Summary of District-level Database Documentation .................................................................................. 3
3. List and Description of Data Files ................................................................................................................ 6
4. Data Clarification and Anomalies .............................................................................................................. 17
5. Available and Missing Data ....................................................................................................................... 19
6. Data Sources .............................................................................................................................................. 29
Appendices .................................................................................................................................................... 31
Appendix 1. Methodology and rationale for adjusting district boundaries (1966 base) ..................... 31
Appendix 2. Districts (1966 base). ........................................................................................................ 32
Appendix 3. Districts formed after 1966 and their parent district. ...................................................... 33
Appendix 4. Identifiers (common to all files). ...................................................................................... 43

iv

1
Introduction The expanded and updated district-level database for 20 states includes data on key agriculture and socio- economic variables from 1966 to 2017. This documentation is for the updated apportioned database (i.e. data for 1966 district boundaries).
This database builds on the earlier ICRISAT district-level database of 13 states (Andhra Pradesh, Gujarat, Haryana, Karnataka, Madhya Pradesh, Maharashtra, Punjab, Rajasthan, Tamil Nadu, Uttar Pradesh, Bihar, West Bengal and Odisha) with an additional 3 states (Assam, Himachal Pradesh and Kerala), 3 newly formed states in 2000 (Chhattisgarh, Jharkhand and Uttarakhand) and Telangana formed in 2013. The earlier database was created with funding support from ICRISAT, World Bank, System Wide Livestock Program (SLP-CGIAR) in collaboration with National Institute of Agricultural Economics and Policy Research (NIAP), a think tank of the Indian Council of Agricultural Research (ICAR), New Delhi.
The current update of the database is being jointly carried out by ICRISAT and Tata Cornell Institute (TCI) and includes data for all districts in 20 states until 2015. It includes data on crop area and production, irrigated area, monthly rainfall, livestock and agricultural implements, operational holdings, population census and select socio-economic and agro-ecological variables. Additionally, the scope of the database has been expanded to include data on soft infrastructure related to education, health, nutrition and credit. Data on environmental variables like temperature, Actual Evapotranspiration (AET), Potential Evapotranspiration (PET), etc., was generated using pixel-level data from Terra Climate database. A web- based interactive tool (with a dashboard and spatial maps) is being created to add value to the database and allow quick access to and extraction of information.
The database is divided into 2 datasets, apportioned that includes only the 1966 base districts, and unapportioned that includes all the districts formed until 2017 in 20 states of India. The database in this documentation relates to the 1966 district boundaries i.e., 314 districts. Data on districts formed after 1966 were given back to their parent district and removed from the file. Thus, consistent and comparable time series data are available for all the districts from after 1966. The methodology for apportioning newly formed districts to their parent district and a list of districts formed after 1966 and their parent districts are given in appendices 1 and 2.
The data are stored in Excel spreadsheet. Compilation, matching data from different states and sources, computerization, proof reading, and subsequent validation of raw data were extremely time-consuming. Despite our efforts, several anomalies remain in the database and are highlighted in the section on ‘Data clarification and anomalies’. Users are urged to read this documentation carefully prior to using the data, particularly the sections on data clarification and anomalies and missing data, and bring to our notice any glaring inconsistencies so that we can continuously improve the quality of data.
Several data sources were utilized to compile the database. Many times, staff working on this project had to visit offices of the state Directorates of Agriculture, state Bureaus of Economics and Statistics, Department of Animal husbandry, Department of Horticulture etc. to collect the latest data. Details on the sources in each state are given in the section on ‘data sources’. The support and cooperation extended by these organizations is highly appreciated, and we take this opportunity to thank them in enabling the update. But for their cooperation, this database would not have been completed.

2
1. File Groups and Data Files Included in the Database
The database is divided into the following file groups and stored in Excel spreadsheet.
File Groups and Data Files
I Crops
1 Area, production and yield (APY)
2 Area under high yielding varieties (cereals)
II Irrigation
1 Crop-wise
2 Source-wise
III Biophysical
1 Land use
2 Monthly rainfall
3 Normal rainfall
4 Soil type1
5 Length of growing period (LGP)1
IV Inputs
1 Fertilizer consumption
2 Seasonal fertilizer consumption
V Prices
1 Farm harvest prices (FHP)
VI Census
1 Population
2 Livestock
3 Crossbred and Indigenous cattle
4 Operational holdings
File Groups and Data Files
VII Livestock Products
1 Milk
2 Meat
3 Egg
VIII Infrastructure
1 Markets and roads
2 Banks and post offices
IX Domestic Product
1 Sector-wise GDP
X2 Environment (pixel generated)
1 Actual Evapotranspiration (AET)
2 Potential Evapotranspiration (PET)
3 Climate Water Deficit (Def)
4 Precipitation (Ppt)
5 Maximum Temperature (Tmax)
6 Minimum Temperature (Tmin) 1. Variables in these data files are static, i.e., single point
data, not time series.
2. Apportioning has not been done for this group of files and
are only available from the unapportioned datasets.

3
Standalone additional files for bulk download only1
Name of the file
Fruits APY By type
Vegetables APY By type
Spices APY By type
Season-wise APY All major crops
GDP (current & constant) Total and by sectors
NDP (current & constant) Total and by sectors
Education Number of institutions
Warehouses and godowns Number and capacity
Cold storage Number and capacity
Groundwater table Depth of water table
Credit Agriculture sector
Nutrition NHFS survey data
Environment From Pixel level data
1 Apportioning has not been done for files in this group and are available for bulk download only for the unapportioned datasets.
2. Summary of District-level Database Documentation The district-level database for India is divided into two categories: Apportioned database and Unapportioned database.
Apportioned database: Data for all variables for the districts formed after 1966 have been given back to their parent district and removed from the database. A total of 258 new districts were formed between 1966 and 2017. For example, Rangareddy district was formed in 1978-1979 from Hyderabad. The data for all variables for Rangareddy district were given back to its parent district Hyderabad and Rangareddy district, removed from the database. In case a new district is formed from more than 1 parent district the criterion used for determining the apportioning percentage was based on the geographical area of the parent district, transferred to the new district. The data for all variables in the database [except for rainfall, farm harvest prices (FHP) and wages] were apportioned using using proportion of geographical area transferred to the new district. Thus, the continuity of data over time was ensured to compare key
trends at two points in time, enabling time series analysis. For more details, see Appendix 1 on adjustment of district boundaries. This database contains data for 314 districts spread across 20 states of India from 1966-67 to 2017-18.
States covered
The database covers the 20 states of Andhra Pradesh, Bihar, Gujarat, Haryana, Karnataka, Madhya Pradesh, Maharashtra, Odisha, Punjab, Rajasthan, Tamil Nadu, Uttar Pradesh, West Bengal, Chhattisgarh, Jharkhand, Uttarakhand, Assam, Himachal Pradesh, Kerala and Telangana.
Years
1966-67 to 2015-2016.

4
Number of districts in 20 states1 in the district-level database (1966 base) and in 2017 Apportioned (1966 base) Unapportioned (2017)
State code Name of state Number of districts Number of districts
1 Andhra Pradesh 20 13
2 Bihar 17 38
3 Gujarat 18 33
4 Haryana 7 22
5 Karnataka 19 31
6 Madhya Pradesh 43 51
7 Maharashtra 26 36
8 Odisha 13 30
9 Punjab 11 22
10 Rajasthan 26 33
11 Tamil Nadu 13 32
12 Uttar Pradesh 54 75
13 West Bengal 16 23
14 Chhattisgarh 6 27
15 Jharkhand 6 24
16 Uttarakhand 8 13
17 Assam 10 33
18 Himachal Pradesh 10 12
19 Kerala 10 14
20 Telangana - 31 Total 313 594 1 Chhattisgarh, Jharkhand and Uttarakhand states were formed in 2000 from Madhya Pradesh, Bihar and Uttar Pradesh states, respectively. Telangana was formed from the erstwhile Andhra Pradesh in 2013.
Missing data Missing data are shown as ‘-1’ in the data files in the following cases:
◆ Complete year missing for all variables in a file (i.e., variable group) for selected states/year not included in the dataset.
◆ Data missing for a few districts for some variables in a file.
◆ Data missing for a specific crop/variable in a file for selected states (for instance, the crop is not grown in that particular state).
Data format
The data are stored in Excel spreadsheet. The database is divided into 26 data files.
Common variables
In the database, each file has the following four common identifier variables: State code, State name, District code and District name. All identifiers including those related to agro-ecological zone, SAT and non- SAT, etc., are shown in Appendix 4.

5
Summary of data files
Time series data files
Area under HYV cereal crops Rice, Wheat, Sorghum, Pearl millet, Maize, Finger millet, Total HYV area
Source-wise irrigated area Net irrigated area by Canals, Tanks, Tube wells, Other wells, Total wells, Gross
irrigated area, Net irrigated area
Seasonal Fertilizer consumption Nitrogen, Phosphate, Potash, Total (NPK) for kharif and rabi seasons
Normal monthly rainfall January-December normal rainfall, Annual normal rainfall
Length of Growing Period Length of growing period (days)
Farm harvest prices Rice, Paddy, Wheat, Sorghum, Pearl millet, Maize, Finger millet, Barley, Chickpea,
Pigeonpea, Sugarcane (gur), Groundnut, Sesamum, Rapeseed and Mustard, Linseed, Castor, Cotton (kapas)
Livestock Census Total male and female cattle (crossbred + indigenous), Adult male cattle (crossbred + indigenous), Adult female cattle (crossbred + indigenous), Young male cattle (crossbred + indigenous), Young female cattle (crossbred + indigenous), Young male and female cattle (crossbred + indigenous), Total male and female buffaloes, Adult male buffaloes, Adult female buffaloes, Young male buffaloes, Young female buffaloes, Young male and female buffaloes, Total sheep (adult + young stock), Total goats (adult + young stock), Total horses (adult + young stock), Total donkeys (adult + young stock), Total camels (adult + young stock), Total pigs (adult + young stock), Total livestock (excluding dogs), Total poultry
Marginal number, Marginal area (below 1 ha); Small number, Small area
(1 to 2 ha); Semi-medium number, Semi-medium area (2 to 4 ha); Medium number, Medium area (4 to 10 ha); Large number, Large area (above 10 ha); Total number, Total area
Contd...
Rice, Wheat, Sorghum (kharif), Sorghum (rabi), Sorghum (total), Pearl millet, Maize, Finger millet, Barley, Chickpea, Pigeonpea, Minor pulses, Groundnut, Sesamum, Rapeseed and Mustard, Linseed, Sugarcane, Cotton, Total fruits and vegetables
Crop-wise irrigated area
Geographical area, Forest area, Barren and uncultivable land, Land put to non -agricultural uses, Cultivable waste, Permanent pastures & other grazing land, Other fallow land, Current fallow land
Land use
Soil type Type of soil
File description Variable name
Rice, Wheat, Sorghum (kharif), Sorghum (rabi), Sorghum (total), Pearl millet, Maize, Finger millet, Barley, Chickpea, Pigeonpea, Minor pulses, Groundnut, Sesamum, Rapeseed and Mustard, Safflower, Castor, Linseed, Sunflower, Soyabean, Sugarcane, Cotton, Fruits, Vegetables, Total fruits and vegetables, Potatoes, Onions, Fodder
Area and production
Fertilizer consumption Nitrogen, Phosphate, Potash, Total (NPK)
Actual monthly rainfall Annual rainfall, January-December actual Rainfall
Total population, Male population, Female population, Total rural population, Male rural population, Female rural population, Total urban population, Male urban population, Female urban population, Total literates, Male literates, Female literates, Total rural literates, Male rural literates, Female rural literates, Total Urban literates, Male urban literates, Female urban literates, Total cultivators, Male cultivators, Female cultivators, Total rural cultivators, Total urban cultivators, Male urban cultivators, Female urban cultivators, Total agricultural labour, Male agricultural labour, Female agricultural labour, Total rural agricultural labour, Male rural agricultural labour, Female rural agricultural labour, Total urban agricultural labour, Male urban agricultural labour, Female urban agricultural labour
Population Census
6
Contd...
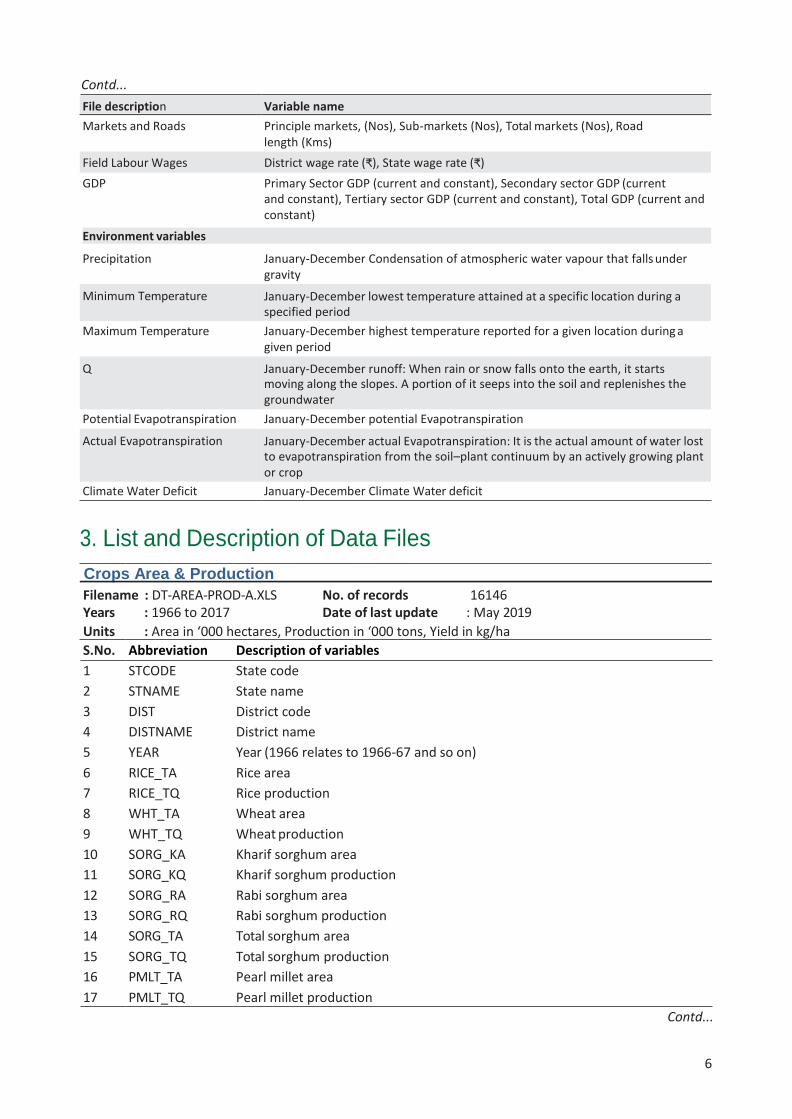
Markets and Roads Principle markets, (Nos), Sub-markets (Nos), Total markets (Nos), Road
length (Kms)
GDP Primary Sector GDP (current and constant), Secondary sector GDP (current and constant), Tertiary sector GDP (current and constant), Total GDP (current and constant)
Environment variables
Precipitation January-December Condensation of atmospheric water vapour that falls under gravity
Maximum Temperature January-December highest temperature reported for a given location during a given period
Potential Evapotranspiration January-December potential Evapotranspiration
Climate Water Deficit January-December Climate Water deficit
3. List and Description of Data Files
Crops Area & Production
Filename : DT-AREA-PROD-A.XLS No. of records 16146 Years : 1966 to 2017 Date of last update : May 2019
Units : Area in ‘000 hectares, Production in ‘000 tons, Yield in kg/ha
S.No. Abbreviation Description of variables
1 STCODE State code
2 STNAME State name
3 DIST District code
4 DISTNAME District name
5 YEAR Year (1966 relates to 1966-67 and so on)
6 RICE_TA Rice area
7 RICE_TQ Rice production
8 WHT_TA Wheat area
9 WHT_TQ Wheat production
10 SORG_KA Kharif sorghum area
11 SORG_KQ Kharif sorghum production
12 SORG_RA Rabi sorghum area
13 SORG_RQ Rabi sorghum production
14 SORG_TA Total sorghum area
15 SORG_TQ Total sorghum production
16 PMLT_TA Pearl millet area
17 PMLT_TQ Pearl millet production
Contd...
File description Variable name
January-December actual Evapotranspiration: It is the actual amount of water lost to evapotranspiration from the soil–plant continuum by an actively growing plant or crop
Actual Evapotranspiration
Field Labour Wages District wage rate (₹), State wage rate (₹)
January-December lowest temperature attained at a specific location during a specified period
Minimum Temperature
January-December runoff: When rain or snow falls onto the earth, it starts moving along the slopes. A portion of it seeps into the soil and replenishes the groundwater
Q

7
Contd...
Crops Area & Production
S.No. Abbreviation Description of variables
18 MAIZ_TA Maize area
19 MAIZ_TQ Maize production
20 FMLT_TA Finger millet area
21 FMLT_TQ Finger millet production
22 BRLY_TA Barley area
23 BRLY_TQ Barley production
24 CPEA_TA Chickpea area
25 CPEA_TQ Chickpea production
28 PPEA_TA Pigeonpea area
29 PPEA_TQ Pigeonpea production
30 MPUL_TA Minor pulses area (includes all pulses other than chickpea and pigeonpea)
31 GNUT_TA Groundnut area
32 GNUT_TQ Groundnut production
33 SESA_TA Sesamum area
34 SESA_TQ Sesamum production
35 RM_TA Rapeseed and mustard area
36 RM_TQ Rapeseed and mustard production
37 SAFF_TA Safflower area
38 SAFF_TQ Safflower production
39 CAST_TA Castor area
40 CAST_TQ Castor production
41 LINS_TA Linseed area
42 LINS_TQ Linseed production
43 SUNF_TA Sunflower area
44 SUNF_TQ Sunflower production
45 SOYA_TA Soyabean area
46 SOYA_TQ Soyabean production
47 SCAN_TA Sugarcane area
48 SGUR_TQ Sugarcane (gur) production
49 COTN_TA Cotton area
50 COTN_TQ Cotton (lint) production
51 FRUT_TA Fruits area
52 VEGT_TA Vegetables area
53 TFV_TA Total fruits and vegetables area
54 POTA_TA Potatoes area
55 ONIO_TA Onions area
56 FOD_TA Fodder area

8
Crop-wise Irrigated Area
Filename : DT-CIA-A.XLS No. of records : 14506 Years : 1966 to 2017 Units : ‘000 hectares
Date of last update : May 2019
S.No. Abbreviation Description of variables
1 STCODE State code
2 STNAME State name
3 DIST District code
4 DISTNAME District name
5 YEAR Year (1966 relates to 1966-67 and so on)
6 RICE_TAI Rice area irrigated
7 WHT_TAI Wheat area irrigated
8 SORG_KAI Kharif sorghum area irrigated
9 SORG_RAI Rabi sorghum area irrigated
10 SORG_TAI Total sorghum area irrigated
11 PMLT_TAI Pearl millet area irrigated
12 MAIZ_TAI Maize area irrigated
13 FMLT_TAI Finger millet area irrigated
14 BRLY_TAI Barley area irrigated
15 CPEA_TAI Chickpea area irrigated
16 PPEA_TAI Pigeonpea area irrigated
17 GNUT_TAI Groundnut area irrigated
18 SESA_TAI Sesamum area irrigated
19 RM_TAI Rapeseed and mustard area irrigated
20 LINS_TAI Linseed area irrigated
21 SCAN_TAI Sugarcane area irrigated
22 COTN_TAI Cotton area irrigated
23 TFV_TAI Total fruits and vegetables area irrigated
24 MPUL_TAI Minor pulses area irrigated (includes all pulses other than chickpea and pigeonpea)
25 PULS_TAI Pulses area irrigated
26 FOD_TAI Fodder area irrigated

9
HYV Area under Cereal Crops1
Filename : DT-HYV-A.XLS No. of records 10628 Years : 1966 to 2011 Date of last update : May 2019 Units : ‘000 hectares
S.No. Abbreviation Description of variables
1 STCODE State code
2 STNAME State name
3 DIST District code
4 DISTNAME District name
5 YEAR Year (1966 relates to 1966-67 and so on)
6 RICE_TAH Rice HYV area
7 WHT_TAH Wheat HYV area
8 SORG_TAH Sorghum HYV area
9 PMLT_TAH Pearl millet HYV area
10 MAIZ_TAH Maize HYV area
11 FMLT_TAH Finger millet HYV area
12 TOTAL_HYV Total HYV area 1 HYV area has not been reported for many states in recent years.
Land Use
Filename : DT-LANDUSE-A.XLS No. of records 15939 Years : 1966 to 2017 Date of last update : May 2019 Units : Area in ‘000 hectares
S.No. Abbreviation Description of variables
1 STCODE State code
2 STNAME State name
3 DIST District code
4 DISTNAME District name
5 YEAR Year (1966 relates to 1966-67 and so on)
6 TOTGEOG Geographical area/Reporting area for land utilization statistics (RLU)
7 FOREST Forest area
8 BARREN Barren and uncultivable land
9 NONAGRI Land put to non-agricultural uses
10 CWASTE Cultivable waste
11 PPASTUR Permanent pastures & other grazing land
12 OTFALOW Other fallow lands
13 CUFALOW Current fallow lands
14 NCA Net cropped area (or Net Sown Area)
15 GCA Gross cropped area (or Total Cropped Area)

10
Source-wise Irrigated Area
Filename : DT-SIA-A.XLS No. of records 15071 Years : 1966 to 2017 Date of last update : May 2019 Units : ‘000 hectares.
S.No. Abbreviation Description of variables
1 STCODE State code
2 STNAME State name
3 DIST District code
4 DISTNAME District name
5 YEAR Year (1966 relates to 1966-67 and so on)
6 CANALS Net irrigated area by canals
7 TANKS Net irrigated area by tanks1
8 TUBEWELL Net irrigated area by tube wells
9 OTHWELL Net irrigated area by other wells2
10 TOTWELL Net irrigated area by total wells
11 OTHSOUR Net irrigated area by other sources
12 NIA Net irrigated area 13 GIA Gross irrigated area 1 Data for Maharashtra combines the area irrigated under canals, tanks and other sources under ‘surface irrigation’. For our purposes, data for surface irrigation are listed under the variable ‘Net irrigated area by tanks’. 2 For Odisha, the variable ‘Net irrigated area by other sources’ is included under the variable ‘Net irrigated area by other wells’.
Farm Harvest Prices (All Crops)
Filename : DT-FHP-A.XLS No. of records 15150 Years : 1966 to 2016 Date of last update : May 2019 Units : ₹/100 Kgs
S.No. Abbreviation Description of variables
1 STCODE State code 2 STNAME State name 3 DIST District code
4 DISTNAME District name 5 YEAR Year (1966 relates to 1966-67 and so on) 6 RICE_TP Rice price
7 PADY_TP Paddy price 8 WHT_TP Wheat price
9 SORG_TP Sorghum price 10 PMLT_TP Pearl millet price
11 MAIZ_TP Maize price 12 FMLT_TP Finger millet price 13 BRLY_TP Barley price
14 CPEA_TP Chickpea price 15 PPEA_TP Pigeonpea price
16 GNUT_TP Groundnut price 17 SESA_TP Sesamum price 18 RM_TP Rapeseed and mustard price 19 CAST_TP Castor price 20 LINS_TP Linseed price 21 SGUR_TP Sugarcane (gur) price

11
Actual Annual & Monthly Rainfall
Filename : DT-Monthly rainfall-A.XLS No. of records 14527 Years : 1966 to 2015 Date of last update : May 2019 Units : Millimeters
S.No. Abbreviation Description of variables
1 STCODE State code
2 STNAME State name
3 DIST District code
4 DISTNAME District name
5 YEAR Year
6 JAN January actual rainfall
7 FEB February actual rainfall
8 MARCH March actual rainfall
9 APRIL April actual rainfall
10 MAY May actual rainfall
11 JUNE June actual rainfall
12 JULY July actual rainfall
13 AUG August actual rainfall
14 SEPT September actual rainfall
15 OCT October actual rainfall
16 NOV November actual rainfall
17 DEC December actual rainfall
18 ANNUAL Annual rainfall (January to December)
Fertilizer Consumption
Filename : DT-FERTILIZER CONSUMPTION -A.XLS No. of records 16047 Years : 1966 to 2017 Date of last update : May 2019 Units : Tons (t)
S.No. Abbreviation Description of variables
1 STCODE State code
2 STNAME State name
3 DIST District code
4 DISTNAME District name
5 YEAR Year (1966 relates to 1966-1967 and so on)
6 N_TC Nitrogen consumption
7 P_TC Phosphate consumption
8 K_TC Potash consumption
9 NPK_TC Nitrogen, Phosphate and Potash consumption (total consumption)
12
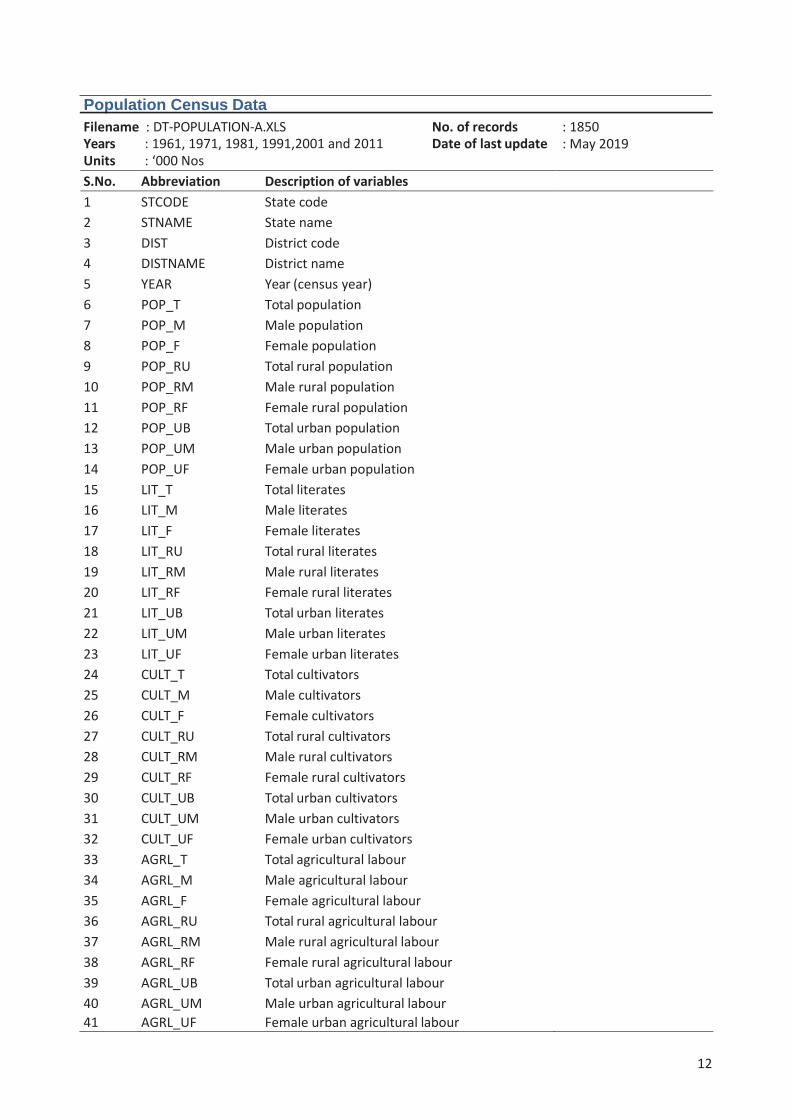
Population Census Data
Filename Years Units
: DT-POPULATION-A.XLS No. of records : 1961, 1971, 1981, 1991,2001 and 2011 Date of last update : ‘000 Nos
: 1850 : May 2019
S.No. Abbreviation Description of variables
1 STCODE State code
2 STNAME State name
3 DIST District code
4 DISTNAME District name
5 YEAR Year (census year)
6 POP_T Total population
7 POP_M Male population
8 POP_F Female population
9 POP_RU Total rural population
10 POP_RM Male rural population
11 POP_RF Female rural population
12 POP_UB Total urban population
13 POP_UM Male urban population
14 POP_UF Female urban population
15 LIT_T Total literates
16 LIT_M Male literates
17 LIT_F Female literates
18 LIT_RU Total rural literates
19 LIT_RM Male rural literates
20 LIT_RF Female rural literates
21 LIT_UB Total urban literates
22 LIT_UM Male urban literates
23 LIT_UF Female urban literates
24 CULT_T Total cultivators
25 CULT_M Male cultivators
26 CULT_F Female cultivators
27 CULT_RU Total rural cultivators
28 CULT_RM Male rural cultivators
29 CULT_RF Female rural cultivators
30 CULT_UB Total urban cultivators
31 CULT_UM Male urban cultivators
32 CULT_UF Female urban cultivators
33 AGRL_T Total agricultural labour
34 AGRL_M Male agricultural labour
35 AGRL_F Female agricultural labour
36 AGRL_RU Total rural agricultural labour
37 AGRL_RM Male rural agricultural labour
38 AGRL_RF Female rural agricultural labour
39 AGRL_UB Total urban agricultural labour
40 AGRL_UM Male urban agricultural labour
41 AGRL_UF Female urban agricultural labour

13
Livestock Census Data
Filename : DT-LIVESTOCK-A.XLS No. of records 3299 Years : Quinquennial census Date of last update : May 2019 Units : ‘000 Nos
S.No. Abbreviation Description of variables
1 STCODE State code
2 STNAME State name
3 DIST District code
4 DISTNAME District name
5 YEAR Year (1966, 1972, 1977, 1982, 1987, 1992, 1997, 2003, 2007, 2012)
6 CATL_T Total male and female cattle (crossbred + indigenous)
7 CATL_AM Adult male cattle (crossbred + indigenous)
8 CATL_AF Adult female cattle (crossbred + indigenous)
9 CATL_YM Young male cattle (crossbred + indigenous)
10 CATL_YF Young female cattle (crossbred + indigenous)
11 CATL_YMF Young male and female cattle (crossbred + indigenous)
12 BUFF_T Total male and female buffaloes
13 BUFF_AM Adult male buffaloes
14 BUFF_AF Adult female buffaloes
15 BUFF_YM Young male buffaloes
16 BUFF_YF Young female buffaloes
17 BUFF_YMF Young male and female buffaloes
18 SHEEP_T Total sheep (adult + young stock)
19 GOAT_T Total goats (adult + young stock)
20 HORSE_T Total horses (adult + young stock)
21 DONKEY_T Total donkeys (adult + young stock)
22 CAMEL_T Total camels (adult + young stock)
23 PIG_T Total pigs (adult + young stock)
24 LIVESTOCK_T Total livestock (excluding dogs)
25 POULTRY_T Total poultry

14
Markets and Roads
Filename : DT-MAKET-ROAD-A.XLS No. of records 14100 Years : 1966 to 2017 Date of last update : May 2019 Units : Markets in Nos and road length in Kilometers (Kms)
S.No. Abbreviation Description of variables
1 STCODE State code
2 STNAME State name
3 DIST District code
4 DISTNAME District name
5 YEAR Year (1970 relates to 1970-71 and so on)
6 PPMRKT Principal markets (nos)
7 PSMRKT Sub-markets (nos)
8 PTMRKT Total markets (nos)
9 LROAD Road length (Kms)
Wage Rate
Filename : DT-WAGE-RATE-A.XLS No. of records : 14707 Years : 1966 to 2017 Units : Rupees (₹/day)
Date of last update : May 2019
S.No. Abbreviation Description of variables
1 STCODE State code
2 STNAME State name
3 DIST District code
4 DISTNAME District name
5 YEAR Year (1966 relates to 1966-67 and so on)
6 MALE_WAGE District male wage rate
7 FEM_WAGE District female wage rate
8 MALE_SAW State male average wage rate
9 FEM_SAW State female average wage rate

15
Operational Holdings (Agricultural Census)
Filename : DT-OPERATIONAL-HOLDINGS-A.XLS No. of records 2578 Years : Census data Date of last update : May 2019 Units : Number in ‘000 and area in ‘000 hectares
S.No. Abbreviation Description of variables
1 STCODE State code
2 STNAME State name
3 DIST District code
4 DISTNAME District name
5 YEAR Year (1970, 1975, 1980, 1985, 1990, 1995, 2000, 2005, 2010)
6 MARG_NO Number - Holdings
7 MARG_AR Area - Marginal (below 1 ha)
8 SMALL_NO Number - Holdings
9 SMALL_AR Area - Small (1 to 2 ha)
10 SEMIM_NO Number - Semi-medium
11 SEMIM_AR Area - Semi-medium (2 to 4 ha)
12 MEDIUM_NO Number - Holdings
13 MEDIUM_AR Area - Medium (4 to 10 ha)
14 LARGE_NO Number - Holdings
15 LARGE_AR Area - Large (above 10 ha)
16 TOTAL_NO Number - Holdings
17 TOTAL_AR Area – Total
Normal Annual & Monthly Rainfall
Filename : DT-NORMAL-RAINFALL-A.XLS No. of records 313 Years : One point in time Date of last update : May 2019 Units : Millimeters
S.No. Abbreviation Description of variables
1 STCODE State code
2 STNAME State name
3 DIST District code
4 DISTNAME District name
5 JAN January normal rainfall
6 FEB February normal rainfall
7 MARCH March normal rainfall
8 APRIL April normal rainfall
9 MAY May normal rainfall
10 JUNE June normal rainfall
11 JULY July normal rainfall
12 AUG August normal rainfall
13 SEPT September normal rainfall
14 OCT October normal rainfall
15 NOV November normal rainfall
16 DEC December normal rainfall
17 ANNUAL Annual normal rainfall

16
Length of Growing Period (LGP)
Filename : DT-LGP-A.XLS No. of records 313 Years : One point in time Date of last update : May 2019 Units : Days
S.No. Abbreviation Description of variables
1 STCODE State code
2 STNAME State name
3 DIST District code
4 DISTNAME District name
5 LGP Length of growing period
S.No. Abbreviation Description of variables
1 STCODE State code
2 STNAME State name
3 DIST District code
4 DISTNAME District name
5 SOILTYPE Type of soil
Gross Domestic Product
Filename : DT-GDP PST PRICES -A.XLS No. of records 2149 Years : 2007-2013 Date of last update : May 2019 Units : Million `
S.No. Abbreviation Description of variables
1 STCODE State code
2 STNAME State name
3 DIST District code
4 DISTNAME District name
5 Primary Sector_Con Primary sector GDP at constant prices
6 Secondary Sector_Con Secondary sector GDP at constant prices
7 Tertiary Sector_Con Tertiary sector GDP at constant prices
8 Tertiary Sector_Cur Tertiary sector GDP at current prices
9 Primary Sector_Cur Primary sector GDP at current prices
10 Secondary Sector_Cur Secondary sector GDP at current prices
11 Tertiary Sector_Cur Tertiary sector GDP at current prices
12 Total GDP_Con Total GDP at constant prices
13 Total GDP_Cur Total GDP at current prices
Soil
Type
Filename : DT-SOIL-TYPE-A.XLS No. of records : 313 Years Units
: One point in time :
Date of last update : May 2019

17
4. Data Clarification and Anomalies
Area and production
◆ ‘Paddy’ production figures refer to ‘rice’ production for all districts. For ‘West Bengal’ and ‘Karnataka’, production was reported for ‘paddy’ only in some years. These were converted into ‘rice’ by using 0.66 as the conversion factor.
◆ ‘Cotton’ production is reported in terms of ‘lint’. In the data sources, production is reported in bales of 170 kg each. These were converted into ‘000 tons for all districts.
◆ The production figure for ‘sugarcane’ refers to ‘raw sugar’ (gur). Sugarcane production was converted into raw sugar by taking 10% of cane production.
◆ ‘Minor pulses’ include all pulses other than chickpea and pigeonpea, e.g., green gram, black gram, horse gram, lentil, cowpea, moth bean, etc.
◆ Production data was not available for ‘total fruits’, ‘vegetables’, ‘potato’ and ‘onion’.
◆ For Jharkhand, paddy APY data is from state sources.
◆ For Odisha state, crop APY data is from the Directorate of Agriculture and Food Production.
◆ APY data is not available separately for coconut in the database.
◆ In some cases, ‘crop production’ may be reported while ‘crop area’ is listed as ‘0’, i.e., less than 500 ha. This generally occurs for crops of minor importance in specific states/districts.
◆ For ‘sorghum’, crop area and production under summer crop are included in the rabi season.
◆ For season-wise paddy, area and production, early kharif are shown under kharif, late kharif under rabi while rabi paddy is shown under summer (in states where early and late sowing are practiced).
Farm harvest prices
◆ Both ‘rice’ and ‘paddy’ prices were included depending on the availability of data from the source. These prices are mainly for coarse paddy/rice.
◆ ‘Cotton’ prices are for ‘kapas’ i.e., raw cotton. In some states, cotton prices are reported for several cotton varieties. The price of the most dominant variety is reported. For Punjab and Haryana, we have used an average of American and Desi cotton.
◆ ‘Sugarcane’ prices were reported for ‘raw sugar’ (gur) prices.
◆ ‘Season-wise’ farm harvest prices are not available in this dataset.
◆ ‘Cotton prices’ for Maharashtra state were not available from 1973 onwards due to monopoly procurement by the government.
◆ For ‘Odisha’, farm harvest prices were not reported/released from 1988 onwards.
◆ Farm harvest prices were not reported for several districts where the crop is of minor importance or relatively less important. In such cases, the missing data are shown as ‘-1.’
Crop-wise irrigation
◆ For some crops, crop-wise irrigated area exceeds the actual area under the crop. This can occur when data comes from different sources. No adjustments were made to correct this inconsistency in our dataset.

19
◆ For ‘Odisha’, data on this variable were available from 1972 onwards.
◆ For ‘West Bengal’, data on this variable were not available.
◆ For Maharashtra data on crop wise irrigation is not available after 2002
Source-wise irrigation
◆ Data on the variable ‘dug wells’ was included in the variable ‘other wells’.
◆ For ‘Odisha’, source-wise irrigated area values were only available 1970 onwards. Source-wise net irrigated area values were not available from 1977 to 1981 and from 1984 to 1987; instead source- wise gross irrigated areas are reported. The variable ‘other sources’ of irrigation is included under the variable ‘other wells’.
◆ From 1975 onwards, data for Maharashtra combines area irrigated under canals, tanks and other sources under ‘surface irrigation’. For our purposes, data for surface irrigation are listed under the variable ‘tanks’.
◆ For ‘West Bengal’, data on source-wise irrigation was not available.
◆ Data on canals was available only for some years.
◆ Data was not available for Maharashtra from 2002 onwards.
◆ Source-wise irrigation data was available for Gujarat for select years only since 2007.
◆ From 2000 onwards, for Karnataka, ‘lift irrigation’ data was included in the ‘other sources’ variable.
Area under HYV cereals
◆ For ‘finger millet’, area under HYVs was available only from 1990 onwards.
◆ ‘HYV area’ for a selected cereal crop exceeds actual area under that crop for some districts in some states. This may occur when data comes from different sources. In such cases, no adjustments have been made in the data.
◆ For ‘West Bengal’, area under HYVs was not available from 1988 onwards.
◆ Since 2010, many states have not reported area under HYVs as they have reached saturation point.
Gross and net irrigated area
◆ For ‘West Bengal’, data on net and gross irrigated areas were not available from 1985 onwards.
◆ For Maharashtra data not available from 2002 onwards
Land use
◆ Area under ‘miscellaneous tree crops and groves’ was not included in the dataset.
◆ ‘Geographical area’ is reported instead of ‘RLU’ (Reporting area for land use statistics) for some states/ districts for some years. Reporting area stands for the area for which data on land use classification are available i.e., the sum of areas under different land use classifications generally equals the RLU.
◆ In some states like MP and Chhattisgarh in a few districts geographical area increases and decreases based on changes in forest area
◆ For ‘Odisha’, land use data values were available only from 1972 onwards.
Fodder area
◆ For ‘Bihar, West Bengal, Assam, Himachal Pradesh and Kerala’, data for fodder area is available from 1970 onwards.
Livestock
◆ Adult ‘cattle’ and ‘buffaloes’ are the sum of crossbred and indigenous breeds. For crossbred cattle, an ‘adult’ is over 2½ years old and for indigenous breeds, it is over 3 years. In many states, the time of collection of livestock census data does not match. Hence the years reported vary from state to state, particularly in later years.

20
Roads and markets
◆ Data gaps need to be filled by interpolation, wherever required.
◆ Markets total includes main and sub-markets. However, the data for sub-markets can be eratic as some of them may not be functioning in some or many years.
◆ Road length increases consistently in all states over time. However, there may be decrease or big increase in road length in some years when rural roads are excluded or included from the total road length in some years varying across states.
Length of Growing Period (LGP)
◆ The growing period is the period when the moisture in the soil is adequate to support plant growth. LGP was calculated following the FAO model (Higgins and Kassam 1981). The growing period, as per the model, starts when precipitation (P) exceeds 0.5 potential evapotranspiration (PE) and ends with the utilization of an assumed quantum of available stored soil moisture assumed as 100 mm except for Vertisols (250 mm) after P falls below PE. The period (in days) calculated for each observation site was plotted and isolines drawn at specified intervals. Observed rainfall data for over 200 locations was taken as a base for the whole of India. Data for missing districts was estimated from the nearest districts located in a similar agro-ecological region. PE data are estimated (by the modified Penman’s method); these are published by IMD. In some cases, PE estimated by Hargreaves method has been included.
5. Available and Missing Data Missing data are provided from 1966 to 2017. Data could be missing because: (a) Data was not published /not available or (b) crop activity was unimportant in the state or a few districts in the state; hence data was not recorded for area, production, crop-wise irrigation, and FHP for such crops.
Missing data can be grouped into 3 categories:
◆ Complete year missing for all variables in a file (i.e., variable group) for selected states. For example, several years’ data for crop-wise irrigated area, source-wise irrigated area, and land use are missing for West Bengal.
◆ Data missing for a few districts for some variables in a file. Such cases are few and restricted to a few variables in a file.
◆ Data missing for a specific crop/variable in a file for selected states. (For example, potato and onion area data are not reported for some states in the sources available with us).
Missing data are shown as ‘-1’ in the data files.
State-wise and year-wise missing data for core variable groups in a file are shown in the enclosed tables.

21
Available data and missing data for Andhra Pradesh from 1966 to 2017.
Variables Years data is available Years data is missing
Area and production (crops) 1966 to 2017 -
Land use 1966 to 2017 -
Crop-wise irrigated area 1966 to 2017 -
Source-wise irrigated area 1966 to 2017 -
HYV area 1966 to 1994, 1998, 2000, 2002 to 2007
1995 to 1997, 1999, 2001, 2008 to 2015
Farm harvest prices - crops 1966 to 2016 -
Fertilizer consumption 1966 to 2017 -
Rainfall - Annual & monthly 1966 to 2015 -
Markets (main and sub-markets) 1970 to 1994, 2010, 2014 to 2017
1966 to 1969, 1995 to 2009, 2011 to 2013
Roads (total road length) 1966 to 2017
Livestock census 1966, 1972, 1977, 1983, 1987, - 1992, 1999, 2003, 2007,
2012,2019
Operational holdings 1970, 1976, 1980, 1986, 1990, - 1995, 2000, 2005, 2010
Population census 1971, 1981, 1991, 2001, 2011 -
Agricultural wages (men & women) 1966 to 2017 -
Available data and missing data for Bihar from 1966 to 2011.
Variables Years data is available Years data is missing
Area and production (crops) 1966 to 2017
Land use 1966 to 2017 -
Crop-wise irrigated area 1966 to 1996, 1998 to 2017 1997
Source-wise irrigated area 1966 to 2017 -
HYV area 1966 to 1990, 2000 to 2003, 2005 to 2008
1991 to 1999, 2004, 2009 to 2011
Farm harvest prices - crops 1966 to 2016 -
Fertilizer consumption 1966 to 1988, 1992 to 2015 1989 to 1991
Rainfall - Annual & monthly 1966 to 2009, 2012 to 2015 2010, 2011
Markets (main and sub-markets) 1970 to 2000 1966 to 1969, 2001 to 2017
Roads (total road length) 1970 to 1994, 2000, 2014 to 2016
1966 to 1969, 1995 to1999, 2001 to 2013
Livestock census 1966, 1972, 1977, 1982, 2003, 1987, 1993, 1997 2007, 2012,2019
Operational holdings 1970, 1976, 1980, 1995, 2010 1966, 1985, 1990, 2000, 2005
Population census 1971, 1981, 1991, 2001, 2011 -
Agricultural wages (men & women) 1961 to 1971, 1973, 1974, 1978 to 2017
1972, 1975 to 1977

21
Available data and missing data for Gujarat from 1966 to 2017.
Variables Years data is available Years data is missing
Area and production (crops) 1966 to 2017 -
Land use 1966 to 2011, 2014 to 2017 2012 to 2013
Crop-wise irrigated area 1966 to 2011, 2014 to 2017 2012 to 2013
Source-wise irrigated area 1966 to 2007, 2008, 2009, 2014 2010 to 2013, 2015
HYV area 1966 to 1994, 1999, 2000 1995 to 1998, 2001 to 2015
Farm harvest prices - crops 1966 to 2016 -
Fertilizer consumption 1966 to 2017 -
Rainfall - Annual & monthly 1966 to 2009, 2011 to 2015 2010
Markets (main and sub-markets) 1966 to 2011, 2014 to 2016 1966 to 1970, 2012 to 2013
Roads (total road length) 1966 to 2011,2014 2012,2013,2015,2016,2017
Livestock census 1966, 1972, 1977, 1982, 1988, - 1992, 1997, 2003, 2007,
2012,2019
Operational holdings 1970, 1976, 1980, 1986, 1990, 1966 1995, 2000, 2005, 2010
Population census 1971, 1981, 1991, 2001, 2011 -
Agricultural wages (men & women) 1966 to 2017
Available data and missing data for Haryana from 1966 to 2017.
Variables Years data is available Years data is missing
Area and production (crops) 1966 to 2017 -
Land use 1966 to 2017 -
Crop-wise irrigated area 1966 to 2017 -
Source-wise irrigated area 1966 to 2017 -
HYV area 1966 to 2011 2012 to 2015
Farm harvest prices - crops 1966 to 2016
Fertilizer consumption 1966 to 2017 -
Rainfall - Annual & monthly 1966 to 2015 -
Markets (main and sub-markets) 1970 to 2017 1966 to 1969
Roads (total road length) 1967 to 2011, 2014 to 2016 2012 to 2013
Livestock census 1966, 1972, 1977, 1982, 1988, 1992, - 1997, 2003, 2007, 2012
Operational holdings 1970, 1976, 1980, 1986, 1990, 1995, 1966 2000, 2005, 2010
Population census 1971, 1981, 1991, 2001, 2011 -
Agricultural wages (men & women) 1966 to 2017

22
Available data and missing data for Karnataka from 1966 to 2017.
Variables Years data is available Years data is missing
Area and production (crops) 1966 to 2017 -
Land use 1966 to 2017 -
Crop-wise irrigated area 1966 to 2017 -
Source-wise irrigated area 1966 to 2017 -
HYV area 1966 to 2009 2010 to 2015
Farm harvest prices - crops 1966 to 2016 -
Fertilizer consumption 1966 to 2017 -
Rainfall - Annual & monthly 1966 to 2015 -
Markets (main and sub-markets) 1966 to 2011 2012 to 2015
Roads (total road length) 1966, 1968 to 2017 1967
Livestock census 1966, 1972, 1977, 1983, 1987, 1992, - 1997, 2003, 2007, 2012,2019
Operational holdings 1970, 1976, 1980, 1985, 1990, 1995, 1966 2000, 2005, 2010
Population census 1971, 1981, 1991, 2001, 2011 -
Agricultural wages (men & women) 1966 to 2001, 2003 to 2017 2002
Available data and missing data for Madhya Pradesh from 1966 to 2017.
Variables Years data is available Years data is missing
Area and production (crops) 1966 to 2017 -
Land use 1966 to 2017 -
Crop-wise irrigated area 1966 to 2017 -
Source-wise irrigated area 1966 to 2017 -
HYV area 1966 to 1994, 1998, 1999 1995 to 1997, 2000 to 2015
Farm harvest prices - crops 1966 to 2016 -
Fertilizer consumption 1966 to 2017 -
Rainfall - Annual & monthly 1966 to 2015 2010, 2011
Markets (main and sub-markets) 1970 to 2011, 2015 1966 to 1969, 2012 to 2014,2016,2017
Roads (total road length) 1970 to 1995, 1998 to 2001 1966 to 1969, 1996, 1997, 2002 to 2017
Livestock census 1966, 1972, 1977, 1982, 1987,1992,1997,2003,2007,
2012,2019
-
Agri. implements and machinery 1972, 1977, 1982, 1987, 1992, 1966 1997, 2003, 2007
Operational holdings 1970, 1976, 1980, 1985, 1990, 1966 1995, 2000, 2005, 2010
Population census 1971, 1981, 1991, 2001, 2011 -
Agricultural wages (men & women) 1966 to 1996, 1998 to 2001, 2003 to 2017
1997, 2002

23
Available data and missing data for Maharashtra from 1966 to 2017.
Variables Years data is available Years data is missing
Area and production (crops) 1966 to 2017 -
Land use 1966 to 2017 -
Crop-wise irrigated area 1966 to 2008 2009 to 2017
Source-wise irrigated area 1966 to 2002 2003 to 2015
HYV area 1966 to 2015 2009 to 2011
Farm harvest prices - crops 1966 to 2016 -
Fertilizer consumption 1966 to 2017 -
Rainfall - Annual & monthly 1966 to 2015 -
Markets (main and sub-markets) 1966 to 2000, 2004 to 2007 2001 to 2003, 2008 to 2017
Roads (total road length) 1967 to 2014 1966, 2015 to 2017
Livestock census 1966, 1972, 1978, 1982, 1987, - 1992, 1997, 2003, 2007,
2012,2019
Operational holdings 1970, 1976, 1980, 1985, 1990, 1966, 2005 1995, 2000, 2010
Population census 1971, 1981, 1991, 2001, 2011 -
Agricultural wages (men & women) 1966 to 2007 2008 to 2017
Available data and missing data for Odisha from 1966 to 2017.
Variables Years data is available Years data is missing
Area and production (crops) 1966 to 2017 -
Land use 1972 to 2017 1968 to 1970
Crop-wise irrigated area 1972 to 1980, 1984 to 2017 1966 to 1971, 1981 to 1983
Source-wise irrigated area 1970 to 1972, 1974 to 2017 1966 to 1969, 1973
HYV area 1966 to 2011 2012-2015
Farm harvest prices - crops 1966 to 2016 -
Fertilizer consumption 1966 to 2017 -
Rainfall - Annual & monthly 1966 to 2015 -
Markets (main and sub-markets) 1970 to 1994, 2006, 2007 1966 to 1969, 1995 to 2005, 2008 to 2015
Roads (total road length) 1970 to 1994, 1996, 1997, 1999 to 2003, 2005 to 2011, 2013 to 2015
1966 to 1969, 1995, 1998, 2004, 2012 to 2016
Livestock census 1966, 1972, 1977, 1982, 1987, - 1992, 2000, 2003, 2007,
2012,2019
Operational holdings 1970, 1976,1980, 1985, 1990, 1966 1995, 2000, 2005, 2010
Population census 1971, 1981, 1991, 2001, 2011 -
Agricultural wages (men & women) 1966, 1967, 1969 to 1973, 1979 to 1981, 1983 to 2017
1968, 1974 to 1978, 1982, 2011

24
Available data and missing data for Punjab from 1966 to 2017.
Variables Years data is available Years data is missing
Area and production (crops) 1966 to 2017 -
Land use 1966 to 2017 -
Crop-wise irrigated area 1966 to 2017 -
Source-wise irrigated area 1966 to 2015 -
HYV area 1997 to 2011 1966
Farm harvest prices - crops 1966 to 2016 -
Fertilizer consumption 1966 to 2017 -
Rainfall - Annual & monthly 1966 to 2015 -
Markets (main and sub-markets) 1966 to 2011,2013 to 2016 2012
Roads (total road length) 1966 to 2008, 2010, 2011 to 2013,
2014 to 2016
2012
Livestock census 1993, 1997, 2003, 2007, 2012,2019
Operational holdings 1970, 1980, 1985, 1990, 1995, 2000, 1966, 1975 2005, 2010
Population census 1971, 1981, 1991, 2001, 2011 -
Agricultural wages (men & women) 1966 to 1998, 2000 to 2017 1999
Available data and missing data for Rajasthan from 1966 to 2017.
Variables Years data is available Years data is missing
Area and production (crops) 1966 to 2017 -
Land use 1966 to 2017 -
Crop-wise irrigated area 1966 to 2017 -
Source-wise irrigated area 1966 to 2017 -
HYV area 1966 to 2011 2012 to 2015
Farm harvest prices - crops 1966 to 2016 -
Fertilizer consumption 1966 to 2017 -
Rainfall - Annual & monthly 1966 to 2015 -
Markets (main and sub-markets) 1970 to 1994, 2009 to 2011 1966 to 1969, 1995 to 2008, 2012 to 2017
Roads (total road length) 1966 to 2013 2014 to 2017
Livestock census 1966, 1972, 1977, 1983, 1988, - 1992, 1997, 2003, 2007,
2012,2019
Operational holdings 1970, 1976, 1980, 1985, 1990, 1966 1995, 2000, 2005, 2010
Population census 1971, 1981, 1991, 2001, 2011 -
Agricultural wages (men & women) 1966 to 2001, 2003 to 2017 2002

25
Available data and missing data for Tamil Nadu from 1966 to 2017.
Variables Years data is available Years data is missing
Area and production (crops) 1966 to 2017 -
Land use 1966 to 2016 2017
Crop-wise irrigated area 1966 to 2016 2017
Source-wise irrigated area 1966 to 2016 -
HYV area 1966 to 2010 2011, 2012 to 2015
Farm harvest prices - crops 1966 to 2016 -
Fertilizer consumption 1966 to 2017 -
Rainfall - Annual & monthly 1966 to 2015 -
Markets (main and sub-markets) 1970 to 2010, 2013 1966 to 1969, 2011 to 2012, 2014 to 2017
Roads (total road length) 1970 to 2010, 2012 to 2014,2017 1966 to 1969, 2011,2015
Livestock census 1966, 1972, 1977, 1982, 1987, 1992,
1997,2003,2007,2012,2019
-
Operational holdings 1970, 1976, 1979, 1985, 1990, 1995, 1966 2000, 2005, 2010
Population census 1971, 1981, 1991, 2001, 2011 -
Agricultural wages (men & women) 1966 to 2017
Available data and missing data for Uttar Pradesh from 1966 to 2017.
Variables Years data is available Years data is missing
Area and production (crops) 1966 to 2017 -
Land use 1966 to 2016 2017
Crop-wise irrigated area 1966 to 2016 2017
Source-wise irrigated area 1966 to 1970, 1972, 1974 to 2017 1971, 1973, 2015
HYV area 1966 to 1989 -
Farm harvest prices - crops 1966 to 2016 -
Fertilizer consumption 1966 to 2017 -
Rainfall - Annual & monthly 1966 to 1995, 1997 to 1999, 2002, 2004 to 2015
1996, 2000, 2001, 2003
Markets (main and sub-markets) 1970 to 1994, 1998, 2001 to 2014,
2016,2017
1966 to 1969, 1995 to 1997, 1999, 2000, 2015
Roads (total road length) 1970 to 1995, 1999 to 2001, 2003 to 2014,2016,2017
1966 to 1969, 1996 to 1998,2015
Livestock census 1966, 1972, 1978, 1982, 1988, - 1993, 1997, 2003, 2007,
2012,2019
Operational holdings 1976, 1980, 1985, 1990, 1995, 1966, 1970 2000, 2005, 2010
Population census 1971, 1981, 1991, 2001, 2011 -
Agricultural wages (men & women) 1966 to 2001, 2003 to 2017 2002

26
Available data and missing data for West Bengal from 1966 to 2017.
Variables Years data is available Years data is missing
Area and production (crops) 1966 to 2017 -
Land use 1966 to 1988, 1994 to 2017 1989 to 1993
Crop-wise irrigated area 1966 to 1969, 1983, 1985, 1988 1970 to 1982, 1984, 1986, 1987, 1989 to 2017
Source-wise irrigated area 1966 to 2013 2014 to 2017
HYV area 1966 to 1987 1988 to 2015
Farm harvest prices - crops 1966 to 2016 -
Fertilizer consumption 1966 to 2017 -
Rainfall - Annual, June, July + August 1966 to 2015 -
Markets (main and sub-markets) 1972 to 1989 1966 to 1971, 1974, 1996 to 1998, 2000, 2004, 2011 to 2017
Roads (total road length) 1972 to 1989 1966 to 1969, 1990 to 2017
Livestock census 1966, 1972, 1977, 1982, 1987, - 1992, 1997, 2003, 2007,
2012,2019
Operational holdings 1970, 1976, 1990, 1995, 2001,2005,2010
1966, 1985
Population census 1971, 1981, 1991, 2001, 2011 -
Agricultural wages (men & women) 1966 to 1974, 1981 to 2009, 2016 to 2017
1975 to 1979, 1980
Available data and missing data for Chhattisgarh from 2000 to 2017. (This state was formed in 2000.)
Variables Years data is available Years data is missing
Area and production (crops) 2000 to 2017 2011
Land use 2000 to 2016 2017
Crop-wise irrigated area 2000 to 2016 2017
Source-wise irrigated area 2000 to 2016 -
HYV area 2005 to 2009 2000 to 2004, 2010 to 2015
Farm harvest prices - crops 2000 to 2016 -
Fertilizer consumption 2000 to 2017 -
Rainfall - Annual & monthly 2000, 2002, 2004, 2011 to 2015 2001, 2003
Markets (main and sub-markets) - Not available
Roads (total road length) - Not available
Livestock census 2003, 2007, 2012,2019 -
Operational holdings 2001, 2005, 2010 -
Population census 2001, 2011 -
Agricultural wages (men & women) 2005 to 2017 2000 to 2004

27
Available data and missing data for Jharkhand from 2000 to 2017. (This state was formed in 2000.)
Variables Years data is available Years data is missing
Area and production (crops) 2000 to 2017
Land use 2001 to 2016 2000
Crop-wise irrigated area 2001 to 2016 2000
Source-wise irrigated area 2001 to 2016 2000
NCA, GCA, NIA, GIA 2001 to 2011 2000
Fodder area - Not available
Fodder irrigated area - Not available
HYV area - Not available
Farm harvest prices - crops 2005 to 2016 2000 to 2004
Fertilizer consumption 2003 to 2017 2000 to 2002
Rainfall - Annual & monthly 2000 to 2015 -
Markets (main and sub-markets) - Not available
Roads (total road length) - Not available
Livestock census 2003, 2007, 2012,2019 -
Operational holdings - Not available
Population census 2001, 2011 -
Agricultural wages (men & women) 2006 to 2015,2017 2000 to 2005,2016
Available data and missing data for Uttarakhand from 2000 to 2017. (This state was formed in 2000.)
Variables Years data is available Years data is missing
Area and production (crops) 2000 to 2017 -
Land use 2000 to 2017 -
Crop-wise irrigated area 2000 to 2017 -
Source-wise irrigated area 2000 to 2017 -
NCA, GCA, NIA, GIA 2000 to 2011 -
Fodder area 2000 to 2011 -
Fodder irrigated area 2000 to 2011 -
HYV area - Not available
Farm harvest prices - crops 2010, 2015 2000 to 2009
Fertilizer consumption 2000 to 2017 -
Rainfall - Annual & monthly 2005 to 2015 2000 to 2004
Markets (main and sub-markets) - Not available
Roads (total road length) 2015 Not available
Livestock census 2003, 2007, 2012,2019 2000 to 2014
Operational holdings 2000, 2005, 2010 -
Population census 2001, 2011 -
Agricultural wages (men & women) 2006 to 2017 2000 to 2005

28
Available data and missing data for Assam from 1966 to 2017. Variables Years data is available Years data is missing Area and production (crops) 1966 to 2017 -
Land use 1966 to 1981, 1992 to 2017 1982 to 1991
Crop-wise irrigated area 2006 to 2017 1966 to 2005
Source-wise irrigated area 2002 to 2017 1966 to 2001
HYV area 1977, 1985, 1987, 1991 to 1998, 2000 to 2009
1966 to 1976, 1978 to 1984, 1986, 1988 to 1990, 1999, 2010, 2011 to 2015
Farm harvest prices - crops 1966 to 2016 -
Fertilizer consumption 1968 to 1971, 1973 to 2017 1966, 1967, 1972
Rainfall - Annual, June, July + August 1966 to 2001, 2003 to 2015 2002
Markets (main and sub-markets) 2009 to 2010, 2012 to 2016 1966 to 20008,2009,2011
Roads (total road length) 1972, 1976, 1979, 1982, 1985, 1966 to 1971, 1973 to 1975, 1977, 1987, 1989, 1990, 1991, 1993, 1978, 1980, 1981, 1983, 1984, 1995, 1996, 2004, 2005, 2010,
2013 to 2016 1986, 1988, 1992, 1994, 1997 to 2003, 2006 to 2009, 2011 to 2012
Livestock census 1966, 1972, 1977, 1982, 1987, - 1992, 1997, 2003, 2007,
2012,2019
Operational holdings 1970, 1974, 2000, 2005, 2010 1980, 1985, 1990, 1995
Population census 1971, 1991, 2001, 2011 1981
Agricultural wages (men & women) 1968 to 1971, 1973, 1974, 1978 to 2017
1966, 1967, 1972, 1975 to 1977
Available data and missing data in Himachal Pradesh from 1966 to 2017.
Variables Years data is available Years data is missing
Area and production (crops) 1966 to 2017 -
Land use 1966 to 2016 2017
Crop-wise irrigated area 1966 to 2016 2017
Source-wise irrigated area 1966 to 2011,2012 to 2014,
2016,2017
1994, 2015
HYV area 1979, 1981, 1987 to 1989, 1993, 1996, 1997, 2002, 2003
1966 to 1978, 1980, 1990 to 1992, 1994, 1995, 1998 to 2001, 2004, 2005, 2007, 2012 top 2015
Farm harvest prices - crops 1993 to 1995, 1998 to 2016 1990 to 1992, 1996, 1997
Fertilizer consumption 1968, 1969, 1970, 1973 to 1976, 1978 to 1982, 1984 to 2017
1966, 1967, 1971, 1972, 1977, 1983
Rainfall - Annual & monthly 1966 to 2015 -
Markets (main and sub-markets) 1991 to 2001 1966 to 1990, 2002 to 2015
Roads (total road length) 1990 to 1998, 2000 to 2011,2014 to 2017
1966 to 1975, 1999, 2012 to 2012
Livestock census 1992, 1997, 2003, 2007, 2011,2019
2012 to 2015
Operational holdings 1970,1980,1985,1990,1995,2000,2005,2010
1975
Population census 1991, 2001, 2011 -
Agricultural wages (men & women)
1966 to 1971, 1973, 1974, 1979 to 2017
1972, 1975

29
Variables Years data is available Years data is missing
Area and production (crops) 1966 to 2017 -
Land use 1966 to 2017 -
Crop-wise irrigated area 1966 to 2017 -
Source-wise irrigated area 1966 to 2014 2015
HYV area 1966 to 2011 2012 to 2015
Farm harvest prices - crops 1970, 1975, 1980 to 2016 1966 to 1969, 1971 to 1974, 1976 to 1979
Fertilizer consumption 1968 to 1971, 1973 to 2017 1966, 1967, 1972
Rainfall - Annual & Monthly 1966 to 2015 -
Markets (main and sub-markets) 2007 1990 to 2006, 2008 to 2015
Roads (total road length) 1991 to 2010 2011 to 2017
Livestock census 2003, 2007, 2012,2019 -
Operational holdings 1970,1975,1980,1985,1990, 1995, 2000, 2005, 2010
Population census 1991, 2001, 2011 -
Agricultural wages (men & women) 1968 to 1981, 1983 to 2001, 2003 to 2009,2012 to 2017
1966, 1967, 1982, 2002,2010
6. Data Sources Data was downloaded from online sources wherever available and soft and published hard copies were collected from respective state departments. Soft copies and published hard copies that include season and crop reports, statistical abstract, statistical handbook, agricultural statistics, district handbooks, integrated sample survey reports (livestock and products), infrastructure statistics, farm harvest price for principal crops of India, agricultural wages in India, fertilizer statistics, etc. were used for the update of the database. District-level environmental data was generated from pixel-level data from Terra Climate database.
Available data and missing data for Kerala from 1966 to 2017.

30
Data Source
HYV area (cereals) State DES; State (DOA)
Source-wise irrigation DES, Delhi; State DES; State DOA
Rainfall (monthly, normal) State DES; Indian Meteorological Department
Length of Growing Period (LGP) ICRISAT
Soil type ICRISAT
Wages DES, Delhi
Population Census data Registrar General of India
Agricultural implements State Dept of Animal Husbandry; State DES
Milk, meat, egg production State Dept of Animal Husbandry and Dairying
Banks and post offices State DES
Health State DES
Data Sources for key variables groups
Crop-wise irrigation DES, Delhi; State DES; State DOA
Farm harvest price DES, Delhi
Operational holdings Agricultural Census data
Veterinary institutions State Dept of Animal Husbandry and Dairying
Area, Production and Yield (APY) Directorate of Economics and Statistics (DES, Delhi); State DES; State Directorate of Agriculture (DOA)
Land use DES, Delhi; State DES; State DOA
Fertilizer consumption Fertilizer Association of India, Delhi
Livestock State Dept of Animal Husbandry and Dairying
State Directorate of Agriculture Marketing; Public Works Department (PWD); State DES
Markets and roads
Sector-wise GDP State DES; CMIE database
State Name Code Year of Formation
Name Code Percentage
Andhra Pradesh Prakasam 504 1974-75 Guntur 49 46
Prakasam 504 1974-75 Nellore 50 38
Prakasam 504 1974-75 Kurnool 51 16
Rangareddy 520 1978-79 Hyderabad 55 100
Vizianagaram 503 1979-80 Srikakulam 44 50
Vizianagaram 503 1979-80 Visakhapatnam 45 50
Assam Barapet 615 1981 Kamrup 605 100
Dhubri 616 1981 Goalpara 604 100
Golaghat 617 1981 Sibsagar 610 100
Jorhat 618 1981 Sibsagar 610 100
Karimganj 619 1981 Cachar 601 100
Kokrajhar 620 1981 Goalpara 604 100
Nalbari 621 1981 Kamrup 605 100
Sonitpur 622 1981 Darrang 602 100
Bongaigaon 1047 1989 Goalpara 604 40
Bongaigaon 1047 1989 Kokrajhar 620 60
Dhemaji 1048 1989 Lakhimpur 607 100
Hailakandi 1049 1989 Cachar 601 100
Marigaon 1050 1989 Nagaon 609 100
Tinsukia 1051 1989 Dibrugarh 603 100

31
Appendices
Appendix 1. Methodology and rationale for adjusting district boundaries (1966 base)
The geographical area of a particular district is typically not constant over time, i.e., districts tend to gain and lose area over time for a variety of reasons, most of them political. During the period covered by the dataset, there were numerous adjustments in the boundaries of some of the districts. These changes have occurred, for example, upon the division of the former Punjab into Punjab, Haryana and Himachal Pradesh; in the division of certain districts into two or more smaller districts in many places; or in the transfer of parts of one district to another. As far as possible, the dataset preserves the original district
boundaries: Where districts have been broken up, values for the resultant districts in later years have been summed to yield values appropriate to a “shadow” consolidated district. This is necessary for maintaining consistency in data over the years. In order to take into account these changes, we had to choose a particular (agricultural) reference year, i.e., stick to the size of the district in that particular year and adjust the data for all the other years accordingly.
Since 1966, 258 new districts have been formed, and the data for all the variables for these districts have been given back to their parent district and removed from the dataset. The criterion used for determining the apportioning percentage was based on the geographical area of the parent district transferred to the new district. All variables in the dataset [except rainfall, farm harvest prices (FHP) and wages]1 were apportioned using this proportion.
Of the 277 new districts, about 243 were formed from a single parent district; hence the apportioning percentage was 100, with no room for error. For example, Rajnandgaon district was created fully from Durg district on 1 May 1973. Hence data for Rajnandgaon was added to that of Durg starting 1972/73. For the remaining districts, the new districts were formed from 2 parent districts and only in the case of 4 districts from 3 parent districts. Ideally in such cases, taluka-wise data would be more appropriate in recreating the parent district. However, in the absence of such data, the parent districts were created using earlier criteria i.e., geographical area of the parent district transferred to the new district. For example, Vizianagaram district was created from Srikakulam (50%) and Visakhapatnam (50%) districts on 18 May 1979. Hence all the data for Vizianagaram were added to Srikakulam and Visakhapatnam in a fifty-fifty proportion from 1979/80 onwards. The state of Punjab was reorganized on 1 November 1966 as per the Punjab Reorganization
Act. A new state Haryana was created. Haryana initially consisted of 7 districts; we stick to these 7 districts by apportioning the data of the new districts formed after 1966 to their parent district. Similarly, the reorganized Punjab state had 11 districts to which we stick.
For a detailed list of new districts formed after 1966 and their parent districts, see Appendix 3.
1 In the case of rainfall, farm harvest prices and wages, the data of newly formed districts were not apportioned to the parent district. Instead, data of the truncated parent district were retained.

32
Appendix 2. Districts (1966 base).
State name District name India code District code
Andhra Pradesh Srikakulam 3219 44
Andhra Pradesh Visakhapatnam 3220 45
Andhra Pradesh East Godavari 3205 46
Andhra Pradesh West Godavari 3223 47
Andhra Pradesh Krishna 3210 48
Andhra Pradesh Guntur 3206 49
Andhra Pradesh Sri Potti Sriramulu Nellore 3215 50
Andhra Pradesh Kurnool 3211 51
Andhra Pradesh Anantapur 3202 52
Andhra Pradesh YSR 3204 53
Andhra Pradesh Chittoor 3203 54
Telangana Hyderabad 3207 55
Telangana Nizamabad 3216 56
Telangana Medak 3213 57
Telangana Mahbubnagar 3212 58
Telangana Nalgonda 3214 59
Telangana Warangal 3222 60
Telangana Khammam 3209 61
Telangana Karimnagar 3208 62
Telangana Adilabad 3201 63
Telangana Rangareddy 520
Assam Cachar 3315 601
Assam Darrang 3304 602
Assam Dibrugarh 3303 603
Assam Goalpara 3305 604
Assam Kamrup 3306 605
Assam Karbi Anglong 3308 606
Assam Lakhimpur 3312 607
Assam Dima Hasao/NC Hills 3311 608
Assam Nagaon 3313 609
Assam Sivasagar 3314 610
Bihar Champaran 3424 901
Bihar Muzaffarpur 3420 902
Bihar Darbhanga 3405 903
Bihar Saharsa 3430 904
Bihar Purnia 3427 905
Bihar Saran 3434 906
Bihar Patna 3425 907
Bihar Munger 3419 908

Contd...
33
State name District name India code District code
Bihar Bhagalpur 3403 909
Bihar Shahabad 3429 911
Bihar Gaya 3408 912
Gujarat Ahmedabad 3501 121
Gujarat Amreli 3502 122
Gujarat Banaskantha 3503 123
Gujarat Bharuch 3504 124
Gujarat Vadodara 3518 125
Gujarat Bhavnagar 3506 126
Gujarat Valsad 3519 127
Gujarat The Dangs 3517 128
Gujarat Jamnagar 3507 129
Gujarat Junagadh 3508 130
Gujarat Kheda 3510 131
Gujarat Kachchh 3509 132
Gujarat Mehsana 3511 133
Gujarat Panchmahal 3512 134
Gujarat Rajkot 3513 135
Gujarat Sabarkantha 3514 136
Gujarat Surat 3515 137
Gujarat Surendranagar 3516 138
Haryana Hisar 3605 177
Haryana Gurgaon 3604 180
Haryana Jind 3606 181
Haryana Mahendragarh 3609 182
Haryana Ambala 3601 183
Haryana Karnal 3607 184
Haryana Rohtak 3610 186
Himachal Pradesh Bilaspur 3701 626
Himachal Pradesh Chamba 3702 627
Himachal Pradesh Kangra 3704 629
Himachal Pradesh Kinnaur 3705 630
Himachal Pradesh Kullu 3706 631
Himachal Pradesh Lahul & Spiti 3707 632
Himachal Pradesh Solan 3711 633
Himachal Pradesh Mandi 3708 634
Himachal Pradesh Shimla 3709 635
Himachal Pradesh Sirmaur 3710 636

Contd...
34
Appendix 3. Districts formed after 1966 and their parent district.
District formed after 1966 Parent district (1966 base) State Name Code Year of
Formation Name Code Percentage
Andhra Pradesh Prakasam 504 1974-75 Guntur 49 46
Prakasam 504 1974-75 Nellore 50 38
Prakasam 504 1974-75 Kurnool 51 16
Rangareddy 520 1978-79 Hyderabad 55 100
Vizianagaram 503 1979-80 Srikakulam 44 50
Vizianagaram 503 1979-80 Visakhapatnam 45 50 Assam Barapet 615 1981 Kamrup 605 100
Dhubri 616 1981 Goalpara 604 100
Golaghat 617 1981 Sibsagar 610 100
Jorhat 618 1981 Sibsagar 610 100
Karimganj 619 1981 Cachar 601 100
Kokrajhar 620 1981 Goalpara 604 100
Nalbari 621 1981 Kamrup 605 100
Sonitpur 622 1981 Darrang 602 100
Bongaigaon 1047 1989 Goalpara 604 40
Bongaigaon 1047 1989 Kokrajhar 620 60
Dhemaji 1048 1989 Lakhimpur 607 100
Hailakandi 1049 1989 Cachar 601 100
Marigaon 1050 1989 Nagaon 609 100
Tinsukia 1051 1989 Dibrugarh 603 100
Udalguri 2017 2004 Darrang 602 100
Baksa 2018 2007 Barapet 615 33
Baksa 2018 2007 Nalbari 621 33
Baksa 2018 2007 Kamrup 605 34
Cirang 2019 2004 Bongaigaon 1047 100
Kamrup Metroplitan 2028 2003 Kamrup 605 100
Kamrup (rural) 2029 2003 Kamrup 605 100
Biswanath 2044 2015 Sonitpur 622 100
Charaideo 2045 2015 Sivasagar 610 100
Hojai 2046 2015 Nagaon 609 100
Majuli 2047 2016 Johart 618 100
South Salmara-Mankachar 2048 2016 Dhubri 616 100
West Karbi Anglong 2049 2016 Karbi Anglong 606 100 Bihar Nalanda 918 1973-74 Patna 907 100
Nawada 919 1973-74 Gaya 912 100
Aurangabad 920 1973-74 Gaya 912 100
Bhojpur 921 1973-74 Sahabad 911 100
Rohtas 922 1973-74 Sahabad 911 100
Contd...
35
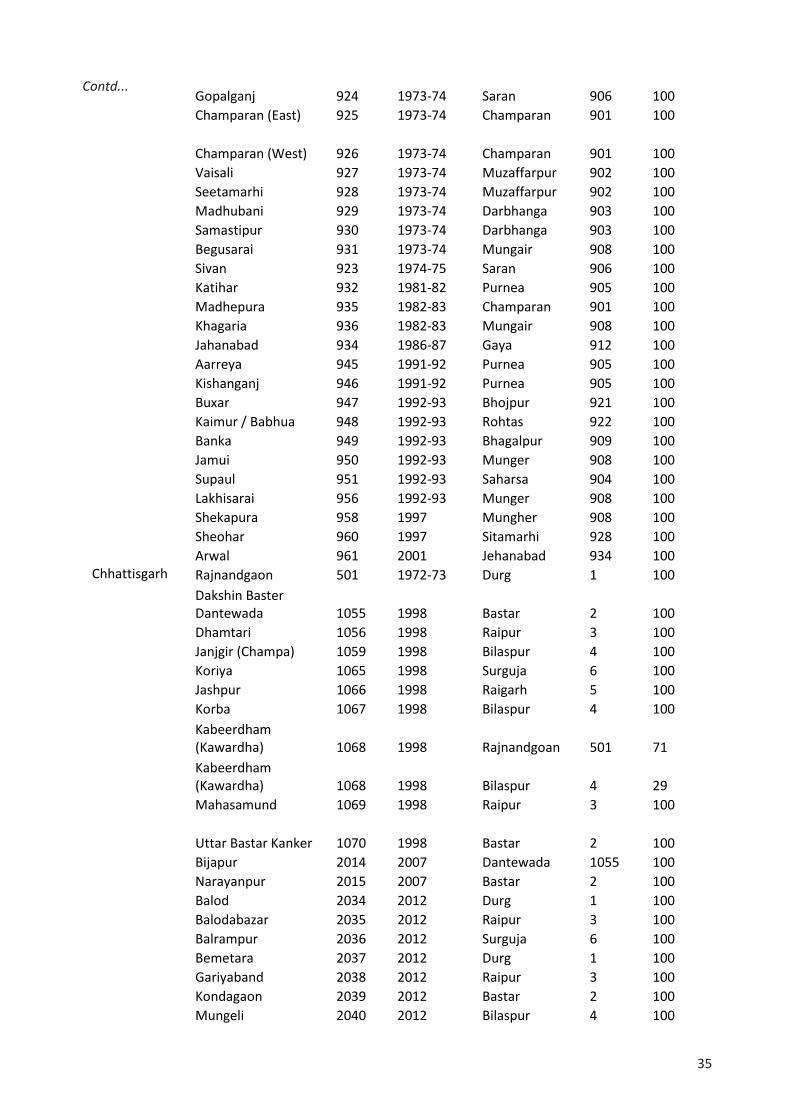
Gopalganj 924 1973-74 Saran 906 100
Champaran (East) 925 1973-74 Champaran 901 100
Champaran (West) 926 1973-74 Champaran 901 100
Vaisali 927 1973-74 Muzaffarpur 902 100
Seetamarhi 928 1973-74 Muzaffarpur 902 100
Madhubani 929 1973-74 Darbhanga 903 100
Samastipur 930 1973-74 Darbhanga 903 100
Begusarai 931 1973-74 Mungair 908 100
Sivan 923 1974-75 Saran 906 100
Katihar 932 1981-82 Purnea 905 100
Madhepura 935 1982-83 Champaran 901 100
Khagaria 936 1982-83 Mungair 908 100
Jahanabad 934 1986-87 Gaya 912 100
Aarreya 945 1991-92 Purnea 905 100
Kishanganj 946 1991-92 Purnea 905 100
Buxar 947 1992-93 Bhojpur 921 100
Kaimur / Babhua 948 1992-93 Rohtas 922 100
Banka 949 1992-93 Bhagalpur 909 100
Jamui 950 1992-93 Munger 908 100
Supaul 951 1992-93 Saharsa 904 100
Lakhisarai 956 1992-93 Munger 908 100
Shekapura 958 1997 Mungher 908 100
Sheohar 960 1997 Sitamarhi 928 100
Arwal 961 2001 Jehanabad 934 100 Chhattisgarh Rajnandgaon 501 1972-73 Durg 1 100
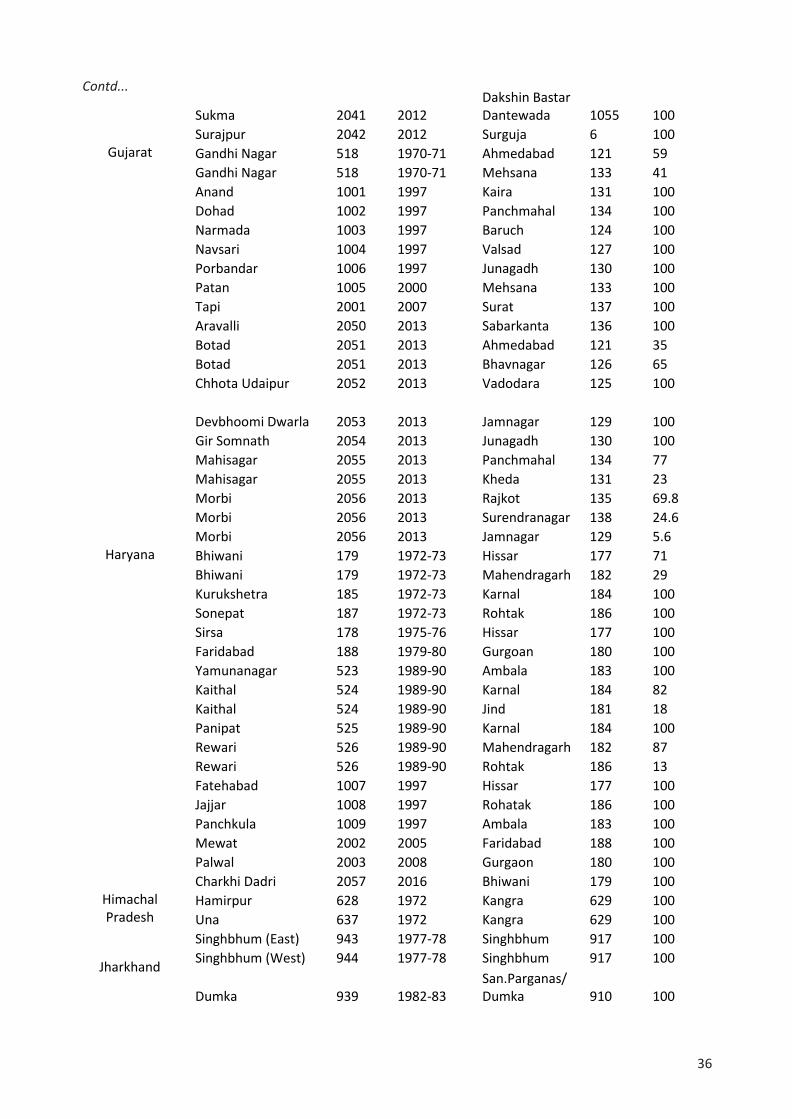
Dakshin Baster Dantewada 1055 1998 Bastar 2 100
Dhamtari 1056 1998 Raipur 3 100
Janjgir (Champa) 1059 1998 Bilaspur 4 100
Koriya 1065 1998 Surguja 6 100
Jashpur 1066 1998 Raigarh 5 100
Korba 1067 1998 Bilaspur 4 100
Kabeerdham (Kawardha) 1068 1998 Rajnandgoan 501 71
Kabeerdham (Kawardha) 1068 1998 Bilaspur 4 29
Mahasamund 1069 1998 Raipur 3 100
Uttar Bastar Kanker 1070 1998 Bastar 2 100
Bijapur 2014 2007 Dantewada 1055 100
Narayanpur 2015 2007 Bastar 2 100
Balod 2034 2012 Durg 1 100
Balodabazar 2035 2012 Raipur 3 100
Balrampur 2036 2012 Surguja 6 100
Bemetara 2037 2012 Durg 1 100
Gariyaband 2038 2012 Raipur 3 100
Kondagaon 2039 2012 Bastar 2 100
Mungeli 2040 2012 Bilaspur 4 100
Contd...
36
Sukma 2041 2012 Dakshin Bastar Dantewada 1055 100
Surajpur 2042 2012 Surguja 6 100 Gujarat Gandhi Nagar 518 1970-71 Ahmedabad 121 59
Gandhi Nagar 518 1970-71 Mehsana 133 41
Anand 1001 1997 Kaira 131 100
Dohad 1002 1997 Panchmahal 134 100
Narmada 1003 1997 Baruch 124 100
Navsari 1004 1997 Valsad 127 100
Porbandar 1006 1997 Junagadh 130 100
Patan 1005 2000 Mehsana 133 100
Tapi 2001 2007 Surat 137 100
Aravalli 2050 2013 Sabarkanta 136 100
Botad 2051 2013 Ahmedabad 121 35
Botad 2051 2013 Bhavnagar 126 65
Chhota Udaipur 2052 2013 Vadodara 125 100
Devbhoomi Dwarla 2053 2013 Jamnagar 129 100
Gir Somnath 2054 2013 Junagadh 130 100
Mahisagar 2055 2013 Panchmahal 134 77
Mahisagar 2055 2013 Kheda 131 23
Morbi 2056 2013 Rajkot 135 69.8
Morbi 2056 2013 Surendranagar 138 24.6
Morbi 2056 2013 Jamnagar 129 5.6 Haryana Bhiwani 179 1972-73 Hissar 177 71
Bhiwani 179 1972-73 Mahendragarh 182 29
Kurukshetra 185 1972-73 Karnal 184 100
Sonepat 187 1972-73 Rohtak 186 100
Sirsa 178 1975-76 Hissar 177 100
Faridabad 188 1979-80 Gurgoan 180 100
Yamunanagar 523 1989-90 Ambala 183 100
Kaithal 524 1989-90 Karnal 184 82
Kaithal 524 1989-90 Jind 181 18
Panipat 525 1989-90 Karnal 184 100
Rewari 526 1989-90 Mahendragarh 182 87
Rewari 526 1989-90 Rohtak 186 13
Fatehabad 1007 1997 Hissar 177 100
Jajjar 1008 1997 Rohatak 186 100
Panchkula 1009 1997 Ambala 183 100
Mewat 2002 2005 Faridabad 188 100
Palwal 2003 2008 Gurgaon 180 100
Charkhi Dadri 2057 2016 Bhiwani 179 100 Himachal Pradesh
Hamirpur 628 1972 Kangra 629 100
Una 637 1972 Kangra 629 100
Jharkhand
Singhbhum (East) 943 1977-78 Singhbhum 917 100
Singhbhum (West) 944 1977-78 Singhbhum 917 100
Dumka 939 1982-83 San.Parganas/ Dumka 910 100

Contd...
37
Godda 937 1983-84 San.Parganas/ Dumka 910 100
Sahebganj 938 1983-84 San.Parganas/ Dumka 910 100
Devghar / Deogarh 940 1983-84 San.Parganas/ Dumka 910 100
Lohardagga 941 1983-84 Ranchi 916 100
Gumla 942 1983-84 Ranchi 916 100
Giridhi 933 1985-86 Hazaribagh 913 100
Chatra 952 1992-93 Hazaribagh 913 100
Bokaro 953 1992-93 Giridhi 933 67
Bokaro 953 1992-93 Dhanbad 914 33
Garhwa / Gadva 954 1992-93 Palamau 915 100
Khodrama 955 1992-93 Hazaribagh 913 100
Pakur 957 1997 Sahibganj 938 100
Jamtara 962 2003 San.Parganas/ Dumka 910 100
Latehar 963 2003 Palamau 915 100
Sariakela-Kharsawan 964 2003 Sigbhbum (West) 944 100
Simdega 965 2003 Gumla 942 100
Khunbi 2023 2007 Ranchi 916 100
Ramgarh 2024 2007 Hazaribagh 913 100
Karnataka
Banglore (Rural) 549 1986-87 Bangalore 64 100
Banglore (Urban) 550 1986-87 Bangalore 64 100
Bagalkot 1010 1997 Bijapur 76 100
Chamarajanagara 1011 1997 Mysore 67 100
Davangere 1012 1997 Chittradugra 72 100
Gadag 1013 1997 Dharwad 74 100
Haveri 1014 1997 Dharwad 74 100
Koppal 1015 1997 Raichur 78 100
Udupi 1016 1997 Dakshin Kanara 80 100
Ramanagara 2004 2007 Banglore (Rural) 549 100
Chikkballapura 2005 2007 Kolar 65 100
Yadagir 2025 2009 Gulberga 79 100
Kerala
Idukki 654 1972 Ernakulam 653 20
Idukki 654 1972 Kottayam 655 80
Waynad 664 1981 Kozhikode 656 64.84
Waynad 664 1981 Cannanore 652 35.16
Pathanamthitta 663 1983 Quilon 659 100
Kasargod 662 1985 Cannanore 652 100 Madhya Pradesh Barwani 1060 1998 Khargone 35 100
Bhopal 502 1972-73 Sehore 37 100
Dindori 1057 1998 Mandla 12 100
Harda 1058 1998 Hoshangbad 43 100
Katni 1061 1998 Jabalpur 7 100
Neemach 1062 1998 Mandsaur 31 100

Contd...
38
Sheopur 1063 1998 Morena 26 100
Umaria 1064 1998 Shahdol 21 100
Asoknagar 1081 2003 Guna 24 100
Anuppur 1071 2003 Shahdol 21 100
Burhanpur 1082 2003 Khandwa 36 100
Alirajpur 2006 2008 Jhabua 34 100
Singrauli 2007 2008 Sidhi 19 100
Agar Malwa 2058 2013 Shajapur 42 100 Maharashtra Jalna 514 1981-82 Aurangabad 108 100
Latur 515 1981-82 Osmanabad 112 100
Gadchiroli 516 1981-82 Chandrapur 120 100
Sindhudurg 517 1981-82 Ratnagiri 98 100
Nandurbar 1074 1997 Dhule 100 100
Washim 1075 1997 Akola 114 100
Gondiya 1072 1998 Bhandra 119 100
Hengelo 1073 1998 Parbhani 109 100
Palghar 2059 2014 Thane 96 100
Mumbai Sub 1076 1990 Bombay 95 100
Mumbai City 2027 1990 Bombay 95 100 Odisha Bhadrak 714 1993-94 Balasore 701 100
Jagatsingpur 716 1993-94 Cuttack 703 100
Jajpur 717 1993-94 Cuttack 703 100
Kendrapara 718 1993-94 Cuttack 703 100
Angul 719 1993-94 Dhenkanal 704 100
Gajapati 720 1993-94 Ganjam 705 100
Naupada 721 1993-94 Kalahandi 706 100
Malkanagiri 722 1993-94 Koraput 708 100
Nobarangpur 723 1993-94 Koraput 708 100
Rayagada 724 1993-94 Koraput 708 100
Khordha 725 1993-94 Puri 711 100
Nayagarh 726 1993-94 Puri 711 100
Boudh 728 1993-94 Phulbani 710 100
Bargarh 729 1993-94 Sambalpur 712 100
Deogarh 730 1993-94 Sambalpur 712 100
Jharsuguda 731 1993-94 Sambalpur 712 100
Sonepur / Subarnapur 732 1993-94 Bolangir 702 100
Punjab Faridkot 173 1972-73 Ferozepur 172 74
Faridkot 173 1972-73 Bhatinda 174 26
Mansa 545 1992-93 Bhatinda 174 100
Fatehgarh Sahib 546 1992-93 Patiala 176 77
Fatehgarh Sahib 546 1992-93 Ludhiana 171 15
Fatehgarh Sahib 546 1992-93 Sangrur 175 8
Nawan Shehar (S.B.S. Nagar) 1017 1995 Jalandhar 168 61
Nawan Shehar (S.B.S. Nagar) 1017 1995 Hoshiarpur 169 39
Muktsar 1018 1995 Faridkot 173 100
Moga 1019 1995 Faridkot 173 100

Contd...
39
Tarantaran 2009 2006 Amritsur 166 100
Barnala 2010 2006 Sangrur 175 100
S.A.S. Nagar 2011 2006 Roopnagar 170 50
S.A.S. Nagar 2011 2006 Patiala 176 50
Pathankot 2030 2011 Gurdaspur 165 100
Fazilka 2043 2011 Firozpur 172 100 Rajasthan Dholpur 519 1982-83 Bharatpur 143 100
Baran 536 1991-92 Kota 157 100
Dausa 537 1991-92 Jaipur 151 100
Rajsamand 538 1991-92 Udaipur 164 100
Hanumangarh 539 1993-94 Ganganagar 150 100
Karauli 1020 1997 Sawai Madhopur 160 100
Pratapgarh 2012 2008 Banswara 141 33
Pratapgarh 2012 2008 Chittorgarh 147 33
Pratapgarh 2012 2008 Udaipur 164 34 Tamil Nadu Dharampuri 506 1970-71 Salem 86 100
Pudukottai 508 1972-73 Coimbatore 87 100
Periyar 507 1979-80 Tiruchirapally / Trichy 88 68
Periyar 507 1979-80 Tanjavur 89 32
Kamarajar / Virudhunagar 510 1984-85 Ramnathpuram 91 100
Muthuramlingam / Pasumpon M. Thevar / Sivaganga 512 1984-85 Ramnathpuram 91 100
Anna / D.Q. Milleth / Dindigal 509 1985-86 Madurai 90 100
Chidambarnar / Thoothukkudi 513 1986-87
Tirunalveli /Kattabomman 92 100
T Sambuvarayar / Tiruvanmalai 521 1989-90
North Arcot / Ambedkar 85 100
Nagapatnam / Nagai Q.E. Milleth 542 1992-93 Tanjavur 89 100
Villupuram 543 1993-94
South Arcot / S.A. Vallalar / Cuddalore 84 100
Kancheepuram 1021 1996 Chengalpattu 83 100
Karur 1022 1996 Tiruchirapally 88 100
Namakkal 1023 1996 Salem 86 100
Perambalur 1024 1996 Tiruchirapally 88 100
Theni 1025 1996 Madhurai 90 100
Thiruvarur 1026 1996 Tanjavur 89 10
Thiruvarur 1026 1996 Nagapattinam 542 90
Tiruvallur 1027 1996 Chengalpattu 83 100
Ariyalur 1077 2001 Perambalur 1024 100
Krishnagiri 1080 2003 Dharmapuri 506 100

Contd...
40
Thiruppur 2020 2008 Coimbatore 87 50
Thiruppur 2020 2008 Erode 507 50 Telangana Kumaram Bheem
Asifabad 2101 2014 Adilabad 63 100
Mancherial 2102 2014 Adilabad 63 100
Nirmal 2103 2014 Adilabad 63 100
Jagtil 2104 2014 Karimnagar 62 100
Peddapalli 2105 2014 Karimnagar 62 100
Rajanna Sircilla 2106 2014 Karimnagar 62 100
Bhadradri Kothagudem 2107 2014 Khammam 61 80
Bhadradri Kothagudem 2107 2014 Warrangal 60 20
Jogulamba Gadwal 2108 2014 Mahbubnagar 58 100
Nagarkurnool 2109 2014 Mahbubnagar 58 100
Narayanpet 2122 2018 Mahbubnagar 58 100
Wanaparthy 2110 2014 Mahbubnagar 58 100
Sangareddy 2111 2014 Medak 57 100
Siddipet 2112 2014 Medak 57 80
Siddipet 2112 2014 Karimnagar 62 10
Siddipet 2112 2014 Warangal 60 10
Suryapet 2113 2014 Nalgonda 59 100
Yadadri Bhuvanagiri 2114 2014 Nalgonda 59 100
Kamareddy 2115 2014 Nizamabad 56 100
Medchal–Malkajgiri 2116 2014 Rangareddy 520 100
Vikarabad 2117 2014 Rangareddy 520 80
Vikarabad 2117 2014 Mahbubnagar 58 20
Jayashankar Bhupalpally 2118 2014 Warangal 60 80
Jayashankar Bhupalpally 2118 2014 Karimnagar 62 20
Jangaon 2119 2014 Warangal 60 100
Warangal Urban 2120 2014 Warangal 60 100
Mulugu 2123 2018 Warangal 60 100
Mahabubabad 2121 2014 Warangal 60 80
Mahabubabad 2121 2014 Khammam 61 20 Uttar Pradesh Lalithpur 212 1974-75 Jhansi 211 100
Ghaziabad 193 1976-77 Meerut 191 78
Ghaziabad 193 1976-77 Bulandershahr 192 22
Kanpur (City) 547 1982-83 Kanpur 208 100
Kanpur (Dehat) 548 1982-83 Kanpur 208 100
Haridwar 527 1989-90 Saharanpur 189 100
Ferozabad 528 1989-90 Agra 196 34
Ferozabad 528 1989-90 Mainpuri 197 66
Sonbhadra 529 1989-90 Mirzapur 217 100
Mau 530 1989-90 Azamgarh 224 100

Contd...
41
Maharajganj 531 1989-90 Ghorakpur 221 100
Sidhartnagar 532 1989-90 Basti 223 100
Ambedhkar Nagar 1028 1995 Faizabad 231 100
Kushinagar 1029 1995 Deoria 222 100
Mahoba 533 1995 Hamirpur 214 100
Padrauna 535 1995 Deoria 222 100
Auraiya 1031 1997 Etawah 207 100
Baghpat 1033 1997 Meerut 191 100
Balrampur 1034 1997 Gonda 232 100
Chandauli 1036 1997 Varanasi 216 100
Chitrakut 1037 1997 Banda 215 100
Gautambuddhanagar 1038 1997 Ghaziabad 193 100
Hatharas (Mahamayangar) 1039 1997 Aligarh 194 100
J.B. Phule Nagar 1040 1997 Moradabad 201 100
Kannauj 1041 1997 Farrukabad 206 100
Kaushambi 1042 1997 Allahabad 210 100
Sant Ravi Das Nagar 1044 1997 Varanasi 216 100
Sant Kabir Nagar 1045 1997 Basti 223 100
Shravasti 1046 1997 Baharaich 233 100
Khansi Ram Nagar 2013 2008 Eath 198 100
C.S.M. Nagar / Amethi 2026 2010 Sultanpur 234 56.6
C.S.M. Nagar / Amethi 2026 2010 Rae Bareli 227 43.4
Sambhal 2031 2012 Moradabad 201 62
Sambhal 2031 2012 Budaun 200 38
Shamili 2032 2011 Muzaffarnagar 190 100
Hapur 2033 2011 Ghaziabad 193 100 Uttarakhand
Udhamsingh Nagar 1030 1995 Nainital 237 100
Bageshwar 1032 1997 Almorah 238 100
Champavat 1035 1997 Pithorgarh 239 100
Rudraprayag 1043 1997 Chamoli 240 100 West Bengal
24-Parganas (South) 801 1982-83 24-Parganas 800 100
24-Parganas (North) 802 1982-83 24-Parganas 800 100
Dinajpur (Uttar) 819 1995-96 West Dinajpur 822 100
Dinajpur (Dakshin) 820 1995-96 West Dinajpur 822 100
Midnapore (East) 823 2001-02 Midnapore 818 100
Midnapore (West) 824 2001-02 Midnapore 818 100
Alipurduar 2060 2014 Jalpaiguri 812 100
Jhargram 2061 2017 Pachim Midnapur 824 100
Kalimpong 2062 2017 Darjiling 813 100
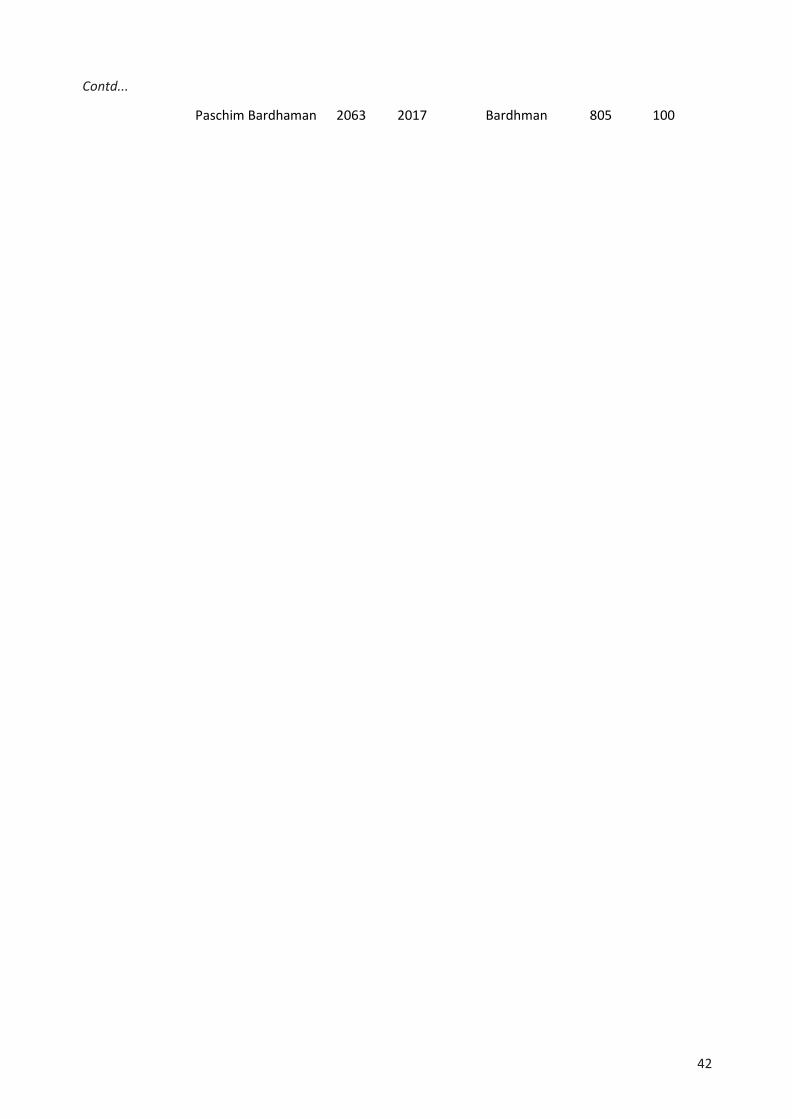
Contd...
42
Paschim Bardhaman 2063 2017 Bardhman 805 100

Contd...
Appendix 4. Identifiers (common to all files).
Appendix 4
REGION
REG_NAME
AEZ AEZ_NATP1
AEZ_NATP_PS
ST_CODE
ST_NAME
INDIA ID
DIST4
DIST NAME LAT LONG
1
Coastal Andhra region 1 2 2.1 1
Andhra Pradesh 3219 44 Srikakulam 18.6 84.3
1
Coastal Andhra region 1 2 2.1 1
Andhra Pradesh 3220 45
Visakhapatnam 17.7 83.3
1
Coastal Andhra region 1 2 2.1 1
Andhra Pradesh 3205 46
East Godavari 17 82.2
1
Coastal Andhra region 1 2 2.1 1
Andhra Pradesh 3223 47
West Godavari 16.8 81.5
1
Coastal Andhra region 3 2 2.1 1
Andhra Pradesh 3210 48 Krishna 16.2 81.1
1
Coastal Andhra region 3 2 2.1 1
Andhra Pradesh 3206 49 Guntur 16.6 79.6
1
Coastal Andhra region 3 2 2.1 1
Andhra Pradesh 3215 50
S.P.S. Nellore 14.5 80
2 Rayalaseema region 3 5 5.3 1
Andhra Pradesh 3211 51 Kurnool 15.8 78.1
2 Rayalaseema region 4 5 5.3 1
Andhra Pradesh 3202 52 Ananthapur 14.6 77 4
3

Contd...
REGION
REG_NAME
AEZ AEZ_NATP1
AEZ_NATP_PS
ST_CODE
ST_NAME
INDIA ID
DIST4
DIST NAME LAT LONG
2 Rayalaseema region 3 5 5.3 1
Andhra Pradesh 3204 53 Kadapa YSR 14.5 78.8
2 Rayalaseema region 3 5 5.3 1
Andhra Pradesh 3203 54 Chittoor 13.5 78.5
2 Tirhut division 1 4 4.1 2 Bihar 3424 901 Champaran 26.5 84.6
2 Tirhut division 2 4 4.1 2 Bihar 3420 902 Muzaffarpur 26.1 85.4
4 Darbhanga division 1 4 4.1 2 Bihar 3405 903 Darbhanga 26 85.9
5 Kosi division 1 4 4.1 2 Bihar 3430 904 Saharsa 26.2 86.8
6 Purnea division 1 4 4.1 2 Bihar 3427 905 Purnea 25.8 87.5
3 Saran division 2 4 4.1 2 Bihar 3434 906 Saran 26 84.8
1 Patna division 3 4 4.1 2 Bihar 3425 907 Patna 25.6 85
8 Mungair division 3 4 4.1 2 Bihar 3419 908 Mungair 24.9 86.2
7 Bhagalpur division 1 4 4.1 2 Bihar 3403 909 Bhagalpur 25.3 87
1 Patna division 3 4 4.1 2 Bihar 3429 911
Shahabad (now part of Bhojpur district) 25.5 84.5
9 Magadh division 3 4 4.1 2 Bihar 3408 912 Gaya 24.8 85
1 Baroda division 3 5 5.4 3 Gujarat 3501 121 Ahmedabad 23.1 72.6

Contd...
REGION
REG_NAME
AEZ AEZ_NATP1
AEZ_NATP_PS
ST_CODE
ST_NAME
INDIA ID
DIST4
DIST NAME LAT LONG
2 Rajkot division 3 5 5.3 3 Gujarat 3502 122 Amreli 21.5 71.1
1 Baroda division 3 1 1.2 3 Gujarat 3503 123
Banaskantha 24.3 71.9
1 Baroda division 3 5 5.4 3 Gujarat 3504 124 Bharuch 21.7 73
1 Baroda division 3 5 5.4 3 Gujarat 3518 125
Vadodara Baroda 22.3 73.3
2 Rajkot division 3 5 5.3 3 Gujarat 3506 126 Bhavnagar 21.8 72.2
1 Baroda division 3 5 5.4 3 Gujarat 3519 127 Valsad 20.6 73.2
1 Baroda division 3 5 5.4 3 Gujarat 3517 128 Dangs 20.8 73.6
2 Rajkot division 3 1 1.2 3 Gujarat 3507 129 Jamnagar 22.5 70.1
2 Rajkot division 3 5 5.3 3 Gujarat 3508 130 Junagadh 20.9 70.4
1 Baroda division 3 5 5.4 3 Gujarat 3510 131 Kheda 22.3 73.3
2 Rajkot division 4 1 1.2 3 Gujarat 3509 132 Kutch 23.3 69.8
1 Baroda division 3 5 5.4 3 Gujarat 3511 133 Mehsana 23.8 71.6
1 Baroda division 3 5 5.4 3 Gujarat 3512 134 Panchmahal 22.9 73.8
2 Rajkot division 3 1 1.2 3 Gujarat 3513 135 Rajkot 22.3 70.8

Contd...
REGION
REG_NAME
AEZ AEZ_NATP1
AEZ_NATP_PS
ST_CODE
ST_NAME
INDIA ID
DIST4
DIST NAME LAT LONG
1 Baroda division 3 5 5.3 3 Gujarat 3514 136 Sabarkantha 23.5 73.2
1 Baroda division 3 5 5.4 3 Gujarat 3515 137 Surat 21.2 72.1
2 Rajkot division 3 5 5.4 3 Gujarat 3516 138
Surendranagar 22.8 71.6
3 Hissar division 4 4 4.2 4 Haryana 3605 177 Hissar 29.2 75.7
2 Gurgaon division 2 4 4.2 4 Haryana 3604 180 Gurgaon 28.5 76.8
3 Hissar division 2 4 4.1 4 Haryana 3606 181 Jind 29.5 76.4
2 Gurgaon division 2 4 4.2 4 Haryana 3609 182
Mahendragarh Narnaul 28.4 76.2
1 Ambala division 2 4 4.1 4 Haryana 3601 183 Ambala 30.4 76.7
4 Rohtak division 2 4 4.1 4 Haryana 3607 184 Karnal 29.7 77
4 Rohtak division 4 4 4.2 4 Haryana 3610 186 Rohtak 28.9 76.6
1 Bangalore division 3 5 5.2 5
Karnataka 3901 64 Bangalore 13 77.6
1 Bangalore division 3 5 5.2 5
Karnataka 3913 65 Kolar 13.1 78.1
1 Bangalore division 3 5 5.2 5
Karnataka 3918 66 Tumkur 13.4 77.1
4 Mysore division 3 5 5.2 5
Karnataka 3915 67 Mysore 12.1 76.3

Contd...
REGION
REG_NAME
AEZ AEZ_NATP1
AEZ_NATP_PS
ST_CODE
ST_NAME
INDIA ID
DIST4
DIST NAME LAT LONG
4 Mysore division 3 5 5.2 5
Karnataka 3914 68 Mandya 12.8 77.8
4 Mysore division 1 5 5.2 5
Karnataka 3911 69 Hassan 13 76.2
1 Bangalore division 1 5 5.2 5
Karnataka 3917 70 Shimoge 13.9 75.6
4 Mysore division 1 5 5.2 5
Karnataka 3906 71
Chickmagalur 13.3 75.8
1 Bangalore division 3 5 5.2 5
Karnataka 3907 72 Chitradurga 14.2 76.4
3 Gulbarga division 4 5 5.2 5
Karnataka 3903 73 Bellary 15.2 76.9
2 Belgaum division 3 5 5.2 5
Karnataka 3909 74 Dharwad 15.5 75
2 Belgaum division 3 5 5.2 5
Karnataka 3902 75 Belgaum 15.9 74.5
2 Belgaum division 3 5 5.2 5
Karnataka 3905 76
Bijapur Vijayapura 16.8 75.7
3 Gulbarga division 3 5 5.2 5
Karnataka 3904 77 Bidar 17.9 77.5
3 Gulbarga division 3 5 5.2 5
Karnataka 3916 78 Raichur 16.2 77.4
3 Gulbarga division 3 5 5.2 5
Karnataka 3910 79
Gulbarga Kalaburagi 17.4 76.9
4 Mysore division 1 2 2.2 5
Karnataka 3908 80
Dakshina Kannada 12.9 74.9
2 Belgaum division 1 2 2.2 5
Karnataka 3919 81
Uttara Kannada 14.8 75.5

Contd...
REGION
REG_NAME
AEZ AEZ_NATP1
AEZ_NATP_PS
ST_CODE
ST_NAME
INDIA ID
DIST4
DIST NAME LAT LONG
4 Mysore division 1 5 5.2 5
Karnataka 3912 82
Kodagu Coorg 12.4 75.7
1 Jabalpur division 3 5 5.1 6
Madhya Pradesh 1019 7 Jabalpur 23 80
1 Jabalpur division 1 5 5.1 6
Madhya Pradesh 1001 8 Balaghat 22.1 80.6
1 Jabalpur division 3 5 5.3 6
Madhya Pradesh 1008 9 Chhindwara 22.1 79
1 Jabalpur division 1 5 5.3 6
Madhya Pradesh 1024 10 Narsinghpur 22.8 79
1 Jabalpur division 1 5 5.3 6
Madhya Pradesh 1037 11
Seoni Shivani 22.1 79.7
1 Jabalpur division 1 5 5.1 6
Madhya Pradesh 1021 12 Mandla 25 88.1
2 Sagar division 3 5 5.3 6
Madhya Pradesh 1033 13 Sagar 23.9 78.8
2 Sagar division 3 5 5.1 6
Madhya Pradesh 1009 14 Damoh 24.1 79.6
2 Sagar division 2 5 5.3 6
Madhya Pradesh 1042 15 Tikamgarh 24.9 78.9
2 Sagar division 2 5 5.3 6
Madhya Pradesh 1007 16 Chhatarpur 25.1 79.5
2 Sagar division 2 5 5.1 6
Madhya Pradesh 1025 17 Panna 24.3 80
3 Rewa division 2 5 5.1 6
Madhya Pradesh 1032 18 Rewa 24.5 81.3
3 Rewa division 3 5 5.1 6
Madhya Pradesh 1041 19 Sidhi 24.3 82

Contd...
REGION
REG_NAME
AEZ AEZ_NATP1
AEZ_NATP_PS
ST_CODE
ST_NAME
INDIA ID
DIST4
DIST NAME LAT LONG
3 Rewa division 2 5 5.1 6
Madhya Pradesh 1035 20 Satna 24.6 80.1
3 Rewa division 3 5 5.1 6
Madhya Pradesh 1038 21 Shahdol 23.5 81.1
6 Chambal division 2 5 5.3 6
Madhya Pradesh 1016 22 Gwalior 26.2 78.3
6 Chambal division 3 5 5.3 6
Madhya Pradesh 1040 23 Shivpuri 24.6 77.5
6 Chambal division 3 5 5.3 6
Madhya Pradesh 1015 24 Guna 24.7 77.3
6 Chambal division 2 5 5.3 6
Madhya Pradesh 1010 25 Datia 25.7 78.5
6 Chambal division 2 5 5.3 6
Madhya Pradesh 1023 26 Morena 25.1 76.7
6 Chambal division 2 5 5.3 6
Madhya Pradesh 1004 27 Bhind 21.9 77.7
4 Indore division 3 5 5.3 6
Madhya Pradesh 1018 28 Indore 22.7 75.8
5 Ujjain division 3 5 5.3 6
Madhya Pradesh 1031 29 Ratlam 23 75
5 Ujjain division 3 5 5.3 6
Madhya Pradesh 1043 30 Ujjain 23.3 75.7
5 Ujjain division 3 5 5.3 6
Madhya Pradesh 1022 31 Mandsaur 24.3 75.2
5 Ujjain division 3 5 5.3 6
Madhya Pradesh 1011 32 Dewas 22.6 76.4
4 Indore division 3 5 5.3 6
Madhya Pradesh 1012 33 Dhar 22.5 75

Contd...
REGION
REG_NAME
AEZ AEZ_NATP1
AEZ_NATP_PS
ST_CODE
ST_NAME
INDIA ID
DIST4
DIST NAME LAT LONG
4 Indore division 3 5 5.3 6
Madhya Pradesh 1020 34 Jhabua 22.6 74.4
4 Indore division 3 5 5.3 6
Madhya Pradesh 1045 35
Khargone West Nimar 21.9 75.4
4 Indore division 3 5 5.3 6
Madhya Pradesh 1014 36
Khandwa East Nimar 21.1 76.4
7 Bhopal division 3 5 5.3 6
Madhya Pradesh 1036 37 Sehore 22.9 77.1
7 Bhopal division 3 5 5.3 6
Madhya Pradesh 1028 38 Raisen 23.2 78.2
7 Bhopal division 3 5 5.3 6
Madhya Pradesh 1044 39 Vidisha 23.9 77.9
7 Bhopal division 3 5 5.3 6
Madhya Pradesh 1003 40 Betul 21.9 77.9
7 Bhopal division 3 5 5.3 6
Madhya Pradesh 1029 41 Rajgarh 23.9 76.8
5 Ujjain division 3 5 5.3 6
Madhya Pradesh 1039 42 Shajapur 23.4 76.4
7 Bhopal division 3 5 5.3 6
Madhya Pradesh 1017 43
Hoshangabad 22.8 77.8
1 Konkan division 1 2 2.2 7
Maharashtra 1111 95 Bombay 18.9 72.8
1 Konkan division 1 2 2.2 7
Maharashtra 1128 96 Thane 20 72.7
1 Konkan division 1 2 2.2 7
Maharashtra 1123 97 Raigad 18.4 73.1
1 Konkan division 1 2 2.2 7
Maharashtra 1119 98 Ratnagiri 17 73

Contd...
REGION
REG_NAME
AEZ AEZ_NATP1
AEZ_NATP_PS
ST_CODE
ST_NAME
INDIA ID
DIST4
DIST NAME LAT LONG
2 Nasik division 3 5 5.2 7
Maharashtra 1118 99 Nasik 20.6 74.5
2 Nasik division 3 5 5.2 7
Maharashtra 1109 100 Dhule 21.1 74.6
2 Nasik division 3 5 5.4 7
Maharashtra 1112 101 Jalgaon 21.1 75.6
3 Pune division 3 5 5.2 7
Maharashtra 1101 102
Ahmednagar 19.1 74.9
3 Pune division 3 5 5.2 7
Maharashtra 1122 103 Pune 18.5 73.9
4 Kolhapur division 3 5 5.2 7
Maharashtra 1125 104 Satara 17.4 73.6
4 Kolhapur division 3 5 5.2 7
Maharashtra 1124 105 Sangli 16.9 74.8
3 Pune division 3 5 5.2 7
Maharashtra 1127 106 Solapur 17.1 75.9
4 Kolhapur division 1 5 5.2 7
Maharashtra 1114 107 Kolhapur 16.7 74.2
5
Aurangabad division 3 5 5.2 7
Maharashtra 1104 108 Aurangabad 19.9 75.3
6 Latur division 3 5 5.4 7
Maharashtra 1121 109 Parbhani 19.1 76.1
5
Aurangabad division 3 5 5.2 7
Maharashtra 1105 110 Beed 19 75.8
6 Latur division 3 5 5.4 7
Maharashtra 1117 111 Nanded 19.1 77.2
6 Latur division 3 5 5.2 7
Maharashtra 1120 112 Osmanabad 18 76.1

Contd...
REGION
REG_NAME
AEZ AEZ_NATP1
AEZ_NATP_PS
ST_CODE
ST_NAME
INDIA ID
DIST4
DIST NAME LAT LONG
7 Amravati division 3 5 5.4 7
Maharashtra 1107 113 Buldhana 20.5 76.2
7 Amravati division 3 5 5.4 7
Maharashtra 1102 114 Akola 20.7 77
7 Amravati division 3 5 5.4 7
Maharashtra 1103 115 Amarawati 20.9 77.8
7 Amravati division 3 5 5.4 7
Maharashtra 1130 116 Yeotmal 20.4 78.1
8 Nagpur division 3 5 5.4 7
Maharashtra 1129 117 Wardha 20.9 78.4
8 Nagpur division 3 5 5.4 7
Maharashtra 1116 118 Nagpur 21.2 79.1
8 Nagpur division 1 5 5.1 7
Maharashtra 1106 119 Bhandara 20 79.3
8 Nagpur division 1 5 5.4 7
Maharashtra 1108 120 Chandrapur 19.4 80
1 Coastal plains 1 2 2.1 8 Orissa 1502 701 Balasore 21.1 86.9
3 Central plateau 1 5 5.1 8 Orissa 1501 702 Bolangir 20.3 83.2
1 Coastal plains 1 2 2.1 8 Orissa 1503 703 Cuttack 20.8 85.9
3 Central plateau 1 5 5.1 8 Orissa 1504 704 Dhenkanal 20.7 85.6
1 Coastal plains 1 2 2.1 8 Orissa 1505 705 Ganjam 19.3 84.9
2
Southwestern plateau 1 5 5.1 8 Orissa 1506 706 Kalahandi 19.3 83.1

Contd...
REGION
REG_NAME
AEZ AEZ_NATP1
AEZ_NATP_PS
ST_CODE
ST_NAME
INDIA ID
DIST4
DIST NAME LAT LONG
4 Northern plateau 1 5 5.1 8 Orissa 1507 707 Keonjhar 21.6 85.6
2
Southwestern plateau 1 5 5.1 8 Orissa 1508 708 Koraput 18.8 82.7
4 Northern plateau 1 5 5.1 8 Orissa 1509 709
Mayurbhanja 19.1 86.4
2
Southwestern plateau 1 5 5.1 8 Orissa 1510 710
Phulbani(Kandhamal) 20.1 84.4
1 Coastal plains 1 2 2.1 8 Orissa 1511 711 Puri 19.8 85.8
3 Central plateau 3 5 5.1 8 Orissa 1512 712 Sambalpur 21.5 84
4 Northern plateau 3 5 5.1 8 Orissa 1513 713 Sundargarh 21.5 84.9
2 Mojha division 2 4 4.1 9 Punjab 1604 165 Gurdaspur 32.3 75.7
2 Mojha division 2 4 4.1 9 Punjab 1601 166 Amritsar 31.6 74.9
3 Dobra division 2 4 4.1 9 Punjab 1608 167 Kapurthala 31.1 75.4
3 Dobra division 2 4 4.1 9 Punjab 1607 168 Jalandhar 31.5 75.6
3 Dobra division 2 4 4.1 9 Punjab 1606 169 Hoshiarpur 31.6 75.9
1 Malwa division 2 4 4.1 9 Punjab 1611 170
Roopnagar Ropar 30.3 76.5
1 Malwa division 2 4 4.1 9 Punjab 1609 171 Ludhiana 30.9 75.9

Contd...
REGION
REG_NAME
AEZ AEZ_NATP1
AEZ_NATP_PS
ST_CODE
ST_NAME
INDIA ID
DIST4
DIST NAME LAT LONG
2 Mojha division 4 4 4.1 9 Punjab 1605 172 Ferozpur 30.9 74.6
1 Malwa division 4 4 4.2 9 Punjab 1602 174 Bhatinda 31.6 75.3
1 Malwa division 4 4 4.1 9 Punjab 1612 175 Sangrur 31 75.9
1 Malwa division 2 4 4.1 9 Punjab 1610 176 Patiala 30 76.5
2 Ajmer division 3 5 5.3 10
Rajasthan 1701 139 Ajmer 26.5 74.6
3 Jaipur division 2 4 4.2 10
Rajasthan 1702 140 Alwar 26.4 76.6
5 Udaipur division 3 5 5.3 10
Rajasthan 1703 141 Banswara 23.6 74.5
4 Jodhpur division 4 1 1.1 10
Rajasthan 1704 142 Barmer 25.8 71.4
3 Jaipur division 2 4 4.2 10
Rajasthan 1705 143 Bharatpur 26.7 77.9
2 Ajmer division 3 5 5.3 10
Rajasthan 1706 144 Bhilwara 25.6 74.9
1 Bikaner division 4 1 1.2 10
Rajasthan 1707 145 Bikaner 28 73.3
6 Kota division 3 5 5.3 10
Rajasthan 1708 146 Bundi 25.6 75.7
5 Udaipur division 3 5 5.3 10
Rajasthan 1709 147 Chittorgarh 24.8 75.5
1 Bikaner division 4 1 1.2 10
Rajasthan 1710 148 Churu 28.4 74.4

Contd...
REGION
REG_NAME
AEZ AEZ_NATP1
AEZ_NATP_PS
ST_CODE
ST_NAME
INDIA ID
DIST4
DIST NAME LAT LONG
5 Udaipur division 3 5 5.3 10
Rajasthan 1712 149 Dungarpur 23.8 73.9
1 Bikaner division 4 4 4.2 10
Rajasthan 1713 150 Ganganagar 29.9 73.9
3 Jaipur division 2 4 4.2 10
Rajasthan 1714 151 Jaipur 26.9 75.8
4 Jodhpur division 4 1 1.1 10
Rajasthan 1715 152 Jaisalmer 26.9 70.9
4 Jodhpur division 4 1 1.1 10
Rajasthan 1716 153 Jalore 25.1 72.2
6 Kota division 3 5 5.3 10
Rajasthan 1717 154 Jhalawar 24.5 76.2
3 Jaipur division 4 1 1.1 10
Rajasthan 1718 155 Jhunjhunu 28.1 75.5
4 Jodhpur division 4 1 1.1 10
Rajasthan 1719 156 Jodhpur 26.3 73.1
6 Kota division 3 5 5.3 10
Rajasthan 1720 157 Kota 25.2 75.9
2 Ajmer division 4 1 1.1 10
Rajasthan 1721 158 Nagaur 27 74
4 Jodhpur division 3 1 1.1 10
Rajasthan 1722 159 Pali 25.7 73.6
6 Kota division 2 5 5.3 10
Rajasthan 1723 160
Swami Madhopur 26.4 76.8
3 Jaipur division 2 1 1.1 10
Rajasthan 1724 161 Sikar 27.6 75.1
4 Jodhpur division 3 1 10
Rajasthan 1726 162 Sirohi 1.1 24.7

Contd...
REGION
REG_NAME
AEZ AEZ_NATP1
AEZ_NATP_PS
ST_CODE
ST_NAME
INDIA ID
DIST4
DIST NAME LAT LONG
2 Ajmer division 3 5 5.3 10
Rajasthan 1725 163 Tonk 26.1 75.6
5 Udaipur division 3 5 5.3 10
Rajasthan 1727 164 Udaipur 24.6 73.7
2
Tondai Nadu region 1 2 2.1 11
Tamil Nadu 1901 83
Chengalpattu MGR Kanchipuram 24.6 79.9
2
Tondai Nadu region 1 2 2.1 11
Tamil Nadu 1915 84
South Arcot Cuddalore 9.3 78.3
2
Tondai Nadu region 3 5 5.1 11
Tamil Nadu 1909 85
North Arcot Vellore 12.9 79.2
3
Kongu Nadu region 3 5 5.3 11
Tamil Nadu 1914 86 Salem 11.7 78
3
Kongu Nadu region 3 5 5.1 11
Tamil Nadu 1902 87 Coimbatore 11 77
1
Chola Nadu region 3 5 5.1 11
Tamil Nadu 1917 88
Tiruchirapalli Trichy 10.8 78.7
1
Chola Nadu region 3 2 2.1 11
Tamil Nadu 1916 89 Thanjavur 10.8 79.9
4
Pandya Nadu region 3 5 5.1 11
Tamil Nadu 1907 90 Madurai 9.9 78.1
4
Pandya Nadu region 3 2 2.1 11
Tamil Nadu 1913 91
Ramananthapuram 9.2 78.5

Contd...
REGION
REG_NAME
AEZ AEZ_NATP1
AEZ_NATP_PS
ST_CODE
ST_NAME
INDIA ID
DIST4
DIST NAME LAT LONG
4
Pandya Nadu region 3 5 5.1 11
Tamil Nadu 1918 92 Thirunelveli 8.7 77.8
3
Kongu Nadu region 1 5 5.1 11
Tamil Nadu 1908 93 The Nilgiris 11.4 77.4
4
Pandya Nadu region 3 2 2.2 11
Tamil Nadu 1905 94
Kanyakumari 8.3 77.3
2
Tondai Nadu region 0 2 2.1 11
Tamil Nadu 1929 999 Chennai 13.1 80.2
1 Saharanpur division 2 4 4.3 12
Uttar Pradesh 2150 189 Saharanpur 29.9 77.9
1 Saharanpur division 2 4 4.3 12
Uttar Pradesh 2143 190
Muzaffarnagar 29.5 77.7
3 Meerut division 2 4 4.3 12
Uttar Pradesh 2140 191 Meerut 29 77.7
3 Meerut division 2 4 4.1 12
Uttar Pradesh 2114 192
Buland Shahar 28.3 77.9
5 Aligarh division 2 4 4.1 12
Uttar Pradesh 2102 194 Aligarh 27.9 78.1
4 Agra division 2 4 4.1 12
Uttar Pradesh 2139 195 Mathura 27.6 77.6
4 Agra division 2 4 4.1 12
Uttar Pradesh 2101 196 Agra 27.2 78
4 Agra division 2 4 4.1 12
Uttar Pradesh 2138 197 Mainpuri 27.3 79.1
5 Aligarh division 2 4 4.1 12
Uttar Pradesh 2118 198 Etah 27.6 78.8

Contd...
REGION
REG_NAME
AEZ AEZ_NATP1
AEZ_NATP_PS
ST_CODE
ST_NAME
INDIA ID
DIST4
DIST NAME LAT LONG
6 Bareilly division 2 4 4.1 12
Uttar Pradesh 2110 199 Bareilly 28.4 79.4
6 Bareilly division 2 4 4.1 12
Uttar Pradesh 2113 200 Budaun 28.1 79
2 Moradabad division 2 4 4.3 12
Uttar Pradesh 2142 201 Moradabad 28.7 78.7
6 Bareilly division 2 4 4.1 12
Uttar Pradesh 2151 202
Shahjahanpur 28 79.9
6 Bareilly division 2 4 4.1 12
Uttar Pradesh 2145 203 Pilibhit 28.5 79.9
2 Moradabad division 2 4 4.1 12
Uttar Pradesh 2149 204 Rampur 28.8 79.1
2 Moradabad division 2 4 4.3 12
Uttar Pradesh 2112 205 Bijnor 28.7 78.7
8 Kanpur division 2 4 4.1 12
Uttar Pradesh 2121 206 Farrukhabad 27.2 79.5
8 Kanpur division 2 4 4.1 12
Uttar Pradesh 2119 207 Etawah 27.1 78.7
8 Kanpur division 2 4 4.1 12
Uttar Pradesh 2133 208 Kanpur 26.4 80.3
11 Allahabad division 2 4 4.1 12
Uttar Pradesh 2122 209 Fatehpur 25.9 80.1
11 Allahabad division 2 4 4.1 12
Uttar Pradesh 2103 210 Allahabad 25.5 81.7
9 Jhansi division 2 5 5.3 12
Uttar Pradesh 2132 211 Jhansi 25.5 78.6
9 Jhansi division 2 5 5.3 12
Uttar Pradesh 2130 213 Jalaun 26 79.5

Contd...
REGION
REG_NAME
AEZ AEZ_NATP1
AEZ_NATP_PS
ST_CODE
ST_NAME
INDIA ID
DIST4
DIST NAME LAT LONG
10 Chitrakut division 2 5 5.3 12
Uttar Pradesh 2128 214 Hamirpur 25.5 79.9
10 Chitrakut division 2 5 5.3 12
Uttar Pradesh 2108 215 Banda 25.5 80.4
17 Varanasi division 2 4 4.1 12
Uttar Pradesh 2157 216 Varanasi 25.3 83
18 Vindhyachal division 2 4 4.1 12
Uttar Pradesh 2141 217 Mirzpur 25 82.6
17 Varanasi division 2 4 4.1 12
Uttar Pradesh 2131 218 Jaunpur 25.7 82.6
17 Varanasi division 2 4 4.1 12
Uttar Pradesh 2125 219 Ghazipur 25.7 83.6
16 Azamgarh division 2 4 4.1 12
Uttar Pradesh 2107 220 Ballia 25.9 84
15 Gorakhpur division 1 4 4.1 12
Uttar Pradesh 2127 221 Gorakhpur 26.8 83.4
15 Gorakhpur division 1 4 4.1 12
Uttar Pradesh 2117 222 Deoria 26.8 83.9
14 Basti division 2 4 4.1 12
Uttar Pradesh 2111 223 Basti 26.8 82.8
16 Azamgarh division 2 4 4.1 12
Uttar Pradesh 2105 224 Azamgarh 26 83.2
7 Lucknow division 2 4 4.1 12
Uttar Pradesh 2137 225 Lucknow 26.9 80.9
7 Lucknow division 2 4 4.1 12
Uttar Pradesh 2155 226 Unnao 26.6 80.5
7 Lucknow division 2 4 4.1 12
Uttar Pradesh 2148 227 Rae - Bareily 26.2 81.2
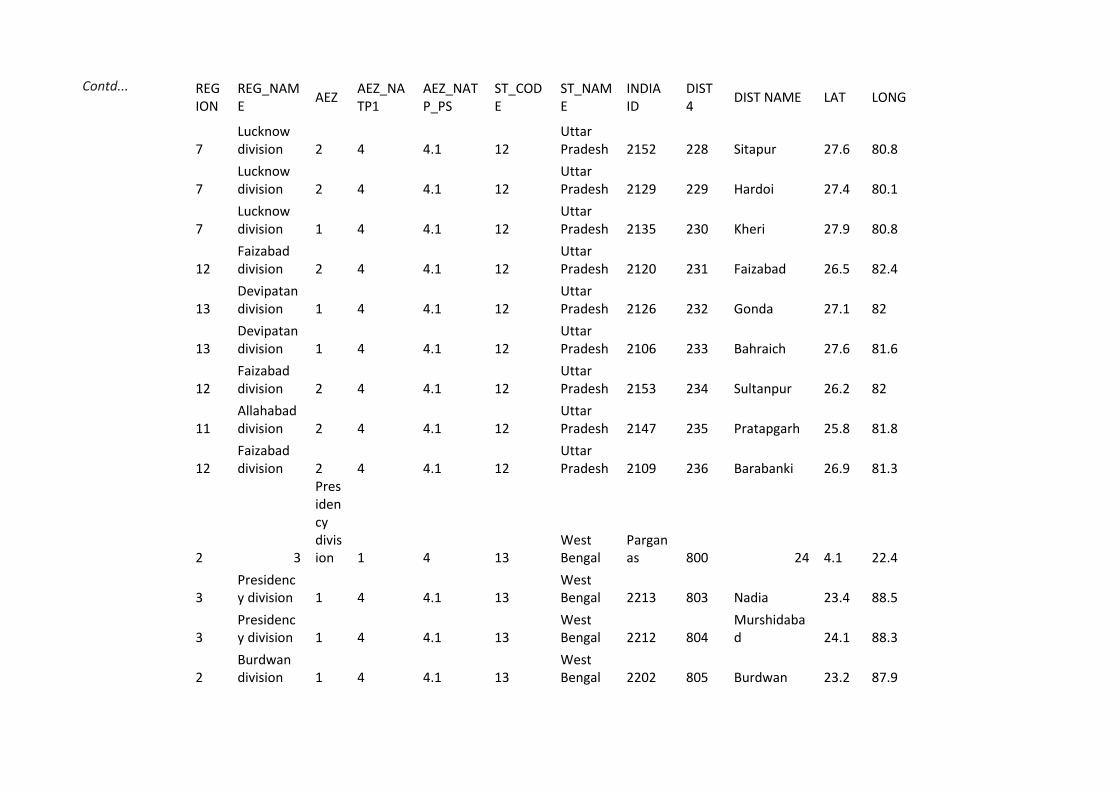
Contd...
REGION
REG_NAME
AEZ AEZ_NATP1
AEZ_NATP_PS
ST_CODE
ST_NAME
INDIA ID
DIST4
DIST NAME LAT LONG
7 Lucknow division 2 4 4.1 12
Uttar Pradesh 2152 228 Sitapur 27.6 80.8
7 Lucknow division 2 4 4.1 12
Uttar Pradesh 2129 229 Hardoi 27.4 80.1
7 Lucknow division 1 4 4.1 12
Uttar Pradesh 2135 230 Kheri 27.9 80.8
12 Faizabad division 2 4 4.1 12
Uttar Pradesh 2120 231 Faizabad 26.5 82.4
13 Devipatan division 1 4 4.1 12
Uttar Pradesh 2126 232 Gonda 27.1 82
13 Devipatan division 1 4 4.1 12
Uttar Pradesh 2106 233 Bahraich 27.6 81.6
12 Faizabad division 2 4 4.1 12
Uttar Pradesh 2153 234 Sultanpur 26.2 82
11 Allahabad division 2 4 4.1 12
Uttar Pradesh 2147 235 Pratapgarh 25.8 81.8
12 Faizabad division 2 4 4.1 12
Uttar Pradesh 2109 236 Barabanki 26.9 81.3
2 3
Presidency division 1 4 13
West Bengal
Parganas 800 24 4.1 22.4
3 Presidency division 1 4 4.1 13
West Bengal 2213 803 Nadia 23.4 88.5
3 Presidency division 1 4 4.1 13
West Bengal 2212 804
Murshidabad 24.1 88.3
2 Burdwan division 1 4 4.1 13
West Bengal 2202 805 Burdwan 23.2 87.9

Contd...
REGION
REG_NAME
AEZ AEZ_NATP1
AEZ_NATP_PS
ST_CODE
ST_NAME
INDIA ID
DIST4
DIST NAME LAT LONG
2 Burdwan division 1 4 4.1 13
West Bengal 2203 806 Birbhum 23.7 87.7
2 Burdwan division 1 5 5.1 13
West Bengal 2201 807 Bankura 24.4 87.2
2 Burdwan division 1 4 4.1 13
West Bengal 2207 810 Hooghly 22.9 88.3
3 Presidency division 1 4 4.1 13
West Bengal 2206 811 Howrah 22.6 88
1 Jalpaiguri division 1 3 3.2 13
West Bengal 2208 812 Jalpaiguri 26.5 88.7
1 Jalpaiguri division 1 3 3.2 13
West Bengal 2205 813 Darjeeling 27.1 88.3
1 Jalpaiguri division 1 4 4.1 13
West Bengal 2210 814 Malda 25 88.1
1 Jalpaiguri division 2 5 5.1 13
West Bengal 2209 816
Cooch Behar 26 89.5
2 Burdwan division 1 5 5.1 13
West Bengal 2214 817 Purulia 23 86.4
2 Burdwan division 1 5 5.1 13
West Bengal 2211 818 Midnapur 22.4 87.3
3 Presidency division 1 5 5.1 13
West Bengal 2220 821 Kolkata 24 88
1 Jalpaiguri division 1 5 5.1 13
West Bengal 2216 822
West Dinajpur 25.5 88.4
2 Durg division 3 5 5.1 14
Chhattisgarh 1013 1 Durg 21.2 81.3
1 Bastar division 1 5 5.1 14
Chhattisgarh 1002 2 Bastar 19.1 82

Contd...
REGION
REG_NAME
AEZ AEZ_NATP1
AEZ_NATP_PS
ST_CODE
ST_NAME
INDIA ID
DIST4
DIST NAME LAT LONG
3 Raipur division 3 5 5.1 14
Chhattisgarh 1027 3 Raipur 21.2 81.7
4 Bilaspur division 3 5 5.1 14
Chhattisgarh 1006 4 Bilaspur 22.1 82.1
4 Bilaspur division 3 5 5.1 14
Chhattisgarh 1026 5 Raigarh 21.9 83.4
5 Surguja division 3 5 5.1 14
Chhattisgarh 1034 6 Surguja 23.1 83.2
4
Santhal Paragana division 3 5 5.1 15
Jharkhand 3442 910
Santhal Paragana Dumka 24.9 87.6
2
North Chotanagpur division 1 5 5.1 15
Jharkhand 3413 913 Hazaribagh 24 85.4
2
North Chotanagpur division 1 5 5.1 15
Jharkhand 3407 914 Dhanbad 23.8 86.4
3 Palamau division 3 5 5.1 15
Jharkhand 3423 915 Palamau 24.1 84.1
1
South Chotanagpur division 1 5 5.1 15
Jharkhand 3428 916 Ranchi 23.4 85
5 Kolhan division 1 5 5.1 15
Jharkhand 3436 917 Singhbhum 22.7 86
2 Kumaon division 1 3 3.3 16
Uttarakhand 2144 237 Nainital 29.5 79.7

Contd...
REGION
REG_NAME
AEZ AEZ_NATP1
AEZ_NATP_PS
ST_CODE
ST_NAME
INDIA ID
DIST4
DIST NAME LAT LONG
2 Kumaon division 1 3 3.3 16
Uttarakhand 2104 238 Almorah 29.8 79.5
2 Kumaon division 1 3 3.3 16
Uttarakhand 2146 239 Pithorgarh 30 80.4
1 Garhwal division 4 3 3.3 16
Uttarakhand 2115 240 Chamoli 30.5 79.7
1 Garhwal division 4 3 3.3 16
Uttarakhand 2156 241 Uttar Kashi 30.9 78.5
1 Garhwal division 1 3 3.3 16
Uttarakhand 2154 242
Tehri Garhwal 30.5 78.7
1 Garhwal division 1 3 3.3 16
Uttarakhand 2123 243 Garhwal 29.9 78.9
1 Garhwal division 1 3 3.3 16
Uttarakhand 2116 244 Dehradun 30.3 78
2
Uppar brahamaputra 1 3 17 Assam 3315 601 Cachar 3.2 24.5
1
Lower brahamaputra 1 5 5.1 17 Assam 3304 602 Darrang 26.9 92.2
2
Uppar brahamaputra 1 5 5.1 17 Assam 3303 603 Dibrugarh 27.3 94.5
1
Lower brahamaputra 1 5 5.1 17 Assam 3305 604 Goalpara 26.1 90.4
1
Lower brahamaputra 1 5 5.1 17 Assam 3306 605 Kamrup 26.1 91.4

Contd...
REGION
REG_NAME
AEZ AEZ_NATP1
AEZ_NATP_PS
ST_CODE
ST_NAME
INDIA ID
DIST4
DIST NAME LAT LONG
2
Uppar brahamaputra 1 3 3.2 17 Assam 3308 606
Karbi Anglong 25.5 93.3
2
Uppar brahamaputra 1 5 5.1 17 Assam 3312 607 Lakhimpur 27.1 94.1
2
Uppar brahamaputra 1 3 3.2 17 Assam 3311 608
North Cachar Hil Dima hasao 25.1 93
1
Lower brahamaputra 1 5 5.1 17 Assam 3313 609 Nagaon 26.2 92.4
2
Uppar brahamaputra 1 5 5.1 17 Assam 3314 610 Sibsagar 26.6 94.4
1 Low hills region 1 3 3.3 18
Himachal Pradesh 3701 626 Bilashpur 31.2 76.4
1 Low hills region 1 3 3.3 18
Himachal Pradesh 3702 627 Chamba 32.6 76.4
1 Low hills region 1 3 3.3 18
Himachal Pradesh 3704 629 Kangra 31.9 76.5
4
Very high hills region 1 3 3.1 18
Himachal Pradesh 3705 630 Kinnaur 31.6 78.2
2 Mid hills region 1 3 3.3 18
Himachal Pradesh 3706 631 Kullu 31.7 77

Contd...
REGION
REG_NAME
AEZ AEZ_NATP1
AEZ_NATP_PS
ST_CODE
ST_NAME
INDIA ID
DIST4
DIST NAME LAT LONG
4
Very high hills region 2 3 3.1 18
Himachal Pradesh 3707 632 Lahul & Spiti 32.4 77.5
2 Mid hills region 1 3 3.3 18
Himachal Pradesh 3711 633 Solan 30.6 76.8
3 High hills region 1 3 3.3 18
Himachal Pradesh 3708 634 Mandi 31.6 76.8
3 High hills region 1 3 3.3 18
Himachal Pradesh 3709 635 Shimla 30.9 77.6
3 High hills region 1 3 3.3 18
Himachal Pradesh 3710 636 Sirmaur 30.6 77.3
3
Travancore region(SK) 1 2 2.2 19 Kerala 4001 651 Alappuzha 9.3 76.2
1
Malabar region(NK) 1 2 2.2 19 Kerala 4002 652 Kannur 11.5 75.3
2 Kochi region(CK) 1 2 2.2 19 Kerala 4003 653 Eranakulam 10 76.2
3
Travancore region(SK) 1 2 2.2 19 Kerala 4006 655 Kottayam 9.4 76.3
1
Malabar region(NK) 1 2 2.2 19 Kerala 4007 656 Kozhikode 11.2 75.5
1
Malabar region(NK) 1 2 2.2 19 Kerala 4008 657
Malappuram 11 76.1

Contd...
REGION
REG_NAME
AEZ AEZ_NATP1
AEZ_NATP_PS
ST_CODE
ST_NAME
INDIA ID
DIST4
DIST NAME LAT LONG
2 Kochi region(CK) 1 2 2.2 19 Kerala 4009 658 Palakkad 10.5 76.4
3
Travancore region(SK) 1 2 2.2 19 Kerala 4011 659 Kollam 8.5 76.4
2 Kochi region(CK) 1 2 2.2 19 Kerala 4012 660 Thrissur 10.3 76.2
3
Travancore region(SK) 1 2 2.2 19 Kerala 4013 661
Thiruvananthapuram 8.3 76.6
3 Telangana region 3 5 5.1 20
Telangana 3207 55 Hyderabad 17.5 78.5
3 Telangana region 3 5 5.1 20
Telangana 3216 56 Nizamabad 18.1 78.1
3 Telangana region 3 5 5.1 20
Telangana 3213 57 Medak 17.6 78
3 Telangana region 3 5 5.1 20
Telangana 3212 58
Mahabubnagar 16.7 78
3 Telangana region 3 5 5.1 20
Telangana 3214 59 Nalgonda 17.1 79.3
3 Telangana region 3 5 5.1 20
Telangana 3222 60 Warangal 18 79.6
3 Telangana region 1 5 5.1 20
Telangana 3209 61 Khammam 17.7 80.9
3 Telangana region 3 5 5.1 20
Telangana 3208 62 Karimnagar 18.4 79
3 Telangana region 3 5 5.1 20
Telangana 3208 520 Rangareddy 17.3 77.8
3 Telangana region 3 5 5.1 20
Telangana 3208 63 Adilabad 19.4 79.3

Contd...
1 AEZ: Agro-Ecological Zone; Humid (LGP >180 days); 2 = Semi-Arid Temperate (LGP = 75-179 days, Temp = < 180C); 3 = Semi-Arid Tropic (LGP = 75-179 days, Temp = > 180C) and
4 = Arid (LGP = 0-74 days). 2 AEZ_NATP: Agro-Ecological Zone - National Agricultural Technology Programme; 1= Arid; 2 = Coastal; 3 = Hill & mountain; 4= Irrigated and 5 = Rainfed. 3 AEZ_NATP_PS; Agro-Ecological Zone NATP Production System; 1.1 = Pearl Millet; 1.2 = Pearl Millet-Oilseeds; 2.1 = Rice-Groundnut-Fruits; 2.2 = Coconut-Rice-Fruits; 3.1 =
Horticulture; 3.2 = Rice-Maize-Fruits; 4.1 = Rice-Wheat; 4.2 = Cotton-Wheat; 4.3 = Sugarcane-Wheat; 5.1 = Rice; 5.2 = Coarse cereal; 5.3 = Oilseed and 5.4 = Cotton 4 DIST : District code;