update from the third party working party · moj, laspo & medco technology market premium rates...
TRANSCRIPT

Update from the Third Party Working PartySimon Black (Aviva)Robert Treen (Willis Towers Watson)
23 June 2017

DisclaimerThis handout and presentation represents the personal views of the speaker who does not accept any liability for reliance on it and make no warranty as to its content or accuracy.
This handout supports the research effort of the Institute and Faculty of Actuaries Third Party Working Party and is not written advice directed at the particular facts and circumstances of any given situation and/or data.
The materials contained in this presentation pack and any oral representation of it by the working party are explicitly outside the scope of the TAS.
2

Third Party Working Party
• Eighth iteration of the Institute and Faculty of Actuaries Third Party Working Party (TPWP), which investigates third party motor claims (injury and property damage)
• Scope focussed on private car comprehensive (PCC) including geographical analysis
• Data representing earned premium for accident year 2016 of £9.0 billion for private car comprehensive
• This pack represents the first stage of this year’s research that we anticipate presenting at the GIRO conference in October 2017
3

AcknowledgementsWorking Party:
Simon Black (Chair)Stephen DobbsJacqui DraperAndrew HancockYan LiuThomas ScalesKlaas SijbrandijCarley SaundersGlen D’SouzaChris ThompsonRichard TownsendRobert Treen
Data contributors:
AcromasAdmiralAdvantageAgeasAllianzAvivaAXACo-op InsuranceCoveaDirect Line GroupesureGroupamaLV=RSATesco UnderwritingZenithZurich
4

Market statisticsNotes on data• The collection of contributing insurers has changed materially over the years. Relative to last year’s study this year’s includes
additional data from some contributors (generally relating to more accounts) and, in some cases, less data from other contributors.
• In addition, in each year it is common for a number of insurers to make relatively subtle changes to their definitions of claim statistics. In the aggregate, these lead to distortions when comparing the market studies between different years.
• Not all contributors are able to supply data to support every claim statistic in each study. There are generally (but not always) improvements in the availability of data from year to year, and as such, the results of the most recent study will be based upondata from an increased proportion of the contributor companies (and not just new contributors). Again, this introduces a material distortion into any analysis which attempts to compare the results across different studies.
• It is reasonably common for insurers to restate the claims statistics of prior accident years (and prior periods of development), particularly in the case where portfolios (including movements on prior year liabilities) have been acquired or disposed of by the contributor(s) in question. Other reasons for such changes can be changes in the availability of granular data pertaining to(potentially large) segments of portfolios (such as in the case where data is provided by bordereaux rather than being integrated in insurer administration systems) or in some cases changes in the mapping of data to classes.
• For this reason, we would recommend that if the user of the research wishes to understand how trends have evolved over time, then they should focus on looking at trends by accident year within the latest study, rather than attempting to comparethe results across studies.
• Likewise we do not consider statistically valid any back engineering of individual contributors’ contributions.
5

23 June 2017 6
1. Scene Setting2. Market Statistics: TPPD3. Market Statistics: TPI4. Market Statistics: Geography5. Conclusions

FCA uncertainty: big data, add-ons; competitionCORs remain challenging Low investment returnsCMC developments and ABSsBrexit and ensuing political uncertaintyThird party repair models
PPO Propensity Whiplash reformsMoJ, LASPO & MedcoTechnologyMarket premium rates(1)
Scene SettingSummary
• While the impact of the Ogden rate change to the Motor insurance industry is significant, this presentation covers only TPPD and small injury claims with data provided as at 31 December 2016. As such the impact of the Ogden rate change is not considered in detail.
• Motor environment continues to evolve rapidly: with both tailwinds and headwinds from the insurer’sperspective:
23 June 2017 7
Sources1. Confused.com Insurance Price Index shows PCC rates increased by 16% in 12 months to end March 2017 2. EY Analysis of AM Best data 3. http://www.oft.gov.uk/shared_oft/market-studies/private-motor-insurance/Motor_Insurance.pdf
• PRA returns for 2016 show a net COR of 109% as against 100% in 2015 on a financial year basis. The impact of the Ogden rate change was estimated to be 9%(2) , however it is unclear whether all companies year end figures will have included the additional cost of the reduction to -0.75%.
• Our study covers the cost of third party claims, which make up 70% of motor insurance claims costs – the OFT figures cite 50% for TPI, 20% for TPPD. (3)
• TPWP therefore focuses on the most material and analytically problematic areas of cost, in order to provide information to help actuaries, consumers, regulators and companies make informed decisions.

Scene SettingMotor Premium Rate Movements
23 June 2017 8
• The Confused.com Car Insurance Price Index shows that PCC premiums began to increase slowly in the second half 2014.
• In 2017 Q1 premium rates were 2% higher than the previous quarter, 16% higher than a year previously and 32% higher than two years ago.
-10.0%
-5.0%
0.0%
5.0%
10.0%
15.0%
20.0%
25.0%
30.0%
0
0.2
0.4
0.6
0.8
1
1.2
1.4
1.6
1.8
2008
Q1
2008
Q2
2008
Q3
2008
Q4
2009
Q1
2009
Q2
2009
Q3
2009
Q4
2010
Q1
2010
Q2
2010
Q3
2010
Q4
2011
Q1
2011
Q2
2011
Q3
2011
Q4
2012
Q1
2012
Q2
2012
Q3
2012
Q4
2013
Q1
2013
Q2
2013
Q3
2013
Q4
2014
Q1
2014
Q2
2014
Q3
2014
Q4
2015
Q1
2015
Q2
2015
Q3
2015
Q4
2016
Q1
2016
Q2
2016
Q3
2016
Q4
2017
Q1
Qua
rter
ly %
Cha
nge
Confused.com Car Insurance Price Index
Quarterly % Change Index

23 June 2017 9
1. Scene Setting2. Market Statistics: TPPD3. Market Statistics: TPI4. Market Statistics: Geography5. Conclusions

Source: https://www.gov.uk/government/collections/road-congestion-and-reliability-statistics#publications-2017https://www.gov.uk/government/organisations/department-for-transport/about/statisticshttps://data.gov.uk/dataset/road-accidents-safety-data
23 June 2017 10
Annual Vehicle Miles driven have increased to an all-time high…
..But reported Stats19 accidents have reduced…
• Total number of accidents reported, according to stats 19 data, has been generally dropping during this same period.
• An increasing proportion of these reported accidents involve vans & pedal-cyclists, though the latter appeared to drop down slightly in 2015.
• Cyclist annual mileage stats are not captured within the stats shown on the left, but this could be the driver of the increase seen here.
• Total number of miles driven per year has been increasing steadily, at around 2% p.a. for the last 4 years.
• Light commercial vans have shown the fastest rate of growth, increasing by 4.5% in each of the last two years.
• Congestion (measured here as the inverse of average speed during morning weekday hours) has been increasing at a similar rate.
Market StatisticsMileage and Stats 19

23 June 2017 11
The recent fall and subsequent rise in petrol prices does not appear to have had a material impact on trends in miles driven
Source: https://www.gov.uk/government/statistical-data-sets/oil-and-petroleum-products-weekly-statistics/
Market StatisticsMileage and petrol prices

Market statisticsClaim frequency (excluding nils)
23 June 2017 12
From 2008 to 2013 TPPD frequency fell from 4.1% to 2.8%, a drop of 32%.
This is typically attributed to improvements in road and car safety.
However, as shown on the graph, since 2013 TPPD frequency has remained unchanged.
Potentially, improvement in road and car safety have been offset by increases in overall mileage and congestion resulting in the flat frequency trend in recent years.
0.0%
0.5%
1.0%
1.5%
2.0%
2.5%
3.0%
3.5%
3 6 9 12 15 18 21 24 27 30 33 36 39 42 45 48Development month
2013
2014
2015
2016
Annual Percentage Change15-16: 0.4% 14-15: -0.1% 13-14: 0.9%
Reported Claim Frequency (exc nils)Private Car Comp - TPPD
Rep
orte
d C
laim
Fre
quen
cy (e
xc n
ils)

Market statisticsIncurred average Cost (excluding nils)
23 June 2017 13
Incurred severity inflation estimated to be 5% in 2014 and 2015 and 3.5% in 2016.
This is considerably higher than price inflation due to:
• Escalation of third party repair models following the Coles vs Hethertonruling.
• Increasing vehicle complexity and repair costs.
There appears to be some evidence of weakening in case reserves:
• The incurred inflation severity for accident year 2015 has increased over the past year from 2.9% to 5%.
• As shown on the graph the starting severity for years 2012 to 2016 are similar at around £2000. This suggests that standard case reserves have not been adjusted for inflation.
0
500
1,000
1,500
2,000
2,500
3,000
3 6 9 12 15 18 21 24 27 30 33 36 39 42 45 48 51 54 57 60 63 66 69 72Development month
2008
2009
2010
2011
2012
2013
2014
2015
2016
15-16: 3.6% 14-15: 5% 13-14: 4.6% 12-13: 1.6% 11-12: 8.1% 10-11: 7% 09-
Incurred Average Cost - per claim (exc nils)Private Car Comp - TPPD
15-16: 3.6% 14-15: 5% 13-14: 4.6% 12-13: 1.6% 11-12: 8.1% 10-11: 7% 09-10: 4% 08-09: 2.6% Annual Percentage Change
Incu
rred
Ave
rage
Cos
t -pe
r cla
im (e
xc n
ils)

Market statisticsSettled average Cost (excluding nils)
23 June 2017 14
Settled inflation consistent with incurred inflation in 2014 and 2015 but higher in 2016 at 7.3% (vs 3.6%).
If case reserves are weakening then the true 2016 inflation may be closer to the settled inflation rather than incurred inflation.
0
500
1,000
1,500
2,000
2,500
3 6 9 12 15 18 21 24 27 30 33 36 39 42 45 48 51 54 57 60 63 66 69 72Development month
2008
2009
2010
2011
2012
2013
2014
2015
2016
15-16: 7.3% 14-15: 5.2% 13-14: 5% 12-13: 1.9% 11-12: 9.3% 10-11: 9.2% 09-
Average Cost of Settled Claims - per claim (exc nils)Private Car Comp - TPPD
15-16: 7.3% 14-15: 5.2% 13-14: 5% 12-13: 1.9% 11-12: 9.3% 10-11: 9.2% 09-10: 5.2% 08-09: 2.1% Annual Percentage Change
Aver
age
Cos
t of S
ettle
d C
laim
s -p
er c
laim
(exc
nils
)

Market statisticsSettlement Rate and Paid to Incurred Ratio
23 June 2017 15
Both settlement rate and paid to incurred ratio have reduced in 2016.
The reduction in paid to incurred ratio is lower than the reduction in settlement rate which supports the supposition of a reduction in case reserve strength across the market as a whole.
0%
20%
40%
60%
80%
100%
120%
3 6 9 12 15 18 21 24 27 30 33 36 39Development month
2013
2014
2015
2016
15-16: -2% 14-15: 0.1% 13-14: 0.1% 12-13: 0.3% 11-12: 0.1%
Paid to Incurred RatioPrivate Car Comp - TPPD
15-16: -2% 14-15: 0.1% 13-14: 0.1%Annual Percentage
0%
20%
40%
60%
80%
100%
120%
3 6 9 12 15 18 21 24 27 30 33 36 39Development month
2013
2014
2015
2016
15-16: -6.7% 14-15: 1% 13-14: 0.4% 12-13: 0.6% 11-12: 0.3%
Claim Settlement Rate (exc nils)Private Car Comp - TPPD
15-16: -6.7% 14-15: 1% 13-14: 0.4% Annual Percentage

Market statisticsIncurred burning cost
16 June 2017 16
Overall the recent high levels of severity inflation have outweighed the benefits from falling frequency from 2008 to 2013 with the incurred burning cost higher in 2016 than all previous years (at the same point in development).
40
45
50
55
60
65
70
75
80
3 6 9 12 15 18 21 24 27 30 33 36 39Development month
2010
2011
2012
2013
2014
2015
2016
Annual Percentage Change15-16: 4.1% 14-15: 4.9% 13-14: 5.8% 12-13: -3.4% 11-12: 0.6% 10-11: -10.7% 09-10: -3% 08-09: 1.2%
Incurred Burning CostPrivate Car Comp - TPPD
Incu
rred
Bur
ning
Cos
t

23 June 2017 17
1. Scene Setting2. Market Statistics: TPPD3. Market Statistics: TPI4. Market Statistics: Geography5. Conclusions

0
500
1000
1500
2000
2500
3000
0
10,000
20,000
30,000
40,000
50,000
60,000
70,000
80,000
90,000
100,000
Jan Apr Jul Oct Jan Apr Jul Oct Jan Apr Jul Oct Jan Apr Jul Oct Jan Apr Jul Oct Jan Apr Jul Oct Jan
Aver
age G
ener
al D
amag
es (£
)
Num
ber o
f CNF
s ent
erin
g the
por
tal
MoJ Portal Notifications and GD payments
Portal CNF Volumes Average General Damages Offered after Contribution(£)
MoJ PortalNotifications and GD payments
16 June 2017 18
• The number of claims reported through the portal has been gradually reducing since mid-2015. Overall the level of notifications in 2016 was 7% lower than in 2015. There was also a sudden fall in spring 2013 after the introduction of LASPO but levels subsequently recovered.
• Since the start of 2016, General Damage payments have been rising with rolling 12 month year on year inflation of 5.2% to April 2017. The 13th edition of the Judicial College Guidelines was published on 17th September 2015 with an average uplift of 4.7%.
• There was a marked rise from 2012 to 2014 (c 23%), in line with the expected increases from the Judicial College Guidelines for the Assessment of General Damages and the 10% uplift in general damages post-LASPO upheld by the Court of Appeal - see table below.
Port
al e
xten
sion
LASP
O in
trod
uctio
n
LASP
O o
rigin
al s
tart
dat
e
2011 2012 2013 2014 2015 2016 2017
JCB Edition
Month Published
Average Uplift
8th Sep-06 5.2%9th Sep-08 9.6%
10th Sep-10 2.8%11th Sep-12 9.0%
Laspo Apr-13 10.0%12th Sep-13 2.3%13th Sep-15 4.7%
Source: https://www.claimsportal.org.uk/about/executive-dashboard/

MoJ PortalStage 1 Exit
16 June 2017 19
Volumes of Stage 1 exits have been falling in the last two years. The pace has been accelerating with a year on year reduction in the second half of 2016 of about 10%.
Notes• These figures include;
• Claim Notification Forms that have not had a response at the end of Stage 1 – Liability• Claim Notification Forms where liability has not been accepted, and• Claim Notification Forms where liability has been accepted with contributory negligence other than a seatbelt.
• The figures do not include Claim Notification Forms that were taken out of the process using the Exit function during Stage 1.
0
5,000
10,000
15,000
20,000
25,000
30,000
35,000
Jan Apr Jul Oct Jan Apr Jul Oct Jan Apr Jul Oct Jan Apr Jul Oct Jan Apr Jul Oct Jan Apr Jul Oct Jan
No
CNFs
Leav
ing
at S
tage
1
No of CNFs Leaving the Portal at Stage 1
Port
al e
xten
sion
LASP
O in
trod
uctio
n
LASP
O o
rigin
al s
tart
dat
e
2011 2012 2013 2014 2015 2016 2017
Source: https://www.claimsportal.org.uk/about/executive-dashboard/

Market statisticsTPI Frequency (excluding nils)
23 June 2017 20
Following the introduction of LASPO in 2013 the frequency fell by 11.2%
There have been further falls in subsequent years, with a reduction of 4.1% in 2016.
This reduction is in line with the reduction seen within Portal notifications.
It is unclear what is causing this reduction in frequency, especially as TPPD frequency is not falling.
Possible reasons include a favourable impact from MedCoand solicitors moving into other lines of business.
0.0%
0.2%
0.4%
0.6%
0.8%
1.0%
1.2%
1.4%
3 6 9 12 15 18 21 24 27 30 33 36 39 42 45 48Development month
2010
2011
2012
2013
2014
2015
2016
Annual Percentage Change15-16: -4.1% 14-15: -3% 13-14: -0.9% 12-13: -11.2% 11-12: 1.1% 10-11: -1.6% 09-10: 4% 08-09: 6.8%
Reported Claim Frequency (exc nils)Private Car Comp - TPI Capped
Rep
orte
d C
laim
Fre
quen
cy (e
xc n
ils)

Market statisticsRatio of TPI to TPPD claim numbers (excluding nils)
23 June 2017 21
Huge increase in proportion of claims with injury element from under 25% in 2007 to over 40% in 2012.
The environment has changed significantly from that point, mainly as a result of LASPO and related reforms.
TPI to TPPD ratio in 2016 is 4.5% lower than in 2015.
0.0%
5.0%
10.0%
15.0%
20.0%
25.0%
30.0%
35.0%
40.0%
45.0%
3 6 9 12 15 18 21 24 27 30 33 36 39 42 45 48 51 54 57 60 63 66 69 72
Rep
orte
d C
laim
Num
bers
(exc
nils
) -TP
I/TPP
D R
atio
Development month
2008
2009
2010
2011
2012
2013
2014
2015
2016
15-16: -4.5% 14-15: -2.9% 13-14: -1.8% 12-13: -6.2% 11-12: 8.9% 10-11: 17.6% 09-10: 10.5% 08-09: 9.2%
Reported Claim Numbers (exc nils) - TPI/TPPD RatioPrivate Car Comp - TPI Capped
Annual Percentage Change

Market statisticsTPI Capped Incurred Average Cost (excluding nils)
23 June 2017 22
Incurred average cost reduced by 7.4% in 2013 following the introduction of LASPO.
Post LASPO the severity inflation has remained benign.
7,000
7,500
8,000
8,500
9,000
9,500
10,000
3 6 9 12 15 18 21 24 27 30 33 36 39 42 45 48 51 54 57 60 63 66 69 72Development month
2009
2010
2011
2012
2013
2014
2015
2016
15-16: 0.7% 14-15: -1.1% 13-14: -1.1% 12-13: -7.4% 11-12: 0% 10-11: 1.1%
Incurred Average Cost - per claim (exc nils)Private Car Comp - TPI Capped
15-16: 0.7% 14-15: -1.1% 13-14: -1.1% 12-13: -7.4% 11-12: 0% 10-11: 1.1% 09-10: -2.3% 08-09: 9.4% Annual Percentage Change
Incu
rred
Ave
rage
Cos
t -pe
r cla
im (e
xc n
ils)

Market statisticsClaimants per claim (excluding nils)
23 June 2017 23
The number of claimants per claim has fallen in the years following LASPO which has resulted in a lower TPI capped inflation rate.
There has been small levels of inflation per claimant in the last few years, mainly driven by increases in general damages as seen in the Portal data.
1.3
1.4
1.4
1.5
1.5
1.6
1.6
1.7
1.7
3 6 9 12 15 18 21 24 27 30 33 36 39 42 45 48
Rep
orte
d C
laim
ants
per
Cla
im (e
xc n
ils)
Development month
2013
2014
2015
2016
Annual Percentage Change15-16: -1.6% 14-15: -2% 13-14: -2.5% 12-13: -1.7% 11-12: 0.4%
Reported Claimants per Claim (exc nils)Private Car Comp - TPI Capped
15-16: -1.6% 14-15: -2% 13-14: -2.5% 12-13: -1.7% 11-12: 0.4%
Reported Claimants per Claim (exc nils)Private Car Comp - TPI Capped
Annual Percentage Change
4,000
4,500
5,000
5,500
6,000
6,500
7,000
3 6 9 12 15 18 21 24 27 30 33 36 39 42 45 48
Incu
rred
Ave
rage
Cos
t -pe
r cla
iman
t (ex
c ni
ls)
Development month
2013
2014
2015
2016
Annual Percentage Change15-16: 2.5% 14-15: 0% 13-14: 1.7% 12-13: -4.6% 11-12: -1.2%
Incurred Average Cost - per claimant (exc nils)Private Car Comp - TPI Capped
15-16: 2.5% 14-15: 0% 13-14: 1.7% 12-13: -4.6% 11-12: -1.2%
Incurred Average Cost - per claimant (exc nils)Private Car Comp - TPI Capped
Annual Percentage Change

Market statisticsPaid to incurred ratio
23 June 2017 24
As noted in previous studies there has been a significant reduction in paid to incurred ratio post LASPO despite settlement rates being largely unchanged.
0%
20%
40%
60%
80%
100%
120%
3 6 9 12 15 18 21 24 27 30 33 36 39 42 45 48 51 54 57 60 63 66 69 72
Paid
to In
curr
ed R
atio
(Hal
f Yea
r)
Development month
2010 H1
2010 H2
2011 H1
2011 H2
2012 H1
2012 H2
2013 H1
2013 H2
2014 H1
2014 H2
2015 H1
2015 H2
2016 H1
2016 H2
H1 : 15-16: -4.4% 14-15: -0.8% 13-14: -3.6% 12-13: -2.2% 11-12: 0.3% 10-11: -
Paid to Incurred Ratio (Half Year)Private Car Comp - TPI Capped
H1 : 15-16: -4.4% 14-15: -0.8% 13-14: -3.6% 12-13: -2.2% 11-12: 0.3% 10-11: -0.2%
Paid to Incurred Ratio (Half Year)Private Car Comp - TPI Capped
Annual Percentage Change
H2 : 15-16: -7.2% 14-15: -2% 13-14: -0.1% 12-13: -4% 11-12: -0.2% 10-11: 0.4%

Market statisticsIncurred burning cost
16 June 2017 25
The LASPO reforms resulted in a reduction in burning cost of 17% in 2013.
There have been further reductions in burning cost into 2016, mainly as a result of falling frequency and claimants per claim.
0
20
40
60
80
100
120
140
3 6 9 12 15 18 21 24 27 30 33 36 39 42 45 48 51 54 57 60 63 66 69 72Development month
2009
2010
2011
2012
2013
2014
2015
2016
Annual Percentage Change15-16: -3.3% 14-15: -4.2% 13-14: -1.7% 12-13: -17.1% 11-12: 1.5% 10-11: -1.1% 09-10: -0.3% 08-09:
Incurred Burning CostPrivate Car Comp - TPI Capped
Incu
rred
Bur
ning
Cos
t

23 June 2017 26
1. Scene Setting2. Market Statistics: TPPD3. Market Statistics: TPI4. Market Statistics: Geography5. Conclusions

Market statisticsTPI to TPD Ratio (excluding nils)
16 June 2017 27
North-west
North-east
Midlands
South-east
East
West
Wales
Scotland
The North West remains the region with the highest TPI to TPPD ratio with Liverpool the town with the highest rate.
Scotland and the West of England have the lowest ratios.
Liverpool
Birmingham
LeedsLondon NW
Swansea
EdinburghExeter
0%
10%
20%
30%
40%
50%
60%
1% 2% 3% 4% 5% 6% 7%
TPI/T
PPD
Rat
io
TPPD Frequency
2016 TPI/TPPD Ratio exc nils

Market statisticsChange in TPI to TPPD Ratio (excluding nils)
23 June 2017 28
North-west
North-east
Midlands
South-east
East
West
Wales
Scotland
This graph compares the change in TPI to TPPD ratio from 2012 to 2016 for each town to the reduction seen in the market as a whole
It does appear that the worst areas have seen a larger reduction in TPI to TPPD ratio from the pre LASPO period (2012) to 2016.
Scotland has seen a considerably lower reduction in TPI to TPPD ratio than the rest of the UK.
Liverpool
Oldham
Cardiff
Edinburgh
-75%
-55%
-35%
-15%
5%
25%
45%
65%
0% 10% 20% 30% 40% 50% 60% 70% 80%
2012 TPI to TPD Ratio
Relative change in TPI/TPPD Ratio exc nils - 2012 to 2016

Market statisticsBy Region
23 June 2017 29
Region TPPD Frequencyexc nils
TPI Frequency exc nils
TPI toTPPD excnils
North-west 3.4% 1.4% 40.4%
North-east 3.1% 1.1% 34.2%
South-east 4.0% 1.1% 29.0%
Midlands 3.5% 1.1% 32.4%
Wales 2.9% 0.9% 31.2%
East 3.1% 0.8% 26.5%
West 3.0% 0.7% 23.2%
Scotland 3.0% 0.7% 23.1%
2016 accident yearRegion TPPD
Frequencyexc nils
TPI Frequency exc nils
TPI toTPPD excnils
North-west 0.5% -3.0% -3.5%
North-east -3.6% -7.1% -3.6%
South-east 1.4% -3.4% -4.8%
Midlands 0.5% -5.5% -5.9%
Wales -0.7% -8.9% -8.3%
East 1.6% 0.4% -1.2%
West 1.2% -1.2% -2.3%
Scotland -0.1% -6.1% -6.0%
Change from 2015 accident year
Note that 2016 results are 12 months developed and that ‘Change from 2015 accident year’ results are based on position of the 2016 and 2015 accident year at 12 months developed

23 June 2017 30
1. Scene Setting2. Market Statistics: TPPD3. Market Statistics: TPI4. Market Statistics: Geography5. Conclusions

Conclusions
23 June 2017 31
• TPPD – Following reductions in frequency of 32% from 2008 to 2013, frequency has remained flat
from 2013 to 2016.
– Severity inflation is running between 3.5% and 7.5% in 2016.
– There is some evidence of weakening in case reserve strength in the market.
• TPI Capped– There have been further reductions in frequency in 2015 and 2016 of 3% and 4% despite
no reductions in TPPD frequency in those periods.
– Severity inflation has been relatively flat in the last three years with reductions in claimants per claim offsetting inflation in general damages.
• Geography– Areas with the highest propensity to claim have seen the biggest reductions in TPI to
TPPD ratio post LASPO.

23 June 2017 32
Appendix

Market statisticsClaim frequency (excluding nils)
16 June 2017 33
0.0%
0.5%
1.0%
1.5%
2.0%
2.5%
3.0%
3.5%
4.0%
4.5%
5.0%
3 6 9 12 15 18 21 24 27 30 33 36 39 42 45 48 51 54 57 60 63 66 69 72Development month
2008
2009
2010
2011
2012
2013
2014
2015
2016
Annual Percentage Change15-16: 0.4% 14-15: -0.1% 13-14: 0.9% 12-13: -5.4% 11-12: -7.2% 10-11: -16.4% 09-10: -5.9% 08-09: -2.2%
Reported Claim Frequency (exc nils)Private Car Comp - TPPD
Rep
orte
d C
laim
Fre
quen
cy (e
xc n
ils)

Market statisticsClaim frequency (including nils)
16 June 2017 34
0.0%
1.0%
2.0%
3.0%
4.0%
5.0%
6.0%
7.0%
3 6 9 12 15 18 21 24 27 30 33 36 39 42 45 48 51 54 57 60 63 66 69 72Development month
2008
2009
2010
2011
2012
2013
2014
2015
2016
Annual Percentage Change15-16: 0.1% 14-15: 0.1% 13-14: 0.4% 12-13: -3% 11-12: -3.7% 10-11: -15.3% 09-10: -5.9% 08-09: -2.3%
Reported Claim Frequency (inc nils)Private Car Comp - TPPD
Rep
orte
d C
laim
Fre
quen
cy (i
nc n
ils)

Market statisticsSettled at Nil %
16 June 2017 35
0%
5%
10%
15%
20%
25%
30%
35%
40%
3 6 9 12 15 18 21 24 27 30 33 36 39 42 45 48 51 54 57 60 63 66 69 72Development month
2008
2009
2010
2011
2012
2013
2014
2015
2016
15-16: -3.7% 14-15: 0.6% 13-14: -2.1% 12-13: 4.2% 11-12: 8.7% 10-11: 4.3%
Settled at Nil %Private Car Comp - TPPD
15-16: -3.7% 14-15: 0.6% 13-14: -2.1% 12-13: 4.2% 11-12: 8.7% 10-11: 4.3% 09-10: 1.3% 08-09: -1% Annual Percentage Change
Settl
ed a
t Nil
%

Market statisticsIncurred average Cost (excluding nils)
16 June 2017 36
0
500
1,000
1,500
2,000
2,500
3,000
3 6 9 12 15 18 21 24 27 30 33 36 39 42 45 48 51 54 57 60 63 66 69 72Development month
2008
2009
2010
2011
2012
2013
2014
2015
2016
15-16: 3.6% 14-15: 5% 13-14: 4.6% 12-13: 1.6% 11-12: 8.1% 10-11: 7% 09-
Incurred Average Cost - per claim (exc nils)Private Car Comp - TPPD
15-16: 3.6% 14-15: 5% 13-14: 4.6% 12-13: 1.6% 11-12: 8.1% 10-11: 7% 09-10: 4% 08-09: 2.6% Annual Percentage Change
Incu
rred
Ave
rage
Cos
t -pe
r cla
im (e
xc n
ils)

Market statisticsIncurred average Cost (excluding nils)
16 June 2017 37
0
500
1,000
1,500
2,000
2,500
3,000
3 6 9 12 15 18 21 24 27 30 33 36 39 42 45 48 51 54 57 60 63 66 69 72
Incu
rred
Ave
rage
Cos
t -pe
r cla
im (e
xc n
ils) (
Hal
f Yea
r)
Development month
2010 H1
2010 H2
2011 H1
2011 H2
2012 H1
2012 H2
2013 H1
2013 H2
2014 H1
2014 H2
2015 H1
2015 H2
2016 H1
2016 H2
H1 : 15-16: 3.9% 14-15: 4.8% 13-14: 4.3% 12-13: 1.6% 11-12: 9.8% 10-11:
Incurred Average Cost - per claim (exc nils) (Half Year)Private Car Comp - PD
H1 : 15-16: 3.9% 14-15: 4.8% 13-14: 4.3% 12-13: 1.6% 11-12: 9.8% 10-11: 4.9%
Incurred Average Cost - per claim (exc nils) (Half Year)Private Car Comp - PD
Annual Percentage Change
H2 : 15-16: 2.3% 14-15: 5.2% 13-14: 4.9% 12-13: 1.6% 11-12: 6.3% 10-11: 9.2%

Market statisticsIncurred average Cost (excluding nils)
16 June 2017 38
0
500
1,000
1,500
2,000
2,500
3 6 9 12 15 18 21 24 27 30 33 36 39 42 45 48 51 54 57 60 63 66 69 72Development month
2008
2009
2010
2011
2012
2013
2014
2015
2016
15-16: 5.1% 14-15: 4.8% 13-14: 5% 12-13: -0.5% 11-12: 5.1% 10-11: 5% 09-
Incurred Average Cost - per claim (inc nils)Private Car Comp - TPPD
15-16: 5.1% 14-15: 4.8% 13-14: 5% 12-13: -0.5% 11-12: 5.1% 10-11: 5% 09-10: 3.2% 08-09: 4.3% Annual Percentage Change
Incu
rred
Ave
rage
Cos
t -pe
r cla
im (i
nc n
ils)

Market statisticsSettled average Cost (excluding nils)
16 June 2017 39
0
500
1,000
1,500
2,000
2,500
3 6 9 12 15 18 21 24 27 30 33 36 39 42 45 48 51 54 57 60 63 66 69 72Development month
2008
2009
2010
2011
2012
2013
2014
2015
2016
15-16: 7.3% 14-15: 5.2% 13-14: 5% 12-13: 1.9% 11-12: 9.3% 10-11: 9.2% 09-
Average Cost of Settled Claims - per claim (exc nils)Private Car Comp - TPPD
15-16: 7.3% 14-15: 5.2% 13-14: 5% 12-13: 1.9% 11-12: 9.3% 10-11: 9.2% 09-10: 5.2% 08-09: 2.1% Annual Percentage Change
Aver
age
Cos
t of S
ettle
d C
laim
s -p
er c
laim
(exc
nils
)

Market statisticsSettled average Cost (excluding nils)
16 June 2017 40
0
500
1,000
1,500
2,000
2,500
3 6 9 12 15 18 21 24 27 30 33 36 39 42 45 48 51 54 57 60 63 66 69 72
Ave
rage
Cos
t of S
ettle
d C
laim
s -p
er c
laim
(exc
nils
) (H
alf Y
ear)
Development month
2010 H1
2010 H2
2011 H1
2011 H2
2012 H1
2012 H2
2013 H1
2013 H2
2014 H1
2014 H2
2015 H1
2015 H2
2016 H1
2016 H2
H1 : 15-16: 5.3% 14-15: 5.3% 13-14: 4.8% 12-13: 1.6% 11-12: 12.1% 10-11:
Average Cost of Settled Claims - per claim (exc nils) (Half Year)Private Car Comp - PD
H1 : 15-16: 5.3% 14-15: 5.3% 13-14: 4.8% 12-13: 1.6% 11-12: 12.1% 10-11: 6.7%
Average Cost of Settled Claims - per claim (exc nils) (Half Year)Private Car Comp - PD
Annual Percentage Change
H2 : 15-16: 5.5% 14-15: 5% 13-14: 5.2% 12-13: 2.2% 11-12: 6.7% 10-11: 11.7%

Market statisticsSettled average Cost (including nils)
16 June 2017 41
0
200
400
600
800
1,000
1,200
1,400
1,600
3 6 9 12 15 18 21 24 27 30 33 36 39 42 45 48 51 54 57 60 63 66 69 72Development month
2008
2009
2010
2011
2012
2013
2014
2015
2016
15-16: 6.2% 14-15: 4.7% 13-14: 5.1% 12-13: -0.2% 11-12: 5.9% 10-11: 6.3%
Average Cost of Settled Claims - per claim (inc nils)Private Car Comp - TPPD
15-16: 6.2% 14-15: 4.7% 13-14: 5.1% 12-13: -0.2% 11-12: 5.9% 10-11: 6.3% 09-10: 3.3% 08-09: 4.3% Annual Percentage Change
Aver
age
Cos
t of S
ettle
d C
laim
s -p
er c
laim
(inc
nils
)

Market statisticsSettlement Rate (excluding nils)
16 June 2017 42
0%
20%
40%
60%
80%
100%
120%
3 6 9 12 15 18 21 24 27 30 33 36 39 42 45 48 51 54 57 60 63 66 69 72Development month
2008
2009
2010
2011
2012
2013
2014
2015
2016
15-16: -6.7% 14-15: 1% 13-14: 0.4% 12-13: 0.6% 11-12: 0.3% 10-11: 0% 09-
Claim Settlement Rate (exc nils)Private Car Comp - TPPD
15-16: -6.7% 14-15: 1% 13-14: 0.4% 12-13: 0.6% 11-12: 0.3% 10-11: 0% 09-10: -0.1% 08-09: 0% Annual Percentage Change
Cla
im S
ettle
men
t Rat
e (e
xc n
ils)

Market statisticsSettlement Rate (including nils)
16 June 2017 43
0%
20%
40%
60%
80%
100%
120%
3 6 9 12 15 18 21 24 27 30 33 36 39 42 45 48 51 54 57 60 63 66 69 72Development month
2008
2009
2010
2011
2012
2013
2014
2015
2016
15-16: -3.2% 14-15: 0.6% 13-14: 0.2% 12-13: 0.5% 11-12: 0.2% 10-11: 0%
Claim Settlement Rate (inc nils)Private Car Comp - TPPD
15-16: -3.2% 14-15: 0.6% 13-14: 0.2% 12-13: 0.5% 11-12: 0.2% 10-11: 0% 09-10: -0.1% 08-09: 0% Annual Percentage Change
Cla
im S
ettle
men
t Rat
e (in
c ni
ls)

Market statisticsPaid to Incurred Ratio
16 June 2017 44
0%
20%
40%
60%
80%
100%
120%
3 6 9 12 15 18 21 24 27 30 33 36 39 42 45 48 51 54 57 60 63 66 69 72Development month
2008
2009
2010
2011
2012
2013
2014
2015
2016
15-16: -2% 14-15: 0.1% 13-14: 0.1% 12-13: 0.3% 11-12: 0.1% 10-11: 0.1%
Paid to Incurred RatioPrivate Car Comp - TPPD
15-16: -2% 14-15: 0.1% 13-14: 0.1% 12-13: 0.3% 11-12: 0.1% 10-11: 0.1% 09-10: 0% 08-09: 0% Annual Percentage Change
Paid
to In
curr
ed R
atio

Market statisticsRatio of TPI to TPD claim numbers (excluding nils)
16 June 2017 45
0.0%
5.0%
10.0%
15.0%
20.0%
25.0%
30.0%
35.0%
40.0%
45.0%
3 6 9 12 15 18 21 24 27 30 33 36 39 42 45 48 51 54 57 60 63 66 69 72
Rep
orte
d C
laim
Num
bers
(exc
nils
) -TP
I/TPP
D R
atio
Development month
2008
2009
2010
2011
2012
2013
2014
2015
2016
15-16: -4.5% 14-15: -2.9% 13-14: -1.8% 12-13: -6.2% 11-12: 8.9% 10-11: 17.6% 09-10: 10.5% 08-09: 9.2%
Reported Claim Numbers (exc nils) - TPI/TPPD RatioPrivate Car Comp - TPI Capped
Annual Percentage Change

Market statisticsRatio of TPI to TPD claim numbers (including nils)
16 June 2017 46
0.0%
5.0%
10.0%
15.0%
20.0%
25.0%
30.0%
35.0%
40.0%
3 6 9 12 15 18 21 24 27 30 33 36 39 42 45 48 51 54 57 60 63 66 69 72
Rep
orte
d C
laim
Num
bers
(inc
nils
) -TP
I/TPP
D R
atio
Development month
2008
2009
2010
2011
2012
2013
2014
2015
2016
15-16: -2.5% 14-15: -2.8% 13-14: -0.1% 12-13: -4.2% 11-12: 6.8% 10-11: 13.9% 09-10: 9% 08-09: 11.4%
Reported Claim Numbers (inc nils) - TPI/TPPD RatioPrivate Car Comp - TPI Capped
Annual Percentage Change

Market statisticsTPI Frequency (excluding nils)
16 June 2017 47
0.0%
0.2%
0.4%
0.6%
0.8%
1.0%
1.2%
1.4%
3 6 9 12 15 18 21 24 27 30 33 36 39 42 45 48 51 54 57 60 63 66 69 72Development month
2008
2009
2010
2011
2012
2013
2014
2015
2016
Annual Percentage Change15-16: -4.1% 14-15: -3% 13-14: -0.9% 12-13: -11.2% 11-12: 1.1% 10-11: -1.6% 09-10: 4% 08-09: 6.8%
Reported Claim Frequency (exc nils)Private Car Comp - TPI Capped
Rep
orte
d C
laim
Fre
quen
cy (e
xc n
ils)

Market statisticsTPI Frequency (excluding nils)
16 June 2017 48
0.0%
0.2%
0.4%
0.6%
0.8%
1.0%
1.2%
1.4%
3 6 9 12 15 18 21 24 27 30 33 36 39 42 45 48 51 54 57 60 63 66 69 72
Rep
orte
d C
laim
Fre
quen
cy (e
xc n
ils) (
Hal
f Yea
r)
Development month
2010 H1
2010 H2
2011 H1
2011 H2
2012 H1
2012 H2
2013 H1
2013 H2
2014 H1
2014 H2
2015 H1
2015 H2
2016 H1
2016 H2
Annual Percentage ChangeH1 : 15-16: -4.5% 14-15: -1.8% 13-14: -1.5% 12-13: -8.2% 11-12: -0.7% 10-11: 2.5%
Reported Claim Frequency (exc nils) (Half Year)Private Car Comp - TPI Capped
H2 : 15-16: -4% 14-15: -4.2% 13-14: -0.3% 12-13: -14.1% 11-12: 2.8% 10-11: -5.2%

Market statisticsTPI Frequency (including nils)
16 June 2017 49
0.0%
0.2%
0.4%
0.6%
0.8%
1.0%
1.2%
1.4%
1.6%
3 6 9 12 15 18 21 24 27 30 33 36 39 42 45 48 51 54 57 60 63 66 69 72Development month
2008
2009
2010
2011
2012
2013
2014
2015
2016
Annual Percentage Change15-16: -3.8% 14-15: -2.3% 13-14: 0.4% 12-13: -7.1% 11-12: 2.8% 10-11: -2.8% 09-10: 2.4% 08-09: 8%
Reported Claim Frequency (inc nils)Private Car Comp - TPI Capped
Rep
orte
d C
laim
Fre
quen
cy (i
nc n
ils)

Market statisticsTPI Frequency (including nils)
16 June 2017 50
0.0%
0.2%
0.4%
0.6%
0.8%
1.0%
1.2%
1.4%
1.6%
1.8%
3 6 9 12 15 18 21 24 27 30 33 36 39 42 45 48 51 54 57 60 63 66 69 72
Rep
orte
d C
laim
Fre
quen
cy (i
nc n
ils) (
Hal
f Yea
r)
Development month
2010 H1
2010 H2
2011 H1
2011 H2
2012 H1
2012 H2
2013 H1
2013 H2
2014 H1
2014 H2
2015 H1
2015 H2
2016 H1
2016 H2
Annual Percentage ChangeH1 : 15-16: -4.3% 14-15: -0.9% 13-14: 0.2% 12-13: -4.1% 11-12: 0.8% 10-11: 0.2%
Reported Claim Frequency (inc nils) (Half Year)Private Car Comp - TPI Capped
H2 : 15-16: -3.4% 14-15: -3.6% 13-14: 0.6% 12-13: -9.8% 11-12: 4.8% 10-11: -5.5%

Market statisticsSettled at nil proportion
16 June 2017 51
0%
5%
10%
15%
20%
25%
3 6 9 12 15 18 21 24 27 30 33 36 39 42 45 48 51 54 57 60 63 66 69 72Development month
2008
2009
2010
2011
2012
2013
2014
2015
2016
15-16: 1.3% 14-15: 2.5% 13-14: 4.2% 12-13: 16.7% 11-12: 5.4% 10-11: -4.2%
Settled at Nil %Private Car Comp - TPI Capped
15-16: 1.3% 14-15: 2.5% 13-14: 4.2% 12-13: 16.7% 11-12: 5.4% 10-11: -4.2% 09-10: -2.6% 08-09: 2.5% Annual Percentage Change
Settl
ed a
t Nil
%

Market statisticsSettled at nil proportion
16 June 2017 52
0%
5%
10%
15%
20%
25%
3 6 9 12 15 18 21 24 27 30 33 36 39 42 45 48 51 54 57 60 63 66 69 72
Settl
ed a
t Nil
% (H
alf Y
ear)
Development month
2010 H1
2010 H2
2011 H1
2011 H2
2012 H1
2012 H2
2013 H1
2013 H2
2014 H1
2014 H2
2015 H1
2015 H2
2016 H1
2016 H2
H1 : 15-16: -2.1% 14-15: 3.2% 13-14: 5% 12-13: 15.2% 11-12: 5.8% 10-11: -
Settled at Nil % (Half Year)Private Car Comp - TPI Capped
H1 : 15-16: -2.1% 14-15: 3.2% 13-14: 5% 12-13: 15.2% 11-12: 5.8% 10-11: -8%
Settled at Nil % (Half Year)Private Car Comp - TPI Capped
Annual Percentage Change
H2 : 15-16: -2% 14-15: 1.6% 13-14: 3.4% 12-13: 18.2% 11-12: 4.9% 10-11: -0.7%

Market statisticsTPI Capped Incurred Average Cost(excluding nils)
16 June 2017 53
6,000
6,500
7,000
7,500
8,000
8,500
9,000
9,500
10,000
3 6 9 12 15 18 21 24 27 30 33 36 39 42 45 48 51 54 57 60 63 66 69 72Development month
2008
2009
2010
2011
2012
2013
2014
2015
2016
15-16: 0.7% 14-15: -1.1% 13-14: -1.1% 12-13: -7.4% 11-12: 0% 10-11: 1.1%
Incurred Average Cost - per claim (exc nils)Private Car Comp - TPI Capped
15-16: 0.7% 14-15: -1.1% 13-14: -1.1% 12-13: -7.4% 11-12: 0% 10-11: 1.1% 09-10: -2.3% 08-09: 9.4% Annual Percentage Change
Incu
rred
Ave
rage
Cos
t -pe
r cla
im (e
xc n
ils)

Market statisticsTPI Capped Incurred Average Cost(excluding nils)
16 June 2017 54
6,000
6,500
7,000
7,500
8,000
8,500
9,000
9,500
10,000
10,500
3 6 9 12 15 18 21 24 27 30 33 36 39 42 45 48 51 54 57 60 63 66 69 72
Incu
rred
Ave
rage
Cos
t -pe
r cla
im (e
xc n
ils) (
Hal
f Yea
r)
Development month
2010 H1
2010 H2
2011 H1
2011 H2
2012 H1
2012 H2
2013 H1
2013 H2
2014 H1
2014 H2
2015 H1
2015 H2
2016 H1
2016 H2
H1 : 15-16: -0.9% 14-15: -2% 13-14: -2.9% 12-13: -4.8% 11-12: -0.8% 10-11: -
Incurred Average Cost - per claim (exc nils) (Half Year)Private Car Comp - TPI Capped
H1 : 15-16: -0.9% 14-15: -2% 13-14: -2.9% 12-13: -4.8% 11-12: -0.8% 10-11: -0.8%
Incurred Average Cost - per claim (exc nils) (Half Year)Private Car Comp - TPI Capped
Annual Percentage Change
H2 : 15-16: 0.2% 14-15: -0.3% 13-14: 0.7% 12-13: -9.8% 11-12: 0.8% 10-11: 2.8%

Market statisticsTPI Capped Incurred Average Cost(including nils)
16 June 2017 55
6,000
6,500
7,000
7,500
8,000
8,500
9,000
3 6 9 12 15 18 21 24 27 30 33 36 39 42 45 48 51 54 57 60 63 66 69 72Development month
2008
2009
2010
2011
2012
2013
2014
2015
2016
15-16: 0.5% 14-15: -2.1% 13-14: -2.2% 12-13: -10.6% 11-12: -1.1% 10-11:
Incurred Average Cost - per claim (inc nils)Private Car Comp - TPI Capped
15-16: 0.5% 14-15: -2.1% 13-14: -2.2% 12-13: -10.6% 11-12: -1.1% 10-11: 1.8% 09-10: -2.4% 08-09: 8.8% Annual Percentage Change
Incu
rred
Ave
rage
Cos
t -pe
r cla
im (i
nc n
ils)

Market statisticsTPI Capped Incurred Average Cost (including nils)
16 June 2017 56
6,000
6,500
7,000
7,500
8,000
8,500
9,000
3 6 9 12 15 18 21 24 27 30 33 36 39 42 45 48 51 54 57 60 63 66 69 72
Incu
rred
Ave
rage
Cos
t -pe
r cla
im (i
nc n
ils) (
Hal
f Yea
r)
Development month
2010 H1
2010 H2
2011 H1
2011 H2
2012 H1
2012 H2
2013 H1
2013 H2
2014 H1
2014 H2
2015 H1
2015 H2
2016 H1
2016 H2
H1 : 15-16: -1% 14-15: -3.2% 13-14: -3.8% 12-13: -7.9% 11-12: -2.1% 10-11:
Incurred Average Cost - per claim (inc nils) (Half Year)Private Car Comp - TPI Capped
H1 : 15-16: -1% 14-15: -3.2% 13-14: -3.8% 12-13: -7.9% 11-12: -2.1% 10-11: 0.6%
Incurred Average Cost - per claim (inc nils) (Half Year)Private Car Comp - TPI Capped
Annual Percentage Change
H2 : 15-16: 0.5% 14-15: -1.1% 13-14: -0.6% 12-13: -13.1% 11-12: -0.1% 10-11: 2.8%

Market statisticsClaimants per claim (excluding nils)
12 June 2017 57
1.0
1.1
1.2
1.3
1.4
1.5
1.6
1.7
1.8
3 6 9 12 15 18 21 24 27 30 33 36 39 42 45 48 51 54 57 60 63 66 69 72
Rep
orte
d C
laim
ants
per
Cla
im (e
xc n
ils)
Development month
2007
2008
2009
2010
2011
2012
2013
2014
2015
2016
Annual Percentage Change15-16: -1.6% 14-15: -2% 13-14: -2.5% 12-13: -1.7% 11-12: 0.4%
Reported Claimants per Claim (exc nils)Private Car Comp - TPI Capped
15-16: -1.6% 14-15: -2% 13-14: -2.5% 12-13: -1.7% 11-12: 0.4%
Reported Claimants per Claim (exc nils)Private Car Comp - TPI Capped
Annual Percentage Change

Market statisticsClaimants per claim (including nils)
16 June 2017 58
1.0
1.1
1.2
1.3
1.4
1.5
1.6
1.7
1.8
3 6 9 12 15 18 21 24 27 30 33 36 39 42 45 48 51 54 57 60 63 66 69 72
Rep
orte
d C
laim
ants
per
Cla
im (i
nc n
ils)
Development month
2007
2008
2009
2010
2011
2012
2013
2014
2015
2016
Annual Percentage Change15-16: -2.5% 14-15: -1.8% 13-14: -2.7% 12-13: -1.8% 11-12: 0.9%
Reported Claimants per Claim (inc nils)Private Car Comp - TPI Capped
15-16: -2.5% 14-15: -1.8% 13-14: -2.7% 12-13: -1.8% 11-12: 0.9%
Reported Claimants per Claim (inc nils)Private Car Comp - TPI Capped
Annual Percentage Change

Market statisticsTPI Capped Settled Average Cost (excluding nils)
16 June 2017 59
0
1,000
2,000
3,000
4,000
5,000
6,000
7,000
8,000
9,000
10,000
3 6 9 12 15 18 21 24 27 30 33 36 39 42 45 48 51 54 57 60 63 66 69 72Development month
2008
2009
2010
2011
2012
2013
2014
2015
2016
15-16: -0.5% 14-15: -2% 13-14: -4.7% 12-13: -10.2% 11-12: 0.3% 10-11: 1.4%
Average Cost of Settled Claims - per claim (exc nils)Private Car Comp - TPI Capped
15-16: -0.5% 14-15: -2% 13-14: -4.7% 12-13: -10.2% 11-12: 0.3% 10-11: 1.4% 09-10: -0.3% 08-09: 8.4% Annual Percentage Change
Aver
age
Cos
t of S
ettle
d C
laim
s -p
er c
laim
(exc
nils
)

Market statisticsTPI Capped Settled Average Cost (excluding nils)
16 June 2017 60
0
1,000
2,000
3,000
4,000
5,000
6,000
7,000
8,000
9,000
10,000
3 6 9 12 15 18 21 24 27 30 33 36 39 42 45 48 51 54 57 60 63 66 69 72
Ave
rage
Cos
t of S
ettle
d C
laim
s -p
er c
laim
(exc
nils
) (H
alf Y
ear)
Development month
2010 H1
2010 H2
2011 H1
2011 H2
2012 H1
2012 H2
2013 H1
2013 H2
2014 H1
2014 H2
2015 H1
2015 H2
2016 H1
2016 H2
H1 : 15-16: 0.7% 14-15: -2.6% 13-14: -7.5% 12-13: -6.7% 11-12: -0.7% 10-11: -
Average Cost of Settled Claims - per claim (exc nils) (Half Year)Private Car Comp - TPI Capped
H1 : 15-16: 0.7% 14-15: -2.6% 13-14: -7.5% 12-13: -6.7% 11-12: -0.7% 10-11: -0.4%
Average Cost of Settled Claims - per claim (exc nils) (Half Year)Private Car Comp - TPI Capped
Annual Percentage Change
H2 : 15-16: -3% 14-15: -1.4% 13-14: -0.9% 12-13: -14% 11-12: 1.2% 10-11: 2.9%

Market statisticsTPI Capped Settled Average Cost (including nils)
16 June 2017 61
0
1,000
2,000
3,000
4,000
5,000
6,000
7,000
8,000
3 6 9 12 15 18 21 24 27 30 33 36 39 42 45 48 51 54 57 60 63 66 69 72Development month
2008
2009
2010
2011
2012
2013
2014
2015
2016
15-16: 0% 14-15: -2.7% 13-14: -4.9% 12-13: -13.8% 11-12: -1.1% 10-11: 2%
Average Cost of Settled Claims - per claim (inc nils)Private Car Comp - TPI Capped
15-16: 0% 14-15: -2.7% 13-14: -4.9% 12-13: -13.8% 11-12: -1.1% 10-11: 2% 09-10: -0.4% 08-09: 8% Annual Percentage Change
Aver
age
Cos
t of S
ettle
d C
laim
s -p
er c
laim
(inc
nils
)

Market statisticsTPI Capped Settled Average Cost (including nils)
16 June 2017 62
0
1,000
2,000
3,000
4,000
5,000
6,000
7,000
8,000
3 6 9 12 15 18 21 24 27 30 33 36 39 42 45 48 51 54 57 60 63 66 69 72
Ave
rage
Cos
t of S
ettle
d C
laim
s -p
er c
laim
(inc
nils
) (H
alf Y
ear)
Development month
2010 H1
2010 H2
2011 H1
2011 H2
2012 H1
2012 H2
2013 H1
2013 H2
2014 H1
2014 H2
2015 H1
2015 H2
2016 H1
2016 H2
H1 : 15-16: 0.9% 14-15: -3.4% 13-14: -7.8% 12-13: -10.4% 11-12: -2.3% 10-11:
Average Cost of Settled Claims - per claim (inc nils) (Half Year)Private Car Comp - TPI Capped
H1 : 15-16: 0.9% 14-15: -3.4% 13-14: -7.8% 12-13: -10.4% 11-12: -2.3% 10-11: 1.2%
Average Cost of Settled Claims - per claim (inc nils) (Half Year)Private Car Comp - TPI Capped
Annual Percentage Change
H2 : 15-16: -2.9% 14-15: -1.8% 13-14: -1.2% 12-13: -17.5% 11-12: 0% 10-11: 2.7%

Market statisticsTPI Settlement Rate (excluding nils)
16 June 2017 63
0%
20%
40%
60%
80%
100%
120%
3 6 9 12 15 18 21 24 27 30 33 36 39 42 45 48 51 54 57 60 63 66 69 72Development month
2008
2009
2010
2011
2012
2013
2014
2015
2016
15-16: 3.1% 14-15: 1% 13-14: 0.6% 12-13: -0.1% 11-12: 0.8% 10-11: 1.3%
Claim Settlement Rate (exc nils)Private Car Comp - TPI Capped
15-16: 3.1% 14-15: 1% 13-14: 0.6% 12-13: -0.1% 11-12: 0.8% 10-11: 1.3% 09-10: 0.8% 08-09: -0.6% Annual Percentage Change
Cla
im S
ettle
men
t Rat
e (e
xc n
ils)

Market statisticsTPI Settlement Rate (excluding nils)
16 June 2017 64
0%
20%
40%
60%
80%
100%
120%
3 6 9 12 15 18 21 24 27 30 33 36 39 42 45 48 51 54 57 60 63 66 69 72
Cla
im S
ettle
men
t Rat
e (e
xc n
ils) (
Hal
f Yea
r)
Development month
2010 H1
2010 H2
2011 H1
2011 H2
2012 H1
2012 H2
2013 H1
2013 H2
2014 H1
2014 H2
2015 H1
2015 H2
2016 H1
2016 H2
H1 : 15-16: -3.4% 14-15: 1.5% 13-14: -0.1% 12-13: 0% 11-12: 1.3% 10-11:
Claim Settlement Rate (exc nils) (Half Year)Private Car Comp - TPI Capped
H1 : 15-16: -3.4% 14-15: 1.5% 13-14: -0.1% 12-13: 0% 11-12: 1.3% 10-11: 0.9%
Claim Settlement Rate (exc nils) (Half Year)Private Car Comp - TPI Capped
Annual Percentage Change
H2 : 15-16: -5% 14-15: 0.1% 13-14: 1.5% 12-13: -0.3% 11-12: 0.4% 10-11: 1.6%

Market statisticsTPI Settlement Rate (including nils)
16 June 2017 65
0%
20%
40%
60%
80%
100%
120%
3 6 9 12 15 18 21 24 27 30 33 36 39 42 45 48 51 54 57 60 63 66 69 72Development month
2008
2009
2010
2011
2012
2013
2014
2015
2016
15-16: 2.6% 14-15: 1% 13-14: -0.1% 12-13: -0.9% 11-12: -0.3% 10-11: -0.1%
Claim Settlement Rate (inc nils)Private Car Comp - TPI Capped
15-16: 2.6% 14-15: 1% 13-14: -0.1% 12-13: -0.9% 11-12: -0.3% 10-11: -0.1% 09-10: -0.7% 08-09: -1.7% Annual Percentage Change
Cla
im S
ettle
men
t Rat
e (in
c ni
ls)

Market statisticsTPI Settlement Rate (including nils)
16 June 2017 66
0%
20%
40%
60%
80%
100%
120%
3 6 9 12 15 18 21 24 27 30 33 36 39 42 45 48 51 54 57 60 63 66 69 72
Cla
im S
ettle
men
t Rat
e (in
c ni
ls) (
Hal
f Yea
r)
Development month
2010 H1
2010 H2
2011 H1
2011 H2
2012 H1
2012 H2
2013 H1
2013 H2
2014 H1
2014 H2
2015 H1
2015 H2
2016 H1
2016 H2
H1 : 15-16: -2.5% 14-15: 1.3% 13-14: -1% 12-13: -0.8% 11-12: 0% 10-11: -
Claim Settlement Rate (inc nils) (Half Year)Private Car Comp - TPI Capped
H1 : 15-16: -2.5% 14-15: 1.3% 13-14: -1% 12-13: -0.8% 11-12: 0% 10-11: -0.5%
Claim Settlement Rate (inc nils) (Half Year)Private Car Comp - TPI Capped
Annual Percentage Change
H2 : 15-16: -3.4% 14-15: 0.5% 13-14: 0.8% 12-13: -1% 11-12: -0.7% 10-11: 0.3%

Market statisticsPaid to incurred ratio
16 June 2017 67
0%
20%
40%
60%
80%
100%
120%
3 6 9 12 15 18 21 24 27 30 33 36 39 42 45 48 51 54 57 60 63 66 69 72Development month
2008
2009
2010
2011
2012
2013
2014
2015
2016
15-16: 0.6% 14-15: -1.4% 13-14: -2.1% 12-13: -2.9% 11-12: 0% 10-11: 0.1%
Paid to Incurred RatioPrivate Car Comp - TPI Capped
15-16: 0.6% 14-15: -1.4% 13-14: -2.1% 12-13: -2.9% 11-12: 0% 10-11: 0.1% 09-10: 0.5% 08-09: -0.6% Annual Percentage Change
Paid
to In
curr
ed R
atio
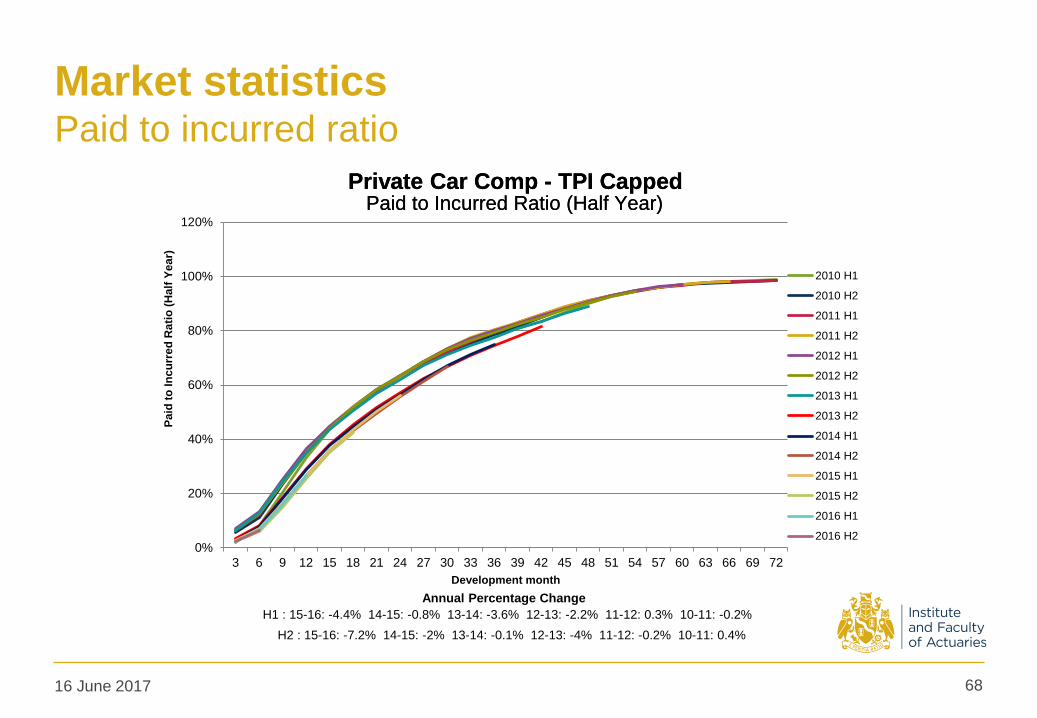
Market statisticsPaid to incurred ratio
16 June 2017 68
0%
20%
40%
60%
80%
100%
120%
3 6 9 12 15 18 21 24 27 30 33 36 39 42 45 48 51 54 57 60 63 66 69 72
Paid
to In
curr
ed R
atio
(Hal
f Yea
r)
Development month
2010 H1
2010 H2
2011 H1
2011 H2
2012 H1
2012 H2
2013 H1
2013 H2
2014 H1
2014 H2
2015 H1
2015 H2
2016 H1
2016 H2
H1 : 15-16: -4.4% 14-15: -0.8% 13-14: -3.6% 12-13: -2.2% 11-12: 0.3% 10-11: -
Paid to Incurred Ratio (Half Year)Private Car Comp - TPI Capped
H1 : 15-16: -4.4% 14-15: -0.8% 13-14: -3.6% 12-13: -2.2% 11-12: 0.3% 10-11: -0.2%
Paid to Incurred Ratio (Half Year)Private Car Comp - TPI Capped
Annual Percentage Change
H2 : 15-16: -7.2% 14-15: -2% 13-14: -0.1% 12-13: -4% 11-12: -0.2% 10-11: 0.4%