up next presentation on chia’s annual report - mass.gov deck - day one... · presentation on...
TRANSCRIPT


Up Next
Presentation on CHIA’s Annual Report
Presentation on State Perspective on Health Care Cost Trends

3
C E N T E R F O R H E A L T H I N F O R M A T I O N A N D A N A L Y S I S
Presentation to the Health Policy Commission:
CHIA’s Annual Report

4
Agenda
HPC Presentation | September 12, 2018
Overview
Total Health Care Expenditures
Public Insurance Programs
Commercial Insurance
Questions

5 HPC Presentation | September 12, 2018
CHIA’s role in establishing the metrics to evaluate the
performance of the Massachusetts health care system
Annual Report publication materials
• 100+ page report
• Extensive databooks
• Technical documentation
Acknowledgments
• Data submitters for their role in facilitating this report
through supplemental filings
• CHIA’s staff & actuaries for their work producing the report
Overview

6 For more information, see page 11 of CHIA’s Annual Report
$61.1B
$8,907
1.6%
Total Health
Care Expenditures
THCE
per capita
Growth rate
per capita
Total Health Care Expenditures (THCE)
HPC Presentation | September 12, 2018

7 For more information, see page 20 of CHIA’s Annual Report
Total Health Care Expenditures Growth Rates, 2012-2017
THE INITIAL ESTIMATE OF THCE PER CAPITA GROWTH IS 1.6% FOR 2017, THE SECOND
CONSECUTIVE YEAR IT FELL BELOW THE HEALTH CARE COST GROWTH BENCHMARK.
HPC Presentation | September 12, 2018

8 For more information, see page 12 of CHIA’s Annual Report
$61.1B Total Health
Care Expenditures
Total Health Care Expenditures Insurance Categories, 2017
Commercial
$22.8B
MassHealth
$17.2B
Medicare $17.0B
NCPHI $2.5B
Other Public $1.65B
+3.1% (2016-2017)
-0.2%
+1.9%
+10.2%
+5.3%
HPC Presentation | September 12, 2018

9 For more information, see page 18 of CHIA’s Annual Report
Total Health Care Expenditures Service Categories, 2016-2017
HEALTH CARE SPENDING DECELERATED ACROSS ALL SERVICE CATEGORIES, WITH THE
HIGHEST GROWTH IN PHARMACY AND OUTPATIENT SPENDING.
HPC Presentation | September 12, 2018

10 For more information, see page 50 of CHIA’s Annual Report
Alternative Payment Methods Insurance Categories, 2015-2017
IN 2017, THE LARGEST INCREASE IN APM ADOPTION RATES WAS IN THE
MASSHEALTH PCC PLAN.
HPC Presentation | September 12, 2018

11 For more information, see page 14 of CHIA’s Annual Report
$17.2B
-0.2%
MassHealth
Expenditures, 2017
Expenditure Trend,
2016-2017
-2.4% Member Months,
2016-2017
Public Insurance Programs MassHealth
HPC Presentation | September 12, 2018

12 For more information, see page 46 of CHIA’s Annual Report
Public Insurance Programs MassHealth MCO Service Categories, 2016-2017
PHARMACY SPENDING PMPM CONTINUED TO GROW FASTER THAN OTHER SERVICES,
BECOMING THE LARGEST CATEGORY IN 2017.
HPC Presentation | September 12, 2018
$110 13.0%

13
$17.0B
1.9%
Medicare
Expenditures, 2017
Expenditure Trend,
2016-2017
2.4%
Public Insurance Programs Medicare
Beneficiaries,
2016-2017
For more information, see page 15 of CHIA’s Annual Report HPC Presentation | September 12, 2018

14 For more information, see page 15 of CHIA’s Annual Report
Public Insurance Programs Medicare Program Spending, 2016-2017
MEDICARE EXPENDITURES GREW AT SIMILAR RATES FOR BENEFICIARIES COVERED
UNDER TRADITIONAL AND MEDICARE ADVANTAGE.
HPC Presentation | September 12, 2018

15 For more information, see page 13 of CHIA’s Annual Report
$22.8B
3.1%
Commercial
Expenditures, 2017
Expenditure Trend,
2016-2017
0.4%
Commercial Insurance
Member Months,
2016-2017
HPC Presentation | September 12, 2018

16 For more information, see page 45 of CHIA’s Annual Report
Commercial Insurance Service Categories, 2016-2017
COMMERCIAL SPENDING PMPM SLOWED ACROSS THE FOUR MAJOR SERVICE
CATEGORIES IN 2017.
HPC Presentation | September 12, 2018

17 For more information, see page 66 of CHIA’s Annual Report
Commercial Insurance High Deductible Health Plans by Market Sector, 2015-2017
IN 2017, MORE THAN ONE IN FOUR (28.2%) MASSACHUSETTS CONTRACT MEMBERS WERE ENROLLED IN
AN HDHP. THESE PLANS WERE MORE COMMON AMONG SMALLER EMPLOYER GROUP PURCHASERS.
HPC Presentation | September 12, 2018

18 For more information, see page 80 of CHIA’s Annual Report
Commercial Insurance Cost-Sharing by Market Sector, 2015-2017
MEMBER COST-SHARING CONTINUED TO BE HIGHER, AND GREW FASTER,
AMONG SMALLER EMPLOYER GROUPS.
HPC Presentation | September 12, 2018
Member
Cost-Sharing
PMPM

19 For more information, see page 72 of CHIA’s Annual Report
Commercial Insurance Fully-Insured Premiums by Market Sector, 2015-2017
FULLY-INSURED PREMIUMS INCREASED BY 4.9% FROM 2016 TO 2017. SMALL GROUP MEMBERS
EXPERIENCED THE LARGEST PERCENTAGE INCREASE (+6.9%).
HPC Presentation | September 12, 2018

20 Note: Total Medical Expenses reflects commercial full-claim only.
Commercial Insurance Expense Trends, 2015-2017
MEMBER COST-SHARING AND FULLY-INSURED PREMIUMS GREW FASTER THAN WAGES AND
INFLATION IN 2017.
HPC Presentation | September 12, 2018

State Perspective on Health Care
Cost Trends
Dr. David Auerbach
Director of Research and Cost Trends, Massachusetts Health Policy Commission

22
In 2017, total healthcare spending growth in Massachusetts was well
below the national rate, continuing a multi-year trend
Notes: US data include MA. US and MA figures for 2017 are preliminary.
Sources: Centers for Medicare and Medicaid Services, National Healthcare Expenditure Accounts Personal Health Care Expenditures
Data (U.S. 2014-2017) and State Healthcare Expenditure Accounts (U.S. 2000-2014 and MA 2000-2014); Center for Health Information
and Analysis Annual Report THCE Databooks (MA 2014-2017).
Annual growth in per-capita healthcare spending, MA and the U.S., 2000 – 2017

23
Commercial spending growth in Massachusetts has been below the
national rate since 2013, generating billions in avoided spending
Notes: US data includes Massachusetts. US and MA figures for 2017 are preliminary.
Sources: Centers for Medicare and Medicaid Services, National Healthcare Expenditure Accounts Personal Health Care Expenditures Data
(U.S. 2014-2017) and State Healthcare Expenditure Accounts (U.S. 2000-2014 and MA 2000-2014); Center for Health Information and
Analysis Annual Report TME Databooks (MA 2014-2017).
Annual growth in commercial spending per enrollee, MA and the U.S., 2006-2017

24
Since 2013, total hospital spending growth (inpatient and outpatient) in
Massachusetts has been far below national growth rates
Notes: US data include Massachusetts. Pharmacy spending is net of rebates.
Sources: Centers for Medicare and Medicaid Services, National Healthcare Expenditure Accounts, Private Health Insurance Expenditures
and Enrollment Data (U.S. 2013-2017); Center for Health Information and Analysis Annual Reports (MA 2013-2017).
2013 – 2017 cumulative growth in commercial spending by service category, MA and U.S.
If Massachusetts commercial spending grew at the national rate from 2013-2017,
residents would have spent $1.7B more in 2017 alone ($367 per person)

25
Unit price was the largest spending driver for the top three commercial
health plans in Massachusetts between 2015 and 2017
Notes: Average of medical expenditure trend by year 2015-2017. BCBSMA = Blue Cross Blue Shield of Massachusetts; THP = Tufts
Health Plan; HPHC = Harvard Pilgrim Health Care.
Source: HPC analysis of Pre-Filed Testimony Pursuant to the 2018 Annual Cost Trends Hearing
Average annual growth in spending by component for top 3 payers, 2015 – 2017

26
Massachusetts inpatient hospital admission rates show little change
since 2014 and continue to exceed the U.S. average
Notes: US data include Massachusetts.
Sources: Kaiser Family Foundation analysis of American Hospital Association data (U.S., 2001-2016), HPC analysis of Center for Health
Information and Analysis Hospital Inpatient Database (MA 2017).
Inpatient hospital admission rate per 1,000 residents, MA and the U.S., 2001-2017

27
Across all inpatient discharges, the rate of discharge to institutional post-
acute care continued to decline in 2017
Note: Out-of-state residents are excluded. Rates adjusted for age, sex, and changes in DRG mix. Several hospitals were excluded
(UMass, Clinton, Cape Cod, Falmouth, Marlborough) due to coding irregularities in the database.
Sources: HPC analysis of Center for Health Information and Analysis Hospital Inpatient Discharge Database (2010-2017).
MA rates of discharge to post-acute care settings following an inpatient admission, 2010-2017

28
Massachusetts readmission rates did not show any improvement in 2016
Sources: Centers for Medicare and Medicaid Services (U.S. and MA Medicare 2011-2016); Center for Health Information and Analysis
(MA All-payer 2011-2016).
Thirty-day readmission rates, MA and the U.S., 2011-2016

29
2017 was the first year with a small increase in community hospitals’
share of community-appropriate discharges since 2012
Notes: Discharges that could be appropriately treated in community hospitals were determined based on expert clinician assessment of the
acuity of care provided, as reflected by the cases’ diagnosis-related groups (DRGs). The Center for Health Information and Analysis defines
community hospitals as general acute care hospitals that do not support large teaching and research programs.
Sources: HPC analysis of Center for Health Information and Analysis Hospitals Inpatient Discharge Database (2012-2017).
MA share of community appropriate discharges by hospital type, 2012-2017

30
Overall APM adoption was relatively unchanged in 2017, but by 2018
MassHealth’s ACO program should drive statewide APM coverage toward 50%
Notes: Original Medicare data for 2017 is a preliminary estimate.
Source: Centers for Medicare and Medicaid Services (Original Medicare 2015-2017); HPC analysis of Center for Health Information and
Analysis Annual Report APM Databooks (Commercial 2015-2017); additional data supplied by MassHealth (MassHealth 2018).
* Managed care eligible includes MCO and PCC Plans, including new ACO options in 2018

31
In 2017, Blue Cross Blue Shield of Massachusetts continued to lead the
commercial market in APM adoption for PPO members
Source: HPC analysis of Center for Health Information and Analysis Annual Report APM Databooks (2015-2017).
Percentages
indicate the % of
membership in APM
arrangements within
each plan type

32
While Massachusetts has among the highest premiums in employer
markets, particularly for small employers, Connector premiums continue
to rank among the lowest in state exchanges in 2018
Notes: US data include Massachusetts. Employer premiums are based on the average premium according to a large sample of employers within each state.
Small employers are those with less than 50 employees; large employers are those with 50 or more employees. Exchange data represent the weighted
average annual premium for the second-lowest silver (Benchmark) plan based on county level data in each state. These plans have an actuarial value of
70%, compared to 85%-90% for a typical employer plan, and are thus not directly comparable to the employer plans.
Sources: Kaiser Family Foundation analysis of premium data from healthcare.gov (marketplace premiums 2014-2018); US Agency for Healthcare Quality,
Medical Expenditure Panel Survey (commercial premiums 2013-2017).
Annual premiums for single coverage in the employer market and average annual unsubsidized benchmark
premium for a 40-year-old in the ACA Exchanges, MA and the U.S., 2013-2018

33
Massachusetts continues to have lower deductibles than the US, although
the average deductible exceeds the IRS definition for high deductible plans
Notes: US data include Massachusetts. Employer deductibles are based on the average deductible according to a large sample of
employers within each state. Employer plans that do not have a deductible aren’t included in the average deductible calculation.
Sources: US Agency for Healthcare Quality, Medical Expenditure Panel Survey (commercial premiums 2013-2017); Internal Revenue
Service (for definition of high deductible plans 2013-2017).
* Calculation based on increase in proportion of plans that are high deductible plans in Massachusetts in 2017 and Baicker, Katherine,
William H. Dow, and Jonathan Wolfson. "Health savings accounts: Implications for health spending." National Tax Journal (2006): 463-475.
Average deductible for single coverage in the employer market, MA and the U.S., 2013-2017
The increase in high deductible plans in Massachusetts may have lowered overall
commercial spending growth in 2017 by roughly 0.2 percentage points*

34
Nearly a third of total income for lower-income, commercially insured
residents is consumed by health care costs, leading to higher rates of
outstanding medical debt
Note: Figures rounded to nearest whole number. Total income represents total family income and includes employer payments, if any, toward health insurance premiums. One-person families
and families with children and two adults are included in the analysis. Data are combined using survey weights which represent the population of Massachusetts. Insurance status is self-reported
in the survey. "Commercial" represents insurance received through work or a union; "Health Connector " represents all private, non-group plans available through the Health Connector.
Sources: Massachusetts Health Interview Survey (CHIA), data from 2017 on 1,633 respondents from family- and single-headed households with employer-sponsored and private health
insurance, representing roughly 2.9 million state residents. Other data sources include the US Agency for Healthcare Research and Quality US and state government tax and budget data.

Up Next
Keynote Presentation by Dr. Ashish Jha

+
U.S. Healthcare Spending: International Context,
National Trends, and Getting to High-Value Care
Ashish K. Jha, MD, MPH
October 16, 2018

+ Agenda
International context: how does US spending and utilization
compare with other countries?
How did the ACA try to address our cost and quality
problems? Has it worked?
What does this mean for MA?

+ How does US spending compare
to other countries?

+
17.8
9.7
11.3 11.9
11 10.5
12.4
10.8 10.3
10.9
9.6
0
2
4
6
8
10
12
14
16
18
20
US UK DE SE FR NL CH DK CN JP AU
Sp
en
din
g o
n h
ea
lth
as
a %
of
GD
P
Total healthcare spending, 2016

+ Why?

+ Hypothesis #1: Too many specialists,
not enough primary care

+
54%
48% 48% 47% 45% 45% 45%
43% 43% 43%
33%
22%
0%
10%
20%
30%
40%
50%
60%
FR CH CN NL UK DE AU US Mean JA SE DK
Primary care as % of MDs

+
Total Spending = Quantity X Price

+ Our culture of overuse

+
Total Spending = Quantity X Price
+ Overutilization theory #1
We are quick to go to the doctor

+ Doctor visits
12.7
10
8.2 7.7 7.6
6.6 6.4
5
4.3 4 3.9
2.9
0
2
4
6
8
10
12
14
JA DE NL CN AU Mean FR UK DN US CH SE
Ph
ys
icia
n v
isit
s p
er
ca
pit
a i
n a
giv
en
ye
ar

+ Overutilization theory #2
Not enough prevention and primary care
leads to too many hospitalizations

+ Hospital discharges
255
173 172 166 163
153 149
128 125 119
111
84
0
50
100
150
200
250
300
DE AU DN CH FR SE Mean UK US NL JA CN
Dis
ch
arg
es
pe
r 1
,00
0 p
op
ula
tio
n
We spend far fewer days in the hospital

+ Overutilization theory #3
We use too many tests and procedures

+ MRI examinations
131
118
112
105
82 82
70
56 53 52
41
0
20
40
60
80
100
120
140
DE US JA FR DN Mean CH CN UK NL AU
Ex
am
ina
tio
ns
pe
r 1
,00
0 p
op
ula
tio
n

+ Total knee replacement
226
190
180 176
168 166 163
145 141
124 118
0
50
100
150
200
250
US DE AU CH DN CN Mean FR UK SE NL
Re
pla
ce
me
nt
pe
r 1
00
,00
0 p
op
ula
tio
n

+ Total hip replacement
292 283
237 236 234
216 207 204
183
171
136
90
0
50
100
150
200
250
300
CH DE DN FR SE NL Mean US UK AU CN JA
Re
pla
ce
me
nt
pe
r 1
00
,00
0 p
op
ula
tio
n

+ Coronary angioplasty
393
248 248 237
217 205
193 190 172
157
128
0
50
100
150
200
250
300
350
400
450
DE US NL FR Mean SE JA DK AU CN UK
Pro
ce
du
res p
er
10
0,0
00
po
pu
lati
on

+ So is it utilization?
Higher US costs not primarily about utilization
We have fewer hospitalizations, doctor visits
Tests and Procedures a mixed bag:
We do a lot more MRIs, TKRs, Angioplasties
We do fewer hip replacements
Bottom line:
We’re above average on some things
We’re below average on other things
On average, we are pretty average

+ OK– so what is it?

+ Administrative waste

+ Governance, administration spending
8%
5%
4% 4%
3% 3% 3%
2% 2% 2%
1% 1%
0%
1%
2%
3%
4%
5%
6%
7%
8%
9%
US DE NL CH Mean CN AU UK SE DN FR JA
Pe
rce
nta
ge
of
he
alt
hc
are
sp
en
din
g

+
Total Spending = Quantity X Price

+ Prices

+ Prices of what?

+ Pharmaceuticals!

+ Total Spending (USD Per Capita)
$1,443
$939
$837 $779
$749 $697 $675 $667
$613 $566 $560
$466
$0
$200
$400
$600
$800
$1,000
$1,200
$1,400
$1,600
US CH JA UK Mean FR DN DE CN SE AU NL
To
tal
Ph
arm
ac
eu
tic
al
Sp
en
din
g (
US
D p
er
ca
pit
a)

+ Pharma makes up about
15% of all HC spending

+ So that can’t be the
whole story
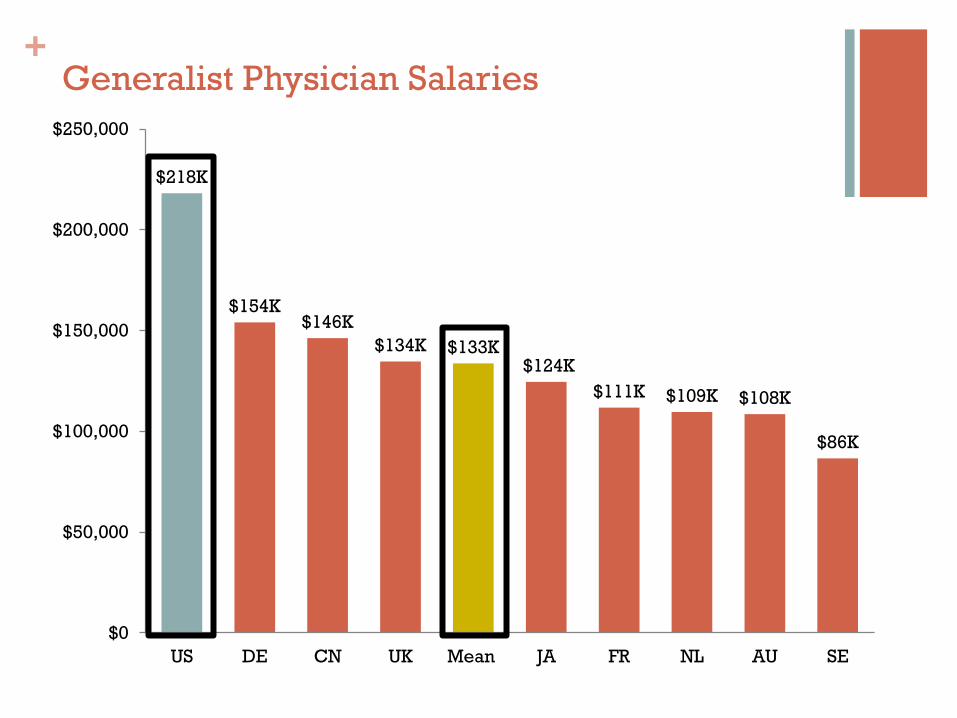
+ Generalist Physician Salaries
$218K
$154K $146K
$134K $133K $124K
$111K $109K $108K
$86K
$0
$50,000
$100,000
$150,000
$200,000
$250,000
US DE CN UK Mean JA FR NL AU SE

+ Specialist Physician Salaries
$316K
$202K $191K $188K
$182K $181K $171K
$153K $140K
$124K
$98K
$0
$50,000
$100,000
$150,000
$200,000
$250,000
$300,000
$350,000
US AU NL CN Mean DE UK FR DN JA SE

+ Nurse Salaries
$74K
$65K $64K
$58K
$55K $53K
$51K $49K
$44K $42K
$0
$10,000
$20,000
$30,000
$40,000
$50,000
$60,000
$70,000
$80,000
US NL AU DN CN DE Mean UK JA FR

+ CT Scan Abdomen
International Federation of Health Plans 2015
$844
$483
$383
$233
$85
$0
$100
$200
$300
$400
$500
$600
$700
$800
$900
US New Zealand Switzerland South Africa Spain

+ Appendectomy
International Federation of Health Plans 2015
$15,930
$6,199 $6,040
$3,814
$2,003 $1,786
$0
$2,000
$4,000
$6,000
$8,000
$10,000
$12,000
$14,000
$16,000
$18,000
US New Zealand Switzerland Australia Spain South Africa

+ So what makes US HC so expensive?

+ Summary
Hypotheses unlikely to explain difference:
Primary care/specialist mix
Overutilization
High costs driven primarily by:
Administrative costs
High prices
We can still save money by reducing quantity

+ What have we largely focused on?

+
Total Spending = Quantity X Price

+ Causes of our system dysfunction
Fragmentation
How we pay for care (FFS, lack of incentives)
Inadequate transparency
Inadequate competition
Inadequate patient “skin in the game”

+ What did the ACA do to fix things?
Change how we pay for things
Hospital readmissions reduction program
Value-based purchasing
Hold providers accountable
Patient-centered medical home
Accountable Care Organizations
Centrally manage innovation
CMMI
Investment in Health IT

+ So has the ACA worked?

+
12.8% 11.2%
11.1%
15.8%
14.3% 14.3%
0%
2%
4%
6%
8%
10%
12%
14%
16%
18%
Mo
rta
lity
Ra
te
VBP Hospitals Non-VBP Hospitals
Figueroa et al. BMJ 2016
Value-based payment has had little effect
Onset of VBP
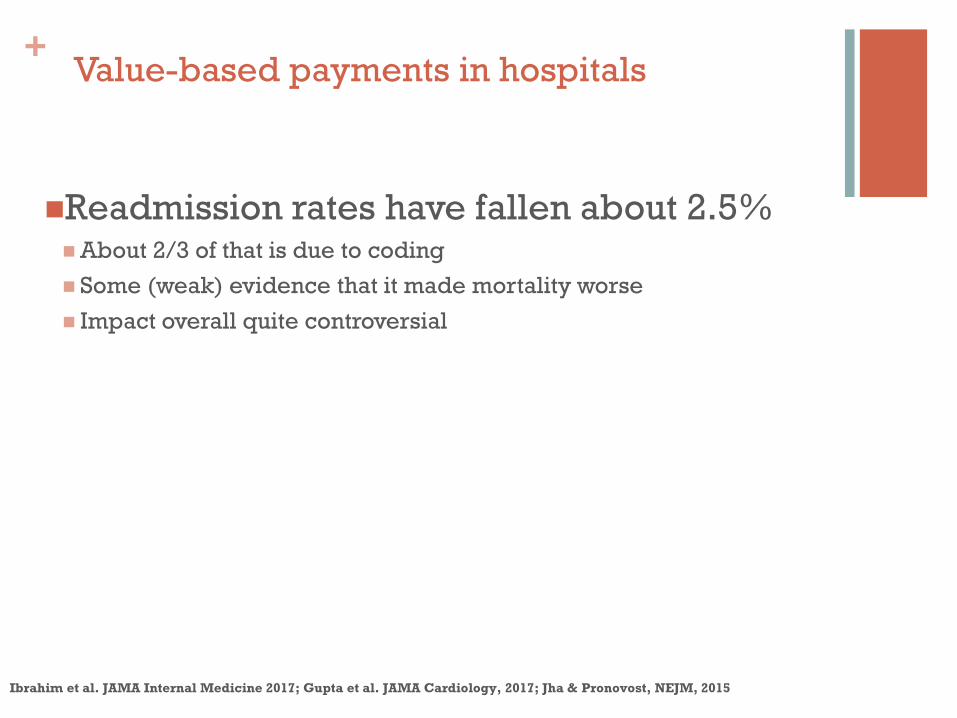
+ Value-based payments in hospitals
Readmission rates have fallen about 2.5% About 2/3 of that is due to coding
Some (weak) evidence that it made mortality worse
Impact overall quite controversial
Ibrahim et al. JAMA Internal Medicine 2017; Gupta et al. JAMA Cardiology, 2017; Jha & Pronovost, NEJM, 2015

+ Primary Care Initiative (CPCI)
CPCI targeted 502 primary care practices in 7 U.S.
regions
Spending did not decrease enough to cover care management
fees
After 4 years, no change in overall spending growth, modest
impact on quality
2% lower growth in ED visits
Peikes et al Health Affairs 2018

+ EHR impact on mortality, 2008-2013
0
2
4
6
8
10
12
14
16
2008 2009 2010 2011 2012 2013
De
ath
s p
er
10
0 a
dm
issio
ns Average (5.7 baseline
functions, 0.6 added
functions/year)
Below Average (0
baseline functions, 0.6
added functions/year)
Above average (5.7
baseline functions, 2
added functions/year)

+ Bundled Payments
The findings are mixed
For medical conditions: no change in spending or quality
For surgical conditions: associated with decreases in spending and
small quality improvements
4%-20% decrease in per-episode spending for joint replacement
Why?
Different spending patterns
Different services provided in post-acute settings
Different types of patients
Dummit JAMA 2016, Joynt et al NEJM 2018, Navathe JAMA 2017, Navathe Health Affairs 2018

+
220
338
404 433
480
561
0
100
200
300
400
500
600
2013 2014 2015 2016 2017 2018
Nu
mb
er
of
MS
SP
AC
Os
Number of ACOs continues to grow
Center for Medicare and Medicaid Services

+ Impact of ACOs on Quality & Cost
How are they doing? Two alternative views: McWilliams et al. consistently find 2-5% savings, by cohort:
2012: 4.9%
2013: 3.5%
2014: 1.6%
Impact on quality?
A few positive changes in pt experience, little on outcomes
All the savings are in physician-led ACOs
McWilliams NEJM 2018

+ A summary of where we have been
ACA spurred LOTS of activity
Some of it is making a real difference
Much of it has focused on quantity
Medicare led
Prices are fixed
Relative prices are not…

+ What’s next?
Push towards price transparency
Payment Reform: More risk to providers
Bundled payments, ACOs, Capitation
More risk to payers (from CMS):
MA
More engagement of consumers
Tiering coming to Medicare?
Some efforts on prices
But probably not enough

+ What does this mean for MA?

+ The future of MA healthcare
Value-based care is important
Promote more bundles
Promote more ACOs
Intensively study which models work and don’t – and adjust
accordingly
Value-based strategies not nearly enough
We must deal with the 800 pound gorilla: prices
Price regulation versus competition


Up Next
Witness Panel 1: Meeting the Health Care Cost Growth Benchmark

Witness Panel 1
Meeting the Health Care Cost Growth
Benchmark - Top Trends in Care Delivery
and Payment Reform

93
This panel will discuss strategies to meet the health care cost growth
benchmark in 2019 and beyond by tackling issues such as the scalability of
innovations in care delivery, the lack of uptake in alternative payment
methods, high levels of spending on pharmaceuticals and medical devices,
and the future of the Massachusetts health care system.
Witness Panel 1: Meeting the Health Care Cost Growth Benchmark – Top
Trends in Care Delivery and Payment Reform
Witnesses
Goals
Mr. Michael Carson, President and CEO Harvard Pilgrim Health Care
Mr. Normand Deschene, CEO Wellforce Dr. Mark Keroack, President and CEO Baystate Health Mr. David Segal, President and CEO Neighborhood Health Plan Ms. Liora Stone, Owner and President Precision Engineering, Inc., Uxbridge

Up Next
Witness Panel 2: Innovations to Enhance Timely Access to Primary and
Behavioral Health Care

Witness Panel 2
Innovations to Enhance Timely Access
to Primary and Behavioral Health Care

96
More than a third of Massachusetts residents reported that their last ED
visit was not for an emergency in 2017
Note: FPL stands for “Federal Poverty Level.”
Source: HPC's analysis of CHIA’s Massachusetts Health Insurance Survey, 2017
Percentage reporting “most recent emergency room visit in past 12 months was for a non-emergency
condition” by family income, 2017

97
The number of urgent care centers and retail clinics serving MA residents
has grown strikingly since 2010, although at different rates
Notes: HPC defines urgent care centers as serving at least all adult patients on a walk-in (non-appointment) basis and having service hours beyond normal weekday business
hours.
Sources: HPC identified urgent care centers through sources including licensure data from the Massachusetts Department of Public Health, data from the Centers for Medicare
and Medicaid Services, insurers’ online directories of providers, and the websites of the clinics and their affiliated organizations. Retail clinics are identified through their
licensure as limited service clinics with the Massachusetts Department of Public Health; CVS Minute Clinics are the only retail clinics operating in Massachusetts as of August
2018.
Number of urgent care centers and retail clinics in Massachusetts, 2010 - 2018

98
Visit costs, including patient cost sharing, vary substantially by care site
Notes: Data does not include facility fee costs.
Sources: HPC analysis of All-Payer Claims Database, 2015
Average total spending and cost sharing per visit, all conditions vs low acuity conditions, 2015

99
Retail clinics and urgent care centers are disproportionately located in
higher income areas, although urgent care centers are more broadly
distributed
Distribution of alternative care sites by median income of clinic location zip code
Sources: HPC identified urgent care centers through sources including licensure data from the Massachusetts Department of Public Health, data from the Centers for Medicare
and Medicaid Services, insurers’ online directories of providers, and the websites of the clinics and their affiliated organizations. Retail clinics are identified through their
licensure as limited service clinics with the Massachusetts Department of Public Health.

100
Providers reported varied perspectives on the impact of growth in
alternative care sites
“…it is not clear to us that the proliferation of urgent care centers in
our service area has affected overall utilization of emergency
departments. Instead, we continue to see ED utilization
increase, even while urgent care encounters increase as well.”
“…we are concerned that for many patients, urgent care services
are replacing comprehensive primary care due to the convenience
of access to an urgent care center, resulting in greater
fragmentation of primary care.”
Alternative care sites may “assist patients with having access to the
appropriate level of care.... hospitals will be able to focus on the
higher levels of care they are intended for. This focus should
allow for more timely access and higher quality outcomes for
patients… During times of physician and advanced provider
shortages, they provide a lower cost alternative than emergency
services.”
Impact on the
Emergency Department Uncertain effect on volume
Impact on Primary Care May attract routine care versus
more complex patients
Impact on Increasing
Access to Appropriate
Care Potential for greater access at
lower cost sites

101
Commercial payers represent a greater share of revenue for retail clinics
and urgent care centers than health care spending overall in MA
Notes: Data weighted by respondent size, based on volume of unique patient visits. Based on responses received through pre-filed testimony, the number of unique patient
visits at retail clinics totaled 284,545. The number of unique patient visits at urgent care centers totaled 1,029,034; however, only 877,283 are included in the graph. Minute
Clinic was the respondent for retail clinics. Urgent care center respondents included in the graph are [see above for list]. Care Well and Berkshire Health Systems were not
included because they did not provide distribution of revenue by payer.
Sources: HPC analysis of 2017 alternative care site data submitted through pre-filed testimony and 2017 Total Health Care Expenditure data from CHIA Datebooks.

102
Witness Panel 2: Innovations to Enhance Timely Access to Primary and
Behavioral Health Care
Witnesses
Goals
The goal of this panel is to showcase emerging models of enhancing patient access
to high-quality, convenient health care, especially behavioral health care and care
for vulnerable populations. Focus areas will include: the growth in urgent care
centers, including urgent behavioral health care, telemedicine, digital health
technology solutions, mobile-integrated health, and other strategies to engage
patients in care in the community, and reduce unnecessary emergency department
and hospital utilization.
Dr. Timothy Ferris, Chairman and CEO Massachusetts General Physicians Organization
Dr. Gene Green, President and CEO South Shore Health System Mr. Manny Lopes, President and CEO East Boston Neighborhood Health Center Mr. Edward Moore, President and CEO Harrington Healthcare System Dr. Kristina Orio, Medical Director and AFC Urgent Care Lead Physician

Up Next
Public Testimony Opportunity

Public Testimony

Tomorrow:
Day Two of the Health Care Cost Trends
Hearing
Hearing begins at 9:15 AM