unsaturated fatty acids promote bioaccessibility and
TRANSCRIPT
Unsaturated fatty acids promote bioaccessibility and
transepithelial transport
of carotenoids and α-tocopherol by Caco-2 cells
Journal: Food & Function
Manuscript ID: FO-ART-11-2013-060599.R1
Article Type: Paper
Date Submitted by the Author: 06-Mar-2014
Complete List of Authors: Failla, ML; The Ohio State University, Huamn Sciences
Chitchumroonchokchai, Chureeporn; The Ohio State University, Human
Sciences
Ferruzzi, Mario G.; Purdue University, Food Sciences
Goltz, Shellen; Purdue University, Food Sciences
Campbell, Wayne; Purdue University, Food Sciences
Food & Function
1
Unsaturated fatty acids promote bioaccessibility and basolateral secretion
of carotenoids and α-tocopherol by Caco-2 cells
Mark L. Failla1, Chureeporn Chitchumronchokchai
1, Mario G. Ferruzzi
2,3, Shellen R. Goltz
2 and
Wayne Campbell3
1Department of Human Nutrition, The Ohio State University, Columbus, Ohio 43210,
2Department of Food Science, Purdue University, West Lafayette, Indiana 47907, Department of
Nutrition Science, Purdue University, West Lafayette, Indiana 47907
Correspondence: Mark L. Failla, Department of Human Sciences, The Ohio State University,
352 Campbell Hall, 1787 Neil Ave, Columbus OH, 43210, USA. Tel: 614-688-1444; Fax
614-292-4339; email: [email protected].
Mark L. Failla: [email protected] 614-688-0954
Chureeporn Chitchumroonchokchai: [email protected] 614-688-4896
Mario G. Ferruzzi: [email protected] 765-494-0625
Shellen R. Goltz: [email protected] 847-396-7719
Wayne Campbell: [email protected] 765-494-8236
Page 1 of 39 Food & Function

2
Abstract
Bioavailability of carotenoids and tocopherols from foods is determined by the efficiency of
transfer from food/meal to mixed micelles during digestion, incorporation into chylomicrons for
trans-epithelial transport to lymphatic/blood system, and distribution to target tissues. Fats and
oils are important factors for facilitating the absorption of lipophilic compounds. However,
dietary fats and oils are composed of various types of saturated and unsaturated fatty acids which
may differentially impact the bioavailability of carotenoids and tocopherols from foods. We have
investigated the effects of several common commercial lipids on bioavailability using an in vitro
digestion model and Caco-2 human intestinal cells. Meals consisted of mixed salad vegetables
containing a single test lipid. Micellarization and cellular uptake of β-carotene (βC) and lycopene
(LYC) during small intestinal digestion was increased by lipids rich in unsaturated fatty acids:
soybean oil > olive > canola > butter. In contrast, type of lipid minimally affected the
bioaccessibility of lutein (LUT) and zeaxanthin (ZEA). To examine the influence of type of
dietary triglyceride on uptake and basolateral secretion of carotenoids, Caco-2 cells grown on
Transwell membranes were incubated with micellar mixtures of fatty acids (1.0 mM) mimicking
the types and ratio of saturated to unsaturated (mono- + poly-unsaturated) fatty acids (FA)
present in butter (70 : 30), olive oil (7 : 93) and soybean oil (11 : 89). Cells were exposed to
micelles containing βC, LUT, α-tocopherol (α-TC) and a mixture of test fatty acids. Uptake and
basolateral secretion of βC, LUT and α-TC were greater in cells pre-treated with mixtures
enriched in unsaturated compared to saturated FA and these effects were mediated by increased
assembly and secretion of chylomicrons. These results suggest that dietary fats/oils rich in
unsaturated fatty acids promote carotenoid and α-TC bioavailability by enhancing their
micellarization during digestion and intestinal transport.
Page 2 of 39Food & Function

3
Introduction
Delivery of carotenoids, their metabolites and fat soluble vitamins to tissues is required for
modulating their cellular activities. Absorption of such compounds parallels that of other dietary
lipophiles and drugs. This involves sequential solubilization in lipid droplets, transfer to bile salt
micelles containing lipid digestion products, delivery to the brush border membrane of small
intestinal epithelial cells for uptake, possible cleavage to retinal and other metabolites,
incorporation into chylomicrons and other lipoproteins for secretion into lymph, and distribution
to target tissues.1-3
The extent to which lipophilic micronutrients and phytochemicals in plant
foods are absorbed is dependent on multiple factors that can affect one or more of these
processes. Such factors include chemical structures of carotenoids and vitamins, food matrix,
type and extent of food processing and preparation, and composition of the meal, as well as
physiologic status and genetics of the individual.2-4
For example, co-consumption of dietary fat
is essential for absorption of lipid soluble micronutrients and phytochemicals.2,3,5
However,
there is a lack of clarity about how much and what types of fat optimally enhance the absorption
of carotenoids and fat soluble vitamins. For example, addition of 5g groundnut oil to spinach
curry improved plasma retinol to normal in malnourished children.6 Other studies have shown
that ≥ 12g fat provided maximum absorption of carotenoids from unprocessed western-style
vegetable salad by healthy adults.7-9
In contrast, absorption of carotenes and free LUT ingested
in carotenoid rich spreads appeared to be similar when consumed with either 3 or 36g fat,
although absorption of LUT ingested as LUT esters was enhanced only when the meal contained
high fat.10
Studies with rats and human volunteers have consistently shown that dietary
triglycerides (TG) rich in mono-saturated fatty acids have a greater tendency to enhance
carotenoid absorption than TG rich in saturated and poly-unsaturated fatty acids,9, 11, 12
although
Page 3 of 39 Food & Function
4
the outcome can be affected by food matrix.13
Similarly, digestion products of dietary lipids
differentially affect both the bioaccessibility (i.e., micellarization; 2,3,14,15
) and absorption13, 16-19
of carotenoids and α-TC.
The primary objective of the studies reported below was to systematically investigate the
influence of type of dietary fat on individual processes associated with the digestion and
absorption of meals rich in carotenoids and α-TC. Either no fat, butter, olive oil, canola oil or
soybean oil was added to a western-style salad that had been tested previously in a
bioavailability trial with healthy human subjects.9 Salad was subjected to simulated gastric and
small intestinal digestion to determine the effects of each dietary lipid source on the efficiency of
micellarization and uptake by differentiated cultures of Caco-2 cells. Also, monolayers of Caco-
2 cells on membrane inserts were used to examine the effects of micelles containing mixtures of
fatty acids resembling those in the butter, olive oil and soybean oil on apical to basolateral
transport of LUT, βC and α-TC, and the relationship with the secretion of TG and apo-
lipoprotein B (apoB).
Results
Effect of type of dietary TAG on bioaccessibility of carotenoids and α-TC
Digestive stability
Mean recovery of total carotenoids after simulated gastric and small intestinal digestion of salad
puree containing 3.0% fat was 83.8 ± 8% (LUT, 80.2%; ZEA, 87.5%; α-carotene (AC), 93.3%;
βC, 71.6%; LYC, 86.2%). The ratio of all-trans to cis isomers of LUT, βC and LYC was not
significantly different in salad and chyme. ZEA esters were partially hydrolyzed during digestion
with the relative amounts of all-trans ZEA, ZEA mono-esters and ZEA di-esters accounting for
Page 4 of 39Food & Function
5
22.3%, 5.0% and 72.7%, respectively, in chyme. Recovery of carotenoids and α-TC, the ratio of
all-trans to cis isomers of carotenoids, and hydrolysis of ZEA esters were not significantly
affected by type or amount of fat added to salad before digestion (data not shown). Addition of
3% (wt/wt) butter, olive oil, canola oil and soybean oil to salad puree increased α-TC content
from 10.9 µg/g salad to 11.6, 15.2, 16.1 and 14.5 µg/g salad, respectively. Recovery of α-TC
after completion of the small intestinal phase of digestion of salad puree with the different fats
was 91.8-95.2% and not significantly affected by exogenous source of fat.
Micellarization of carotenoids and αααα-TC during simulated digestion
The efficiency of transfer of carotenoids from salad puree containing either 0% or 3.0% fat to the
micelle fraction of chyme was dependent on carotenoid speciation (LUT > non-esterified ZEA >
βC > AC > LYC, ZEA esters), the absence or presence of fat, and the source of fat (Table 1).
Partitioning of cis isomers of LYC in the micelle fraction of chyme was significantly greater than
that of all-trans isomers. Also, the relative extent of transfer of non-esterified ZEA significantly
exceeded that of ZEA esters. Transfer of all carotenoids to the aqueous fraction of chyme was
dependent on the generation of mixed micelles as deletion of bile extract during the small
intestinal phase of digestion decreased the amount of carotenoids and α-TC in the aqueous
fraction to ≤ 2.0 ± 0.2%. The amounts of non-esterified and esterified ZEA, AC, βC and LYC
were significantly less in the micelle fraction of chyme generated during digestion of salad
containing butter instead of one of the oils. Also, micellarization of AC and βC, but not ZEA
orLYC, was significantly greater when olive or soybean oil was substituted for canola oil in
salad puree. Transfer of α-TC to micelles during simulated digestion of salad puree with 3% fat
ranged from 42-45% and was independent of source of exogenous fat (Table 1).
Page 5 of 39 Food & Function

6
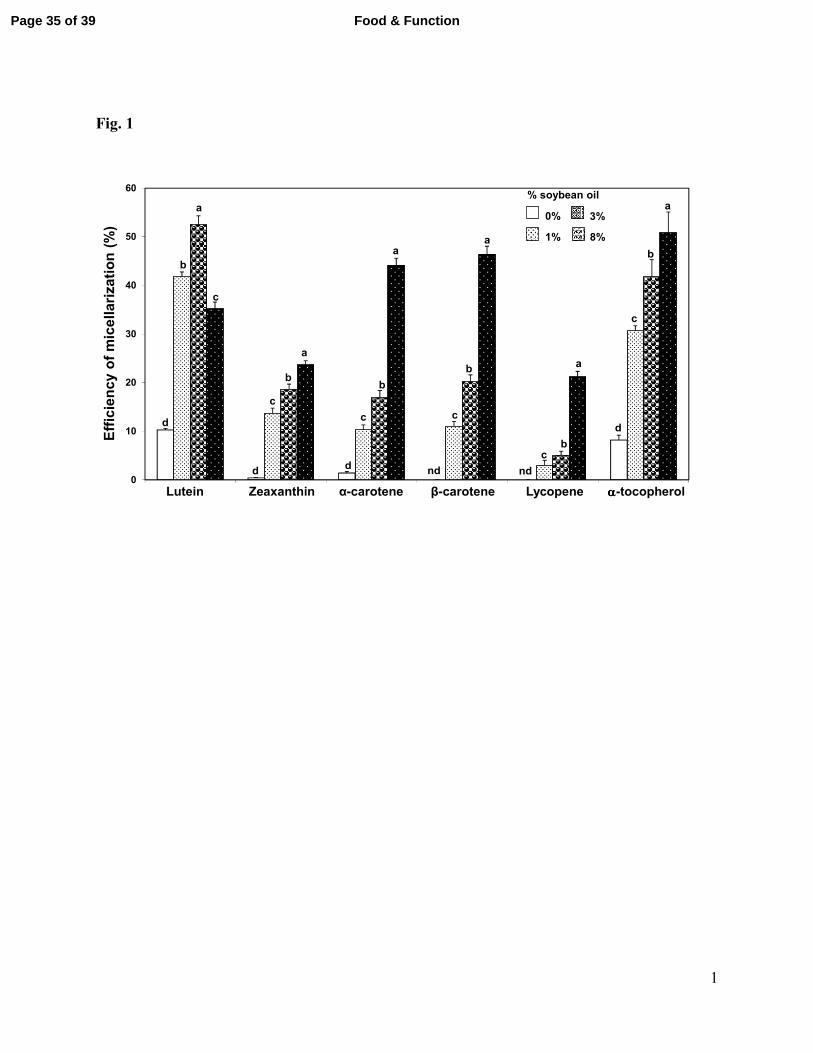
The extent of micellarization of the carotenoids generally was proportional to the amount of
soybean oil (0-8%) added to salad puree when concentrations of digestive enzymes and bile
extract remained constant (Fig. 1). This was most evident for the increased amounts of ZEA,
carotenes, LYC and α-TC in the aqueous fraction when soybean oil content in salad puree
increased from 0% to 1%, and for carotenes, LYC and α-TC when content increased from 3% to
8% (Fig. 1). Micellarization of LUT increased to 53 ± 2% of that in salad puree when soybean
oil content was 3%, but surprisingly decreased (35 ± 1%) to less than that of AC and βC when oil
content of the salad was increased to 8%.
The accessibility of all trans LUT, ZEA, AC, βC nd LYC in micelles generated during small
intestinal digestion was confirmed by monitoring their accumulation by monolayers of Caco-2
cells adhered to plastic dishes (Fig. 2). Cellular content of cis isomers after 4h incubation with
diluted micelle fraction was below the limit of detection. The percentage of all five all-trans
carotenoids in apical medium taken up by Caco-2 cells ranged from 7-11% (data not shown).
Cell content of all-trans LYC was markedly less than that of the other carotenoids regardless of
the type and amount of fat added to salad puree (Fig. 2). Uptake of all-trans LYC was affected
by source of fat as its accumulation from micelles generated during digestion of salad with butter
was only 20% that from micelles generated during digestion of salad containing the three oils.
Although the concentrations of LUT, ZEA and AC in salad puree were similar (13-16.5 µg/g)
and less than that of βC and LYC (23.5 and 23.2 µg/g, respectively), cells accumulated greater
quantities of the xanthophylls compared to the more abundant βC and LYC from digested salad
regardless of type of fat (Fig. 2). Incubation of cells with micelle fraction of digested meals
containing exogenous fat also increased cellular content of α-TC (Fig. 2). Cellular α-TC content
after incubation with diluted micelle fraction after digestion of the salad meals containing oils
Page 6 of 39Food & Function

7
was twice that in cells incubated with diluted micellefraction generated during digestion of salad
with butter.
Effects of micelle fatty acyl composition on basolateral secretion of LUT, βC and α-TC
The concentrations of carotenoids and α-TC in micelles generated during simulated digestion of
salad were too low for accurate determination of the influence of different mixtures of fatty acids
in the tested dietary fats on their basolateral secretion. Therefore, medium with micelles
containing mixtures of fatty acids resembling those generated during digestion of the four dietary
fats were prepared (Table 2) to examine the effect of source of dietary fat on uptake and
basolateral secretion of intracellular carotenoids. LUT and βC were selected as representative
xanthophyll and hydrocarbon carotenoids, respectively. These carotenoids and α-TC were
solubilized in Tween 40 for addition to apical medium. The preparations were combined to
deliver 2 µmol mixtures of fatty acids and 20 nmol βC, LUT and α-TC to the apical compartment
of monolayers grown on inserts. Using this co-exposure strategy, the total amount of the
carotenoids and α-TC taken up by cells, i.e., quantities present within cells and in the basolateral
compartment, was minimally affected by the presence or sources of fatty acids in the mixed
micelles (Fig. 3A). As expected, the amounts Fig. 3B) and secretion efficiency (Fig. 3c) of
carotenoids and α-TC into the basolateral compartment were significantly lower in cultures
exposed to micelles lacking free fatty acids compared to micelles containing the various mixtures
of fatty acids. However, the amounts of LUT, βC and α-TC secreted into the basolateral
compartment during the 8h incubation were 177-302% greater when mixtures rich in unsaturated
fatty acids were substituted for the mixture rich in saturated fatty acids (Fig. 3B). This was due to
more than a two efficiency with which these compounds were secreted from the cell into the
Page 7 of 39 Food & Function

8
basolateral compartment. The influence of the mixtures rich in unsaturated fatty acids on the
transport of LUT, βC and α-TC varied. Secretion of LUT was slightly, but significantly (p<0.05),
greater in cultures incubated with micelles containing fatty acids resembling those in soybean oil
compared to olive and canola oils. In contrast, secretion of βC was greater (p<0.01) in cultures
exposed to mixtures of fatty acids resembling those in olive oil compared to canola and soybean
oils. It should be noted that secretion of α-TCS into the basolateral compartment in cultures
lacking exogenous fatty acids was greater than that for LUT and βC. Secretion of of α-TC into
the basolateral compartment also exceeded that of LUT and βC when cells were incubated with
micelles containing fatty acids resembling each of the dietary fats.
We also examined the effect of chronic pre-exposure of Caco-2 monolayers to micelles
containing the different mixtures of fatty acids on secretion of carotenoids and α-TC into the
basolateral compartment as routine consumption of a single source of dietary fat with meals is
common in developing countries.20
Medium containing micelles with one of the mixtures of
fatty acids (1 mmol final concentration) was added to the apical compartment for 4h per day
beginning on day 17 post-confluency and continuing through day 20 post-confluency. On day
21, apical medium containing micelles with the same fatty acyl mixtures as that on days 17-20
and Tween micelles containing LUT, βC and α-TC was added to cultures. Surprisingly, the
amounts of LUT, βC and α-TC taken up from the apical compartment by cells chronically
incubated with the mixed micelles were approximately 50% that by cells only exposed to such
micelles on the day of the experiment (Fig. 4A, no fat bar and 3A). However, both the amounts
and the efficiency with which intracellular LUT, βC and α-TC were secreted into the basolateral
compartment by cells chronically exposed to the micelles with fatty acid profiles resembling that
Page 8 of 39Food & Function
9
of the dietary fats was approximately twice that after a single co-exposure to micelles with the
same mixtures of fatty acids (Fig. 4B and 4C compared to 3B and 3C). Secretion of LUT, βC
and α-TC into the basolateral compartment by cells chronically exposed to the mixtures of fatty
acids also was proportional to the concentration of fatty acids in apical medium (0.5-2.0 mmol/L)
for all tested mixtures of fatty acids and significantly greater for mixtures rich in unsaturated
fatty acids compared to saturated fatty acids (Table 3).
We examined the possibility that differences in apical uptake by cells chronically and acutely
exposed to micelles with the various fatty acids might be associated with alteration of the fatty
acyl composition of phospholipids in the plasma membrane. Chronic exposure (17-21d post-
confluency) to micelles containing mixtures of fatty acids altered the fatty acyl profile of brush
border membrane phospholipids of Caco-2 cells. Daily apical exposure of cells to micelles with
fatty acyl mixture resembling olive, canola and soybean oils increased the ratio of unsaturated to
saturated fatty acids in brush border membrane by 75% (p<0.0001), 9% (p<0.01) and 32%
(p<0.0001), respectively. Chronic exposure to micelles containing fatty acids resembling the
composition of butter slightly, but significantly (p<0.01), decreased the ratio of unsaturated to
saturated fatty acids in brush border membranes by 7%. In contrast, the ratio of unsaturated to
saturated fatty acids in the basolateral membrane was not significantly different in control cells
(1.0 : 0.93; p = 0.69) and cells chronically exposed to micelles with all four mixtures of fatty
acids (1.0 : 0.85-0.97; p = 0.49).
Micellar mixtures rich in unsaturated fatty acids promote basolateral secretion of LUT, βC
and α-TC by enhancing secretion of chylomicrons
Page 9 of 39 Food & Function

10
The distribution of the carotenoids and α-TC in basolateral medium was determined for cultures
treated with mixtures of fatty acids resembling soybean oil. Chylomicrons contained 90 ± 5% of
βC and 85 ± 4% of LUT in the basolateral compartment. Residual βC was located in the VLDL
fraction, whereas 9 ± 1 and 6 ± 1% of total LUT were present in the VLDL and more dense
fractions, respectively. Distribution of α-TC in basolateral medium differed from the carotenoids
with the chylomicron fraction, VLDL fraction and the more dense fraction containing 60 ± 2%,
10 ± 1% and 30 ± 1%, of the total, respectively. TG and apoB content in cells and the TG-rich
fraction (d<1.006 g/mL) of basolateral medium were measured to assess the differential effects
of micelle fatty acyl composition on the trans-epithelial transport of carotenoids and α-TC. TG
content in untreated cells and in basolateral medium at 21d post-confluency were 51 and 2.8
µg/well, respectively. Acute exposure to micelles rich in unsaturated fatty acids resembling
dietary oils (2 µmol/well) increased TG content in cells by 50-100% and in the TG-rich fraction
of basolateral medium 6-10 fold (Fig. 5A). Single exposure of cells to micelles with fatty acids
resembling those in butter did not significantly alter TG content in the TG-rich fraction of
basolateral medium, despite increasing intracellular TG by 50%. ApoB content in the basolateral
medium of control cultures was 455 ng/well. Single exposure to micelles containing the
mixtures of fatty acids resembling the dietary oils increased apoB in the TG-rich fraction of
basolateral medium 1.2-1.4 fold, whereas apoB content in the basolateral compartment after
acute exposure to micelles containing fatty acids resembling butter was only 13% greater than
the basal amount (Fig. 5B).
Compared to single exposure to micelles with the mixtures of fatty acids, chronic exposure of
cells to micelles rich in saturated fatty acids resembling butter and dietary oils further increased
Page 10 of 39Food & Function
11
intracellular TG content (1.9 fold and 3.3-4.1 fold, respectively), and basolateral TG content 2.4
fold and approximately 20-fold, respectively (Fig. 5A). Similarly, apoB in basolateral medium of
cells chronically exposed to micelles with fatty acids resembling butter and the oils increased 1.9
and 3.95-4.5 fold, respectively (Fig. 5B). The ratio of TG to apoB in the basolateral medium was
markedly greater in cultures acutely exposed to micelles with mixtures of fatty acids resembling
the dietary oils compared to the mixture resembling butter (Fig. 5C). The increased amounts of
apoB and greater ratio of secreted TG/apoB indicates that the mixtures of fatty acids resembling
the dietary oils promoted secretion of a greater number of larger lipoprotein particles. Chronic
exposure to the fatty acyl mixtures resembling those of olive and soybean, but not canola, oils
further increased the ratio of secreted TG to apoB. The amounts of TG and apoB in the TG-rich
fraction of basolateral medium by cells chronically exposed to the mixtures of fatty acids were
highly correlated (≥ 0.95) with the secretion of LUT, βC, and α-TC.
Discussion
Co-consumption of fat is known to promote the absorption of health-promoting lipophilic
compounds.2,3
However, the sources and amounts of fat that should be co-consumed for
maximal absorption of carotenoids, fat soluble vitamins and other health promoting lipophilic
micronutrients and phytochemicals in fruits and vegetables remain unclear. The reported
observations represent a systematic in vitro examination of the effect of various sources and
amounts of fatty acids on the transfer of carotenoids and α-TC in a salad to mixed micelles
during simulated digestion, their delivery to differentiated cultures of Caco-2 cells, and the
basolateral secretion of these compounds across the monolayer. α-TC in the test meal originated
from both the components of the salad itself and the exogenous fats.
Page 11 of 39 Food & Function
12
The static method used for gastric and small intestinal digestion provides data that aligns well
with use of the more complex dynamic digestion models21,22
and is well correlated with results
for bioavailability in human participants.23
Micellarization during digestion was largely
dependent on the presence of exogenous fat and the relative hydrophilicity of the carotenoids
(LUT > AC, βC > LYC, ZEA esters) as reported previously.14,24-26
Xanthophylls, and likely α-
TC, are located on the surface of lipid droplets and thus more readily transferred to mixed
micelles than hydrocarbon carotenoids that are localized within the core.27
The efficiency of
micellarization of ZEA was markedly below that of lutein likely due to the fact that the majority
of the xanthophyll present in wolfberry exists as a di-ester,28,29
and the ability of the mixed
micelles to accommodate the carotenoid esters is less than that of the free xanthophylls.29
Hydrolysis of carotenoid esters is mediated by carboxyl ester lipase, a relatively abundant
enzyme in exocrine pancreatic secretion30
and its activity in pancreatin utilized in the current
study appeared to be insufficient to generate free ZEA for greater incorporation into micelles.
Transfer of carotenoids, but not α-TC, from the salad to micelles was significantly greater when
the fat source was rich in unsaturated fatty acids (i.e., olive, canola and soybean oils) compared
to saturated fatty acids (i.e, butter). This is similar to recent observations involving in vitro
digestion of spinach and mixed salad with TG containing unsaturated long chain fatty acids.15,31
In contrast, Gleize et al.32
recently reported that xanthophylls were better micellarized during
digestion of a meal (minced beef with 5% fat and potatoes) with either butter or palm oil
compared to the meal containing olive or fish oils. The basis for the different effects of the
various fats on micellarization of the xanthophylls is unknown, but may be related to the
influence of type of dietary fat on the physicochemical characteristics of generated mixed
micelles, food matrix, and the presence of other lipophilic compounds in both the foods and the
Page 12 of 39Food & Function
13
exogenous fats.14,32-34
Unlike carotenoids, micellarization of α-TC was independent of type of
fat added to the salad meal. The greater hydrophilicity of the vitamin compared to the C40
carotenoids35
likely facilitates its partitioning from the oil droplet to bile salt mixed micelles
during the small intestinal phase of digestion.
With the exception of LUT, there was a concentration dependent increase in the micellarization
of the carotenoids and α-TC for salad containing 0-8% soybean oil. The decreased efficiency of
micellarization of LUT in salad containing 8% in raw vegetable mixtures also has been reported
to decrease with relatively high concentrations of oils and this may be due to incomplete
digestion of the oil in the in vitro system.14,15
The general influence of amount of exogenous fat
on the bioaccessibility of the carotenoids and α-TC is similar to reports that meals containing
>12g exogenous fats enhanced the absorption of these compounds compared to meals with ≤8g
fat.7-9, 36
In contrast, Roodenburg et al.10
reported that absorption of LUT esters, but not βC or α-
TC, added to a meal as a supplement was enhanced when intake of fat was 36g rather than 3g.
This is likely due to the increased secretion of pancreatic enzymes and thus carboxyl ester lipase,
as well as bile salts with the high fat load.
After transfer of carotenoids and α-TC from the food matrix to mixed micelles, the compounds
are transported across the brush border membrane of absorptive epithelial cells at least in part by
various proteins including SR-B1 and NPC1L1.2,3,37,38
The potential influence of different lipid
digestion products on the interaction of micelles with the cell surface has received limited
attention. We observed that the percentage of LUT, ZEA, AC, βC. LYC and α-TC in micelles
generated during simulated digestion taken up by Caco-2 cells was minimally influenced by the
source of fat added to vegetable salad. For example,, uptake of LYC and α-TC was lower when
Page 13 of 39 Food & Function
14
butter was substituted for one of the vegetable oils in the salad. Gleize et al.32
have reported that
uptake of xanthophylls by Caco-2 cells from digested sweetcorn was greater when the meal
contained palm and olive oils compared to sunflower and fish oils and that the difference was not
correlated with size of the mixed micelles. Various lipid digestion products including
acylglycerols, fatty acids, phospholipids and lyso-phospholipids have been shown to
differentially affect the uptake of carotenoids from micelles by Caco-2 cells.14,15,19,39
These data
suggest that the sources of dietary lipids may influence apical uptake of micellarized compounds
by absorptive epithelial cells.
The strategy for investigating the potential effects of various dietary fats on the secretion of
carotenoids across the basolateral membrane of Caco-2 cells integrated several approaches used
successfully by other investigators. Mixtures of fatty acids resembling those most abundant in
the fat sources of interest were introduced to apical medium in mixed micelles to stimulate
secretion of apoB containing TG-rich lipoproteins by Cao-2 cells.40-42
Lutein and βC served as
representative oxy- and hydro-carbon carotenoids. Similar to During et al.23
these carotenoids
and α-TC were incorporated into Tween 40 micelles for apical delivery to the cells with the
assumption that similar amounts of these compounds would be taken up by cells. Acute
exposure of the cells to medium containing the micelles with the various mixtures of fatty acids
markedly increased transport of the carotenoids and α-TC into the basolateral compartment,
while minimally affecting uptake from apical medium. Micelles containing mixtures of fatty
acids resembling the oils rich in unsaturated fatty acids stimulated secretion of the lipophiles to a
greater extent than micelles with the mixture of fatty acids resembling butter. This stimulatory
effect was correlated with the amounts of TG and apoB secreted into the basolateral
compartment. Mono-unsaturated fatty acids and particularly oleic acid are potent inducers of
Page 14 of 39Food & Function

15
chylomicron assembly and secretion by Caco-2 cells.43,44
Similarly, consumption of a single
meal with either olive oil or sunflower oil induced a greater lipemic response than the meal with
butter.45
The carotenoids were largely (≥ 85%) located in the TG-rich fractions in basolateral
medium, whereas only 60% of secreted α-TC was present in this fraction. It has been shown that
absorption of α-TC is mediated by both chylomicron-dependent and chylomicron-independent
pathways with the former predominant in the postprandial state.46
Cells also were exposed to micelles with the mixtures of fatty acids for 4d before co-exposing to
both the complex micelles, carotenoids and α-TG. Daily pre-exposure was limited to 4h because
chronic exposure to micelles rich in saturated fatty acids can adversely affect the integrity of the
brush border membrane and tight junctions.40.41,47
Our treatment protocol did not compromise
barrier integrity, but altered the fatty acyl composition of the brush border membrane. The
decreased uptake of carotenoids and α-TC by cells chronically exposed to the mixtures of fatty
acids may have been due to changes in permeability of the brush border membrane and perhaps
the activity of specific membrane transporters. In contrast, the amounts and efficiency of
secretion of the carotenoids and α-TC across the basolateral membrane were greater than that in
response to acute exposure. These increases was correlated with the secretion of greater
quantities of TG and apoB. The amounts of carotenoids and α-TC secreted into the basolateral
compartment also was proportional to the concentrations of the fatty acids present in the apical
compartment. Because chylomicrons and VLDL contain a single molecule of apoB,48
the
increased secretion of apoB and greater ratio of TG to apoB in the TG-rich fraction in the
basolateral compartment suggest that the increased basolateral secretion of LUT, βC and α-TC
resulted from secretion of a greater number of larger chylomicrons across the basolateral
Page 15 of 39 Food & Function
16
membrane. The results also suggest that carotenoids and α-TC are not necessarily shunted into
intracellular TG rich droplets upon entering the cell, but are more likely to be transferred to the
maturing lipoprotein particles in the ER and Golgi.1
Results of the current study demonstrate that co-consumed dietary lipid, in the form of fats and
oils, may modulate carotenoid and vitamin E bioavailability at multiple points in the digestive
and absorptive process. While type and amount of lipid will impact micellarization and intestinal
uptake, these effects are modest compared to apparent impact of lipid type and quantity on
chylomicron synthesis and secretion. The effects of the amounts and types of mixtures of fatty
acids on the micellarization, uptake and trans-epithelial transport by Caco-2 cells align well with
our recent finding that the absorption of carotenoids from a mixed salad meal with 20g of
exogenous fat exceeded that from the salad containing either 3 g or 8g and that there was a
tendency for carotenoids to be more efficiently absorbed when the meal contained fats rich in
unsaturated fatty acids (i.e., canola and soybean oils) compared to butter.9 Combined these
results suggest that co-consumption of modest amounts of fats/oils rich in unsaturated fatty acids,
particularly mono-unsaturated fatty acids, may promote bioavailability of fat soluble
micronutrients and phytochemicals from commonly consumed vegetables.
Experimental
Reagents
Dulbecco’s minimal essential medium (DMEM), antibiotics, enzymes, porcine bile extract and
bile acids were purchased from Sigma Chemical Co. (St. Louis, MO). Fetal bovine serum,
trypsin, L-glutamine and non-essential amino acids were purchased from Invitrogen (Chicago,
IL). Lipid-reduced FBS was purchased from Hyclone (Logan, Utah). Fatty acids were obtained
Page 16 of 39Food & Function
17
from Matreya Inc. (Pleasant Gap, PA). HPLC grade solvents and other reagents were purchased
from Fisher Scientific (Pittsburgh, PA).
Salad meal
A typical western salad was prepared with fresh tomatoes (90g), carrots (62g), spinach (50g),
romaine lettuce (25g), and dried wolfberry (Lycium barbarum; 7g). The composition of this test
salad was selected to match that of a previous clinical trial 9 in order to facilitate comparison of
in vivo and in vitro responses. Sun-dried wolfberries were purchased from an Asian market in
Columbus, OH, and were re-hydrated with an equal volume of deionized water for at least 1 h
before preparing a puree. Other vegetables and tomatoes were purchased from local markets,
washed with tap water, rinsed with deionized water, drained and homogenized with kitchen
blender to a puree after adding wolfberry puree. The salad puree contained the following
quantities of carotenoids: LUT (89% all-trans), 15.2 ± 0.5 µg/g; zeaxanthin (ZEA; 95% di-esters;
3% mono-esters, 2% non-esterified), 12.8 ± 0.7 µg/g; all-trans α-carotene (AC), 16.5 ± 0.3 µg/g;
β-carotene (βC; 94% all-trans), 23.5 ± 1.0 µg/g; and, lycopene (LYC; 95% all-trans), 23.2 ± 0.8
µg/g. Endogenous α-TC content was 10.9 ± 0.2 µg/g. Salad puree was stored in aliquots at -
80°C under N2 and used for in vitro digestion within four weeks. There was no significant
change in carotenoid and α-TC content during storage.
Effect of type of TG on bioaccessibility of carotenoids and α-TC
Either 3% (wt/wt) butter, olive oil, canola oil or soybean oil was added to salad puree (2.4 g) to
determine the effects of lipid source on stability and efficiency of micellarization of carotenoids
and α-TC during simulated gastric and small intestinal digestion. Butter was melted in
microwave for 20 sec before addition to reaction tubes at 37°C. In a separate experiment, the
Page 17 of 39 Food & Function

18
amount of soybean oil added to salad puree was varied (1%, 3% or 8% wt/wt) to determine the
dose-dependency of micellarization of the carotenoids and α-TC. Simulated gastric and small
intestinal digestion was performed as previously reported49
, except that simulated small intestinal
reactions contained 2.8, 1.4 and 4.8 mg/mL of acetone-precipitated porcine pancreatin (Sigma
product P4251), porcine pancreatic lipase, and porcine bile extract, respectively. After
completion of the small intestinal phase of digestion, an aliquot of chyme was centrifuged at
12,000 x g, 4°C, for 45 min to separate the aqueous fraction from undigested materials.
Supernatant was passed through a syringe filter (0.2 µmeter pores) to collect the mixed micelle
fraction. Aliquots of chyme and aqueous fraction were stored at -20°C under nitrogen gas for a
maximum of one week before extraction and analysis of carotenoids and α-TC. Recovery as
determined by dividing the concentration of total carotenoids and α-TC in chyme by the
concentrations in pre-digested salad puree was 83.8 ± 8% and 93 ± 1.4%, respectively.
Bioaccessibility was determined by dividing the concentrations of carotenoids and α-TC in the
filtered aqueous fraction (subsequently referred to as the micelle fraction) by that in pre-digested
pureed salad meal with exogenous fats.
Caco-2 cell cultures
Caco-2 human cells (HTB37) were purchased from the American Type Culture Collection
(ATCC, Rockville MD). This parental cell line does not express β-carotene oxygenase activity
and therefore does not cleave carotenoids to retinaldehyde and other apo-carotenoids.50
Maintenance of the cells has been described previously49
and differentiated cultures were used
for experiments between passages 26 and 32. For experiments, cells were seeded in either 6-well
dishes (2.5 x 10⁵ cells/well) or onto polycarbonate inserts (2.5 x 10
5 cells per Transwell®, 3.0
Page 18 of 39Food & Function

19
µm pore size; Millipore, MA). Fresh medium was added to cultures every second day and the
day prior to initiating experiments.
Effect of source of TG on uptake of carotenoids and αααα-TC by Caco-2 cells
Aliquots of the micelle fraction generated during digestion of the salad were diluted (1:4) with
serum-free DMEM and added to wells with monolayers of Caco-2 cells adhered to the dish
surface at 12-14 d post-confluency. After 4 h incubation (37˚C, 90% humidity, 95% air: 5%
CO2), medium was removed and the monolayer washed once with ice cold HEPES (15 mmol/L)
buffered saline containing 2 g/L bovine serum albumin, pH 7.0, and twice with cold HEPES
buffered saline without albumin. Possible adverse effects of 4h exposure of the monolayers to
diluted micelle fraction generated during digestion of vegetable salad containing different
sources and amounts of fat/oils were considered. Phase contrast microscopic observation of the
monolayer and individual cells and the amount of protein per well of control and treated cultures
were not significantly different. Cells were collected and stored under N2 at -80˚C for a
maximum of one week prior to analysis of carotenoid and α-TC content.
Effect of fatty acyl composition of dietary TG on basolateral secretion of LUT, βC and αααα-
TC
Three different experiments were performed to determine the influence of mixtures of fatty acids
resembling the fatty acyl composition of butter, olive oil, canola oil and soybean oil on apical
uptake and basolateral secretion of LUT, βC and α-TC. In the first experiment, medium
containing both micelles with a mixture of fatty acids mimicking one of fats added to salad and
Tween micelles with the carotenoids and α-TC was added to the apical compartment of
Page 19 of 39 Food & Function

20
monolayers grown on membrane inserts at 21 post-confluency. Cultures of this age were used as
Levy et al.51
reported that maximum chylomicron assembly and secretion occurred 3-4 weeks
after monolayers became confluent. A second experiment with 21 d post-confluent cultures
determined the effect of the concentration (0-2 mmol/L) of the fatty acid mixture mimicking that
of soybean oil to determine the impact of fatty acyl dose on the basolateral secretion of the
carotenoids and α-TC. As individuals are likely to habitually ingest a particular source of dietary
triglycerides and fatty acyl composition of membrane phospholipids reflects dietary intake,
cultures of Caco-2 cells were exposed to apical medium containing micelles with the different
fatty acid mixtures (but without carotenoids and α-TC) for 4 h daily on days 17-20 post-
confluency. Washed monolayers were exposed to fresh medium with the same fatty acid
mixture and Tween micelles containing LUT, βC and α-TC on day 21.
Media containing mixed micelles with the various mixtures of fatty acids for addition to the
apical compartment were prepared as described elsewhere.49,52
The initial composition of the
medium was fetal bovine serum free DMEM supplemented with 2 mmol/L L-glutamine, 1%
non-essential amino acids, 0.5 mmol/L phenol red, antibiotics and 1 mmol sodium taurocholate,
This was added to dried preparations of a lipophilic mixture to prepare test medium to prepare
test medium containing 0-2 mmol/L mixture of fatty acids mimicking the fatty acyl composition
of test TG (Table 2), 0.5 mmol/L mono-olein, 0.2 mmol/L phosphatidylcholine (PC,; 0.2 mmol/L
lyso-PC and 0.05 mmol/L cholesterol,. LUT (10 umol/L), βC (10 umol/L) and α-TC (10 umol/L)
were delivered in Tween 40 micelles (0.1% final concentration) as described by During et al.53
Medium (2 mL) containing the micelles with the fatty acyl profile mimicking the dietary lipid of
interest and 10 µmol/L LUT, βC and α-TC was added to apical compartment of washed
monolayers. Phenol red-free DMEM (3 mL) containing 1% fetal bovine serum, 2 mmol/L L-
Page 20 of 39Food & Function
21
glutamine, 1% non-essential amino acids and antibiotics was added to the basolateral
compartment. For all three experiments, apical and basolateral media were collected after 8h and
monolayers were rinsed once with cold PBS containing 2g bovine albumin/L and twice with cold
PBS. Phenol red flux to basolateral membrane and protein content per insert were not
significantly altered by any of the indicated treatments. Cells were removed from surface of the
insert by scrapping with a plastic scraper, collected in PBS, and pelleted by centrifugation (400 x
g, 4°C, 5 min). Aliquots of media and the cell pellet were stored under N2 at -80˚C for a
maximum of one week before analysis. Stability of carotenoids and α-TC in medium after 8h
incubation in the absence of cells was 95 ± 2% and 96 ± 1%, respectively. Phenol red transport
from the apical to the basolateral chamber and cell protein content per well were measured to
assess possible adverse effects of the treatments on the monolayer There were no significant
differences in these markers for control cultures and cultures treated once or chronically (5x)
with the micelles with any of the fatty acid mixtures. Uptake refers to the total quantity of the
carotenoids and α-TC in the cell monolayer and the basolateral compartment. Basolateral
secretion refers to the quantities of carotenoids and α-TC transported into basolateral medium.
Analyses of carotenoids and α-TC
Thawed samples (1-3mL) of salad puree, chyme and micelle fraction were extracted into 3 vol
tetrahydrofuran : hexane (1:1, v/v) containing 0.1% triethylamine. Extraction was repeated three
times and organic phases were combined and dried at room temperature under nitrogen. The
film was resolubilized in methanol (MeOH): methyl-tert-butyl-ether (MTBE) : (1:1) and
analyzed immediately. Caco-2 cell pellets were thawed before adding 2 mL PBS and 1.5 mL
ethanol containing 34.6 mmol/L sodium dodecyl sulfate and 4.5 mmol/L butylated
hydroxytoluene. The suspension was sonicated for 20 sec and carotenoids were extracted as
Page 21 of 39 Food & Function

22
above. Carotenoids and α-TC in apical and basolateral media also were extracted as above. The
HPLC system consisted of a Waters 2695 separation module with a 2996 photodiode array
detector controlled by an Empower workstation (Waters, Milford, MA). An analytical polymeric
YMCTM
C30 column (4.6 mm i.d. x 150 mm, particle size 5 µm; Waters, Milford, MA) protected
by C18 guard column (4.6 mm i.d. x 50 mm) with the same packing was used to separate the
carotenoids and α-TC. Sample and column temperatures were maintained at 10°C and 35°C,
respectively. Carotenoids and α-TC were eluted from the column using a gradient described by
Weller and Breithaupt.54
Solvent A consisted of MeOH : MTBE: 2% ammonium acetate
(83:15:2, v/v/v) and solvent B consisted of methanol : MTBE : water (8:90:2, v/v/v). The
following linear gradient was used at flow rate 0.6 mL/min : 0 to 10 min, 100% A; 10 to 40 min,
50% A; 40 to 50 min, 100% B; 50 to 55 min, 100% A. Elution of carotenoids and α-TC were
monitored at 450 nm and 292 nm, respectively. Carotenoids and α-TC were identified by
comparison of retention time and spectra with pure standards. Concentrations were determined
by comparison of area under the curve with those generated by analysis of six different
concentrations of pure (>98%) all-trans-carotenoids and α-TC. The extinction coefficients
(E1%
1cm) used were 2550 for LUT at 445 nm, 2540 for ZEA at 450 nm, 2710 and 2592 for all-
trans AC and all-trans βC at 450 nm, and 3450 for all-trans LYC at 470 nm.55,56
The extinction
coefficient used for α-TC was 75.8 at 292 nm.57
Cis-isomers of carotenoids were also identified
by comparison of retention time and spectra, and concentrations were quantitatively estimated
using extinction coefficients for their respective all trans-isomers. Echinenone was used as an
internal standard with recovery ranging from 93 to 96%. Detection limit was identified as a
signal to noise ratio ≥ 3 and was ≥ 5 ng/mL for carotenoids and ≥ 20 ng/mL α-TC.
Page 22 of 39Food & Function

23
TG, apoB, carotenoid and α-TC in cells and basolateral medium
Initially, basolateral medium was subjected to sequential density gradient ultracentrifugation as
described by Luchoomun and Hussain58
to characterize the distribution of carotenoids and α-TC
in large chylomicrons [Svedberg units (Sf) >400], small chylomicrons (Sf = 60-400), VLDL
particles (Sf = 20-60, 1.5 mL) and the remaining fraction (referred to as “other”). Fractions rich
in large and small chylomicrons were pooled for accurate quantification of carotenoids and α-TC.
In subsequent experiments basolateral medium was centrifuged (28,000 x g for 18h at 4°C) to
collect the TG-rich fraction (d.< 1.019 g/mL)59
to measure TG, apoB, carotenoids and α-TC.
Cell pellets were homogenized on ice in PBS containing a cocktail of protease inhibitors.
Lipids in homogenized cells were extracted into 4 vol chloroform-methanol (2:1, v/v). Dried
samples were re-solubilized in tert-butanol: MeOH : Triton X-100 (3:1:1, v/v/v) before vortexing
and centrifuging (34,000 x g, 120 sec). The supernatant was collected for TG and apoB content.
Intracellular and secreted TG was determined with Sigma kit TR0100 according to
manufacturer’s procedure to distinguish free glycerol from glycerol generated during hydrolysis
of TAG by lipoprotein lipase. Caco-2 cells synthesize both apoB-48 and apoB-100 unlike
enterocytes that synthesize apoB-48 only.60
Intracellular and secreted apoB were measured by
ELISA using AssayMax Human apoB kit containing polyclonal antibodies that recognizes both
apoB-48 and apoB-100 (AssayPro, St. Charles, MO). Results are reported as total µg apoB
based on the apoB standard provided in the kit.
Plasma membrane fatty acyl profile
Fatty acyl composition of membrane phospholipids reflects dietary intake of esterified fatty
acids.61
Therefore, cultures of Caco-2 cells were incubated in apical medium without carotenoids
and α-TC, but containing micelles with fatty acyl mixtures that mimic those in soybean oil (0-2
Page 23 of 39 Food & Function

24
mmol/L total fatty acids) for 4h daily from 17-20d post-confluency. Then medium in the apical
and basolateral compartments was aspirated and replaced by complete DMEM containing 7.5%
FBS until the next day. At 21d post-confluency, fresh medium with micelles containing
mixtures of fatty acids was added to apical compartment and medium with 1% FBS to the
basolateral compartment as above. After 8h, monolayers were washed. Brush border and
basolateral membranes were isolated from Caco-2 cells according to Ellis et al.62
The specific
activity of sucrase63
and Na+-K+-ATPase64
in the brush border and basolateral membrane
vesicles were 14-fold and 17-fold greater, respectively, than in homogenate. Fatty acyl
composition of membrane phospholipids was determined according to Miwa.65
Briefly, fatty
acyl hydrazides were prepared after saponification and extracted into hexane. Fatty acyl
hydrazides were separated on a J’sphere ODS-M 80 column (250 x 4.6 mm i.d., particle size
4µm, Waters, Milford, MA) with a guard cartridge (J’sphere ODS-M 80) using isocratic elution
with acetonitrile : methanol : water (75:11:14) maintained at pH 4-5 at flow rate 1.2 mL/min.
Elution was monitored at 400 nm and specific fatty acid derivatives were identified by
comparing retention time, spectral characteristics and area under curve with fatty acid standards.
Miscellaneous
Protein content of cell homogenates was quantified using the bicinchoninic acid assay kit with
bovine serum albumin as standard (Pierce, Rockford, IL). Monolayer integrity of cells on inserts
was assessed by apical to basolateral flux of phenol red.66
Apical to basolateral flux of phenol
red in cultures containing 0 (control) to 2 mmol/L fatty acids in the apical compartment, i.e.,
0.052 ± 0.002% of phenol red present in the apical chamber at beginning of experiment was
transported to the basolateral chamber during the 8h incubation period.” Statistics
Page 24 of 39Food & Function

25
Data are expressed as means ± standard deviation (SD) and were analyzed for statistically
significant differences using the GLM procedure of SAS (SAS Institute Inc., Cary, NC). The
effect of different TAG on recovery, efficiency of micellarization of carotenoids and α-TC, and
their uptake by Caco-2 cell were analyzed using one way ANOVA followed by Bonferroni and
Duncan's Multiple Range Tests. Effects of different types of lipid mixtures and acute vs. chronic
exposure to such mixtures on quantities and amounts of TAG and apoB in cells and in
basolateral medium were similarly analyzed. A two-way ANOVA was performed to identify
differences in transport of carotenoids and α-TC in cultures incubated with the various types and
amounts (0-2 mmol/L) of fatty acyl mixtures followed by Tukey’s HSD (honestly significant
difference) test. Statistically significant differences were set at p< 0.05. Pearson’s correlation
coefficients (r) were calculated to determine associations between carotenoids, α-TC and TAG,
apoB and ratio of TAG/apoB. All variables were checked for normal and homogeneous variance
using Levene’s test. Data were log-transformed for analysis when variance lacked homogeneity.
Acknowledgments
We appreciate helpful conversations with Earl Harrison at the beginning of this project and the
assistance of Jureeatn Sanpote with statistical analysis of data. This work was supported by
USDA-NRI 2007-023313 and The Ohio Agricultural Research and Development Center
(OARDC).
References
1. J. Iqbal and M. M. Hussain, Am. J Physiol. Endocrinol. Metab., 2009, 296, E1183-
E1194.
2. E.H. Harrison, Biochim. Biophys. Acta., 2012, 1821, 70-77.
Page 25 of 39 Food & Function

26
3. P. Borel, D. Preveraud and C. Desmarchelier, Nutr. Rev., 2013, 71, 319-331.
4. J. J. M. Castenmiller and C. E. West, Ann. Rev. Nutr., 1998, 18, 19-38
5. J. D. Ribaya-Mercado, Nutr. Rev.,2002, 60,104-110.
6. P. Jayarajan, V. Reddy and M. Mohanram, Indian J. Med. Res., 1980, 71, 53-56.
7. M. J. Brown, M. G. Ferruzzi, , M. L. Nguyen, D. A. Cooper, A. L. , Eldridge,
S. J. Schwartz and W. S. White, Am. J. Clin. Nutr., 2004, 80, 396-403.
8. N. Z. Unlu, T. Bohn, S. K. Clinton and S. J. Schwartz, J. Nutr., 2005, 135, 431-436.
9. S. R. Goltz, W. W. Campbell, C. Chitchumroonchokchai, M. L. Failla and Ferruzzi, M.
Mol. Nutr. Food Res., 2012, 56, 866-877.
10. A. J. C. Roodenburg, R. Leenen, K. H. van het Hof, J. A. Weststrate and L.
B. M. Tijburg, Am. J. Clin. Nutr., 2000, 71, 1187-1193.
11. X. Hu, R. J. Jandacek and W. S. White, Am. J. Clin. Nutr., 2000, 71, 1170-1180.
12. R. M. Clark, L. Yao, L. She, and H. C. Furr, Lipids, 2000, 35, 803-806.
13. O. O’Connell, L. Ryan, L. O’Sullivan, S. A. Aherne-Bruce and N. M. O’Brian,
Int. J. Vitam. Nutr. Res., 2008, 78, 238-246.
14. T. Huo, M. G. Ferruzzi, S. J. Schwartz and M. L. Failla, J. Agric. Food Chem. ,
2007, 55, 8950-8957.
15. E. Kotake-Nara and A. Nagao, Biosci. Biotechnol. Biochem., 2012, 76, 875-882.
16. D. Hollander and P. E. Ruble, Am. J. Physiol:Gastro Liver., 1978, 235, E686-E691
17. P. Borel, V. Tyssandier, N. Mekki, P. Grolier, Y. Rochette, M. C. Alexandre-Gouabau,
D., Lairon and V. Azais-Braesco, J. Nutr., 1998, 128, 1361-1367.
18. R. Lakshminarayana, M. Raju, T. P. Krishnakantha and V. Baskaran, Mol. Cell
Biochem., 2006, 281, 103-110.
19. S. I. Koon and S. K. Noh, J. Nutr., 2001, 131, 717-722.
20. WHO 2010 Report: Global and Regional Food Consumption Patterns.
www.WHO.int/entity/Dietphysicalactivity/publications../gsfao=global.pdf.
Access on Step 13, 2013
21. E. Deat, S. Blanquet-Diot, J.F. Jarrige, S. Denis, E. Beyssac and M. Alric,
Page 26 of 39Food & Function

27
J. Agric. Food Chem., 2009, 57, 11314-11320.
22. S. Diot-Blanquet, M. Soufi, M. Rambeau, E. Rock and M. Alric, J. Nutr., 2009,
139, 876-883.
23. E. Reboul, M. Richelle, E. Perrot, C. Desmoulins-Malezet, V. Pirisi and P. Borel,
J. Agric. Food Chem., 2006, 54, 8749-9755.
24. D.A. Garret, M.L. Failla and R.J. Sarama, J. Agric. Food Chem., 1999, 47, 4301-
4309.
25. R. Pullakhandam and M.L. Failla, J. Medicinal Food., 2007, 10, 252-257.
26. C. Sy, B. Gleize, O. Dangles, J.F. Landrier, C.C. Veyrat and P. Borel, Mol. Nutr. Food
Res., 2012, 56, 1385-1397.
27. P. Borel, P. Grolier, M. Armand, A. Partier, H. Lafont, D. Lairon, and
V. Azais-Braesco, J. Lipid Res., 1996, 37, 250-261.
28. D .E. Breithaupt, A. Bamedi and U. Wirt, Comp. Biochem. Physiol. B Biochem. Mol.
Biol., 2002, 132, 721-728.
29. C. Chitchumroonchokchai and M.L. Failla, J. Nutr., 2006, 136, 588-594.
30. E. A. Rudd and H. L. Brockman, Pancreatic carboxyl ester lipase (cholesterol
esterase), in Lipases., B. Borgstrom and H. L. Brockman , Editors, 1984, Elsevier
Science, New York, p. 185–204.
31. A. Nagao, E. Nara-Kotake and M. Hase, Biosci. Biotechno.l Biochem.,
2013, 77, 1055-1060.
32. B. Gleize, F. Tourniaire, L. Depezay, R. Bott, M. Nowicki, L. Albino, D. Bairon,
E. Kesse-Guyor, P. Galan, S. Hercberg and P. Borel, Bri. J. Nutr., 2013, 110, 1-10.
33. F. Granado-Lorencio, B. Olmedilla-Alonso, C. Herrero-Barbudo, I. Blanco-Navarro,
B. Perez-Sacristan and S. Blanzquez-Garcia, Food Chem., 2007, 102, 641-648.
34. C. Qian, E. A. Decker, H. Xiao and D. J. McClements, Food Chem., 2012, 135, 1440-
1447.
35. D.A. Cooper, D.R. Webb and J.C. Peters, J. Nutr., 1997, 127, 1699S-1709S.
36. Y.M. Jeans, W.L. Hall, S. Ellard, E. Lee and J.K. Lodge, Bri. J. Nutr.,
2004, 92, 575-579.
37. E. Reboul and P. Borel, Process. Lipid Res., 2011, 50, 388-402.
Page 27 of 39 Food & Function

28
38. T. Takada and H. Suzuki, Mol Nutr Food Res., 2010, 54, 616-622.
39. L. Yonekura, W. Tsuzuki and A. Nagao, Lipids., 2006, 41, 629-636.
40. M.M. .J. van Greevenbroek, G. van Meer, D.W. Erkelens and T.W.A. de Bruin,
Atherosclerosis., 1996, 121, 139-150.
41. P.A. Bateman, K.G. Jackson, V. Maitin, P. Yaqoob and C.M. Williams,
Biochim. Biphys. Acta., 2007, 1771, 475-485.
42. D. Chateu, T. Pauquai, F. Delers, M. Rousset, J. Chambaz and S. Demignot,
J. Cell Physiol., 2005, 202, 767-776.
43. E.J. Field, E. Albright and S.N. Mathur, J. Lipid Res., 1988, 29, 1427-1437.
44. N. Dashi, E.A. Smith and P. Alaupovic, J. Lipid Res., 1990, 31, 113-123.
45. N. Mekki M. Charbonnier, P. Borel, J. Leonardi, C. Juhel, H. Portugal and
D. Lairon, J. Nutr., 2002, 132, 3642-3649.
46. K. Anwar, H .J. Kayden and M. M. Hussain, J. Lipid Res., 2006, 47, 1261-1273.
47. K. G. Jackson, P. A. Bateman, P. Yaqoob and C .M. Williams, Lipids., 2009, 44,
1081-1089.
48. J. Elovson, J. E. Chatterton, G. T. Bell., V. N. Schumaker, M.A. Reuben,
D.L. Puppione, J.R. Reeve and N.L. Young, J. Lipid Res., 1988, 29, 1461-147349.
49. C. Chitchumroonchokchai, S. J. Schwartz and M. L. Failla, J. Nutr., 2004, 134, 2280-
2286.
50. A. During, G. Albaugh and J.C. Smith, Jr. Biochem. Biophys. Res. Comm., 1998, 249,
467-474.
51. E. Levy, M. Mehran and E. Seidman, FASEB J., 1995, 9, 626-635.
52. T. Ranheim, A. Gedde-Dahl, A. C. Rustan and C. A. Drevon, Biochim. Biophys. Acta.,
1994, 1212, 295-304.
53. A. During, M. M. Hussain, D. W. Moreland, E. H. Harrison, J. Lipid Res., 2002, 43,
1086-1095.
54. P.Weller and D. E. Breithaupt, J.. Agric. Food Chem., 2003, 51, 7044-7049.
55. G. Britton, In Carotenoids, G. Britton, S. Liaaen-Jensen, and H. Pfander, eds.,
Birkhauser, Basel, Switzerland, 1995, pp. 13–62.
Page 28 of 39Food & Function
29
56. E. J. Weber , J. Am. Oil Chem. Sci., 1987, 64, 1129-1134.
57. P. Schudel, H. Mayer and O. Isler, Tocopherols: Chemistry in The Vitamins.
2nd
ed. Vol. W.H. Jr. Sebrell and R. S. Harris, eds. 1972, Academic Press: New
York. p 168-218.
58. J. Luchoomun and M. . Hussain, J. Biol. Chem., 1999, 274, 19565-19572.
59. J. S. Cohn, E. J. Johnson, J. S. Millar, S.D. Cohn, R.W. Milne, Y.L. Marcel,
R.M., Russell and E.J. Schaefer, J. Lipid Res., 1993, 34, 2033-2040.
60. E. Levy, W. Yotov, E. G. Seidman, C. Garofalo, E. Delvin, and D. Ménard,
Biochim. Biophys. Acta, 1999, 1439 , 353-362.
61. T. A. Brasitus, N. O. Davidson and D. Schachter. Biochim. Biophys. Acta, 1985, 812,
460-472.
62. J. A. Ellis, M. R. Jackman and J. P. Luzio, Biochem. J., 1992, 283, 553-560.
63. A. Dahlqvist, Anal. Biochem. 1964, 7:18-25.
64. G. J. Siegel and B. G. Goodman, J. Biol. Chem., 1972, 247, 3630-3637.
65. H. Miwa, Anal. Chim Acta., 2002, 465, 237-255.
66. G. Rendina, Phenol red assay, In Experimental Methods in Biochemistry, V. George,
ed., 1971, W.B. Sounders Co. (Golden Series), Philadelphia, p 51-56.
Page 29 of 39 Food & Function

30
Table 1. Dietary oils (3% wt:wt) promote partitioning of carotenoids, , but not α-TC, in
mixed micelles during simulated digestion of salad to greater extent than butter. *
Carotenoids
Efficiency of micellarization (%)
No fat Butter Olive oil Canola oil Soybean oil
Total LUT 10.3 ± 0.3% 46.1 ± 1.1b 49.2 ± 2.4
a 52.0 ± 1.4
a 52.5 ± 1.8
a
trans-LUT 10.3 ± 0.3% 45.7 ± 1.1b 48.5 ± 2.4
a 52.1 ± 1.4
a 52.4 ± 2.1
a
cis-Lut nd 50.0 ± 1.2a 54.3 ± 1.2
a 50.9 ± 1.1
a 53.4 ± 1.2
a
Total ZEA
5.3 ± 0.5%
13.1 ± 2.1b
17.5 ± 4.2a
17.7 ± 1.3a
18.6 ± 5.5a
Free-ZEA 5.3 ± 0.5% 46.4 ± 1.7b 55.2 ± 1.2
a 55.9 ± 1.3
a 56.9 ± 1.2
a
ZEA mono-esters nd 5.1 ± 0.6b 8.7 ± 0.5
a 9.1 ± 0.6
a 8.2 ± 1.1
a
ZEA di-esters
nd 6.3 ± 0.8b 9.5 ± 1.0
a 11.0 ± 1.0
a 10.5 ± 1.5
a
AC
1.4 ± 0.3% 7.2 ± 0.3d 14.8 ± 0.9
b 12.8 ± 0.4
c 16.9 ± 1.7
a
Total ββββC nd 9.2 ± 0.5c 17.7 ± 1.6
a 14.9 ± 0.6
b 20.2 ± 1.4
a
trans-βC 9.3 ± 0.7c 18.1 ± 1.4
a 15.0 ± 1.0
b 20.5 ± 1.2
a
cis-βC
8.5 ± 0.5c 12.7 ± 0.5
b 13.3 ± 0.4
b 5.4 ± 0.8
a
Total LYC nd 1.6 ± 0.3b 5.4 ± 0.8
a 5.5 ± 0.6
a 5.1 ± 0.6
a
trans-LYC 1.5 ± 0.3c 5.1 ± 0.7
a 5.3 ± 0.5
a 4.6 ± 0.4
b
cis-LYC
2.7 ± 0.3b 8.2 ± 1.5
a 7.5 ± 1.8
a 10.5 ± 2.3
a
α-TC 8.2 ± 0.5% 42.0 ± 3.9a 45.2 ± 3.0
a 45.1 ± 4.2
a 41.8 ± 5.2
a
*Efficiency of micellarization is the (concentration of carotenoids and α-TC in the micelle
fraction after digestion of cassava with indicated fat divided by the concentrations in the
pre-digested salad meal) x 100%. Data are means ± SD for n=4 independent simulated
digestions of salad containing 3% test fat. nd, not detected. Means without a common
letter in a row differ significantly (p < 0.01).
Page 30 of 39Food & Function

31
Table 2. Fatty acyl mixtures in micelles prepared to resemble the fatty acyl profile of fats added
to salad puree.*
Fatty acids Butter
mimic
Olive oil
mimic
Canola oil
mimic
Soybean oil
mimic
Caprylic acid, C8:0 5.8
Capric acid, C10:0 3.0
Lauric acid, C12:0 5.2
Myristic acid, C14:0 17.0
Palmitic acid, C:16:0 35.1 11.9 4.9 12.4
Stearic acid, C18:0 12.2 0 2.2 4.3
Oleic acid, C18:1 21.7 78.1 68.2 25.7
Linoleic acid,C18:2 0 10.0 24.7 57.6
SFA: MUFA: PUFA 78:22:0 12:78:10 7:68:25 17:26:58
Data from US Department of Health and Human Services and US Department of Agriculture
2005 Dietary Guidelines for Americans were used to prepare mixtures of fatty acids that mimic
those most abundant in each commerical fat. .Palmitoic (16:1) and linolenic (18:3) acids were
not included in mixtures. Last row indicates the ratio of saturated fatty acids (SFA), mono-
unsaturated fatty acids (MUFA) and poly-unsaturated fatty acids (PUFA) present in each mixture.
Page 31 of 39 Food & Function

32
Table 3. Secretion of LUT, βC and α-TC (pmoL/well) to basolateral compartment in
cultures of Caco-2 cells chronically exposed to micelles containing fatty acids resembling
the composition of indicated dietary fats is proportional to fatty acyl content in apical
medium and types of fatty acids.1, 2
Type and amount of
fatty acyl mixture
β-carotene Lutein αααα-tocopherol
Butter mimic
0.5mM 71 ± 17hC
180 ± 35gB
503 ± 31hA
1.0mM 108 ± 25gC
299 ± 52fB
709 ± 34fA
2.0mM 237 ± 39fC
422 ± 59eB
961 ± 51eA
Olive oil mimic
0.5mM 449 ± 36dB
406 ± 42eB
732 ± 36fA
1.0mM 904 ± 71bB
634 ± 59cC
1180 ± 96dA
2.0mM 1281 ± 56aB
864 ± 35aC
1716 ± 93aA
Canola oil mimic
0.5mM 312 ± 37eB
301 ± 34fB
687 ± 75fA
1.0mM 643 ± 47cB
512 ± 57dC
1018 ± 94eA
2.0mM 941 ± 83bB
717 ± 46bC
1533 ± 101bA
Soybean oil mimic
0.5mM 248 ± 52fC
316 ± 22fB
572 ± 49gA
1.0mM 463 ± 53dB
402 ± 40eC
957 ± 91eA
2.0mM 680 ± 74cB
537 ± 53dC
1327 ± 111cA
1 Data are mean ± SD, n = 6 independent treatments per group.
2 Different lower case letters as superscripts within column indicate significant differences,
p<0.05, as determined by two-way ANOVA followed by Tukey’s HSD (honestly
significant difference) test. Different upper case letters as superscripts within row indicate
significant differences, p<0.05, as determined by two-way ANOVA followed by Tukey’s
HSD test.
Page 32 of 39Food & Function
33
Figure Legends
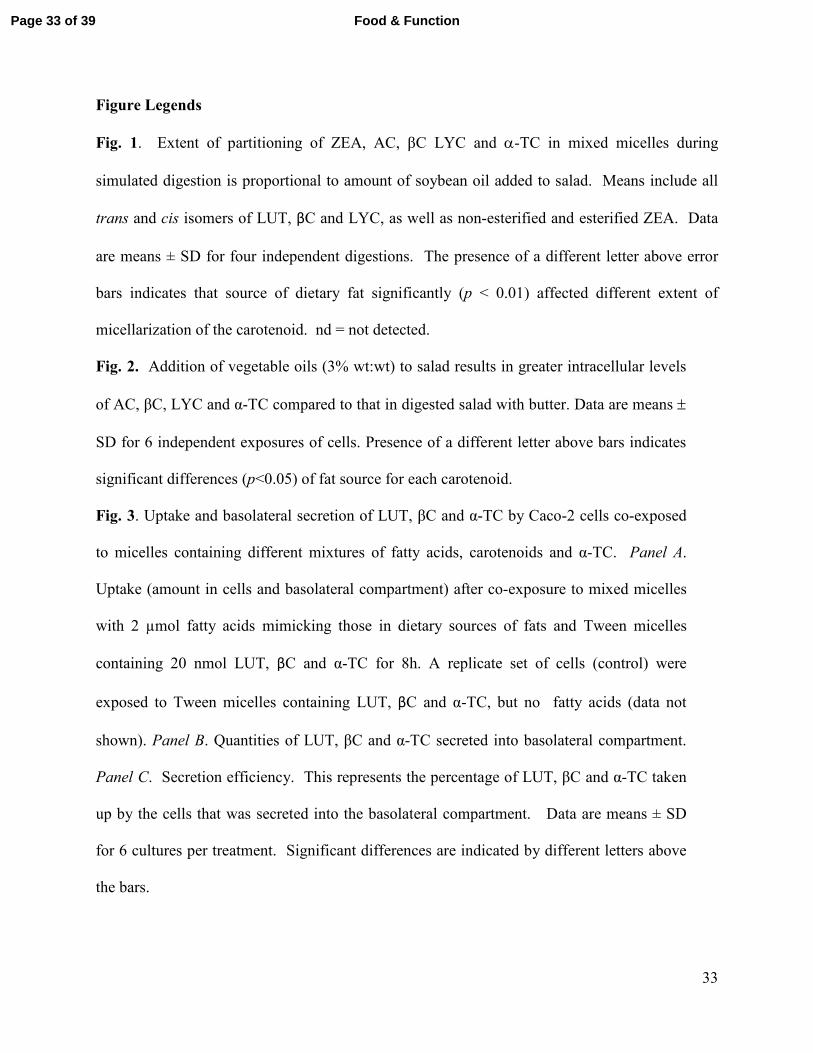
Fig. 1. Extent of partitioning of ZEA, AC, βC LYC and α-TC in mixed micelles during
simulated digestion is proportional to amount of soybean oil added to salad. Means include all
trans and cis isomers of LUT, βC and LYC, as well as non-esterified and esterified ZEA. Data
are means ± SD for four independent digestions. The presence of a different letter above error
bars indicates that source of dietary fat significantly (p < 0.01) affected different extent of
micellarization of the carotenoid. nd = not detected.
Fig. 2. Addition of vegetable oils (3% wt:wt) to salad results in greater intracellular levels
of AC, βC, LYC and α-TC compared to that in digested salad with butter. Data are means ±
SD for 6 independent exposures of cells. Presence of a different letter above bars indicates
significant differences (p<0.05) of fat source for each carotenoid.
Fig. 3. Uptake and basolateral secretion of LUT, βC and α-TC by Caco-2 cells co-exposed
to micelles containing different mixtures of fatty acids, carotenoids and α-TC. Panel A.
Uptake (amount in cells and basolateral compartment) after co-exposure to mixed micelles
with 2 µmol fatty acids mimicking those in dietary sources of fats and Tween micelles
containing 20 nmol LUT, βC and α-TC for 8h. A replicate set of cells (control) were
exposed to Tween micelles containing LUT, βC and α-TC, but no fatty acids (data not
shown). Panel B. Quantities of LUT, βC and α-TC secreted into basolateral compartment.
Panel C. Secretion efficiency. This represents the percentage of LUT, βC and α-TC taken
up by the cells that was secreted into the basolateral compartment. Data are means ± SD
for 6 cultures per treatment. Significant differences are indicated by different letters above
the bars.
Page 33 of 39 Food & Function

34
Fig. 4. Effect of chronic exposure of Caco-2 cells to different mixtures of fatty acids on
uptake and basolateral secretion of LUT, βC and α-TC. Cultures were exposed to medium
with mixed micelles containing the indicated fatty acyl mimics for 4h daily on days 17-20
post-confluency. At 21d, cultures were co-exposed to the micelles with the same mixtures
of fatty acids and Tween micelles containing 20 nmol LUT, βC and α-TC as in Figure 3.
Panel A. Uptake. Panel B. Quantities of compounds secreted into the basolateral
compartment. Panel C. Secretion efficiency. This is the percentage of each compound
taken up by the cell that was secreted into basolateral compartment. . Data are means ± SD
for 6 cultures per treatment. Significant differences are indicated by the presence of
different letters above the bars.
Fig. 5. Acute and chronic exposure of cultures to micelles rich in unsaturated fatty acids
significantly increases secretion of TG and apoB into basolateral compartment.
Page 34 of 39Food & Function
1
Fig. 1
0
10
20
30
40
50
60
Eff
icie
nc
y o
f m
ice
llari
za
tio
n(%
)
Lutein Zeaxanthin α-carotene β-carotene Lycopene αααα-tocopherol
a
a
aa
ab
b
b
b
b
c
cc
c
c
dd
d
ndnd
0%
1%
3%
8%
% soybean oila
b
c
d
Page 35 of 39 Food & Function

2
Fig. 2
0
5
10
15
20
25
30
35
40
45
butter canola oil
soybean oilolive oil
Ce
ll u
pta
ke
(p
mo
L/
mg
pro
tein
)
Lutein Zeaxanthin α-carotene β-carotene Lycopene αααα-tocopherol
a
aa
b
a
b
cbc
abc
d
a
bb
c
ba a
c
aaa
b
Page 36 of 39Food & Function

3
Fig. 3
0
1
2
3
4
5
6
7
0
100
200
300
400
500
600
0
2
4
6
8
10
12
14
Lutein β-carotene αααα-tocopherol
To
tal
up
take
(nm
ol/w
ell)
Ba
so
late
ral
se
cre
tio
n
(pm
ol/
we
ll)
Sec
reti
on
eff
icie
nc
y
(%)
A
B
C
a a a
b b aa a a
b
a a
a a
a
a
a
a
aa
a
b b
b
b b
cc
c
dd
d
a a
a
a a abb
b
c
c
c
d
e
butter
soybean oil
canola oil
olive oil
Fatty acyl mimics
no fatty acid
Page 37 of 39 Food & Function

4
Fig. 4
0
1
2
3
4
5
6
0
200
400
600
800
1000
1200
0
5
10
15
20
25
30
35
40
Lutein β-carotene αααα-tocopherol
To
tal
up
tak
e
(nm
ol/w
ell)
Ba
so
late
ral
sec
reti
on
(pm
ol/
we
ll)
Se
cre
tio
n e
ffic
ien
cy
(%)
A
B
C
a
a a
a
b bb b b b b
b
bb
c
a
a
a
b bb
b b
c
c
c
d
d
de
a a a
a
ab b b
b
c
c
c
d de
d
butter
soybean oil
canola oil
olive oil
Fatty acyl mimics
no fatty acid
Page 38 of 39Food & Function

5
Fig. 5
05
101520253035
0
5
10
15
20
25
30
35
TG
/Ap
oB
rati
o
a
b
c
de
AB
B
CC
p < 0.05
p < 0.05
NS NS
p < 0.05
0
10
20
30
40
50
60
70
80
90 acute-exposure
chronic- exposure
Tria
clg
lyce
roli
n T
RL
fra
ctio
n (µµ µµ
g/w
ell
)
AA
B
C
D
aa
b
cc
NS
p < 0.001
p < 0.001
p < 0.05
p < 0.001
no fatty acid butter olive oil canola oil soybean oil
Fatty acyl mimic
0
0.5
1.0
1.5
2.0
2.5
3.0
3.5
Ap
oB
in T
RL
fra
ctio
n (
µg
/we
ll)
aa
bb
AA
B
C
A
a
p < 0.001p < 0.001
p < 0.001
p < 0.05
NS
A
B
C
Page 39 of 39 Food & Function