differential roles of unsaturated and saturated fatty...
TRANSCRIPT

JPET # 184341
1
Differential Roles of Unsaturated and Saturated Fatty Acids on
Autophagy and Apoptosis in Hepatocytes
Shuang Mei, Hong-Min Ni, Sharon Manley, Abigail Bockus, Karen M Kassel,
James P Luyendyk, Bryan L Copple, and Wen-Xing Ding*
Department of Pharmacology, Toxicology and Therapeutics, The University of
Kansas Medical Center, Kansas City, KS 66160;
JPET Fast Forward. Published on August 19, 2011 as DOI:10.1124/jpet.111.184341
Copyright 2011 by the American Society for Pharmacology and Experimental Therapeutics.
This article has not been copyedited and formatted. The final version may differ from this version.JPET Fast Forward. Published on August 19, 2011 as DOI: 10.1124/jpet.111.184341
at ASPE
T Journals on M
ay 9, 2018jpet.aspetjournals.org
Dow
nloaded from

JPET # 184341
2
Running title: Fatty acids modulate autophagy and apoptosis
*Correspondence to: Wen-Xing Ding, Ph.D.; Department of Pharmacology, Toxicology and Therapeutics;The University of Kansas Medical Center MS 1018; 3901 Rainbow Blvd.; Kansas City, Kansas 66160; Phone: 913-588-9813, Fax: 913- 588-7501; Email: [email protected]
# Pages of text: 35; # Figures: 8; #Supplemental Figures: 7; # References: 43;
Abstract word #: 191; Introduction word #: 788; Discussion word #: 1269
Recommend section: Cellular and Molecular
Keywords: Autophagy; apoptosis; fatty acids; GFP-LC3; steatosis
List of Non-Standard Abbreviations:
Beclin-1 Bcl-2-interacting protein 1; BSA Bovine serum albumin; CQ Chloroquine DMSO Dimethylsulfoxide 4-EBP1 Translational initiation factor 4E binding protein-1 EM Electron microscopy FFA Free fatty acid LD Lipid droplets 3-MA 3-methyladenine mTOR Mammalian target of rapamycin NAC N-acetylcysteine NAFLD Nonalcoholic fatty liver disease OA Oleic acid PA Palmitic acid PE Phosphatidylethanolamine p70S6K 70-kDa ribosomal protein S6 kinase-1 ROS Reactive oxygen species TG Triglyceride
This article has not been copyedited and formatted. The final version may differ from this version.JPET Fast Forward. Published on August 19, 2011 as DOI: 10.1124/jpet.111.184341
at ASPE
T Journals on M
ay 9, 2018jpet.aspetjournals.org
Dow
nloaded from
JPET # 184341
3
Abstract
Fatty acid-induced lipotoxicity plays a critical role in the pathogenesis of non-
alcoholic liver disease. Saturated fatty acids and unsaturated fatty acids have
differential effects on cell death and steatosis but the mechanisms responsible for
these differences are not known. Using cultured HepG2 cells and primary mouse
hepatocytes, we found that unsaturated and saturated fatty acids differentially
regulate autophagy and apoptosis. The unsaturated fatty acid, oleic acid, promoted
the formation of triglyceride-enriched lipid droplets and induced autophagy but had a
minimal effect on apoptosis. In contrast, the saturated fatty acid, palmitic acid, was
poorly converted into triglyceride enriched lipid droplets, suppressed autophagy and
significantly induced apoptosis. Subsequent studies revealed that palmitic acid-
induced apoptosis suppressed autophagy by inducing caspase-dependent Beclin 1
cleavage, indicating crosstalk between apoptosis and autophagy. Moreover, our data
suggest that the formation of triglyceride enriched lipid droplets and induction of
autophagy are protective mechanisms against fatty acid-induced lipotoxicity. In line
with our in vitro findings, we found that high fat diet-induced hepatic steatosis was
associated with autophagy in the mouse liver. Potential modulation of autophagy
may be a novel approach that has therapeutic benefits for obesity-induced steatosis
and liver injury.
This article has not been copyedited and formatted. The final version may differ from this version.JPET Fast Forward. Published on August 19, 2011 as DOI: 10.1124/jpet.111.184341
at ASPE
T Journals on M
ay 9, 2018jpet.aspetjournals.org
Dow
nloaded from

JPET # 184341
4
Introduction
Lipotoxicity refers to cellular toxicity in the presence of excessive free fatty acids
(Malhi and Gores, 2008). Fatty acid-induced lipotoxicity in hepatocytes plays an
essential role in the pathogenesis of Nonalcoholic Fatty Liver Disease (NAFLD)
(Malhi and Gores, 2008; Neuschwander-Tetri, 2010). Fatty acids are chemically
classified as saturated and unsaturated (monounsaturated and polyunsaturated) and
their structure affects their biological functions. Palmitic acid (PA), a saturated fatty
acid, and oleic acid (OA), a monounsaturated fatty acid, are two of the most
abundant fatty acids present in the diet and in serum (Baylin et al., 2002). Saturated
and unsaturated fatty acids differentially regulate apoptosis in various experimental
systems in which saturated fatty acids are the more toxic lipid species (Listenberger
et al., 2003; Ricchi et al., 2009). Although the mechanisms underlying the cytotoxicity
of fatty acids are largely unknown, it has been suggested that the conversion of fatty
acids to triglyceride (TG) may reduce the cytotoxicity. For example, PA is poorly
converted to TG and more toxic whereas OA is readily converted to TG and less
toxic (Listenberger et al., 2003). Another possibility is that different fatty acids may
differ in their potential to activate endogenous cellular protective pathways. However,
this has not been explored in detail.
Macroautophagy (referred to as autophagy hereafter) is a major intracellular
degradation system. Autophagy is usually activated in response to the deprivation of
nutrients or growth factors (Kuma et al., 2004). Autophagy also plays a role in the
This article has not been copyedited and formatted. The final version may differ from this version.JPET Fast Forward. Published on August 19, 2011 as DOI: 10.1124/jpet.111.184341
at ASPE
T Journals on M
ay 9, 2018jpet.aspetjournals.org
Dow
nloaded from
JPET # 184341
5
pathogenesis of a number of human diseases, including obesity and steatosis (Singh
et al., 2009a; Zhang et al., 2009). To date, more than 30 Atg (autophagy) genes have
been defined which participate in autophagy or autophagy-related processes
(Klionsky et al., 2003; Mizushima, 2010). Mammalian microtubule-associated protein
1 light chain 3 (LC3), which is a homologue of yeast Atg8, is widely used as a marker
to monitor the autophagy process. After its synthesis, LC3 is rapidly cleaved by Atg4
(an autophagy protein which has protein protease activity) and the cleaved form
remains in the cytosol (called LC3-I) (Li et al., 2011b). Upon autophagy induction,
LC3 is conjugated with phosphatidylethanolamine (PE) which is mediated by Atg7
(an E1-like protein) and the Atg12-Atg5-Atg16 complex (a complex which has E3-like
activity). The conjugated form (called LC3-II) targets the autophagosomal membrane.
LC3-II has been shown to have a membrane tethering function and may play a role in
the elongation and closure of the autophagosome membrane. The changes of LC3-II
in the presence and absence of lysosomal inhibitors such as chloroquine (CQ) or
bafilomycin A1 (BAF) have been widely used as an autophagic flux assay
(Rubinsztein et al., 2009; Mizushima et al., 2010; Ni et al., 2011).
Regulation of autophagosome formation is rather complicated in that it also
involves numerous intracellular mediators such as the Beclin 1/Vps34 PI3 kinase
complex (He and Levine, 2010). Notably, Bcl2/xL suppresses autophagy by directly
interacting with Beclin 1, whereas other BH3-domain only Bcl-2 family proteins such
as Bad promotes autophagy by disrupting the Bcl2/xL interaction and releasing
Beclin 1 (He and Levine, 2010). Interestingly, recent data suggest that there is
This article has not been copyedited and formatted. The final version may differ from this version.JPET Fast Forward. Published on August 19, 2011 as DOI: 10.1124/jpet.111.184341
at ASPE
T Journals on M
ay 9, 2018jpet.aspetjournals.org
Dow
nloaded from

JPET # 184341
6
crosstalk between apoptosis and autophagy (Fimia and Piacentini, 2010). During
apoptosis, Beclin 1 is cleaved by activated caspases resulting in the inhibition of
autophagy (Djavaheri-Mergny et al., 2010; Luo and Rubinsztein, 2010).
In addition to acting as a cell survival mechanism against cell death, emerging
evidence suggests that autophagy also regulates lipid homeostasis. Studies from the
autophagy gene (Atg7) adipose tissue-specific knockout mice reveal that autophagy
may regulate adipose mass and differentiation in mice (Singh et al., 2009b; Zhang et
al., 2009). These knockout mice are generally lean with decreased white adipose
mass, an increased number of mitochondria and enhanced insulin sensitivity (Singh
et al., 2009b; Zhang et al., 2009). In contrast, liver-specific Atg7 knockout mice have
an increased number of lipid droplets in hepatocytes (Singh et al., 2009a). Further
experimental evidence suggests that autophagy may help to remove the excess lipid
droplets in hepatocytes, a process termed as lipophagy (Singh et al., 2009a). We
also recently reported that induction of autophagy by rapamycin significantly
attenuates alcohol-induced steatosis in mice (Ding et al., 2010a). While it seems that
autophagy may attenuate steatosis, it remains largely unknown how fatty acids
modulate autophagy. It is also not known whether saturated or unsaturated fatty
acids play different roles in autophagy. While some recent studies report that fatty
acids may induce autophagy in INS-1 β-cells, no autophagic flux assays have been
conducted in these studies and thus it is unclear whether there would be an increase
of autophagic activity in these scenarios (Choi et al., 2009; Komiya et al., 2010).
In the present study, we determined the effects of saturated and unsaturated fatty
This article has not been copyedited and formatted. The final version may differ from this version.JPET Fast Forward. Published on August 19, 2011 as DOI: 10.1124/jpet.111.184341
at ASPE
T Journals on M
ay 9, 2018jpet.aspetjournals.org
Dow
nloaded from

JPET # 184341
7
acids on autophagy and apoptosis in hepatocytes.
Methods
Reagents. Antibodies used in this study were cleaved caspase-3, phosphorylated-
p70S6K (T389), total p70S6K, phosphorylated translational initiation factor 4E
binding protein-1 (4EBP-1(S65)), total-4EBP-1 and perilipin (Cell Signaling), β-actin
(Sigma-Aldrich), and horseradish peroxidase–labeled secondary antibodies (Jackson
ImmunoResearch Lab). The rabbit polyclonal anti-LC3B antibody was made using a
peptide representing the NH2-terminal 14 amino acids of human LC3B and an
additional cysteine (PSEKTFKQRRTFEQC) as described previously (Ding et al.,
2009). The following chemicals: delipidated bovine serum albumin (BSA), oleic acid
(OA, unsaturated fatty acid), palmitic acid (PA, saturated fatty acid), 3-methyladenine
(3-MA), chloroquine (CQ), rapamycin, N-acetylcysteine (NAC), tumor necrosis factor-
α (TNF-α), and ZVAD-fmk were all from Sigma-Aldrich. The fluorescence probes
tetramethylrhodamine methyl ester (TMRM), Bodipy 493/503, propidium iodide (PI),
and Hoechst 33342 were all from Invitrogen.
Cell culture and treatment. HepG2 cells, a human hepatoma cell line that was
obtained from American Type of Cell Culture, were cultured in Dulbecco’s modified
Eagle medium (DMEM) with 10% fetal calf serum and other standard supplements.
All cultures were maintained in a 37°C incubator with 5% CO2. All cell culture
materials were obtained from Invitrogen. OA/BSA and PA/BSA conjugates were
prepared as described previously (Choi et al., 2009). Briefly, a 20 mM solution of OA
or PA in 0.01 N NaOH was incubated at 70 ºC for 30 min, and fatty acid soaps were
This article has not been copyedited and formatted. The final version may differ from this version.JPET Fast Forward. Published on August 19, 2011 as DOI: 10.1124/jpet.111.184341
at ASPE
T Journals on M
ay 9, 2018jpet.aspetjournals.org
Dow
nloaded from
JPET # 184341
8
then complexed with 5% BSA in PBS at a 7:1 molar ratio of fatty acid to BSA. The
OA/BSA or PA/BSA conjugates were administered to the cultured cells. BSA was
used as a vehicle control.
Mice and experimental diets. Male C57BL/6J mice (Jackson Laboratory, Bar
Harbor, ME) were fed either a control diet (Harlan Teklad #8604, Dyets Inc.,
Bethlehem, PA) or a Western diet (Diet # 100244, Dyets Inc.), which provides
approximately 40% of calories from milk fat, for 3 months. All studies were approved
by the University of Kansas Medical Center Animal Care and Use Committee and
comply with National Institutes of Health guidelines. Mice were fasted overnight prior
to sample collection. Total liver lysates were prepared using
radioimmunoprecipitation assay (RIPA) buffer (1% NP40, 0.5% sodium deoxycholate,
0.1% sodium dodecyl (lauryl) sulfate) with fresh protease inhibitors. Preparation of
liver sections for histology and hematoxylin and eosin (HE) staining were performed
as described previously (Luyendyk et al., 2010) .
GFP-LC3 adenovirus infection. Adenovirus expressing GFP-LC3B (human; Ad-
GFP-LC3) was used as previously described (Ding et al., 2009). HepG2 cells
(1×10⁵/well in a 12-well plate with microscopic cover glasses, Thermo Fisher
Scientific) were infected with adenoviral GFP-LC3 (100 viral particle per cell) in
DMEM overnight followed by treatment with BSA or BSA conjugated fatty acids.
Fluorescence Microscopy. For fluorescence microscopy, cells were cultured in 12-
well plates with microscope cover glasses. After designated treatments, cells were
fixed with 4% paraformaldehyde (PFA) in PBS. All the cellular images were obtained
This article has not been copyedited and formatted. The final version may differ from this version.JPET Fast Forward. Published on August 19, 2011 as DOI: 10.1124/jpet.111.184341
at ASPE
T Journals on M
ay 9, 2018jpet.aspetjournals.org
Dow
nloaded from

JPET # 184341
9
using an inverted Nikon Eclipse 200 fluorescence microscope. For quantification of
autophagic cells, GFP-LC3 punctated dots were determined from triplicates by
counting a total of more than 60 cells. For the intracellular lipid droplets, cells were
stained with Bodipy 493/503 (0.1 μmol/L) for 15 minutes at room temperature before
the analysis. Apoptotic cell death was determined by nuclear staining with Hoechst
33342 (5 μg/mL) for fragmented and condensed nuclei. For mitochondria membrane
potential, live cells were stained with TMRM (50 nM) for 15 min followed by
fluorescence microscopy.
Electron Microscopy. Liver tissue or HepG2 cells were fixed with 2%
glutaraldehyde in 0.1 mol/L phosphate buffer (pH 7.4), followed by 1% OsO4. After
dehydration, thin sections were cut and stained with uranyl acetate and lead citrate.
Digital images were obtained using a JEM 1016CX electron microscope. Random
images were chosen and the number of typical autophagosome and autolysosomes
from each cell section were counted from more than 30 cells.
Immunoblot Analysis. Cells were washed in PBS and cell pellets were lysed in
RIPA buffer. Thirty micrograms of protein were separated by SDS-PAGE and
transferred to polyvinylidene difluoride membranes. The membranes were incubated
with the indicated primary and secondary antibodies and developed with SuperSignal
West Pico chemiluminescent substrate (Pierce). Densitometry analysis was
performed using Image J software (National Institutes of Health). The relative levels of
LC3-II in each group were normalized to their loading control.
This article has not been copyedited and formatted. The final version may differ from this version.JPET Fast Forward. Published on August 19, 2011 as DOI: 10.1124/jpet.111.184341
at ASPE
T Journals on M
ay 9, 2018jpet.aspetjournals.org
Dow
nloaded from

JPET # 184341
10
Caspase-3 activity assay. This was determined as we described previously (Ding et
al., 2004). Briefly, Caspase-3 activities were measured using 30 µg of proteins and
20 µM of fluorescent substrates (Ac-DEVD-AFC, Biomol). The fluorescence signals
were detected by a fluorometer (Tecan GENios) at excitation and emission
wavelengths of 400 nm and 510 nm, respectively.
Triglyceride (TG) Analysis. The level of TG was determined as described
previously (Wobser et al., 2009). After treatment, cells were briefly washed with PBS
and scraped off with a cell scraper. After centrifugation, the cell pellets were re-
suspended in 200 µl ice-cold lysis buffer (18 mM Tris-HCl, 300 mM Mannitol, 50 mM
EGTA, pH 7.6, with protease inhibitors) followed by sonication with a micro-tip. Ten
microliters of cell extracts were taken out for the protein assay. The rest of the cell
extracts were further mixed with 3 mL chloroform-methanol mix (2:1) and incubated
for 1 hr at room temperature with occasional shaking to extract the lipid. Afterwards,
0.4 mL KCl (0.15 M) was added and mixed by vortex. These mixtures were
centrifuged for 5 min at 3,000 g, the lower lipid phase was collected and dried by a
vaccum at room temperature. The lipids were further dissolved in 20 µL Isopropanol
with 10% Triton X100. Lipid analysis was carried out following the manufacturer’s
instruction with a colorimetric assay kit (Sigma). Protein amount was determined with
a protein assay kit (Thermo Scientific).
Statistical Analysis. Results are given as mean ± standard error of the mean. One-
way anova analysis of variance and Scheffe's post-hoc test was used for multiple
comparisons and Student’s t test was used for comparison of two matched groups
This article has not been copyedited and formatted. The final version may differ from this version.JPET Fast Forward. Published on August 19, 2011 as DOI: 10.1124/jpet.111.184341
at ASPE
T Journals on M
ay 9, 2018jpet.aspetjournals.org
Dow
nloaded from

JPET # 184341
11
using SPSS 13.0. Statistical significance was a P value less than 0.05.
Results
Oleic acid induces autophagy in HepG2 cells
Because it has been reported that the biological functions of saturated and unsaturated
fatty acids are different (Listenberger et al., 2003), we first determined the effect of oleic
acid, an unsaturated fatty acid which is most abundant in the diet, serum and liver tissue
(Baylin et al., 2002; Xu et al., 2011), on autophagy in HepG2 cells (a human hepatoma
cell line) expressing GFP-LC3 by infecting them with adenovirus GFP-LC3. GFP-LC3
behaves in a similar manner to endogenous LC3, and has been widely used to monitor
autophagy (Hosokawa et al., 2006). GFP-LC3 is located in the cytosol and displays a
diffuse pattern. Upon autophagy induction, GFP-LC3 translocates to the pre-
autophagosome and autophagosome membranes, displaying a punctated pattern
following its conjugation with PE (Suzuki and Ohsumi; Hosokawa et al., 2006). The
number of GFP-LC3 puncta can be quantified and represent the number of
autophagosomes and autolysosomes. To assess whether OA, a monounsaturated
fatty acid, would affect autophagy, we first examined the changes of the GFP-LC3
pattern in OA-treated HepG2 cells. HepG2 cells were infected with an adenovirus
GFP-LC3 and treated with OA in the presence or absence of chloroquine (CQ),
which inhibits lysosomal degradation by increasing lysosomal pH (Ni et al., 2011).
Compared to the vehicle-treated cells, the number of GFP-LC3 puncta increased in
This article has not been copyedited and formatted. The final version may differ from this version.JPET Fast Forward. Published on August 19, 2011 as DOI: 10.1124/jpet.111.184341
at ASPE
T Journals on M
ay 9, 2018jpet.aspetjournals.org
Dow
nloaded from

JPET # 184341
12
OA-treated cells in a concentration-dependent manner and further increased in the
presence of CQ (Figure 1 A-C), suggesting that OA induces autophagy in HepG2
cells. In addition to the changes of GFP-LC3 puncta, we also determined the
autophagic flux by examining the changes of endogenous LC3-II in the presence of
lysosomal inhibitors. We found that the LC3-II levels were not affected by OA
treatment. Treatment with either CQ or BAF(Figure 1 D), which inhibit lysosomal
functions by either increasing lysosoaml pH or suppressing vacuolar type H+-ATPase
(V-ATPase) (Klionsky et al., 2008), increased levels of LC3-II. Although OA-
cotreatment tended to increase LC3-II levels in the presence of CQ, this difference
did not achieve statistical significance. All together, these data indicate that OA
induces autophagy in HepG2 cells.
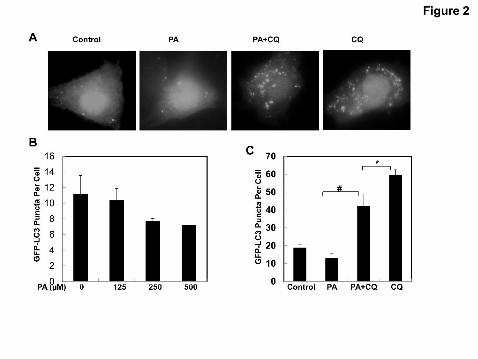
Palmitic acid does not activate autophagy in HepG2 cells
We next determined the effects of palmitic acid (PA), a saturated fatty acid which is
the most abundant in the diet, serum and liver tissue (Baylin et al., 2002; Xu et al.,
2011), on autophagy induction in HepG2 cells. In contrast to OA, we found that PA
did not increase autophagy in HepG2 cells as examined by a series of autophagic
flux assays including GFP-LC3 puncta (Fig 2 A-C) and the changes of endogenous
LC3-II in the presence or absence of CQ or BAF (Figure 2 D). PA treatment alone
slightly decreased the number of GFP-LC3 puncta at various concentrations although
this did not achieve a statistic difference. However, the number of GFP-LC3 puncta
after PA treatment in the presence of CQ was significantly lower than that of CQ
This article has not been copyedited and formatted. The final version may differ from this version.JPET Fast Forward. Published on August 19, 2011 as DOI: 10.1124/jpet.111.184341
at ASPE
T Journals on M
ay 9, 2018jpet.aspetjournals.org
Dow
nloaded from

JPET # 184341
13
treatment alone (Fig 2 A-C). Similarly, PA alone did not alter the level of endogenous
LC3-II. Moreover, PA cotreatment did not significantly impact the levels of LC3-II in
cells cotreated with CQ or BAF (Figure 2 D). Similar results were found in OA or PA
treated primary cultured mouse hepatocytes (Supplemental Figure 1). These results
suggest that unlike OA, PA does not activate autophagy in either HepG2 hepatoma
cells or normal hepatocytes.
Although OA (18:1) and PA (16:0) represent extreme unsaturated and saturated fatty
acids, there is a possibility that their differential effects on autophagy could also be
due to the different carbon length in addition to their saturating status. We thus
determined the effect of another unsaturated fatty acid, palmitoleate (PO,16:1) which
has the same carbon length as PA, on autophagy. We found that PO induces
autophagy in HepG2 cells based on the autophagic flux assay either assessing for
the GFP-LC3 puncta formation or the levels of LC3-II changes (Supplemental
Figure 2). These results suggest that the saturate status rather than the carbon
length contribute to the differential effects of saturated and unsaturated fatty acids on
autophagy.
Oleic acid but not palmitic acid increases the number of autophagosomes and
neutral lipid storage
To further confirm the differential roles of OA and PA on autophagy, we performed
EM studies on OA- and PA-treated HepG2 cells. OA treatment significantly increased
the number of double membrane autophagosomes (AV), and most of them had
This article has not been copyedited and formatted. The final version may differ from this version.JPET Fast Forward. Published on August 19, 2011 as DOI: 10.1124/jpet.111.184341
at ASPE
T Journals on M
ay 9, 2018jpet.aspetjournals.org
Dow
nloaded from
JPET # 184341
14
enveloped cytosolic contents (Figure 3A, panel e, arrows) and lipid droplets (LD)
(Figure 3A, panels c and d arrow). In addition to increasing the number of AV, OA
treatment also increased the number of LD which are featured as phospholipid
monolayer membrane structures with electron lucent content (Figure 3A, panels c, d
& f). In contrast, AV and LD are barely detectable in BSA treated control (Figure 3A,
panel a) or PA-treated cells (Figure 3A, panel b; Figure 3B & C). Fluorescence
microscopy studies using the fluorescent dye Bodipy493/503 for neutral lipids further
confirmed that OA increased the number of LD significantly more than PA although
PA also slightly increased LD numbers in HepG2 cells (Figure 3 D & E). Similar
results were found in primary mouse hepatocytes (Supplemental Figure 3). These
data indicate that OA but not PA, increases the number of autophagosomes in
HepG2 cells. Moreover, OA also increases more LD than PA in HepG2 cells and
normal hepatocytes.
ROS, but not mTOR, contributes to OA-induced autophagy in HepG2 cells
Because increased oxidative stress is often observed in human and experimental
models of steatohepatitis (Chalasani et al., 2004; Seki et al., 2005), we next
determined the levels of ROS production in OA or PA treated cells in the presence or
absence of the antioxidant N-acetylcysteine (NAC). NAC has been widely used as an
antioxidant and has been shown to block autophagy in many experimental models
(Scherz-Shouval et al., 2007; Ding et al., 2010b). We found that PA significantly
increased the level of ROS production in HepG2 cells compared to the control cells.
This article has not been copyedited and formatted. The final version may differ from this version.JPET Fast Forward. Published on August 19, 2011 as DOI: 10.1124/jpet.111.184341
at ASPE
T Journals on M
ay 9, 2018jpet.aspetjournals.org
Dow
nloaded from

JPET # 184341
15
OA also increased the level of ROS production but did not to a degree of statistical
significance. However, NAC significantly decreased the levels of ROS in both PA and
OA-treated cells (Supplemental Figure 4). We then determined the effects of NAC
on OA-induced GFP-LC3 puncta. We found that OA-induced GFP-LC3 puncta
formation was significantly suppressed by NAC (Figure 4A & B). Because Beclin-
1/class-III PI3 kinase complex is important in regulating autophagosome formation
(He and Levine, 2010), we next determined the effects of 3-methyladenine (3MA), a
class-III PI3 kinase inhibitor, on OA-induced GFP-LC3 puncta formation. We found
that OA-induced GFP-LC3 puncta were also suppressed by 3MA (Figure 4A & C).
Taken together, these data suggest that OA-induced autophagy requires increased
oxidative stress and the Beclin-1/Vps34 PI3 kinase complex.
We next determined whether mTOR, one of the key molecular signaling
pathways regulating autophagy, would also be involved in fatty acid-induced
autophagy. We found that neither PA nor OA treatment suppressed mTOR activity as
determined by the level of phosphorylated translational initiation factor 4E binding
protein-1 (4EBP1) and 70-kDa ribosomal protein S6 kinase-1 (p70S6) kinase at
different time points (Figure 4D) and various concentrations (Figure 4E). It seemed
that OA treatment even increased the phosphorylated level of p70S6 kinase after 12
and 24 hours treatment although slightly decreased the phosphorylated 4EBP1 levels
(Figure 4D). The reasons for the different changes for p70S6 kinase and 4EBP1 are
not clear although they both are mTOR downstream substrates. In contrast, a high
dose of PA (500 µM) reduced both the total and phosphorylated 4EBP1 which is
This article has not been copyedited and formatted. The final version may differ from this version.JPET Fast Forward. Published on August 19, 2011 as DOI: 10.1124/jpet.111.184341
at ASPE
T Journals on M
ay 9, 2018jpet.aspetjournals.org
Dow
nloaded from
JPET # 184341
16
likely mediated by its cytotoxicity (see below). Taken together, these data suggest
that OA-induced autophagy is mediated by ROS but not by mTOR suppression in
HepG2 cells.
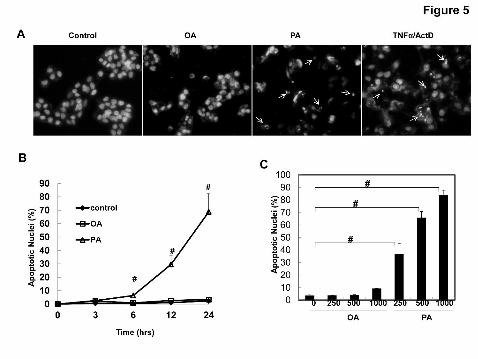
PA, but not OA, induces apoptosis in HepG2 cells
Since we found that OA and PA differentially regulated autophagy, we next
determined whether OA and PA would also differentially regulate apoptosis in HepG2
cells. We found that PA significantly increased the number of apoptotic cells in a
time- and dose-dependent manner whereas cells treated with OA were barely
affected (Figure 5A & B). The apoptotic nuclear changes in PA-treated cells were
evident by the typical fragmented and condensed nuclear morphology (Figure 5A
arrows), similar to apoptosis induced by tumor necrosis factor-α (TNF-α) plus
actinomycin D (ActD), a widely used model to trigger death-receptor activation-
induced apoptosis (Ding et al., 2004; Ding and Yin, 2004). Meanwhile, PA but not OA
treatment also increased the number of cells with depolarized mitochondria (Figure 5
D& E), suggesting that PA-induced apoptosis is mediated by the mitochondrial
apoptotic pathway.
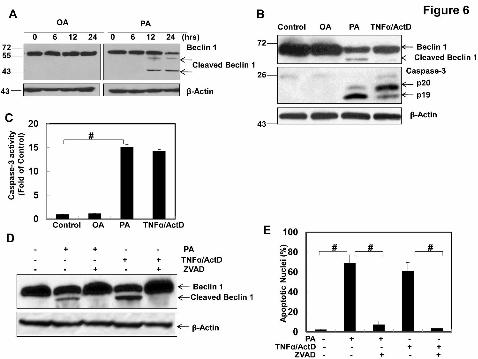
Caspase-mediated Beclin 1 cleavage is associated with the suppression of
autophagy in PA-treated cells
Increasing evidence suggests that apoptosis may suppress autophagy by caspase-
mediated cleavage of essential autophagy proteins (Luo and Rubinsztein, 2010; Li et
This article has not been copyedited and formatted. The final version may differ from this version.JPET Fast Forward. Published on August 19, 2011 as DOI: 10.1124/jpet.111.184341
at ASPE
T Journals on M
ay 9, 2018jpet.aspetjournals.org
Dow
nloaded from

JPET # 184341
17
al., 2011a). Because we observed that OA and PA differentially regulate autophagy
and apoptosis, we next determined whether PA-induced caspase activation would
cleave Beclin 1, an essential autophagy protein serving as a key component in the
Beclin 1/Vps34 PI3 kinase complex, and in turn suppress autophagy in PA-treated
cells. Indeed, we found that PA but not OA induced Beclin 1 cleavage in a time-
dependent manner (Figure 6A). We consistently observed a 50 kDa cleaved Beclin 1
in PA or TNF-α/ActD-treated cells as previously reported (Li et al., 2011a).
Occasionally an additional cleaved Beclin 1 band around 45 kDa was also detected
(Figure 6A). However, this cleaved band could be less stable because it was not
always detectable in our experiments. We further found that PA as well as TNF-
α/ActD but not OA also induced caspase-3 cleavage (Figure 6B) and increased
caspase-3 activity (Figure 6C). More importantly, PA and TNF-α/ActD-induced
Beclin 1 cleavage and apoptosis were inhibited by a general caspase inhibitor,
ZVAD-fmk, further supporting the notion that PA-induced Beclin 1 cleavage and
apoptosis are caspase-dependent (Figure 6D & E). Furthermore, in the presence of
ZVAD-fmk, the PA-induced number of GFP-LC3 puncta was significantly increased
(Supplemental Figure 5). These findings suggest that the cleavage of Beclin 1 by
PA-induced caspase activation may suppress autophagy in PA-treated HepG2 cells
as we observed in Figure 2.
Autophagy attenuates fatty acid-induced apoptosis and accumulation of lipids
We next determined whether autophagy would play a protective role against fatty
This article has not been copyedited and formatted. The final version may differ from this version.JPET Fast Forward. Published on August 19, 2011 as DOI: 10.1124/jpet.111.184341
at ASPE
T Journals on M
ay 9, 2018jpet.aspetjournals.org
Dow
nloaded from

JPET # 184341
18
acid-induced apoptosis. We found that suppression of autophagy by using two
pharmacological autophagy inhibitors, 3MA which suppresses the upstream PI3K
(Beclin 1/Vps34 complex) and CQ which inhibits the downstream lysosomal function
by increasing lysosomal pH, significantly increased OA-induced apoptosis (Figure
7A). Interestingly, we further found that OA attenuated PA-induced apoptosis
(Supplemental Figure 6). This can be partially explained by OA-induced autophagy
in HepG2 cells. Autophagy has been shown to remove excessive lipid droplets in
hepatocytes and in alcohol-treated mouse liver (a term called lipophagy) (Singh et
al., 2009a; Ding et al., 2010a). Therefore, we next determined whether autophagy
would also influence OA and PA-induced accumulation of lipids in HepG2 cells.
Perilipin is a lipid droplet-associated protein that is localized at the surface of the lipid
droplet and whose protein levels may correlate with the number of lipid droplets
(Ducharme and Bickel, 2008). We next determined the protein level of perilipin
following OA and PA treatment in HepG2 cells. We found that both OA and PA
increased the protein levels of perilipin in a dose-dependent manner (Figure 7B).
These results are generally in agreement with our earlier findings in Figure 5 and
previous reports (Listenberger et al., 2003; Ricchi et al., 2009). Interestingly, we
found that suppression of autophagy by CQ further increased both OA and PA-
induced expression of perilipin, supporting the current notion that autophagy may
help to remove lipid droplets (Figure 7C). In line with the findings for the perilipin
changes, OA also significantly increased total cellular triglyceride (TG) level
compared to that of control cells or PA-treated cells. Suppression of autophagy by
This article has not been copyedited and formatted. The final version may differ from this version.JPET Fast Forward. Published on August 19, 2011 as DOI: 10.1124/jpet.111.184341
at ASPE
T Journals on M
ay 9, 2018jpet.aspetjournals.org
Dow
nloaded from

JPET # 184341
19
CQ significantly increased TG levels in OA-treated cells (Figure 7D). Furthermore,
suppression of autophagy by 3MA also increased OA-induced accumulation of LD
(Supplemental Figure 7A). In contrast, induction of autophagy by rapamycin tended
to reduce TG levels in OA-treated cells (Supplemental Figure 7B). Interestingly, CQ
alone also increased TG levels in HepG2 cells, suggesting that even inhibition of
basal level autophagy could also increase the level of TG (Figure 7D). The level of
TG was higher in the PA and CQ treatment group than that of PA alone but was
almost identical to the CQ treatment alone. The lack of additional increase of TG by
CQ in CQ and PA treated cells is likely due to the already low autophagy activity
induced by PA treatment in these cells (Figure 7D). Taken together, these findings
suggest that autophagy can attenuate fatty acid-induced apoptosis and the
accumulation of lipids.
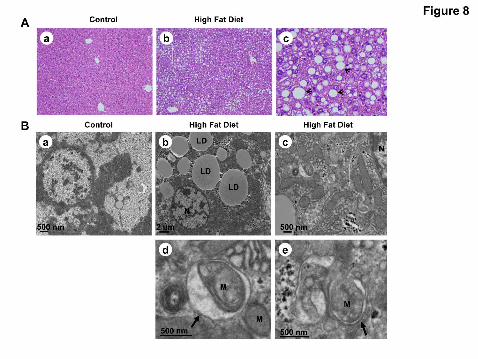
Induction of steatosis and autophagy in high fat diet mouse liver
To determine the effects of high fat diet on steatosis and autophagy in the mouse
liver, C57BL/6 mice were fed a high fat diet or a control diet for 12 weeks. Macro- and
micro-vesicular steatosis was evident in livers of mice fed with the high fat diet
(Figure 8A). EM studies further confirmed that both the number and size of the
hepatic lipid droplets were markedly increased in livers of mice fed high fat diet
(Figure 8B, panel b). Moreover, we also often found double membrane
autophagosomes that enwrapped damaged mitochondria in livers from mice fed high
fat diet (Figure 8B, panels c-e). Results from western blot analysis indicate that
This article has not been copyedited and formatted. The final version may differ from this version.JPET Fast Forward. Published on August 19, 2011 as DOI: 10.1124/jpet.111.184341
at ASPE
T Journals on M
ay 9, 2018jpet.aspetjournals.org
Dow
nloaded from

JPET # 184341
20
there was an increased level of LC3-II in livers from mice fed high fat diet (Figure 8C
& D), suggesting a possible increased number of autophagosomes or autolysosomes
in high fat diet fed mouse livers. Taken together, these data suggest that high fat diet
increases steatosis and may induce autophagy in mouse liver.
Discussion
Hepatic lipotoxicity is closely associated with the progression of fatty liver
disease. However, the mechanisms by which excess fatty acids induce hepatotoxicity
are not completely understood. Furthermore, the mechanisms by which hepatocytes
tolerate lipotoxicity remain largely unknown. In the present study, we found that
saturated and unsaturated fatty acids differentially regulate autophagy and apoptosis
in HepG2 cells. Monounsaturated OA was readily converted to TG enriched lipid
droplets, induced autophagy and was resistant to apoptosis in HepG2 cells. In
contrast, saturated PA was only slightly converted to TG enriched lipid droplets
resulting in the induction of apoptosis without the activation of autophagy. We
demonstrated that there is crosstalk between fatty acid-induced apoptosis and
autophagy, in which saturated PA-induced apoptosis suppresses autophagy by
caspase-mediated cleavage of Beclin 1. Conversely, autophagy also attenuated fatty
acid-induced apoptosis and accumulation of lipids. We further found that a high fat
diet induced marked steatosis and autophagy in the mouse liver. Overall, the results
reveal a novel mechanism underlying the the differential role of saturated versus
unsaturated fatty acids in hepatotoxicity and could suggest new therapeutic
approaches for treating fatty liver diseases by modulating autophagy.
This article has not been copyedited and formatted. The final version may differ from this version.JPET Fast Forward. Published on August 19, 2011 as DOI: 10.1124/jpet.111.184341
at ASPE
T Journals on M
ay 9, 2018jpet.aspetjournals.org
Dow
nloaded from

JPET # 184341
21
Induction of apoptosis by excessive free fatty acids is a key histological feature
of NAFLD and correlates with progressive inflammation and fibrosis. The
accumulation of TG-enriched lipid droplets was once thought to be the underlying
cause of liver injury and insulin resistance in tissues, but it has recently been
suggested that the accumulation of lipid droplets is a parallel phenomenon and may
even play a protective role against the lipotoxicity from free fatty acids and other fatty
acid-derived mediators (Malhi and Gores, 2008; Garbarino and Sturley, 2009;
Neuschwander-Tetri, 2010). In CHO cells, OA is readily converted into TG and stored
in lipid droplets resulting in less apoptosis, whereas PA is poorly incorporated into
triglyceride and increases apoptosis (Listenberger et al., 2003). In the present study,
we also found that the number of lipid droplets and the levels of TG are significantly
higher in OA-treated HepG2 cells than in PA-treated cells. As a result, OA fails to
induce apoptosis and even protects against PA-induced apoptosis in HepG2 cells
(Figure 5C and Supplemental Figure 6). It has been reported that overexpression
of stearoyl-CoA desaturase 1 (SCD1) that increases the level of unsaturated fatty
acids and TG formation decreases PA-induced lipotoxicity (Listenberger et al., 2003).
Conversely, impairing the formation of TG by knockout of acyl CoA:diacylglycerol
transferase 1 (DGAT1) increases the lipotoxicity of OA (Listenberger et al., 2003).
Collectively, our results together with other groups’ findings suggest that the
formation of TG may not be the cause of fatty acid-induced lipotoxicity.
It is interesting that monounsaturated fatty acid OA but not the saturated fatty acid
PA induces autophagy in HepG2 cells. This could be one additional important
This article has not been copyedited and formatted. The final version may differ from this version.JPET Fast Forward. Published on August 19, 2011 as DOI: 10.1124/jpet.111.184341
at ASPE
T Journals on M
ay 9, 2018jpet.aspetjournals.org
Dow
nloaded from

JPET # 184341
22
mechanistic basis for why OA is less toxic than PA in HepG2 cells. Autophagy is
recognized as a critical cell survival mechanism induced by nutrient or growth factor
deprivation, hypoxia, ROS, DNA damage, protein aggregates, damaged organelles,
or intracellular pathogens (Kroemer et al., 2010; Ravikumar et al., 2010). Although
the mechanisms by which autophagy protects against cell death are not fully
understood, it is generally thought that it involves multiple mechanisms including bulk
protein degradation, recycling of misfolded and aggregate-prone proteins, relieving
endoplasmic reticulum stress, and removing depolarized or permeabilized
mitochondria (Ding et al., 2007a; Ding et al., 2007b; Kim and Lemasters, 2010;
Kroemer et al., 2010). Fatty acids have been shown to induce apoptosis through
activation of the pro-apoptotic protein Bax and subsequent mitochondrial damage
(Malhi et al., 2006). In the present study, we found that saturated fatty acids
increased the number of cells with depolarized mitochondria (Figure 5D & E).
Moreover, suppression of autophagy enhanced fatty acid-induced apoptosis. It is
possible that the impaired autophagy in PA-treated cells may exacerbate
mitochondrial damage and further increase apoptosis. Although our present study
and other previous reports found that saturate fatty acids (such as PA) are more toxic
than unsaturated fatty acids (such as OA), it has also been reported that a diet
enriched in saturated but not unsaturated fatty acids reversed alcohol-induced liver
injury in a rat model (Nanji et al., 1995). This paradox could be due to the cytochrome
P450 2E1 (CYP2E1) activity being suppressed by saturated but not by unsaturated
fatty acids, and CYP2E1 is key enzyme which promotes alcohol-induced liver injury
This article has not been copyedited and formatted. The final version may differ from this version.JPET Fast Forward. Published on August 19, 2011 as DOI: 10.1124/jpet.111.184341
at ASPE
T Journals on M
ay 9, 2018jpet.aspetjournals.org
Dow
nloaded from

JPET # 184341
23
(Nanji et al., 1995).
Why would saturated and unsaturated fatty acids have different effects in
autophagy induction? In mammalian cells, the mTOR pathway is the most studied
pathway regulating autophagy. Many diverse signals such as growth factors and
amino acids activate mTOR to suppress autophagy. In contrast, rapamycin
suppresses mTOR and induces autophagy in various cell lines. Inhibition of mTOR
leads to the reduced phosphorylation of two of its downstream effectors, p70S6K and
4EBP1. How the suppression of mTOR leads to autophagy induction is not
completely known, but data suggest that suppression of mTOR is probably coupled
to the activation of the ULK1/ULK2 (mammalian orthologs of yeast Atg1) complex,
which may recruit other autophagy proteins to the isolation membrane, the origin of
the autophagosome membrane (Mizushima, 2010). In this study, we found that OA
has little effect on mTOR suppression, suggesting that OA-induced autophagy could
be mTOR-independent. Several stimuli have been shown to induce autophagy
independent of mTOR such as lithium, carbamazepine, and valproic acid, all of which
reduce intracellular inositol levels (Ravikumar et al., 2010). Although the effect of OA
on the intracellular inositol levels is not known, we found that OA-induced autophagy
requires ROS formation and the classical PI3 kinase complex because an antioxidant
(NAC) and a PI3 kinase inhibitor (3MA) suppress OA-induced autophagy. Unlike OA,
PA increased apoptosis and caspase-3 activation in HepG2 cells whereas there is no
or even decreased autophagy induction. Cleavage of Beclin 1 during apoptosis has
been shown to block Beclin-1 dependent autophagy (Luo and Rubinsztein, 2010).
This article has not been copyedited and formatted. The final version may differ from this version.JPET Fast Forward. Published on August 19, 2011 as DOI: 10.1124/jpet.111.184341
at ASPE
T Journals on M
ay 9, 2018jpet.aspetjournals.org
Dow
nloaded from

JPET # 184341
24
Indeed we found that PA induced caspase-mediated cleavage of Beclin 1. Thus our
results support the emerging notion that there is crosstalk between apoptosis and
autophagy, in which autophagy and apoptosis counteract each other. Therefore, the
different capacity on apoptosis induction by PA and OA may determine their different
effects on autophagy induction.
In addition to protecting against cell death, autophagy has recently been show to
regulate lipid homeostasis by removing excess lipid droplets (Singh et al., 2009a).
Liver-specific knockout of Atg7, an essential autophagy gene regulating conjugation
of LC3 with PE, leads to steatosis in the mouse liver (Singh et al., 2009a). Our
previous studies also demonstrated that activation of autophagy reduced alcohol-
induced steatosis in an acute mouse model (Ding et al., 2010a; Ding et al., 2011). In
the present study, we found that autophagy also regulates fatty acid-induced lipid
accumulation. Suppression of autophagy by CQ increases the accumulation of lipids
in hepatocytes whereas induction of autophagy by rapamycin tends to decrease TG
contents in OA-treated hepatocytes. These findings suggest that modulation of
autophagy may provide a novel therapeutic approach for not only alcoholic liver
disease but also general obesity-induced steatosis.
In conclusion, we found that unsaturated and saturated fatty acid differentially
regulate apoptosis and autophagy in hepatocytes. Unsaturated OA promotes the
formation of TG enriched lipid droplets, induces autophagy and has little effect on
lipoapoptosis. Saturated PA is poorly converted into TG-enriched lipid droplets,
induces lipoapoptosis and decreases autophagy. Induction of autophagy protects
This article has not been copyedited and formatted. The final version may differ from this version.JPET Fast Forward. Published on August 19, 2011 as DOI: 10.1124/jpet.111.184341
at ASPE
T Journals on M
ay 9, 2018jpet.aspetjournals.org
Dow
nloaded from

JPET # 184341
25
against fatty acid-induced lipotoxicity. Our data also support the emerging concept
that autophagy and apoptosis are two antagonistic events that tend to inhibit each
other. The modulation of autophagy represents a novel approach that may have
therapeutic benefits for obesity-induced steatosis and liver injury.
Acknowledgements
We thank Ms Barbara Fegley (KUMC Electron Microscopy Research Laboratory) for
her excellent assistance with the EM studies. We thank Drs. Hao Zhu and Ming Xu
for their technical support for the triglyceride measurement.
Authorship Contributions:
Participated in research design: Ding and Luyendyk.
Conducted experiments: Mei, Ni, Manley, Bockus, Kassel, Copple, and Ding.
Contributed new reagents or analytic tools: Luyendyk.
Performed data analysis: Mei, Ni, and Ding.
Wrote or contributed to the writing of the manuscript: Mei, Kassel, Luyendyk, and Ding.
This article has not been copyedited and formatted. The final version may differ from this version.JPET Fast Forward. Published on August 19, 2011 as DOI: 10.1124/jpet.111.184341
at ASPE
T Journals on M
ay 9, 2018jpet.aspetjournals.org
Dow
nloaded from

JPET # 184341
26
References:
Baylin A, Kabagambe EK, Siles X and Campos H (2002) Adipose tissue biomarkers of fatty acid intake. Am J Clin Nutr 76:750-757.
Chalasani N, Deeg MA and Crabb DW (2004) Systemic levels of lipid peroxidation and its metabolic and dietary correlates in patients with nonalcoholic steatohepatitis. Am J Gastroenterol 99:1497-1502.
Choi SE, Lee SM, Lee YJ, Li LJ, Lee SJ, Lee JH, Kim Y, Jun HS, Lee KW and Kang Y (2009) Protective role of autophagy in palmitate-induced INS-1 beta-cell death. Endocrinology 150:126-134.
Ding WX, Li M, Chen X, Ni HM, Lin CW, Gao W, Lu B, Stolz DB, Clemens DL and Yin XM (2010a) Autophagy reduces acute ethanol-induced hepatotoxicity and steatosis in mice. Gastroenterology 139:1740-1752.
Ding WX, Manley S and Ni HM (2011) The emerging role of autophagy in alcoholic liver disease. Exp Biol Med (Maywood) Epub ahead of print.
Ding WX, Ni HM, DiFrancesca D, Stolz DB and Yin XM (2004) Bid-dependent generation of oxygen radicals promotes death receptor activation-induced apoptosis in murine hepatocytes. Hepatology 40:403-413.
Ding WX, Ni HM, Gao W, Chen X, Kang JH, Stolz DB, Liu J and Yin XM (2009) Oncogenic transformation confers a selective susceptibility to the combined suppression of the proteasome and autophagy. Mol Cancer Ther 8:2036-2045.
Ding WX, Ni HM, Gao W, Hou YF, Melan MA, Chen X, Stolz DB, Shao ZM and Yin XM (2007a) Differential effects of endoplasmic reticulum stress-induced autophagy on cell survival. J Biol Chem 282:4702-4710.
Ding WX, Ni HM, Gao W, Yoshimori T, Stolz DB, Ron D and Yin XM (2007b) Linking of autophagy to ubiquitin-proteasome system is important for the regulation of endoplasmic reticulum stress and cell viability. Am J Pathol 171:513-524.
Ding WX, Ni HM, Li M, Liao Y, Chen X, Stolz DB, Dorn GW, 2nd and Yin XM (2010b) Nix is critical to two distinct phases of mitophagy, reactive oxygen species-mediated autophagy induction and Parkin-ubiquitin-p62-mediated mitochondrial priming. J Biol Chem 285:27879-27890.
Ding WX and Yin XM (2004) Dissection of the multiple mechanisms of TNF-alpha-induced apoptosis in liver injury. J Cell Mol Med 8:445-454.
Djavaheri-Mergny M, Maiuri MC and Kroemer G (2010) Cross talk between apoptosis and autophagy by caspase-mediated cleavage of Beclin 1. Oncogene 29:1717-1719.
Ducharme NA and Bickel PE (2008) Lipid droplets in lipogenesis and lipolysis. Endocrinology 149:942-949.
Fimia GM and Piacentini M (2010) Regulation of autophagy in mammals and its interplay with apoptosis. Cell Mol Life Sci 67:1581-1588.
Garbarino J and Sturley SL (2009) Saturated with fat: new perspectives on lipotoxicity. Curr Opin Clin Nutr Metab Care 12:110-116.
He C and Levine B (2010) The Beclin 1 interactome. Curr Opin Cell Biol 22:140-149.
This article has not been copyedited and formatted. The final version may differ from this version.JPET Fast Forward. Published on August 19, 2011 as DOI: 10.1124/jpet.111.184341
at ASPE
T Journals on M
ay 9, 2018jpet.aspetjournals.org
Dow
nloaded from
JPET # 184341
27
Hosokawa N, Hara Y and Mizushima N (2006) Generation of cell lines with tetracycline-regulated autophagy and a role for autophagy in controlling cell size. FEBS Lett 580:2623-2629.
Kim I and Lemasters JJ (2010) Mitophagy Selectively Degrades Individual Damaged Mitochondria After Photoirradiation. Antioxid Redox Signal Epub ahead of print.
Klionsky DJ, Cregg JM, Dunn WA, Jr., Emr SD, Sakai Y, Sandoval IV, Sibirny A, Subramani S, Thumm M, Veenhuis M and Ohsumi Y (2003) A unified nomenclature for yeast autophagy-related genes. Dev Cell 5:539-545.
Klionsky DJ, Elazar Z, Seglen PO and Rubinsztein DC (2008) Does bafilomycin A1 block the fusion of autophagosomes with lysosomes? Autophagy 4:849-950.
Komiya K, Uchida T, Ueno T, Koike M, Abe H, Hirose T, Kawamori R, Uchiyama Y, Kominami E, Fujitani Y and Watada H (2010) Free fatty acids stimulate autophagy in pancreatic beta-cells via JNK pathway. Biochem Biophys Res Commun 401:561-567.
Kroemer G, Marino G and Levine B (2010) Autophagy and the integrated stress response. Mol Cell 40:280-293.
Kuma A, Hatano M, Matsui M, Yamamoto A, Nakaya H, Yoshimori T, Ohsumi Y, Tokuhisa T and Mizushima N (2004) The role of autophagy during the early neonatal starvation period. Nature 432:1032-1036.
Li H, Wang P, Sun Q, Ding WX, Yin XM, Sobol RW, Beer-Stolz D, Yu J and Zhang L (2011a) Following cytochrome c release, autophagy is inhibited during chemotherapy-induced apoptosis by caspase-8-mediated cleavage of Beclin-1. Cancer Res Epub ahead of print.
Li M, Hou Y, Wang J, Chen X, Shao ZM and Yin XM (2011b) Kinetics comparisons of mammalian Atg4 homologues indicate selective preferences toward diverse Atg8 substrates. J Biol Chem 286:7327-7338.
Listenberger LL, Han X, Lewis SE, Cases S, Farese RV, Jr., Ory DS and Schaffer JE (2003) Triglyceride accumulation protects against fatty acid-induced lipotoxicity. Proc Natl Acad Sci U S A 100:3077-3082.
Luo S and Rubinsztein DC (2010) Apoptosis blocks Beclin 1-dependent autophagosome synthesis: an effect rescued by Bcl-xL. Cell Death Differ 17:268-277.
Luyendyk JP, Sullivan BP, Guo GL and Wang R (2010) Tissue factor-deficiency and protease activated receptor-1-deficiency reduce inflammation elicited by diet-induced steatohepatitis in mice. Am J Pathol 176:177-186.
Malhi H, Bronk SF, Werneburg NW and Gores GJ (2006) Free fatty acids induce JNK-dependent hepatocyte lipoapoptosis. J Biol Chem 281:12093-12101.
Malhi H and Gores GJ (2008) Molecular mechanisms of lipotoxicity in nonalcoholic fatty liver disease. Semin Liver Dis 28:360-369.
Mizushima N (2010) The role of the Atg1/ULK1 complex in autophagy regulation. Curr Opin Cell Biol 22:132-139.
Mizushima N, Yoshimori T and Levine B (2010) Methods in mammalian autophagy research. Cell 140:313-326.
This article has not been copyedited and formatted. The final version may differ from this version.JPET Fast Forward. Published on August 19, 2011 as DOI: 10.1124/jpet.111.184341
at ASPE
T Journals on M
ay 9, 2018jpet.aspetjournals.org
Dow
nloaded from

JPET # 184341
28
Nanji AA, Sadrzadeh SM, Yang EK, Fogt F, Meydani M and Dannenberg AJ (1995) Dietary saturated fatty acids: a novel treatment for alcoholic liver disease. Gastroenterology 109:547-554.
Neuschwander-Tetri BA (2010) Hepatic lipotoxicity and the pathogenesis of nonalcoholic steatohepatitis: the central role of nontriglyceride fatty acid metabolites. Hepatology 52:774-788.
Ni HM, Bockus A, Wozniak AL, Jones K, Weinman S, Yin XM and Ding WX (2011) Dissecting the dynamic turnover of GFP-LC3 in the autolysosome. Autophagy 7:54-70.
Ravikumar B, Sarkar S, Davies JE, Futter M, Garcia-Arencibia M, Green-Thompson ZW, Jimenez-Sanchez M, Korolchuk VI, Lichtenberg M, Luo S, Massey DC, Menzies FM, Moreau K, Narayanan U, Renna M, Siddiqi FH, Underwood BR, Winslow AR and Rubinsztein DC (2010) Regulation of mammalian autophagy in physiology and pathophysiology. Physiol Rev 90:1383-1435.
Ricchi M, Odoardi MR, Carulli L, Anzivino C, Ballestri S, Pinetti A, Fantoni LI, Marra F, Bertolotti M, Banni S, Lonardo A, Carulli N and Loria P (2009) Differential effect of oleic and palmitic acid on lipid accumulation and apoptosis in cultured hepatocytes. J Gastroenterol Hepatol 24:830-840.
Rubinsztein DC, Cuervo AM, Ravikumar B, Sarkar S, Korolchuk V, Kaushik S and Klionsky DJ (2009) In search of an "autophagomometer". Autophagy 5:585-589.
Scherz-Shouval R, Shvets E, Fass E, Shorer H, Gil L and Elazar Z (2007) Reactive oxygen species are essential for autophagy and specifically regulate the activity of Atg4. EMBO J 26:1749-1760.
Seki S, Kitada T and Sakaguchi H (2005) Clinicopathological significance of oxidative cellular damage in non-alcoholic fatty liver diseases. Hepatol Res 33:132-134.
Singh R, Kaushik S, Wang Y, Xiang Y, Novak I, Komatsu M, Tanaka K, Cuervo AM and Czaja MJ (2009a) Autophagy regulates lipid metabolism. Nature 458:1131-1135.
Singh R, Xiang Y, Wang Y, Baikati K, Cuervo AM, Luu YK, Tang Y, Pessin JE, Schwartz GJ and Czaja MJ (2009b) Autophagy regulates adipose mass and differentiation in mice. J Clin Invest 119:3329-3339.
Suzuki K and Ohsumi Y Current knowledge of the pre-autophagosomal structure (PAS). FEBS Lett 584:1280-1286.
Wobser H, Dorn C, Weiss TS, Amann T, Bollheimer C, Buttner R, Scholmerich J and Hellerbrand C (2009) Lipid accumulation in hepatocytes induces fibrogenic activation of hepatic stellate cells. Cell Res 19:996-1005.
Xu M, Wang W, Frontera JR, Neely MC, Lu J, Aires D, Hsu FF, Turk J, Swerdlow RH, Carlson SE and Zhu H (2011) Ncb5or deficiency increases fatty acid catabolism and oxidative stress. J Biol Chem 286:11141-11154.
Zhang Y, Goldman S, Baerga R, Zhao Y, Komatsu M and Jin S (2009) Adipose-specific deletion of autophagy-related gene 7 (atg7) in mice reveals a role in adipogenesis. Proc Natl Acad Sci U S A 106:19860-19865.
This article has not been copyedited and formatted. The final version may differ from this version.JPET Fast Forward. Published on August 19, 2011 as DOI: 10.1124/jpet.111.184341
at ASPE
T Journals on M
ay 9, 2018jpet.aspetjournals.org
Dow
nloaded from
JPET # 184341
29
Footnotes:
This study was supported in part by the National Institute of Health (NIH) funds R21
AA017421 & P20 RR021940, and P20 RR016475 from the IDeA Networks of
Biomedical Research Excellence (INBRE) program of the National Center for
Research Resources (W.X.D). J.P.L was supported by the NIH funds R01 ES017537,
P20 RR021940 and American Heart Association Scientist Development Grant
(0835121G). No additional external funding received for this study.
This article has not been copyedited and formatted. The final version may differ from this version.JPET Fast Forward. Published on August 19, 2011 as DOI: 10.1124/jpet.111.184341
at ASPE
T Journals on M
ay 9, 2018jpet.aspetjournals.org
Dow
nloaded from

JPET # 184341
30
Figure legends:
Figure 1. OA induces autophagy in HepG2 cells. HepG2 cells were first infected
with Ad-GFP-LC3 (100 viral particles per cell) overnight and then treated with vehicle
control (5% BSA), OA (500 μM), OA plus CQ (20 μM) or CQ (20 µM) alone, or with
various concentrations of OA (0, 125, 250 and 500 µM) for 6 hrs followed by
fluorescence microscopy. Representative GFP-LC3 images were shown in (A). The
number of GFP-LC3 dots per cell was determined (B-C). Data are presented as
mean ± SE from three independent experiments by counting more than 20 cells in
each individual experiment. *: p<0.05; #: p<0.01 (one way ANOVA with Scheffe's
post-hoc test). (D) HepG2 cells were treated by vehicle control (5% BSA), OA (500
μM), OA plus CQ (20 μM), CQ (20 μM) alone, OA plus Baf (50 nM) or Baf (50 nM)
alone for 6 hrs. Total cell lysates were subjected to immunoblot analysis with anti-
LC3 and anti-β-Actin antibodies. Densitometry analysis for the expression level of
LC3-II was performed using Image J software which was further normalized with its
loading control (β-Actin). Digital data are presented as the ratio of the vehicle control
(mean ± SE) from at least three independent experiments.
Figure 2. PA fails to induce autophagy in HepG2 cells. HepG2 cells were first
infected with Ad-GFP-LC3 overnight and then treated by vehicle control (5% BSA),
PA (500 μM), PA plus CQ (20 μM), CQ alone, or wither various concentrations of PA
(0, 125, 250 and 500 μM) for 6 hrs followed by fluorescence microscopy.
Representative GFP-LC3 images were shown in (A). The number of GFP-LC3 dots
This article has not been copyedited and formatted. The final version may differ from this version.JPET Fast Forward. Published on August 19, 2011 as DOI: 10.1124/jpet.111.184341
at ASPE
T Journals on M
ay 9, 2018jpet.aspetjournals.org
Dow
nloaded from

JPET # 184341
31
per cell was determined (B-C). Data are presented as mean ± SE from three
independent experiments by counting more than 20 cells in each individual
experiment. *: p<0.05; #: p<0.01 (one way ANOVA with Scheffe's post-hoc test). (D)
HepG2 cells were treated by vehicle control (5% BSA), PA (500 μM), PA plus CQ (20
μM), CQ (20 μM) alone, PA plus Baf (50 nM) or Baf (50 nM) alone for 6 hrs. Total cell
lysates were subjected to immunoblot analysis with anti-LC3 and anti-β-Actin
antibodies. Densitometry analysis for the expression level of LC3-II was performed
using Image J software which was further normalized with its loading control (β-
Actin). Digital data are presented as the ratio of the vehicle control (mean ± SE) from
at least three independent experiments.
Figure 3. OA but not PA increases the number of autophagosomes and lipid
droplet in HepG2 cells. (A) HepG2 cells were treated with BSA vehicle control
(panel a), PA (500 μM, panel b) or OA (500 µM, panel c-f) for 6 hrs and the cells
were further processed for EM. Arrows denote autophagosomes. N, nuclei; LD, lipid
droplet; and M, mitochondria. The number of autophagosomes (B) and lipid droplets
(C) per cell section was determined (mean ± SD) from more than 30 different cells. #:
p<0.01 (one way ANOVA with Scheffe's post-hoc test). (D) HepG2 cells were treated
with BSA vehicle control (panel a), OA (500 µM, panel b) or PA (500 μM, panel c) for
6 hrs and fixed with 4% paraformaldehyde. The cells were further stained with Bodipy
493/503 (0.1 μM) for lipid droplets and Hoechst 33342 (0.5 µg/mL) for the nuclei
followed by fluorescence microscopy. (E) The number of lipid droplets per cell was
quantified and data are presented as mean ± SE from at least three independent
This article has not been copyedited and formatted. The final version may differ from this version.JPET Fast Forward. Published on August 19, 2011 as DOI: 10.1124/jpet.111.184341
at ASPE
T Journals on M
ay 9, 2018jpet.aspetjournals.org
Dow
nloaded from

JPET # 184341
32
experiments. #: p<0.01 (one way ANOVA with Scheffe's post-hoc test).
Figure 4. NAC and 3MA suppress OA-induced autophagy in HepG2 cells. (A)
HepG2 cells were first infected with Ad-GFP-LC3 (100 viral particles per cell)
overnight and then treated with vehicle control (5% BSA), OA (500 μM), PA (500
μM), OA plus NAC (5 mM), PA plus NAC (5 mM), or NAC (5 mM) , OA plus 3MA (10
mM), PA plus 3MA (10 mM) or 3MA (10 mM) alone for 6 hrs followed by fluorescence
microscopy. (B-C) The number of GFP-LC3 dots per cell (mean ± SE) was
quantified from three independent experiments and more than 20 cells were counted
in each individual experiment. *: p<0.05; #: p<0.01 (one way ANOVA with Scheffe's
post-hoc test). (D) HepG2 were treated by OA or PA (500 μM) for 6, 12 and 24 hrs,
and the expression levels of p-4EBP1/Total-4EBP1 and p-p70S6k/Total- p70S6k
were determined by immunoblot analysis from at least three independent
experiments. (E) HepG2 cells were treated with vehicle control (5% BSA), various
concentrations (125, 250 and 500 µM) of OA and PA for 6 hrs. The expression levels
of p-4EBP1/Total-4EBP1 and p-p70S6k/Total- p70S6k expression were determined
by immunoblot analysis from at least three independent experiments. Densitometry
analysis for the expression levels of p-4EBP1 and p-p70S6K was performed using
Image J software which was further normalized with its loading control (β-Actin).
Figure 5. Differential effects of OA and PA on apoptosis in HepG2 cells. (A)
HepG2 cells were treated with vehicle control (5% BSA), OA (500 μM), PA (500 μM)
or TNF-α (10 ng/mL) plus ActD (0.2 µg/mL) for 24 hrs. Apoptotic nuclei were
analyzed by nuclear staining with Hoechst 33342 (1 µg/mL) for fragmented or
This article has not been copyedited and formatted. The final version may differ from this version.JPET Fast Forward. Published on August 19, 2011 as DOI: 10.1124/jpet.111.184341
at ASPE
T Journals on M
ay 9, 2018jpet.aspetjournals.org
Dow
nloaded from

JPET # 184341
33
condensed nuclei (arrows). (B) HepG2 cells were treated with OA or PA (500 μM) for
6, 12, 24 hrs or various concentrations (125, 250 and 500 µM) of OA or PA (C), and
the number of apoptotic nuclei was quantified (mean ± SE, n=3). #: p<0.01 (one way
ANOVA with Scheffe's post-hoc test). (D) HepG2 cells were treated with vehicle
control (5% BSA), OA (500 μM), PA (500 μM) or TNF-α (10 ng/mL) plus ActD (0.2
µg/mL) for 6 hrs. The cells were loaded with TMRM (50 nM) followed by fluorescence
microscopy (arrow heads: cells with partially lost mitochondrial membrane potential;
arrows: cells with completely lost mitochondrial membrane potential). (E) The number
of cells with the loss (both partial and complete) of TMRM staining was quantified
(mean ± SEM) from at least three independent experiments. #: p<0.01 (one way
ANOVA with Scheffe's post-hoc test).
Figure 6. PA but not OA induces caspase-mediated Beclin 1 cleavage. (A)
HepG2 cells were treated by OA or PA (500 μM) for 6, 12, 24 hrs. Total cell lysates
were subjected to immunoblot analysis using an anti-Beclin 1 antibody. (B) HepG2
cells were treated with vehicle control (5%BSA), OA (500 μM), PA (500 μM), or TNF-
α (10 ng/mL) plus ActD (0.2 µg/mL) for 24 hrs. Total cell lysates were subjected to
immunoblot analysis for Beclin 1 and caspase 3. (C) Total cell lysates (30 µg) were
used for caspase-3 activity analysis (mean ± SE, n=3). *: p<0.05; #: p<0.01 (one way
ANOVA with Scheffe's post-hoc test). (D) HepG2 cells were treated with vehicle
control (5% BSA), PA (500 μM), PA (500 μM) plus ZVAD-fmk (50 µM), TNF-α (10
ng/mL) plus ActD (0.2 µg/mL), or TNF-α (10 ng/mL) plus ActD (0.2 µg/mL) with
ZVAD-fmk (50 μM) for 24 hrs. Total cell lysates were subjected to immunoblot
This article has not been copyedited and formatted. The final version may differ from this version.JPET Fast Forward. Published on August 19, 2011 as DOI: 10.1124/jpet.111.184341
at ASPE
T Journals on M
ay 9, 2018jpet.aspetjournals.org
Dow
nloaded from

JPET # 184341
34
analysis for Beclin 1 and (E) apoptotic cell death was analyzed by nuclear staining
with Hoechst 33342 (mean ± SE, n=3). #: p<0.01 (one way ANOVA with Scheffe's
post-hoc test).
Figure 7. Suppression of autophagy enhances fatty acid-induced cell death and
lipid accumulation. (A) HepG2 cells were treated with vehicle control (5% BSA), OA
(500 μM), OA plus CQ (20 μM), CQ alone, OA plus 3MA (10 mM), or 3MA alone for
24 hrs, and apoptotic cell death was analyzed by nuclear staining with Hoechst
33342 (mean ± SE, n=3). *: p<0.05; #: p<0.01 (one way ANOVA with Scheffe's post-
hoc test). (B) HepG2 cells were treated with vehicle control (5% BSA) or various
concentrations (125, 250, 500) of OA or PA for 6 hrs or (C) treated with OA (500 µM)
or PA (500 μM) in the presence or absence of CQ (20 μM) for 6 hrs. Total cell lysates
were subjected to immunoblot analysis for perilipin-a. Densitometry analysis for the
expression level of perilipin was performed using Image J software which was further
normalized with its loading control (β-Actin). (D) HepG2 cells were treated as in (C)
and cellular TG levels (mean ±SE, n=3) were quantified as described in the
Materials and Methods, #: p<0.01 (one way ANOVA with Scheffe's post-hoc test).
Figure 8. High fat diet induces steatosis and autophagy in mouse liver. Male
C57BL/6J mice were fed either a control diet or a western diet for 3 months. All the
mice were starved for 16 hrs before they were sacrificed. (A) Representative
photomicrograph of H&E-stained liver section from a mouse fed control diet (panel a) and
from a mouse fed the high fat diet (panel b). Panel c was enlarged photomicrograph from
panel b showing typical macro-vesicular hepatic steatosis (arrows). (B) Liver samples
This article has not been copyedited and formatted. The final version may differ from this version.JPET Fast Forward. Published on August 19, 2011 as DOI: 10.1124/jpet.111.184341
at ASPE
T Journals on M
ay 9, 2018jpet.aspetjournals.org
Dow
nloaded from

JPET # 184341
35
were processed for EM. Control diet (panel a); high fat diet (panels b & c); panels d & e
were enlarged photomicrographs from the boxed areas in panel c. Arrows: double
membrane autophagosomes; N: nuclei, LD: lipid droplets; M: mitochondria. (C) Total liver
lysates were subjected to western blot analysis using an anti-LC3 antibody. The same
membrane was blotted for GAPDH as the loading control. (D) Densitometry analysis for
the expression level of LC3-II was performed using Image J software which was
further normalized with its loading control (GAPDH). Data are presented as the fold
of the control diet mouse livers (mean ± SE, n=6). #: p<0.01, Student t test.
This article has not been copyedited and formatted. The final version may differ from this version.JPET Fast Forward. Published on August 19, 2011 as DOI: 10.1124/jpet.111.184341
at ASPE
T Journals on M
ay 9, 2018jpet.aspetjournals.org
Dow
nloaded from

This article has not been copyedited and formatted. The final version may differ from this version.JPET Fast Forward. Published on August 19, 2011 as DOI: 10.1124/jpet.111.184341
at ASPE
T Journals on M
ay 9, 2018jpet.aspetjournals.org
Dow
nloaded from

This article has not been copyedited and formatted. The final version may differ from this version.JPET Fast Forward. Published on August 19, 2011 as DOI: 10.1124/jpet.111.184341
at ASPE
T Journals on M
ay 9, 2018jpet.aspetjournals.org
Dow
nloaded from
This article has not been copyedited and formatted. The final version may differ from this version.JPET Fast Forward. Published on August 19, 2011 as DOI: 10.1124/jpet.111.184341
at ASPE
T Journals on M
ay 9, 2018jpet.aspetjournals.org
Dow
nloaded from

This article has not been copyedited and formatted. The final version may differ from this version.JPET Fast Forward. Published on August 19, 2011 as DOI: 10.1124/jpet.111.184341
at ASPE
T Journals on M
ay 9, 2018jpet.aspetjournals.org
Dow
nloaded from

This article has not been copyedited and formatted. The final version may differ from this version.JPET Fast Forward. Published on August 19, 2011 as DOI: 10.1124/jpet.111.184341
at ASPE
T Journals on M
ay 9, 2018jpet.aspetjournals.org
Dow
nloaded from

This article has not been copyedited and formatted. The final version may differ from this version.JPET Fast Forward. Published on August 19, 2011 as DOI: 10.1124/jpet.111.184341
at ASPE
T Journals on M
ay 9, 2018jpet.aspetjournals.org
Dow
nloaded from

This article has not been copyedited and formatted. The final version may differ from this version.JPET Fast Forward. Published on August 19, 2011 as DOI: 10.1124/jpet.111.184341
at ASPE
T Journals on M
ay 9, 2018jpet.aspetjournals.org
Dow
nloaded from

This article has not been copyedited and formatted. The final version may differ from this version.JPET Fast Forward. Published on August 19, 2011 as DOI: 10.1124/jpet.111.184341
at ASPE
T Journals on M
ay 9, 2018jpet.aspetjournals.org
Dow
nloaded from
This article has not been copyedited and formatted. The final version may differ from this version.JPET Fast Forward. Published on August 19, 2011 as DOI: 10.1124/jpet.111.184341
at ASPE
T Journals on M
ay 9, 2018jpet.aspetjournals.org
Dow
nloaded from

This article has not been copyedited and formatted. The final version may differ from this version.JPET Fast Forward. Published on August 19, 2011 as DOI: 10.1124/jpet.111.184341
at ASPE
T Journals on M
ay 9, 2018jpet.aspetjournals.org
Dow
nloaded from
This article has not been copyedited and formatted. The final version may differ from this version.JPET Fast Forward. Published on August 19, 2011 as DOI: 10.1124/jpet.111.184341
at ASPE
T Journals on M
ay 9, 2018jpet.aspetjournals.org
Dow
nloaded from

This article has not been copyedited and formatted. The final version may differ from this version.JPET Fast Forward. Published on August 19, 2011 as DOI: 10.1124/jpet.111.184341
at ASPE
T Journals on M
ay 9, 2018jpet.aspetjournals.org
Dow
nloaded from

This article has not been copyedited and formatted. The final version may differ from this version.JPET Fast Forward. Published on August 19, 2011 as DOI: 10.1124/jpet.111.184341
at ASPE
T Journals on M
ay 9, 2018jpet.aspetjournals.org
Dow
nloaded from
This article has not been copyedited and formatted. The final version may differ from this version.JPET Fast Forward. Published on August 19, 2011 as DOI: 10.1124/jpet.111.184341
at ASPE
T Journals on M
ay 9, 2018jpet.aspetjournals.org
Dow
nloaded from

This article has not been copyedited and formatted. The final version may differ from this version.JPET Fast Forward. Published on August 19, 2011 as DOI: 10.1124/jpet.111.184341
at ASPE
T Journals on M
ay 9, 2018jpet.aspetjournals.org
Dow
nloaded from