unpacking the logic model - sree
TRANSCRIPT

The Policy & Research GroupNew Orleans | Seattle
Unpacking the Logic Model: A Discussion of Mediators and Antecedents of Educational Outcomes from the Investing in Innovation (i3) programSeptember 9, 2020
Presenters:
Katie Lass, The Policy & Research Group
Hannah D’Apice, Empirical Education & Stanford University
Audra Wingard, Empirical Education
Thanh Nguyen, Empirical Education
Discussant:
Anne Wolf, Abt Associates

The Policy & Research Group
Investing In Innovation
(i3)
Develop and test innovative education practices that show promise of effectiveness• Katie Lass, Peer Group Connection (RCT)• Hannah D’Apice, Enhanced Units (RCT)• Audra Wingard, CREATE (QED)
Further develop innovative education practices and regionally or nationally scale those practices. Moderate prior evidence of effectiveness.
• Thanh Nguyen, Making Sense of SCIENCE (RCT)
Programs supported by strong prior evidence of effectiveness. Improve outcomes for an increased number of high-need students and generate information about the students and contexts for which a practice is most effective.
Development
Validation
Scale-Up
Tiered Evidence Grants
The Policy & Research GroupNew Orleans | Seattle
Impact on Antecedents of Student Dropout in a Cross-Age Peer Mentoring Program
Katie Lass, The Policy & Research Group
Sarah Walsh, The Policy & Research Group
Eric Jenner, The Policy & Research Group
Sherry Barr, Center for Supportive Schools

The Policy & Research Group
Federal Funding Acknowledgement and Disclaimer
This presentation was made possible by Grant Number U411C150048 from the U.S. Department of Education, Office of Elementary and Secondary Education. Its contents are solely the responsibility of The Policy & Research Group and do not necessarily represent the official views of the U.S. Department of Education, Office of Elementary and Secondary Learning.

The Policy & Research Group
The Policy & Research Group
Peer Connection Study Overview
■ Implementation Years: 2016-17, 2017-18, 2018-19■ Study partners:
▪ Intervention developer - Center for Supportive Schools▪ Independent evaluator - The Policy & Research Group ▪ Implementation sites - 6 high schools in rural North Carolina
■ Study design:▪ Randomized Controlled Trial (RCT) targeting 9th grade students▪ Primary outcomes of interest – daily attendance and credit accrual▪ Exploratory outcomes of interest – disciplinary events, engagement, educational
outlook, social and emotional skills▪ Data collection - school records and pre- and post-program questionnaire
The Policy & Research Group
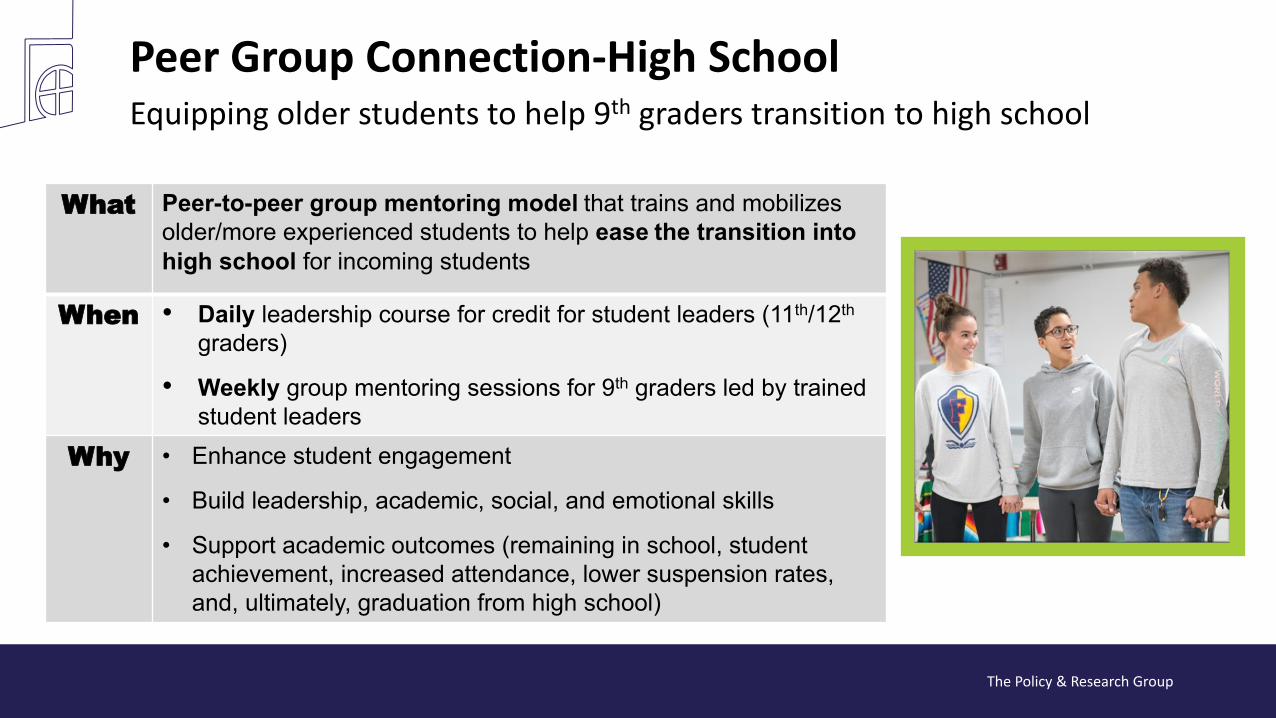
Peer Group Connection-High SchoolEquipping older students to help 9th graders transition to high school
What Peer-to-peer group mentoring model that trains and mobilizes older/more experienced students to help ease the transition into high school for incoming students
When • Daily leadership course for credit for student leaders (11th/12th
graders)
• Weekly group mentoring sessions for 9th graders led by trained student leaders
Why • Enhance student engagement
• Build leadership, academic, social, and emotional skills
• Support academic outcomes (remaining in school, student achievement, increased attendance, lower suspension rates, and, ultimately, graduation from high school)

The Policy & Research Group
Intervention Structure

The Policy & Research Group
Logic Model

The Policy & Research Group
5The Policy & Research Group
Exploratory Impact Analysis MethodsGoing beyond ITT effects
Research Questions Predictors Analysis
Are there variations in PGC-HS’s impact for different subgroups of students?
▪ Demographic characteristics ▪ Baseline attitudes and SEL
skills
Interaction term (TX*predictor)
Are there variations in PGC-HS’s impact under different school-level implementation conditions?
▪ Number and type of sessions offered
▪ Length of programming▪ Previous experience
implementing
Interaction term (TX*predictor)
What are the Complier Average Causal Effects (CACE) of participating fully in PGC?
▪ Compliance▪ Baseline predictors of
compliance
▪ Two-stage least squares regression
▪ Principal score weighting

The Policy & Research Group
For which outcomes are
there variations in effect?
For which subgroups are
there variations in outcomes?
Subgroup Analyses
Outcomes
Subg
roup
s

The Policy & Research Group
The Policy & Research Group
Under what implementation conditions do impacts vary?
School-level Measures Definition of contrasts
Number of sessions offered Offered at least 18 sessions (minimum fidelity requirement)6 schools
Offered less than 18 sessions (did not meet fidelity requirements)3 schools
Type of sessions offered Offered all of the required types of sessions (to meet fidelity requirements)4 schools
Failed to offer at least one of the required sessions (did not meet fidelity requirements)5 schools
Length of programming Offered PGC-HS for the fall semester only7 schools
Offered PGC-HS for the entire academic year2 schools
Experience with program First year implementing PGC-HS5 schools
Second year implementing PGC-HS4 schools

The Policy & Research Group
Complier Average
Causal Effect
• Dosage varied widely• Full participation defined as
attending 16 or more outreach sessions (39% compliance)
• Compared two common approaches:• Instrumental variable two-
stage least squares regression
• Principal score weighting
Stuart & Jo (2015) Assessing the sensitivity of methods for estimating principal causal effects. Statistical Methods in Medical Research, 24(6): 657-674.
How much of the program do students need for it to have an effect?

The Policy & Research Group
5The Policy & Research Group
Key FindingsStudy Results
Subgroup Analyses
• PGC appears to have a stronger (more significant) impact on reducing disciplinary events with:• Male students• Students who had a negative growth mindset attitude• Students who didn’t expect to receive a college degree
Implementation Conditions
• When schools offer a minimum of 18 sessions, offer the required type of sessions, and/or are offering the program for the first time, students in PGC group:• Were less likely to receive a disciplinary infraction • Scored higher on school engagement• Scored higher on measures of SEL skills
CACE • Attending 16 or more outreach sessions was associated with:• Reduced likelihood of suspension• Higher GPAs• Higher scores on SEL skills, engagement, and educational mindset
Next Steps: Examine impact on long-term outcomes beyond 9th grade

The Policy & Research GroupNew Orleans | Seattle
Katie Lass, MPH, LMSWThe Policy & Research Group
Sherry Barr, Psy.D.Center for Supportive [email protected]
Thank you!

·
Supporting Content-area Learning in Biology and U.S. History
September 2020
Presenters
• What are Enhanced Units?
• Study overview
• Results
• Conditions to support impact
• Areas for improvement & follow-on research
Agenda

• Developed by SRI, CAST, and research and practitioner partners
• Goal to improve student content learning and higher order reasoning in secondary school, especially for students with learning challenges
• Funded by i3 Development grant (2014)
Enhanced Units
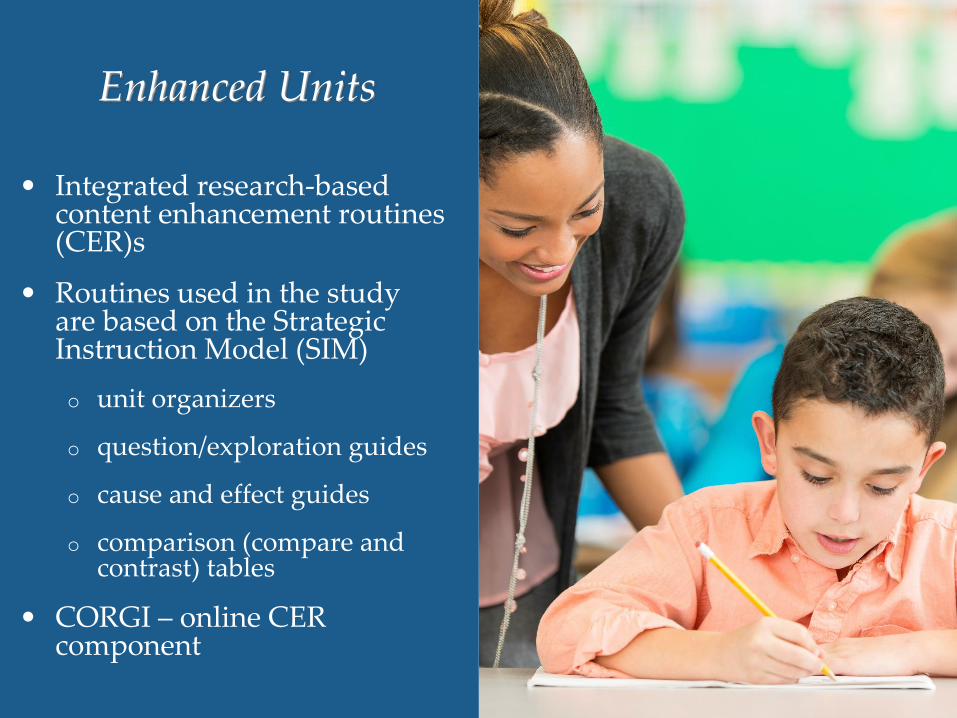
• Integrated research-based content enhancement routines (CER)s
• Routines used in the study are based on the Strategic Instruction Model (SIM) o unit organizers
o question/exploration guides
o cause and effect guides
o comparison (compare and contrast) tables
• CORGI – online CER component
Enhanced Units


EU Logic Model

Primary questions compared participants to the scores of similar grade BAU students:
• Did students in grades 9-12 who attended HS EU Biology classes demonstrate higher order content knowledge in the Biology unit test scores?
• Did 11th grade students who attended HS EU U.S. History classes demonstrate higher order content knowledge in the U.S. History unit test scores?
• Did both groups of EU students, as a group, demonstrate higher order content knowledge in their respective unit test scores?
Secondary questions are the same, but specific to students that received special education services.
2018 Field StudyPrimary & Secondary Research Questions
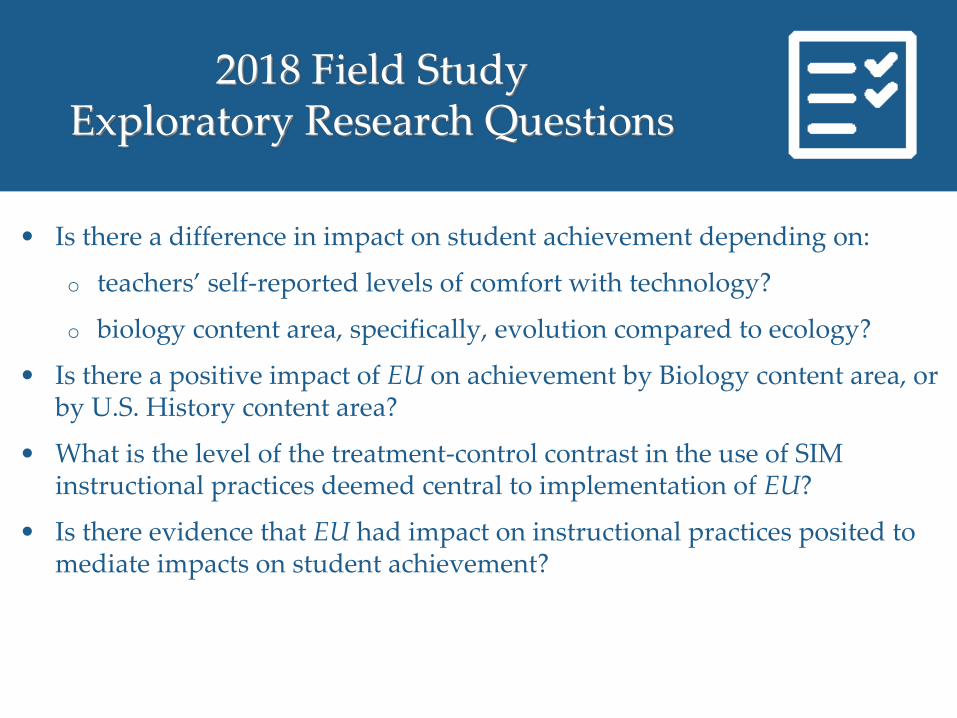
2018 Field StudyExploratory Research Questions
• Is there a difference in impact on student achievement depending on:
o teachers’ self-reported levels of comfort with technology?
o biology content area, specifically, evolution compared to ecology?
• Is there a positive impact of EU on achievement by Biology content area, or by U.S. History content area?
• What is the level of the treatment-control contrast in the use of SIM instructional practices deemed central to implementation of EU?
• Is there evidence that EU had impact on instructional practices posited to mediate impacts on student achievement?
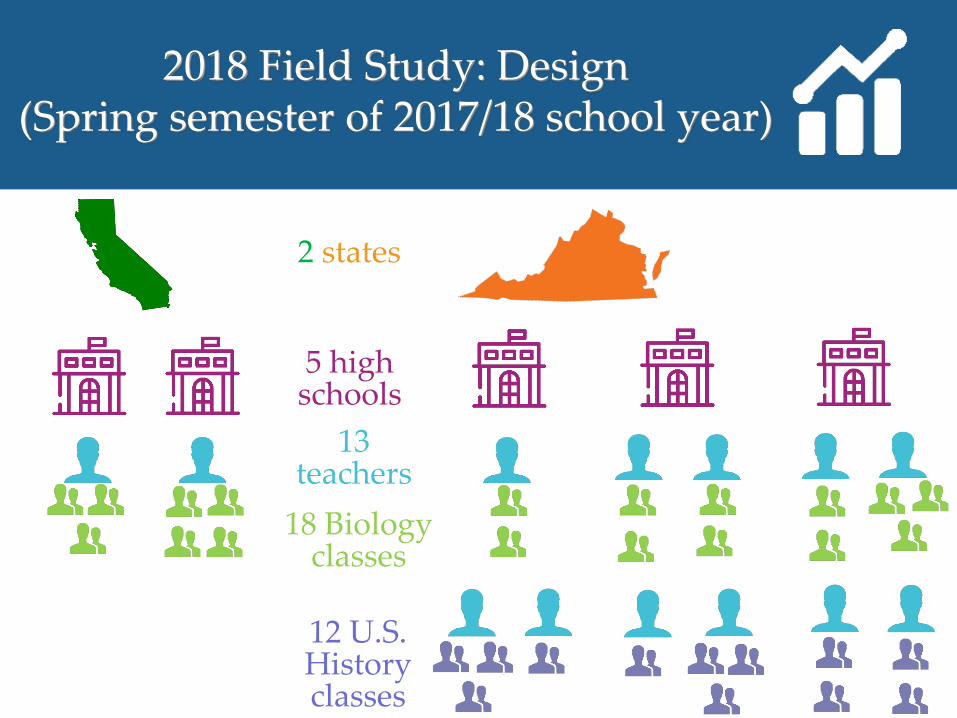
2018 Field Study: Design(Spring semester of 2017/18 school year)
5 highschools
2 states
13 teachers
18 Biology classes
12 U.S. Historyclasses
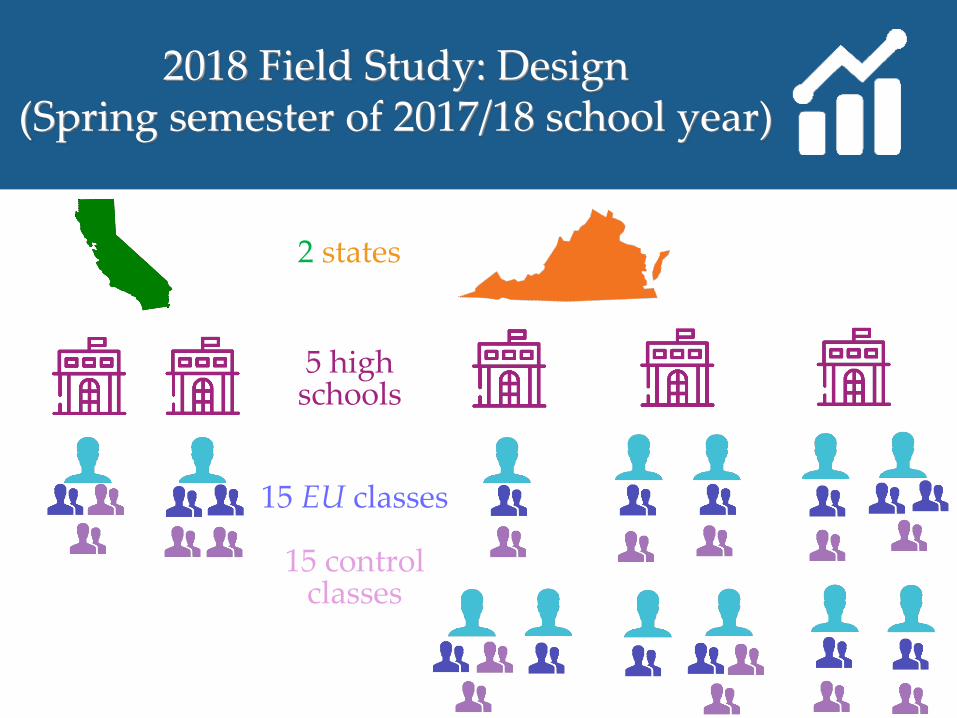
2018 Field Study: Design(Spring semester of 2017/18 school year)
5 highschools
2 states
15 EU classes
15 control classes
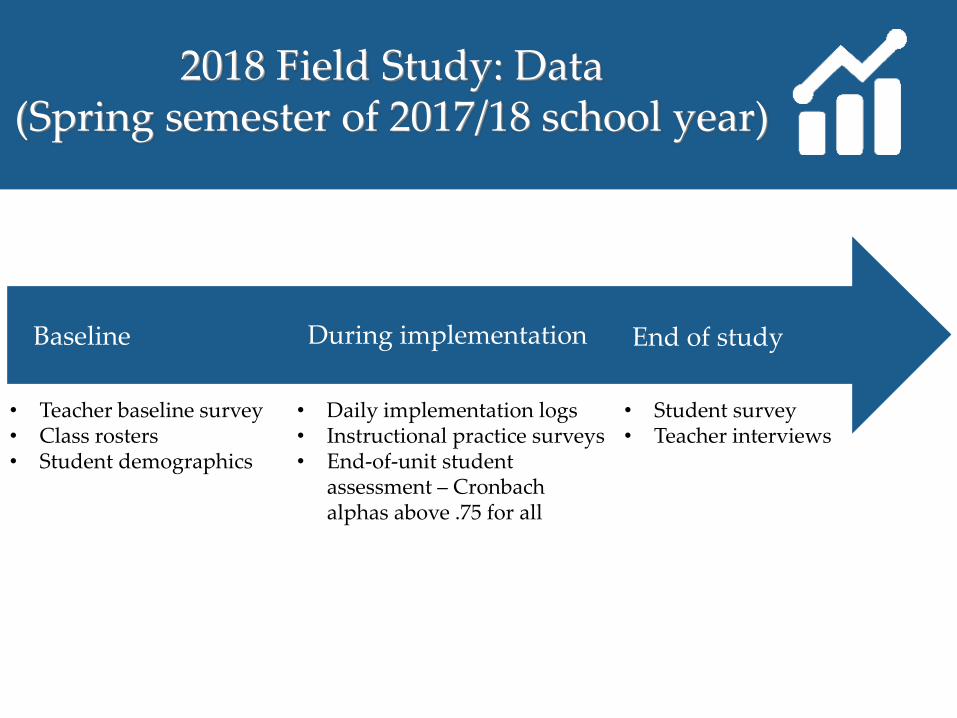
2018 Field Study: Data(Spring semester of 2017/18 school year)
Baseline During implementation End of study
• Teacher baseline survey • Class rosters• Student demographics
• Daily implementation logs• Instructional practice surveys• End-of-unit student
assessment – Cronbach alphas above .75 for all
• Student survey • Teacher interviews

Findings: Main Impact from 3-Level HLM Analysis
Effect size p valueChange in
percentile rankingBiology
Unadjusted effect size 0.01 .958 0%Adjusted effect size 0.01 .892 0%
U.S. HistoryUnadjusted effect size 0.33 .214 12%Adjusted effect size 0.32 .037 12%
Biology & U.S. History combinedUnadjusted effect size 0.14 .516 6%Adjusted effect size 0.14 .067 6%
Low Differential Attrition: No classes were lost to attrition—we obtained outcomes for one or more students present at baseline in the classroom. Student attrition for the combined sample was 3.8% overall, and 2% differential. Low potential for bias.Sensitivity Analyses: U.S. History and Combined results are robust in terms of their magnitudes; however, for U.S. History, the p values fluctuate around significance level .05.

• Positive differential impact of EU on achievement, depending on disability status.
• No differential impact of EU on achievement, depending on level of teachers’ baseline score on the Technological Pedagogical and Content Knowledge (TPAK).
Findings: Moderator Analyses (Combined Sample)

• Students on average experienced greater impact of EU on assessment of Evolution than Ecology.
• These results are considered exploratory.
Findings: Impact Within Biology Units
…the content of Enhanced Units best support student learning when they focus on a single topic, allow adequate time, and use instructional supports that all relate to the critical topic of the unit and build sequential understanding.
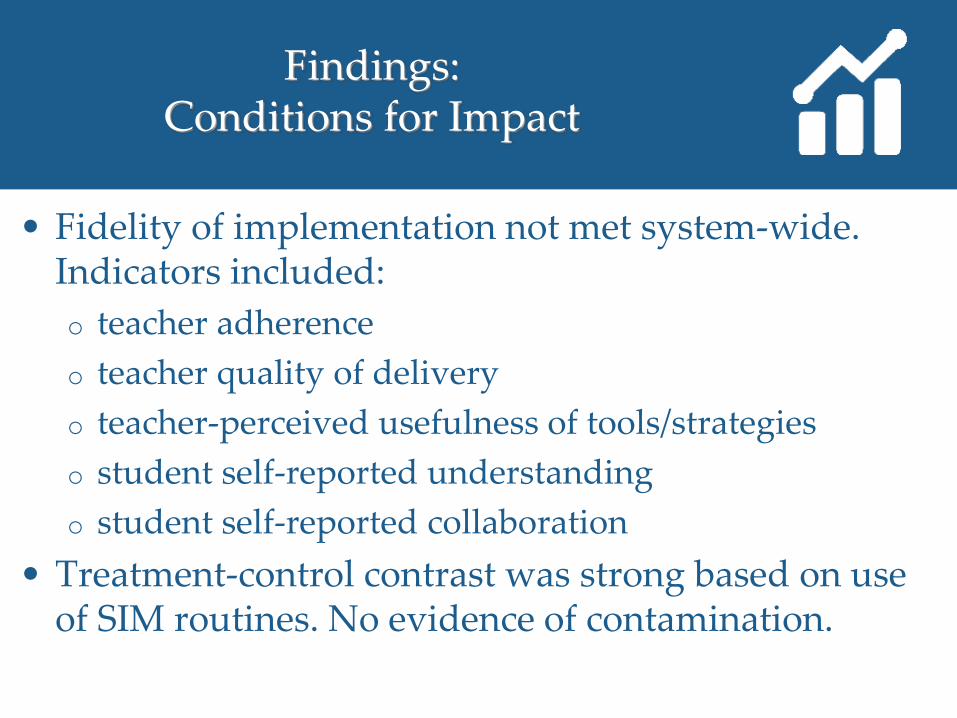
• Fidelity of implementation not met system-wide. Indicators included: o teacher adherenceo teacher quality of deliveryo teacher-perceived usefulness of tools/strategieso student self-reported understandingo student self-reported collaboration
• Treatment-control contrast was strong based on use of SIM routines. No evidence of contamination.
Findings: Conditions for Impact
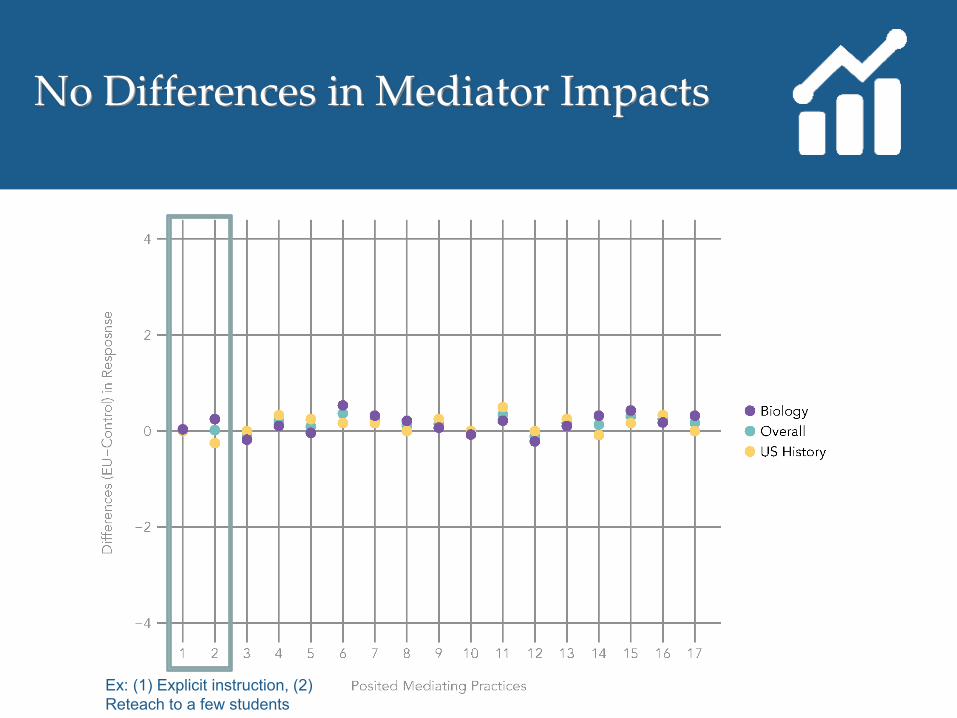
No Differences in Mediator Impacts
Ex: (1) Explicit instruction, (2) Reteach to a few students
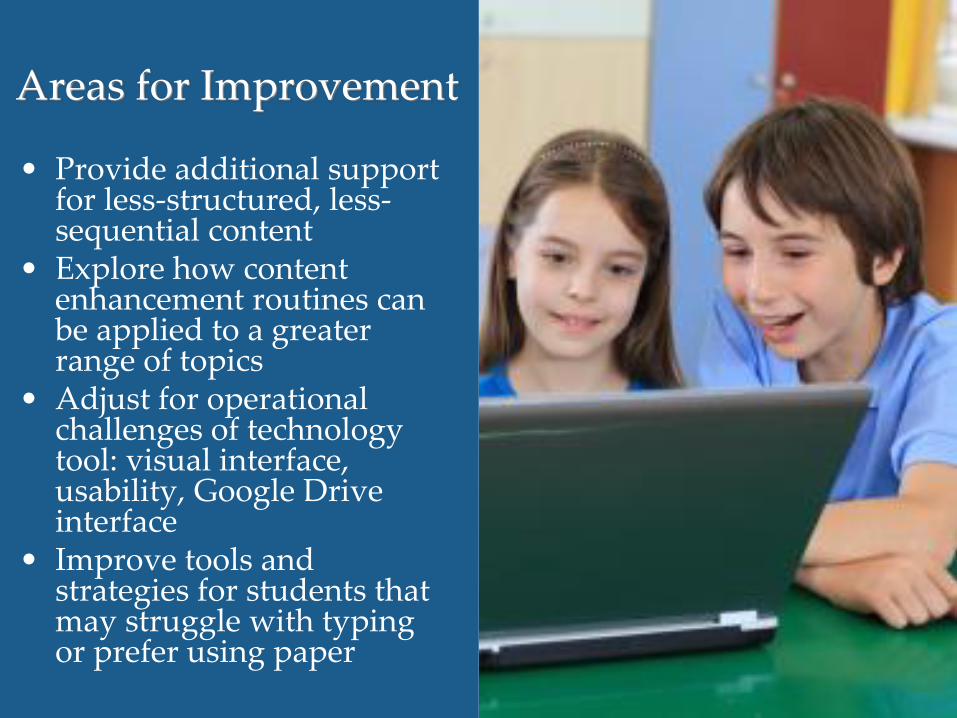
• Provide additional support for less-structured, less-sequential content
• Explore how content enhancement routines can be applied to a greater range of topics
• Adjust for operational challenges of technology tool: visual interface, usability, Google Drive interface
• Improve tools and strategies for students that may struggle with typing or prefer using paper
Areas for Improvement

• What mediates impact? Flesh out Logic Model, identify better measures of mediators
• Tease out impact for students with disabilities: look at different types of disabilities
• What is/are the best way(s) for teachers to present SIM routines to their students, particularly for students with learning challenges through SIM intervention?o Investigate how the routines can be applied to a greater
range of topics.o Consider how introducing devices to the routines
potentially presents steeper learning curves and difficulty with buy-in for teachers and students alike
Follow-on research

ContactHannah D’Apice, Research Manager
Full EU report available at https://www.empiricaleducation.com/past_research/
Reference this presentation:D’Apice, H., Schellinger, A., Zacamy, J., Wei, X., & Jaciw, A. P. (2020).
Supporting Content-Area Learning in Biology and U.S. History: A Randomized Control Trial of Enhanced Units in California and Virginia. Presentation
delivered in a virtual symposium on September 9, 2020 for the annual spring conference of the Society for Research on Educational
Effectiveness, Washington, DC. Retrieve from https://www.empiricaleducation.com/past_research/
Empiricaleducation.com
empiricaleducation
empiricaleducation
empiricaled
empiricaleducation
empirical-education
© 2017 Empirical Education Inc. · Please do not cite or distribute.
September 2020
Collaboration and Reflection to Enhance Atlanta Teacher Effectiveness (CREATE) Teacher Residency Program
Empiricaleducation.com
empiricaleducation
empiricaleducation
empiricaled
empiricaleducation
empirical-education

Presenters

• 3 year teacher residency program• Year 1 = Student teaching year • Year 2 = First year as a full-time teacher• Year 3 = Second year as a full-time teacher
•aims to develop new teachers into critically-conscious, compassionate, and skilled with the goal of retaining effective teachers in high-needs schools and ultimately raising student achievement
The Intervention: CREATE

AgendaLogic Model
Study Design
Findings
Challenges
What’s next?
6


Survey Data
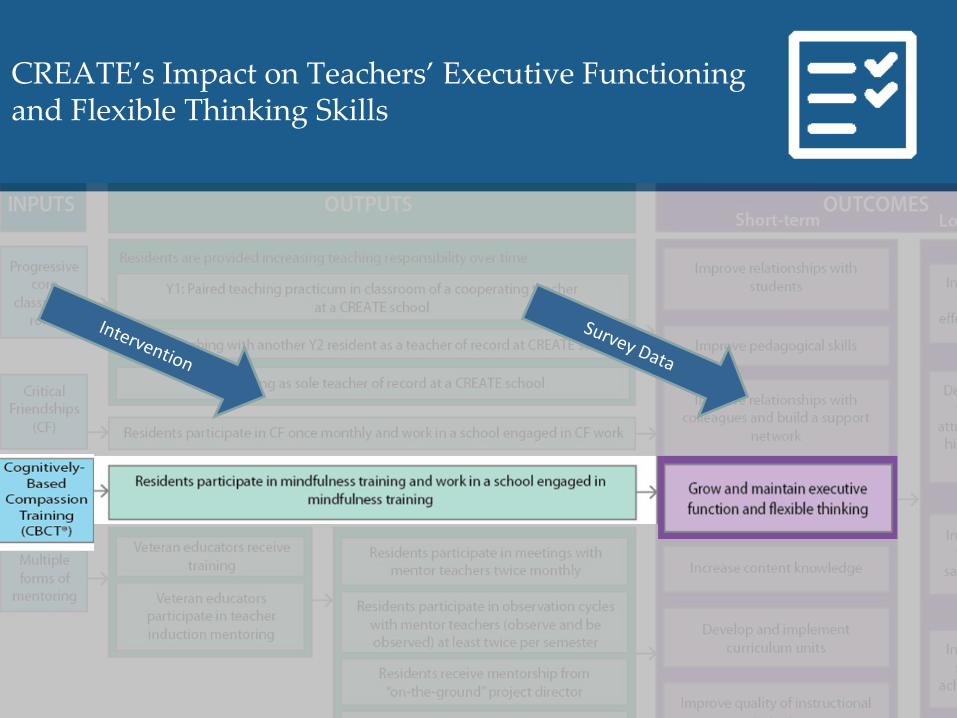
CREATE’s Impact on Teachers’ Executive Functioning and Flexible Thinking Skills

Observation component (TAPS) of Georgia Teacher Evaluation Scores
Participant Database and Teacher Records from the Georgia Dept of Education
Survey Data
Student Achievement Test Scores (Georgia Milestones)

Executive function and flexible thinking skills?
❑ Mindfulness ❑ Resilience ❑ Self-Compassion*❑ Burnout*
Teacher retention? Teacher effectiveness?Student achievement?
What is the impact of CREATE on…
* Self-compassion and burnout are outcomes we began assessing under the SEED grant

AgendaLogic Model
Study Design
Findings
Challenges
What’s next?
6

➢ Quasi-Experiment with a matched comparison group
➢ Two groups: o Treatment: Participants in CREATE residency program o Comparison: Similar pre-service teachers at GSU who
will go through traditional credentialing program
➢ 6 Cohorts
Study Design

AgendaLogic Model
Study Design
Findings
Challenges
What’s next?
6

Review of Findings
Executive Functioning and Flexible Thinking Skills
1. Mindfulness
2. Stress Management & Empathy Related to Teaching
3. Commitment to Teaching
4. Self-Efficacy in Teaching
5. Resilience

Troubleshooting
• Do impacts vary depending on individual attributes?
• Are measures sensitive to the effects of the intervention?

Do impacts vary depending on individual attributes?
✓ Confidence in subject matter1. Mindfulness2. Stress Management & Empathy3. Commitment to Teaching
✓ Confidence in general teaching skills1. Mindfulness

Are measures sensitive to the effects of the intervention?
Understanding CREATE’s Impact
Reduce Stress and Promote Resilience(Five Facets, Stress Management & Empathy, CD-RISC)
Develop Self Compassion(Self-Compassion Scale)
Prevent Burnout(Maslach Teacher Burnout scale)
Long term outcomes
teacher effectiveness
+ teacher
retention +
student achievement

Observation component (TAPS) of Georgia Teacher Evaluation Scores

Findings
Teacher Effectiveness
0
2
4
6
8
10
12
14
Level 0 Level 1 Level 2 Level 3
# o
f P
arti
cip
ants
Score
CREATE Control
0
2
4
6
8
10
12
14
Level 0 Level 1 Level 2 Level 3
# o
f P
arti
cip
ants
Score
CREATE Control
Instructional Strategies Positive Learning Environment

Student Achievement Test Scores (Georgia Milestones)

What is the impact of CREATE on mathematics and ELAachievement of students in grades 4-8, as measured by the Georgia Milestones Assessment System?
Findings
Student Achievement
✓✓✓✓

Participant Database and Teacher Records from the Georgia Dept of Education

Findings
Teacher Retention

AgendaLogic Model
Study Design
Findings
Challenges
What’s next?
6

• Increase sample size by adding more cohorts of teachers
• Continue survey analysis for Cohorts 3-5
• Investigate possible mediating mechanisms on teacher retention (as captured through surveys)
• Track teachers for additional years after they leave the CREATE program
What’s Next?

Questions?
Reference this presentation:Wingard, A., Jaciw, A. P., & Zacamy, J. (2020). The Role of
Socioemotional Learning in Teacher Induction: A Longitudinal
Study of the CREATE Teacher Residency Program.
Presentation delivered in a virtual symposium on September 9, 2020 for the annual spring conference of the
Society for Research on Educational Effectiveness, Washington, DC. Retrieved from
https://www.empiricaleducation.com/create/
© 2020 Empirical Education Inc.
Empiricaleducation.com
empiricaleducation
empiricaleducation
empiricaled
empiricaleducation
empirical-education

·
Uncovering the Black Box: Impacts on Mediators of a Science Teacher Professional
Development Model
September 9, 2020

Agenda
❑ Setting the stage
❑ Overview of Making Sense of SCIENCE (MSS)
❑ Overview of the study and this exploratory analysis
❑ Description of the analysis specific to unpacking the logic model
❑ Findings: Unpacking the logic model
❑ Making sense of the findings

Fundamental Shifts in Science Education
• Release of Next Generation Science Standards (NGSS) in 2013
• Focus on three-dimensional learning
• Guidance calls for systematic changes
• Curriculum and curriculum resources
• Teacher professional development
• Instructional practices
• Assessment

Overview of the Intervention
• Science teacher professional learning model
• Developed by WestEd
• Focuses on the critical connections between science understanding, literacy support, and
classroom practices, in ways that support the implementation of NGSS and the CCSS
• Capacity building for school administrators and a Leadership Cadre
• Professional learning activities for teachers each year for 2 years
• 30 hours of professional learning in the summer
• 12 hours of Professional Learning Communities (PLCs)

Making Sense of SCIENCE: Logic Model

Making Sense of SCIENCE: Logic Model

Making Sense of SCIENCE: Logic Model

Making Sense of SCIENCE: Logic Model

The Impact Study
i3 Validation grant (2015-2019) to WestEdCluster (school-level) randomized control trial Elementary schools (4th and 5th grades)

Research Questions
Confirmatory research questions:
What is the impact of MSS after two years of implementation on:
1. Teacher content knowledge when compared to study participants in control schools receiving the business-as-usual science PD?
2. 4th and 5th grade students science achievement in Earth and space science and physical science domains
3. 4th and 5th grade students with low incoming achievement on science achievement in Earth and space science and physical science domains
Exploratory research question discussed today
• What is the impact of MSS on teacher attitudes and beliefs, on opportunity to learn, and on school climate?
• To what extent was MSS implemented with fidelity?

Data Collection
•••

Analysis on Impact of Intermediate Outcomes: Methods
• Based on sample of 147 teachers
• Employs a three-level hierarchical linear model (teacher, schools and matched pairs) that regresses each of the 30 intermediate outcomes on an indicator of assignment status and a series of teacher- and school-level covariates.

Unpacking the Logic Model

Unpacking the Logic Model
Reported in HRA’s
implementation report
Science AchievementES = 0.064 (p = .494)
Among lowest third in incoming ELA achievementES = 0.073 (p = .567)
Among lowest third in incoming Math achievementES = 0.220 (p = .099)
TCK ES = .56 (p = .006)
PCKES = .409 (p = .026)

Unpacking the Logic Model
Reported in HRA’s
implementation report
Science AchievementES = 0.064 (p=.494)
Communicating about science in writingES = .116 (p = .177)
ELA state assessmentES = .09 (p = .057)
Math state assessmentES = -.02 (p = .700)
Science state AssessmentES = . 03 (p = .818)
TCK ES = .56 (p = .006)
PCKES = .409 (p = .026)
Teacher attitudes and beliefs?
? ?

Impact on Teacher Attitudes and Beliefs
0.06-0.080.07
NS
0.240.520.08
NS
0.140.010.17
NS
-0.160.41
-0.41 **
0.230.200.21
NS
0.380.430.42
**
NS
0.260.490.16
++ NS
0.250.660.06
* +Confidence in Addressing Student Performance Expectations
Confidence in Science Instructional Practices
Agency in the Classroom
Confidence in Supporting Literacy in Science
Belief That Students Are Capable Learners
Self-efficacy
Philosophically Aligned With NGSS
Values Being a Reflective Practitioner
1.0 1.5 2.0 2.5 3.0 3.5 4.0 4.5 5.0
NonTLTLAll
NonTLTLAll
NonTLTLAll
NonTLTLAll
NonTLTLAll
NonTLTLAll
NonTLTLAll
NonTLTLAll
Average rating
Effect SizeTreatment TL Interaction
Control MSS
*+
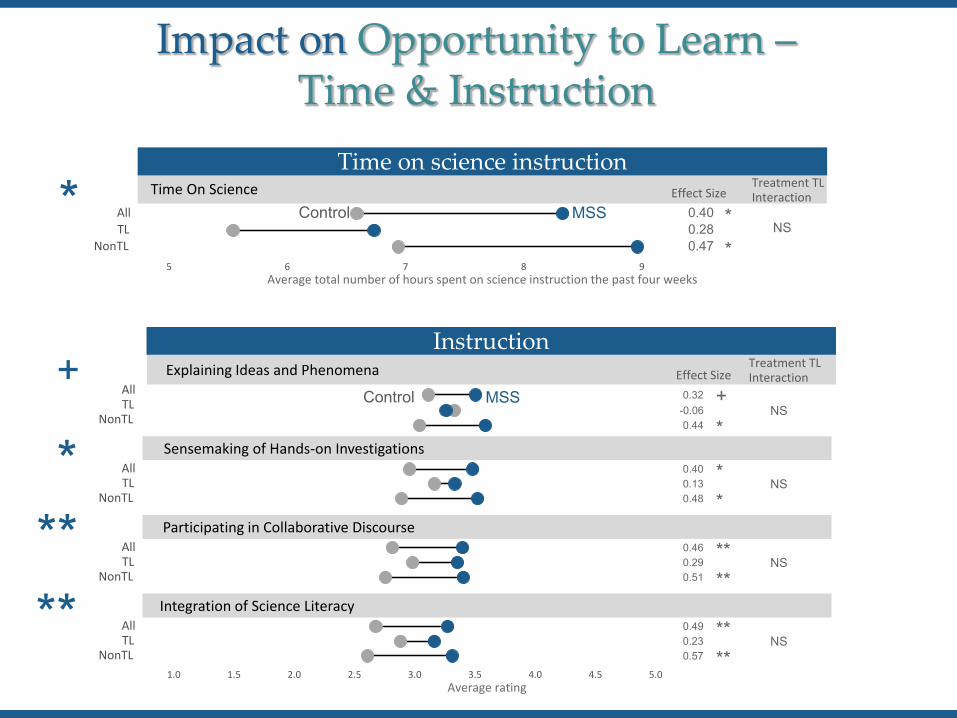
Impact on Opportunity to Learn –Time & Instruction
Instruction
0.400.280.47
*
*NS
Time On Science
5 6 7 8 9
NonTLTLAll
Average total number of hours spent on science instruction the past four weeks
Effect SizeTreatment TL Interaction
Control MSS
0.32-0.060.44
+
*NS
0.400.130.48
**
NS
0.460.290.51
****
NS
0.490.230.57
****
NS
Integration of Science Literacy
Participating in Collaborative Discourse
Sensemaking of Hands-on Investigations
Explaining Ideas and Phenomena
1.0 1.5 2.0 2.5 3.0 3.5 4.0 4.5 5.0
NonTLTLAll
NonTLTLAll
NonTLTLAll
NonTLTLAll
Average rating
Effect SizeTreatment TL Interaction
Control MSS
Time on science instruction
*
**
+
**
*

Impact on Opportunity to Learn –Content (ESS and PS)
-0.070.17
-0.17NS
0.140.150.12
NS
-0.13-0.37-0.06
NS
0.18-0.330.38 + *
0.280.900.03 ** *
0.120.79
-0.14 * *
0.210.300.19
NS
0.160.58
-0.01+ NS
DCI: Waves (PS)
DCI: Motion and Stability - Forces and Interactions (PS)
DCI: Definitions of Energy (PS)
DCI: Conservation of Energy and Energy Transfer (PS)
DCI: Matter and Its Interactions (PS)
DCI: Earths Place in the Universe (ES)
DCI: Earths Systems (ES)
DCI: Earth and Human Activity (ES)
1.5 2.0 2.5 3.0
NonTLTLAll
NonTLTLAll
NonTLTLAll
NonTLTLAll
NonTLTLAll
NonTLTLAll
NonTLTLAll
NonTLTLAll
Average rating
Effect SizeTreatment TL Interaction
Control MSS

Impact on Opportunity to Learn –Content: SEPs and CCCs
0.160.62
-0.03 * +
0.25-0.110.35
NS
Cross-cutting Concepts (CCCs)
Science and Engineering Practices (SEPs)
1.5 2.0 2.5 3.0
NonTLTLAll
NonTLTLAll
Average rating

Impact on intermediate outcomes: Findings for School Climate
0.390.550.32
*+ NS
0.220.250.21
NS
0.301.140.00
+*** **
0.180.630.02
+ +
0.100.330.04
NS
0.04-0.110.12
NS
Trust and Respect Among Teachers
Trust and Respect Between Teachers and Administrators
Prioritizing Support for Teacher Professional Learning in Science
Administrator Support Involving Teachers in Science Leadership
Culture of Peer Collaboration
Supporting Teacher collaboration
1.0 1.5 2.0 2.5 3.0 3.5 4.0 4.5 5.0
NonTLTLAll
NonTLTLAll
NonTLTLAll
NonTLTLAll
NonTLTLAll
NonTLTLAll
Average rating
Effect SizeTreatment TL Interaction
Control MSS*
+

Impact on Intermediate Outcomes: Findings on Amount of Teacher Collaboration
***

Positive Results
Teacher outcomes • Teacher content knowledge • Pedagogical content knowledge based on holistic ratings• Greater sense of Agency In the Classroom
• Greater Confidence In Science Instructional Practices
(marginally significant)
Opportunity to learn • More time on science instruction• Greater emphasis on NGSS-aligned instructional practices
School climate• More collaboration beyond MSS PLCs • Greater support of administrators for teacher collaboration • More involvement by administrators of teachers in science
leadership (marginally significant)
Proximal outcomes
Direct effects of summer PD and PLCs

Null Results
Teacher’s attitudes and beliefs• Self-efficacy • Values being a reflective practitioner• Belief that students are capable learners
School culture • Trust and respect among teachers• Trust and respect between teachers and
administrators• Prioritizing support for teacher PL in science
Student science achievement and communicating about science in writing
Distal outcomes

So what happened? Hypothesis # 1

So what happened? Hypothesis # 2

So what happened? Hypothesis # 2

So what happened? Hypothesis # 3
Percentage of teachers who met the fidelity threshold
2016-17 2017-18 Across the two yearsAttendance at summer courses 94%
(118 of 125)88%
(100 of 114)
54% (100 of 185) of all study teachers
61% (83 of 136) of baseline teachers
Attendance at PLCs 97%
(121 of 125)90%
(103 of 114)
56% (103 of 185) of all study teachers
58% (79 of 136) of baseline teachers

Thank you
Reference this presentation:Jaciw, A. P., Nguyen, T., & Zacamy, J. (2020). Uncovering the
Black Box: Exploratory Mediation Analysis for a Science Teacher
Professional Development Program. Presentation delivered in a virtual symposium on September 9, 2020 for the annual
spring conference of the Society for Research on Educational Effectiveness, Washington, DC. Retrieved from
https://www.empiricaleducation.com/mss/

Context and Pathways to Intended Outcomes
Unpacking the Logic Model
Anne Wolf | Abt AssociatesSeptember 9, 2020Society for Research on Educational Effectiveness

Logic Model as a Tool for Evaluation Design
• Identifies the student outcomes that should be measured – To examine if the intervention works
• To unpack the logic model further– Need a clear understanding of the antecedents,
components, and mechanisms of the model • To explore how the intervention works • For whom and under what conditions
2
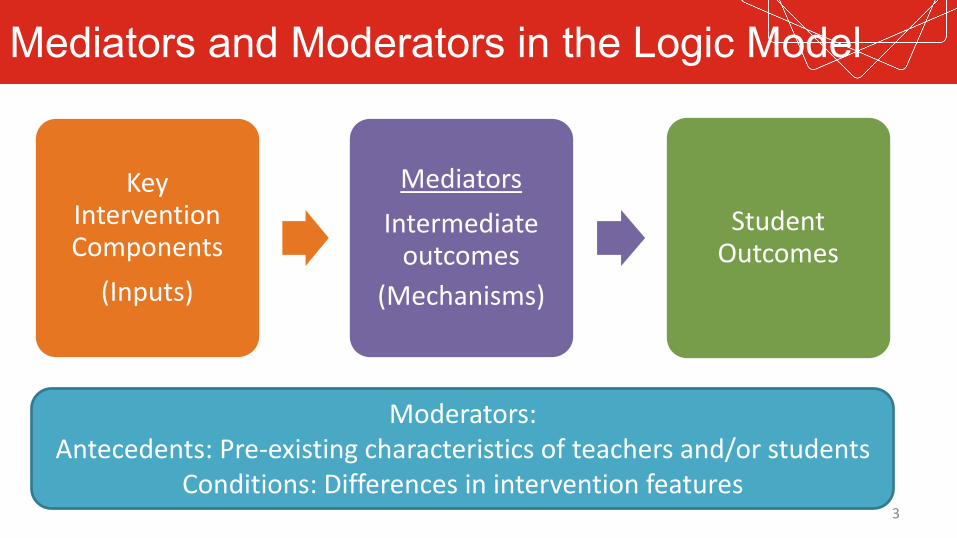
Mediators and Moderators in the Logic Model
Key Intervention Components
(Inputs)
MediatorsIntermediate
outcomes(Mechanisms)
Student Outcomes
3
Moderators: Antecedents: Pre-existing characteristics of teachers and/or students
Conditions: Differences in intervention features
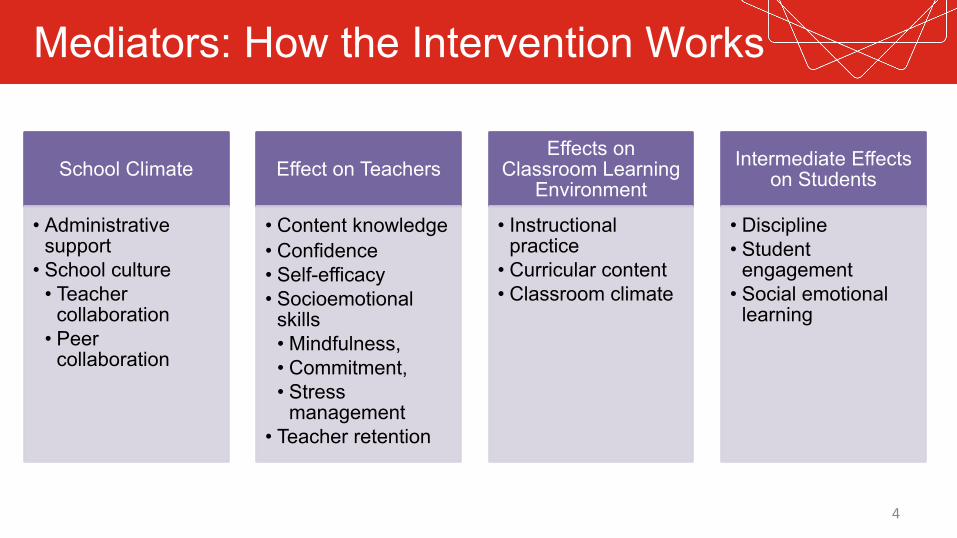
Mediators: How the Intervention Works
School Climate
• Administrative support
• School culture• Teacher
collaboration• Peer
collaboration
Effect on Teachers
• Content knowledge• Confidence• Self-efficacy• Socioemotional
skills• Mindfulness,• Commitment,• Stress
management• Teacher retention
Effects on Classroom Learning
Environment
• Instructional practice
• Curricular content• Classroom climate
Intermediate Effects on Students
• Discipline• Student
engagement• Social emotional
learning
4
Examining Effects on Mediators
• Understanding if there is support for the proposed theory of change
• Examining the pathways toward achieving the targeted student outcomes
5

Challenges of Measuring Mediators
1. Cost– Intermediate outcomes are generally more
expensive to measure than student achievement• Typically: Surveys and observations
2. Despite benefits to field & theory-building– Many intermediate outcomes are not reviewed by
the WWC
6

Challenges of Measuring Mediators (2)
3. Evidence that changes in mediators affect students– Showing changes in mediators is not the full pathway
• CACE, principal score weighting, instrumental variables analysis
4. Absence of substantial changes in mediators– Could be a failure of the theorized pathway– Failure of sufficient dosage of inputs– Measurement problem
7

Moderators: For whom & under what conditions it works
Effects on
Students
Differences between teachers
Differences in implementation
conditions
Differences between students
8
Effects on students based on pre-existing differences
And under what conditions

Exploring Differences in Impacts
• Examining intervention conditions that support effectiveness
• Investigating for whom the intervention works– Guided by hypotheses about why impacts might
differ
9

Challenges
• Many statistical tests, increases Type I error
• Limited power– Impact evaluations usually designed for main effects– Example of MDEs for subgroups
10
Main effect for students (full sample) .15
Students not low-achieving at baseline (larger group) .26Students low-achieving at baseline (smaller group) .31
Minimum detectable difference (MDD) between subgroups .40

Takeaways
• Analysis of mediators and antecedents inform– Refinement of the logic model– Modification of implementation
• to impact intermediate outcomes• to work better for groups with no effect
11

abtassociates.com
Unpacking the Logic Model:Context and Pathways to Intended Outcomes
Anne Wolf, Abt [email protected]