university - times higher education
TRANSCRIPT

UNIVERSITY INDUSTRY COLLABORATIONTHE VITAL ROLE OF TECH COMPANIES’ SUPPORT FOR HIGHER EDUCATION RESEARCH
CONSULTANCY REPORT
NOVEMBER 2020

FOREWORD
03
UNIVERSITY-INDUSTRY COLLABORATION
The crucial role that the world’s universities play in our economies and societies has never been so starkly illustrated as it has been by the covid-19 pandemic.
Our institutions of higher learning and research produce the healthcare workers at the front-line in the fight against the virus; they provide the data, analysis and evidence-based expertise that is shaping effective public policy and driving the world’s response; and our great universities are developing the clinical interventions, tests and ultimately the vaccines that will secure our collective future.
But our universities cannot fulfil their limitless potential without collaboration – collaboration between institutions, with industry, and across borders. In particular, partnerships between universities and industry will be vital as nations seek to re-build their economies after the devastation of the pandemic – re-skilling the workforce and re-booting the knowledge economy.
Flexibility, resilience and openness will be essential if universities are to develop the talent that industry needs to drive economic growth in the fourth industrial revolution. And, crucially, they will need to work in close concert with industry partners to ensure a steady supply of new knowledge and innovation.
Times Higher Education (THE) is delighted to have supported the global university sector for almost 50 years, and that support includes facilitating university-industry collaboration, through our international events, which bring together university leaders with their counterparts in industry and government, and of course through our data, intelligence, analysis and insight.
I am clear that this special research report, from THE’s consultancy team, by offering fresh insights into the dynamic global landscape of joint university-industry research, adds significantly to that support.
Phil BatyCHIEF KNOWLEDGE OFFICERTIMES HIGHER EDUCATION
Partnerships between
universities and industry
will be vital as nations seek to
re-build their economies
after the devastation of the pandemic
CONTENTS
Section 1 Section 3 Section 4Section 2
02
UNIVERSITY-INDUSTRY COLLABORATION

EXECUTIVE SUMMARY
05
UNIVERSITY-INDUSTRY COLLABORATIONEXECUTIVE SUMMARY
04
UNIVERSITY-INDUSTRY COLLABORATION
$36k FROM THE UK, THE UNIVERSITY OF OXFORD REPORTED AN AVERAGE RESEARCH INCOME FROM INDUSTRY OF $57,000 USD PER ACADEMIC STAFF MEMBER.
The median industry research income of the Top 200 WUR ’21 ranked institutions was just over $36,000 USD per member of the academic staff.
The highest grossing institution from the United States, Stanford University, reported an average industry research income of $107,000 USD per academic staff member.
$107,000
5.8%Universities in the Netherlands have the highest proportion of publications with commercial co-authorship, 5.8%.
7.1%In the Netherlands, the highest proportion of commercial collaboration with universities is within the field of Material Science, 7.1%.
$16.2BILLIONIn 2018 Alphabet dedicated $16.2 billion USD to R&D
IN 2019 HUAWEI’S INVESTMENT TO R&D INCREASED FROM $13.6 BILLION USD, TO (APPROX.) $19.5 BILLION USD
1,775In 2019 Microsoft published an estimated total of 1,775 pieces of collaborative academic research globally
Between 2015 and 2019, Philips was the top collaborator in the Netherlands, IBM in Switzerland, Bosch in Germany, Hoffmann-La Roche in France, and Microsoft in the UK.
SECTION 1
07
UNIVERSITY-INDUSTRY COLLABORATION
RESEARCH INCOME FROM INDUSTRY BY RANKINGS POSITION *
* Source: THE World University Rankings 2021** Source: THE World University Rankings 2021 Income data submitted by universities for the rankings have been converted to USD and adjusted for purchase power parity (PPP)
Med
ian
rese
arch
inco
me
from
indu
stry
pe
r aca
dem
ic s
taff
(USD
)
501 -800
401 - 500
301 - 400
201 - 300
Top 200 $36,000
$24,000
$14,000
$9,000
$8,000
$5,000801+
Figure 1
RESEARCH INCOME FROM INDUSTRY OF THE TOP 10 RANKED UNIVERSITIES **
SECTION 1
06
UNIVERSITY-INDUSTRY COLLABORATION
RESEARCH INCOME
FROM INDUSTRY – A COUNTRY
LEVEL OVERVIEW
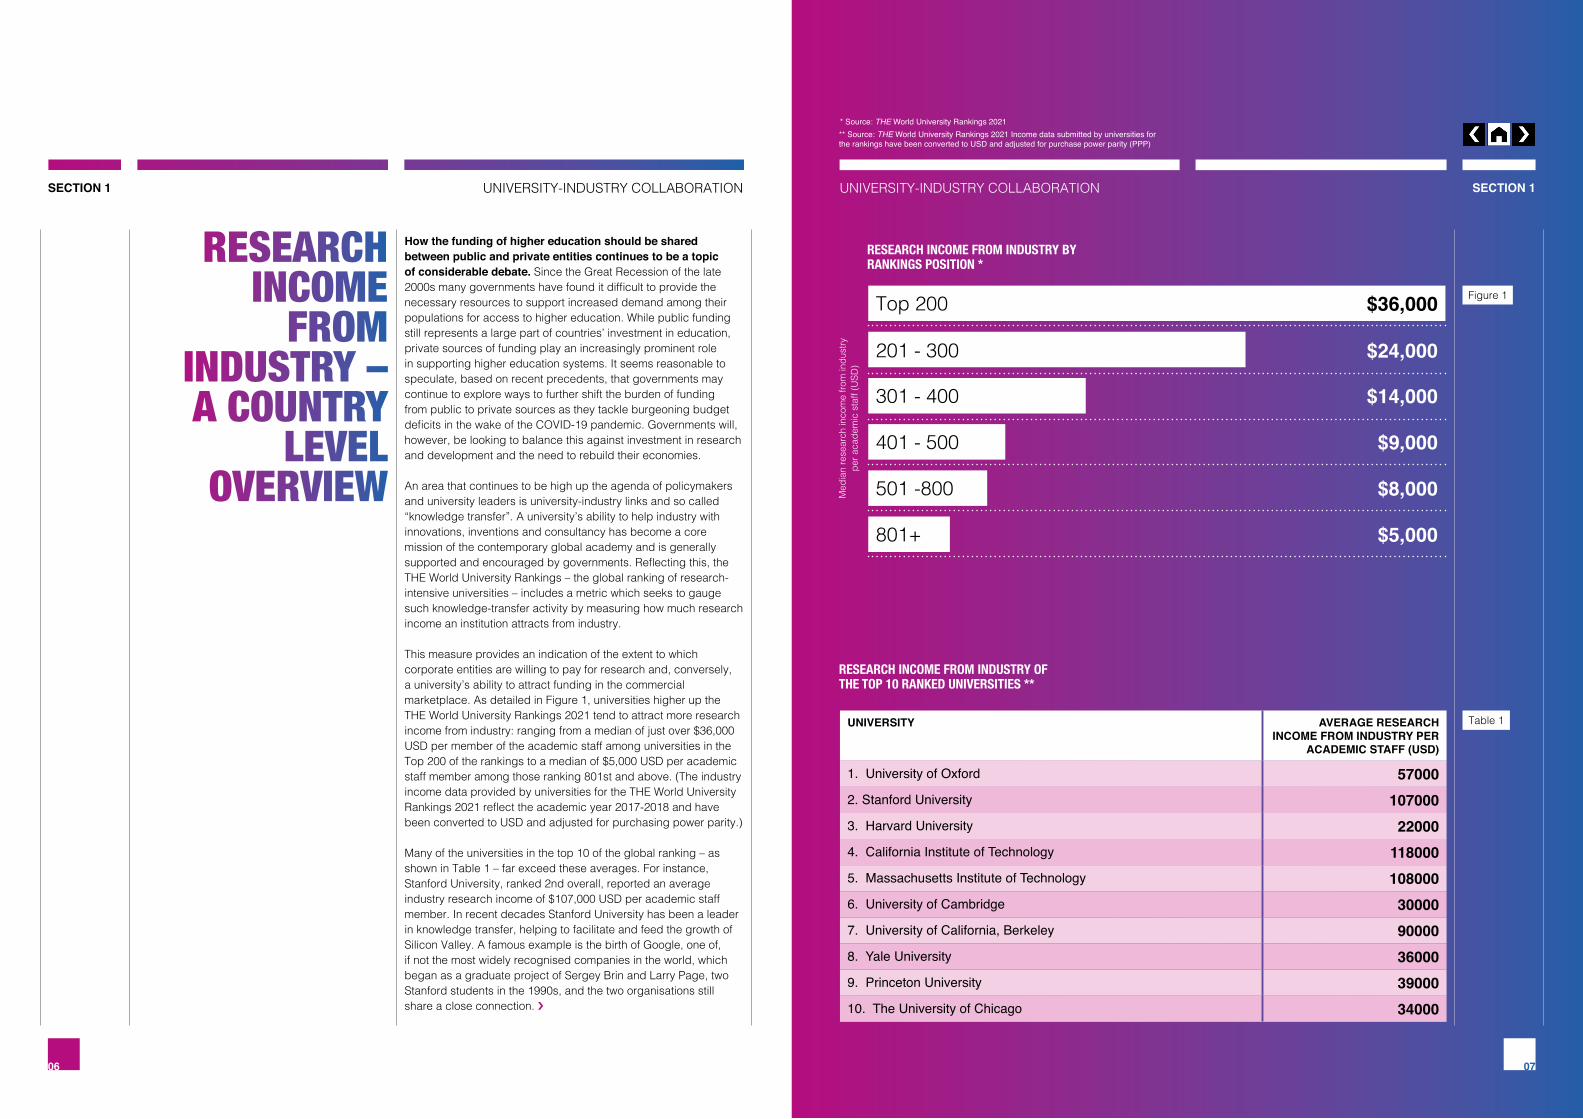
How the funding of higher education should be shared between public and private entities continues to be a topic of considerable debate. Since the Great Recession of the late 2000s many governments have found it difficult to provide the necessary resources to support increased demand among their populations for access to higher education. While public funding still represents a large part of countries’ investment in education, private sources of funding play an increasingly prominent role in supporting higher education systems. It seems reasonable to speculate, based on recent precedents, that governments may continue to explore ways to further shift the burden of funding from public to private sources as they tackle burgeoning budget deficits in the wake of the COVID-19 pandemic. Governments will, however, be looking to balance this against investment in research and development and the need to rebuild their economies.
An area that continues to be high up the agenda of policymakers and university leaders is university-industry links and so called “knowledge transfer”. A university’s ability to help industry with innovations, inventions and consultancy has become a core mission of the contemporary global academy and is generally supported and encouraged by governments. Reflecting this, the THE World University Rankings – the global ranking of research-intensive universities – includes a metric which seeks to gauge such knowledge-transfer activity by measuring how much research income an institution attracts from industry.
This measure provides an indication of the extent to which corporate entities are willing to pay for research and, conversely, a university’s ability to attract funding in the commercial marketplace. As detailed in Figure 1, universities higher up the THE World University Rankings 2021 tend to attract more research income from industry: ranging from a median of just over $36,000 USD per member of the academic staff among universities in the Top 200 of the rankings to a median of $5,000 USD per academic staff member among those ranking 801st and above. (The industry income data provided by universities for the THE World University Rankings 2021 reflect the academic year 2017-2018 and have been converted to USD and adjusted for purchasing power parity.)
Many of the universities in the top 10 of the global ranking – as shown in Table 1 – far exceed these averages. For instance, Stanford University, ranked 2nd overall, reported an average industry research income of $107,000 USD per academic staff member. In recent decades Stanford University has been a leader in knowledge transfer, helping to facilitate and feed the growth of Silicon Valley. A famous example is the birth of Google, one of, if not the most widely recognised companies in the world, which began as a graduate project of Sergey Brin and Larry Page, two Stanford students in the 1990s, and the two organisations still share a close connection. ›
UNIVERSITY AVERAGE RESEARCH INCOME FROM INDUSTRY PER
ACADEMIC STAFF (USD)
1. University of Oxford 570002. Stanford University 1070003. Harvard University 220004. California Institute of Technology 1180005. Massachusetts Institute of Technology 1080006. University of Cambridge 300007. University of California, Berkeley 900008. Yale University 360009. Princeton University 3900010. The University of Chicago 34000
Table 1

SECTION 1
09
UNIVERSITY-INDUSTRY COLLABORATION
RESEARCH INCOME FROM INDUSTRY AND PROPORTION OF TOTAL RESEARCH INCOME IT ACCOUNTS FOR ACROSS SELECTED COUNTRIES **
* Source: THE World University Rankings 2021** THE World University Rankings 2021 Income data submitted by universities for the rankings have been converted to USD and adjusted for purchase power parity (PPP)
HIGHEST RANKED INSTITUTIONS BY COUNTRY *
SECTION 1
08
UNIVERSITY-INDUSTRY COLLABORATION
‹ Two UK institutions break the US stranglehold over the top 10 in the rankings. The University of Oxford, ranked 1st overall, reported an average research income from industry of $57,000 USD per academic staff member and the University of Cambridge, ranked 6th, reported $30,000 USD. Whilst these respective averages are not too dissimilar to the highly ranked US institutions, in general universities in the UK receive less direct research income from industry than their US counterparts. The median industry research income across all 181 US universities included in the THE World University Rankings 2021 was $9400 USD per academic staff member, whereas across the 101 UK universities in the rankings the average was just over $1700 USD per academic staff member.
Not only is the amount of research income from industry higher on average among US universities than those in the UK, it also accounts for a higher proportion of total research income from all sources for US institutions: around 13 percent for US universities compared with 10 percent for those in the UK. Looking beyond the top 10 of the rankings, and placing a particular focus on Europe, the European countries that feature most prominently in the top 200 of the THE World University Rankings 2021 are the UK, Germany, the Netherlands, Switzerland, and France. As shown in Table 2 there is considerable variation in the total number of universities from these five European countries that feature in the top 200 of the THE World University Rankings 2021 (shown alongside the USA as a comparison). The UK and Germany have considerably more universities in the top 200 of the ranking than the Netherlands, Switzerland, and France.
In terms of the average research income from industry, Figure 2 shows quite a varied picture among these countries. Universities from the Netherlands included in the THE World University Rankings 2021 on average attracted the most research income from industry ($64,000 USD per academic staff), followed by Switzerland ($49,000 USD) and Germany ($47,000 USD). These averages, and the proportion of total research income that they account for, are much greater than France ($8,000 USD) and the USA and UK, as reported earlier.
COUNTRY # UNIVERSITIES IN THE TOP 200
HIGHEST RANKED UNIVERSITY
HIGHEST RANK
United States of America 59 Stanford University 2United Kingdom 29 University of Oxford 1Germany 21 LMU Munich 32Netherlands 11 Wageningen University & Research =62Switzerland 7 ETH Zurich 14France 5 Paris Sciences et Lettres – PSL Research University Paris 46
UK
France
USA
Germany
Switzerland
Netherlands $64394
$49426
$46995
$9445
$8157
$1700
24%
23%
26%
13%
19%
10%
Research income from industry
Research income from industry as % of total research income
The University of Oxford, ranked 1st overall, reported an average research income from industry of $57,000 USD per academic staff member
Table 2
Figure 2

SECTION 2
11
UNIVERSITY-INDUSTRY COLLABORATION
* Source: Microsoft Academic Graph** Source: Microsoft Academic Graph
SECTION 2
10
UNIVERSITY-INDUSTRY COLLABORATION
UNIVERSITY LEVEL
COMMERCIAL RESEARCH
COLLABORATION – A DEEP DIVE
Using the research income from industry data from the THE World University Rankings gives us an overall indication of the extent of engagement with industry. However, to further explore this, additional bibliometric analysis using the Microsoft Academic Graph (MAG) was carried out to identify the scale of publications produced with commercial co-authorship. This provides an interesting additional perspective on national level performance.
Analysis of the proportion of academic publications that are produced in collaboration with commercial partners in each of these five European countries shows that, proportionally, universities in the Netherlands had more publications with commercial co-authorship (5.8%) than institutions in the UK or the United States (4.6% and 4.3% in 2019), see Figure 3.
Further analysis of commercial collaboration at subject level in this selection of countries provides additional understanding of where industry is prioritising research expenditure. In the Netherlands and the UK, the highest proportion of commercial collaboration with universities is within the field of Material Science (7.1% and 5.5% respectively, see Table 3). In Switzerland (6.0%), Germany (5.9%) and the United States (6.0%), the largest proportion of commercial research collaboration is in the field of Computer Science, and in France the largest commercial research focus is in subjects allied to Medicine (5.9%).
What is clear from the heat map analysis presented in Table.3, is the significant support for the sciences and engineering, particularly Computer Science and Material Science. This is consistent across the selection of countries included in this analysis.
2015
2015
2015
2015
2015
2015
2016
2016
2016
2016
2016
2016
2017
2017
2017
2017
2017
2017
2018
2018
2018
2018
2018
2018
2019
2019
2019
2019
2019
2019
4.9%
5.4%
4.8%
4.5%
4.2% 4.
5% 4.6%
4.6%
4.6%
4.0%
4.0% 4.1% 4.2% 4.3%
4.7%
4.5% 4.6%
4.6%
5.2%
5.0%
4.8% 5.
1%
5.5%
5.2% 5.3%
5.1%5.
4%
5.3%
5.7% 5.8%
NETHERLANDS FRANCE SWITZERLAND GERMANY UK USA
PERCENTAGE OF PUBLICATIONS WITH COMMERCIAL COLLABORATION, BY COUNTRY *
PERCENTAGE OF PUBLICATIONS WITH COMMERCIAL COLLABORATION, BY SUBJECT **
SUBJECT AREA SWITZERLAND GERMANY FRANCE UK NETHERLANDS USA
Materials science 4.2% 4.0% 5.9% 5.5% 7.1% 4.1%
Engineering 4.6% 4.9% 5.7% 5.1% 5.9% 4.6%
Chemistry 4.9% 3.6% 4.8% 5.3% 5.9% 3.6%
Physics 4.9% 4.2% 5.4% 4.9% 5.9% 4.2%
Biology 5.1% 4.5% 5.5% 5.3% 5.8% 4.0%
Medicine 5.2% 4.8% 5.9% 4.8% 5.5% 3.9%
Computer science 6.0% 5.9% 5.3% 4.6% 5.3% 6.0%
Geology 3.2% 3.5% 5.1% 4.9% 4.8% 3.7%
Mathematics 4.5% 4.6% 3.9% 3.6% 4.6% 4.7%
Environmental science 4.0% 2.9% 4.8% 4.4% 4.0% 3.0%
Geography 3.7% 3.7% 4.7% 3.4% 3.6% 3.2%
Political science 3.4% 4.0% 5.2% 2.5% 3.0% 2.8%
Economics 3.3% 3.4% 3.7% 2.6% 2.9% 2.8%
Business 2.8% 3.3% 2.8% 2.3% 2.8% 2.7%
History 3.6% 2.7% 3.1% 1.8% 2.6% 2.2%
Art 3.2% 3.1% 3.3% 1.7% 2.4% 2.3%
Psychology 2.8% 2.3% 3.5% 2.2% 2.3% 2.1%
Philosophy 2.4% 2.1% 2.5% 1.4% 1.8% 1.9%
Sociology 1.9% 1.6% 1.9% 1.2% 1.1% 1.4%
proportionally, universities in the Netherlands had more publications with commercial co-authorship (5.8%) than institutions in the UK or the United States (4.6% and 4.3% in 2019)
SECTION 2
13
UNIVERSITY-INDUSTRY COLLABORATIONSECTION 2
12
UNIVERSITY-INDUSTRY COLLABORATION
CASE STUDY: EXAMPLES OF RESEARCH PRODUCED BY THE UNIVERSITY OF STUTTGART IN COLLABORATION WITH INDUSTRY
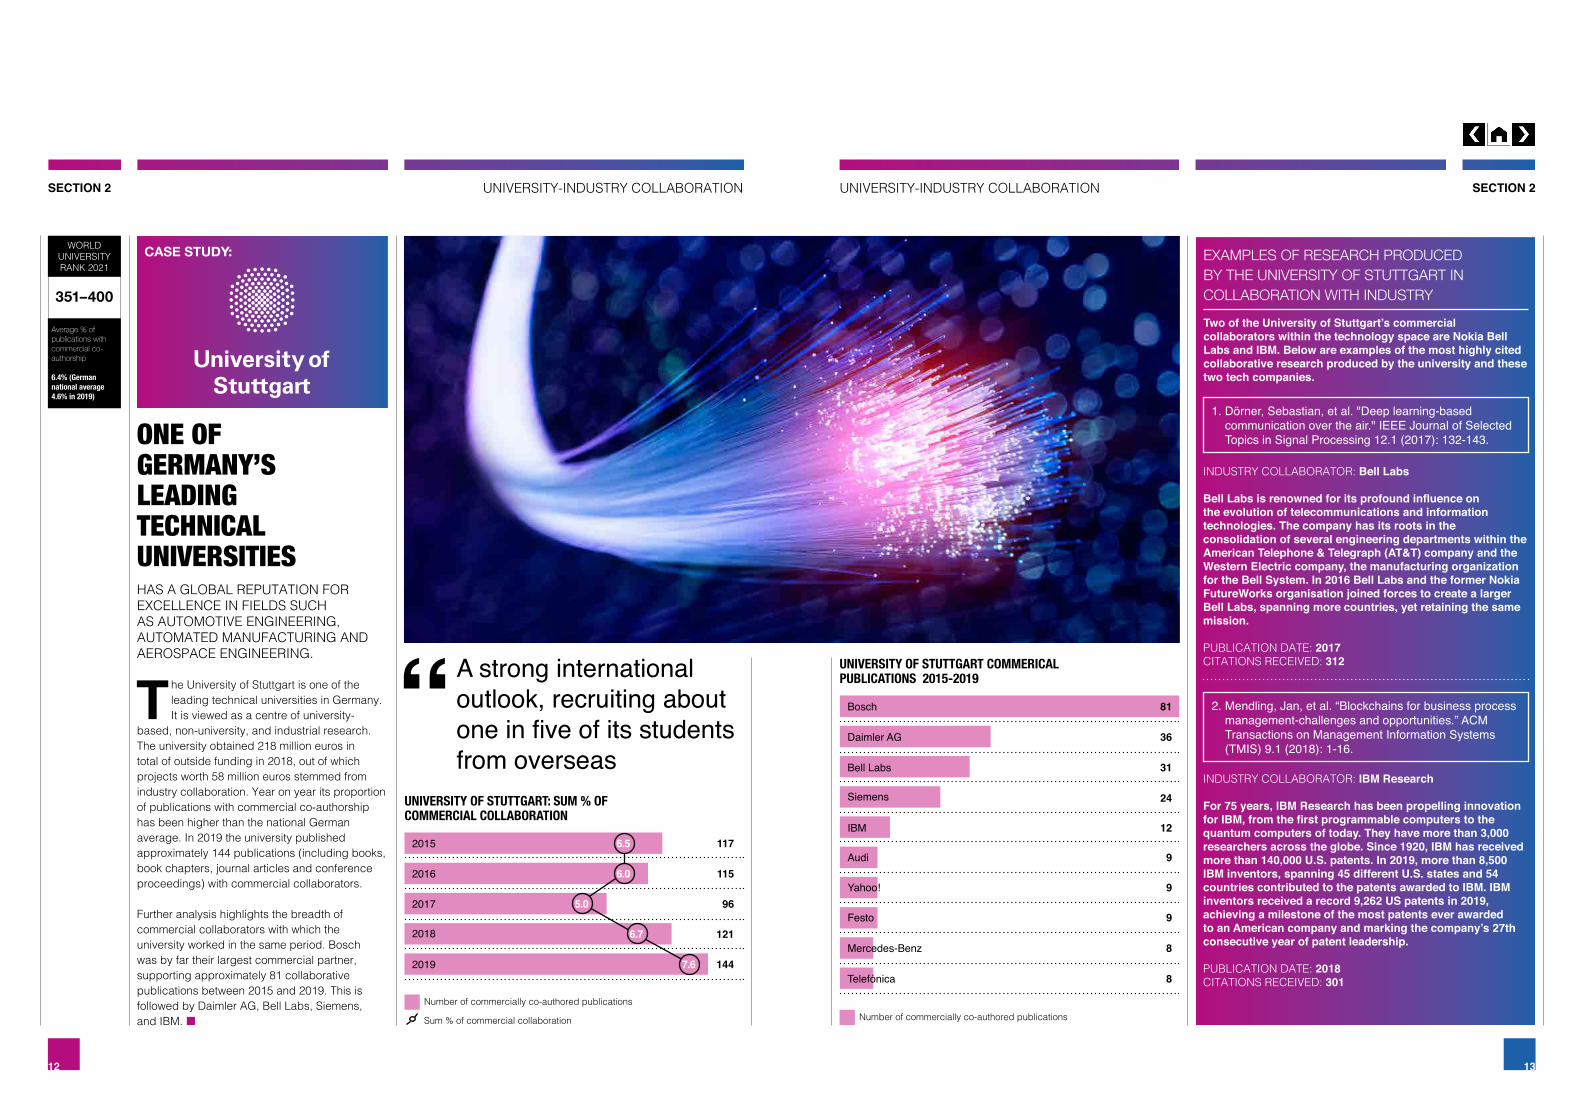
Two of the University of Stuttgart’s commercial collaborators within the technology space are Nokia Bell Labs and IBM. Below are examples of the most highly cited collaborative research produced by the university and these two tech companies.
1. Dörner, Sebastian, et al. "Deep learning-based communication over the air." IEEE Journal of Selected Topics in Signal Processing 12.1 (2017): 132-143.
2. Mendling, Jan, et al. “Blockchains for business process management-challenges and opportunities.” ACM Transactions on Management Information Systems (TMIS) 9.1 (2018): 1-16.
INDUSTRY COLLABORATOR: Bell Labs
Bell Labs is renowned for its profound influence on the evolution of telecommunications and information technologies. The company has its roots in the consolidation of several engineering departments within the American Telephone & Telegraph (AT&T) company and the Western Electric company, the manufacturing organization for the Bell System. In 2016 Bell Labs and the former Nokia FutureWorks organisation joined forces to create a larger Bell Labs, spanning more countries, yet retaining the same mission.
PUBLICATION DATE: 2017 CITATIONS RECEIVED: 312
HAS A GLOBAL REPUTATION FOR EXCELLENCE IN FIELDS SUCH AS AUTOMOTIVE ENGINEERING, AUTOMATED MANUFACTURING AND AEROSPACE ENGINEERING.
ONE OF GERMANY’S LEADING TECHNICAL UNIVERSITIES
T he University of Stuttgart is one of the leading technical universities in Germany. It is viewed as a centre of university-
based, non-university, and industrial research. The university obtained 218 million euros in total of outside funding in 2018, out of which projects worth 58 million euros stemmed from industry collaboration. Year on year its proportion of publications with commercial co-authorship has been higher than the national German average. In 2019 the university published approximately 144 publications (including books, book chapters, journal articles and conference proceedings) with commercial collaborators.
Further analysis highlights the breadth of commercial collaborators with which the university worked in the same period. Bosch was by far their largest commercial partner, supporting approximately 81 collaborative publications between 2015 and 2019. This is followed by Daimler AG, Bell Labs, Siemens, and IBM.
INDUSTRY COLLABORATOR: IBM Research
For 75 years, IBM Research has been propelling innovation for IBM, from the first programmable computers to the quantum computers of today. They have more than 3,000 researchers across the globe. Since 1920, IBM has received more than 140,000 U.S. patents. In 2019, more than 8,500 IBM inventors, spanning 45 different U.S. states and 54 countries contributed to the patents awarded to IBM. IBM inventors received a record 9,262 US patents in 2019, achieving a milestone of the most patents ever awarded to an American company and marking the company’s 27th consecutive year of patent leadership.
PUBLICATION DATE: 2018 CITATIONS RECEIVED: 301
WORLD UNIVERSITY RANK 2021
Average % of publications with commercial co-authorship
6.4% (German national average 4.6% in 2019)
351–400
UNIVERSITY OF STUTTGART COMMERICAL PUBLICATIONS 2015-2019
Bosch
Daimler AG
Bell Labs
Siemens
IBM
Audi
Yahoo!
Festo
Mercedes-Benz
Telefónica
81
36
31
24
12
9
9
9
8
8
UNIVERSITY OF STUTTGART: SUM % OF COMMERCIAL COLLABORATION
2015
2016
2017
2018
2019
117
115
96
121
144
6.5
6.0
5.0
6.7
7.6
Number of commercially co-authored publications
Sum % of commercial collaboration Number of commercially co-authored publications
A strong international outlook, recruiting about one in five of its students from overseas
SECTION 2
15
UNIVERSITY-INDUSTRY COLLABORATIONSECTION 2
14
UNIVERSITY-INDUSTRY COLLABORATION
CASE STUDY: EXAMPLES OF RESEARCH PRODUCED BY CALTECH IN COLLABORATION WITH INDUSTRY
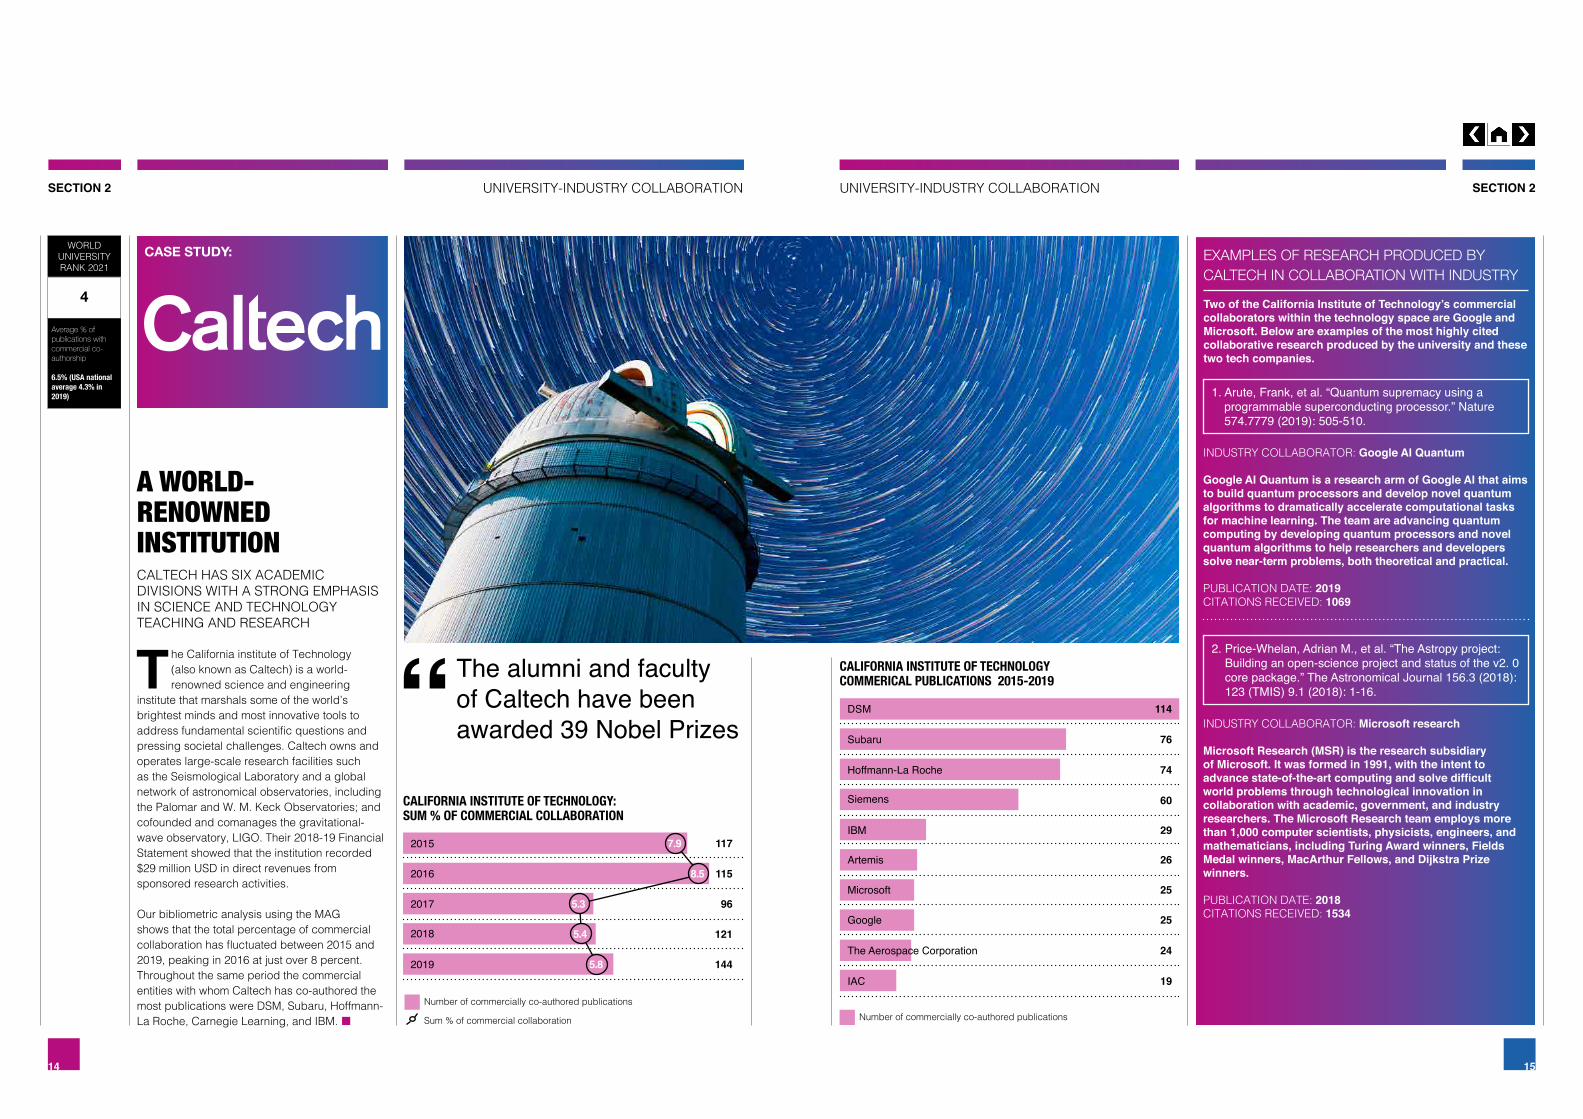
Two of the California Institute of Technology’s commercial collaborators within the technology space are Google and Microsoft. Below are examples of the most highly cited collaborative research produced by the university and these two tech companies.
1. Arute, Frank, et al. “Quantum supremacy using a programmable superconducting processor.” Nature 574.7779 (2019): 505-510.
2. Price-Whelan, Adrian M., et al. “The Astropy project: Building an open-science project and status of the v2. 0 core package.” The Astronomical Journal 156.3 (2018): 123 (TMIS) 9.1 (2018): 1-16.
INDUSTRY COLLABORATOR: Google AI Quantum
Google AI Quantum is a research arm of Google AI that aims to build quantum processors and develop novel quantum algorithms to dramatically accelerate computational tasks for machine learning. The team are advancing quantum computing by developing quantum processors and novel quantum algorithms to help researchers and developers solve near-term problems, both theoretical and practical.
PUBLICATION DATE: 2019 CITATIONS RECEIVED: 1069
CALTECH HAS SIX ACADEMIC DIVISIONS WITH A STRONG EMPHASIS IN SCIENCE AND TECHNOLOGY TEACHING AND RESEARCH
T he California institute of Technology (also known as Caltech) is a world-renowned science and engineering
institute that marshals some of the world’s brightest minds and most innovative tools to address fundamental scientific questions and pressing societal challenges. Caltech owns and operates large-scale research facilities such as the Seismological Laboratory and a global network of astronomical observatories, including the Palomar and W. M. Keck Observatories; and cofounded and comanages the gravitational-wave observatory, LIGO. Their 2018-19 Financial Statement showed that the institution recorded $29 million USD in direct revenues from sponsored research activities.
Our bibliometric analysis using the MAG shows that the total percentage of commercial collaboration has fluctuated between 2015 and 2019, peaking in 2016 at just over 8 percent. Throughout the same period the commercial entities with whom Caltech has co-authored the most publications were DSM, Subaru, Hoffmann-La Roche, Carnegie Learning, and IBM.
INDUSTRY COLLABORATOR: Microsoft research
Microsoft Research (MSR) is the research subsidiary of Microsoft. It was formed in 1991, with the intent to advance state-of-the-art computing and solve difficult world problems through technological innovation in collaboration with academic, government, and industry researchers. The Microsoft Research team employs more than 1,000 computer scientists, physicists, engineers, and mathematicians, including Turing Award winners, Fields Medal winners, MacArthur Fellows, and Dijkstra Prize winners.
PUBLICATION DATE: 2018 CITATIONS RECEIVED: 1534
WORLD UNIVERSITY RANK 2021
Average % of publications with commercial co-authorship
6.5% (USA national average 4.3% in 2019)
4
CALIFORNIA INSTITUTE OF TECHNOLOGY: SUM % OF COMMERCIAL COLLABORATION
2015
2016
2017
2018
2019
117
115
96
121
144
7.9
8.5
5.3
5.4
5.8
CALIFORNIA INSTITUTE OF TECHNOLOGY COMMERICAL PUBLICATIONS 2015-2019
DSM
Subaru
Hoffmann-La Roche
Siemens
IBM
Artemis
Microsoft
The Aerospace Corporation
IAC
114
76
74
60
29
26
25
25
24
19
The alumni and faculty of Caltech have been awarded 39 Nobel Prizes
A WORLD-RENOWNED INSTITUTION
Number of commercially co-authored publications
Sum % of commercial collaboration Number of commercially co-authored publications

SECTION 2
17
UNIVERSITY-INDUSTRY COLLABORATIONSECTION 2
16
UNIVERSITY-INDUSTRY COLLABORATION
CASE STUDY: EXAMPLES OF RESEARCH PRODUCED BY MCMASTER UNIVERSITY IN COLLABORATION WITH INDUSTRY
Two of McMaster University’s commercial collaborators within the technology space are IBM and Huawei. Below are examples of the research produced by the university in collaboration with these two tech companies.
1. Singh, Mohini, et al. “STAT3 pathway regulates lung-derived brain metastasis initiating cell capacity through miR-21 activation.” Oncotarget 6.29 (2015)
2. Zheng, Lina, et al. “Maximising the degrees of freedom of the physical-layer secured relay networks with artificial jamming.” Iet Communications 12.6 (2018)
INDUSTRY COLLABORATOR: IBM
For 75 years, IBM Research has been propelling innovation for IBM, from the first programmable computers to the quantum computers of today. They have more than 3,000 researchers across the globe. Since 1920, IBM has received more than 140,000 U.S. patents. In 2019, more than 8,500 IBM inventors, spanning 45 different U.S. states and 54 countries contributed to the patents awarded to IBM. IBM inventors received a record 9,262 U.S. patents in 2019, achieving a milestone of the most patents ever awarded to a U.S. company and marking the company’s 27th consecutive year of patent leadership.
PUBLICATION DATE: 2015 CITATIONS RECEIVED: 31
MCMASTER HAS A REPUTATION FOR INNOVATION WITH INDUSTRY AND IS CONSISTENTLY RANKED AMONG CANADA’S TOP RESEARCH UNIVERSITIES
CONSISTENTLY RANKED IN THE WORLD’S TOP 100
McMaster University is a public research university in Ontario, Canada. It operates six academic faculties: the
DeGroote School of Business, Engineering, Health Sciences, Humanities, Social Science, and Science. It is a member of the U15, a group of research-intensive universities in Canada. In 2017-18 the university reported a Research Overhead income of $29.7 million CAD, with a total sponsored research income of $391.6 million CAD. Since 2015 the university has had an above the national average sum of percentage commercial collaboration, 8.8 percent in 2019. With a total of 415 publications (including books, book chapters, journal articles and conference proceedings) produced with commercial collaborators in 2019.
McMaster University has a significant focus on medicine and health sciences, which is reflected in their top commercial collaborators between 2015 – 2019. By far their largest commercial collaborator during this period was St Michael’s Hospital, followed by McMaster Carr and Chrysler Group LCC.
INDUSTRY COLLABORATOR: Huawei
Founded in 1987, Huawei is a leading global provider of information and communications technology (ICT) infrastructure and smart devices. They have more than 194,000 employees, and operate in more than 170 countries and regions, serving more than three billion people around the world. Over 96,000 of Huawei’s employees work in R&D, totalling over 49 percent of their workforce. The have over 85,000 active patents as of 31st December 2019. Huawei is one of the world’s largest investors in R&D. Huawei invested $15 billion USD in R&D in 2018 and is scheduled to invest an additional $100 billion USD over the next five years.
PUBLICATION DATE: 2018 CITATIONS RECEIVED: 7
WORLD UNIVERSITY RANK 2021
Average % of publications with commercial co-authorship
8.5% (Canadian national average in 5.9% in 2019)
69
2015
2016
2017
2018
2019
334
333
393
385
415
7.8
7.6
8.8
9.4
8.8
MCMASTER UNIVERSITY COMMERICAL COLLABORATORS 2015-2019
St. Michael’s Hospital
McMaster-Carr
Chrysler Group LLC
Lawson Health Research Institute
St. Joseph Hospital
Ciber
HealthPartners
IBM
Janssen Pharmaceutica
Huawei
109
20
20
14
12
12
11
9
8
6
With students and faculty from well over 90 countries worldwide
MCMASTER UNIVERSITY: SUM % OF COMMERCIAL COLLABORATION
Number of commercially co-authored publications
Sum % of commercial collaboration Number of commercially co-authored publications
SECTION 3
19
UNIVERSITY-INDUSTRY COLLABORATION
* PWC Global Innovation 1000 study ** Source: Microsoft Academic Graph (MAG)
SECTION 3
18
UNIVERSITY-INDUSTRY COLLABORATION
TECH COMPANIES’
CONTRIBUTION TO UNIVERSITY
RESEARCH
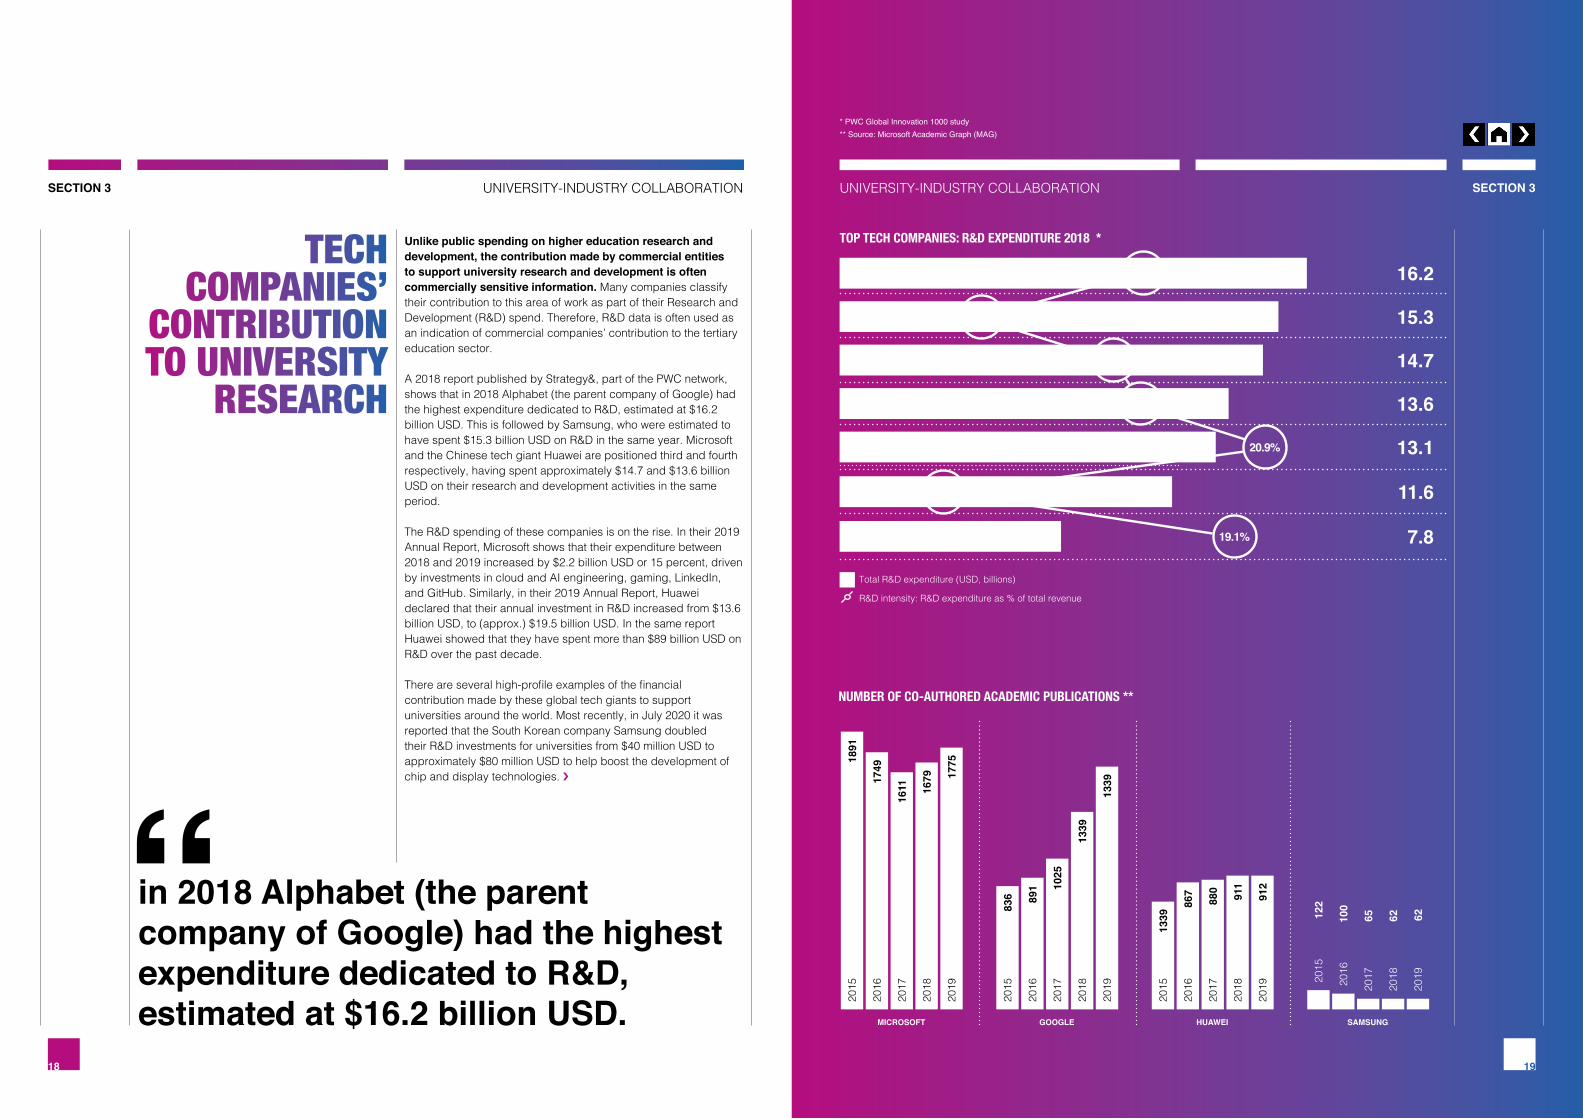
Unlike public spending on higher education research and development, the contribution made by commercial entities to support university research and development is often commercially sensitive information. Many companies classify their contribution to this area of work as part of their Research and Development (R&D) spend. Therefore, R&D data is often used as an indication of commercial companies’ contribution to the tertiary education sector.
A 2018 report published by Strategy&, part of the PWC network, shows that in 2018 Alphabet (the parent company of Google) had the highest expenditure dedicated to R&D, estimated at $16.2 billion USD. This is followed by Samsung, who were estimated to have spent $15.3 billion USD on R&D in the same year. Microsoft and the Chinese tech giant Huawei are positioned third and fourth respectively, having spent approximately $14.7 and $13.6 billion USD on their research and development activities in the same period.
The R&D spending of these companies is on the rise. In their 2019 Annual Report, Microsoft shows that their expenditure between 2018 and 2019 increased by $2.2 billion USD or 15 percent, driven by investments in cloud and AI engineering, gaming, LinkedIn, and GitHub. Similarly, in their 2019 Annual Report, Huawei declared that their annual investment in R&D increased from $13.6 billion USD, to (approx.) $19.5 billion USD. In the same report Huawei showed that they have spent more than $89 billion USD on R&D over the past decade.
There are several high-profile examples of the financial contribution made by these global tech giants to support universities around the world. Most recently, in July 2020 it was reported that the South Korean company Samsung doubled their R&D investments for universities from $40 million USD to approximately $80 million USD to help boost the development of chip and display technologies. ›
in 2018 Alphabet (the parent company of Google) had the highest expenditure dedicated to R&D, estimated at $16.2 billion USD.
TOP TECH COMPANIES: R&D EXPENDITURE 2018 *
Total R&D expenditure (USD, billions)
R&D intensity: R&D expenditure as % of total revenue
ALPHABET
SAMSUNG
MICROSOFT
HUAWEI
INTEL
APPLE
16.2
15.3
14.7
13.6
13.1
11.6
7.8
14.6%
6.8%
13.3%
14.7%
20.9%
5.1%
19.1%
NUMBER OF CO-AUTHORED ACADEMIC PUBLICATIONS **
2015
2015
2015
2016
2016
2016
2017
2017
2017
2018
2018
2018
2019
2019
2019
1891
836
1339
867
880 911
912
891 10
25
1339
133917
49
1611 16
79 1775
MICROSOFT GOOGLE HUAWEI SAMSUNG
122
100
65 62 62
2016
2015
2017
2018
2019

SECTION 3
21
UNIVERSITY-INDUSTRY COLLABORATIONSECTION 3
20
UNIVERSITY-INDUSTRY COLLABORATION
‹ Whilst global tech giants continue to invest vast sums of money in R&D to support higher education institutions’ research innovation, they also work collaboratively to produce quality research outputs.
Our bibliometric analysis conducted using the MAG shows that amongst the tech companies investing the most in R&D, (Microsoft, Google, Huawei and Samsung) Microsoft has published the largest volume of academic papers in which it is listed as a co-author. Although this number has fluctuated over the period analysed (2015 – 2019), in 2019 Microsoft published an estimated total of 1,775 pieces of collaborative academic research globally. This was followed by Google (1,653), Huawei (912) and Samsung (62).
Further analysis of commercial collaboration in each of the European countries selected for analysis shows a variety of companies investing in each nation. Our MAG analysis has shown that between 2015 and 2019, Philips is the top collaborator in the Netherlands, IBM in Switzerland, Bosch in Germany, Hoffmann-La Roche in France, and Microsoft in the UK.
amongst the tech companies investing the most in R&D, (Microsoft, Google, Huawei and Samsung) Microsoft has published the largest volume of academic papers in which it is listed as a co-author
* Source: Microsoft Academic Graph
NETHERLANDSPhilips 219IBM 111Microsoft 83NXP Semiconductors 78Google 56
SWITZERLANDIBM 168Microsoft 104DSM 79Google 59Hoffmann-La Roche 38
GERMANYBosch 497Siemens 481IBM 283Daimler AG 232Huawei 224
FRANCEHoffmann-La Roche 176STMicroelectronics 159IBM 125DSM 105SIDI 94
UKMicrosoft 522IBM 405Google 298Huawei 253Intel 142
TOP COMMERCIAL COLLABORATORS IN SELECTED EUROPEAN COUNTRIES (NUMBER OF CO-AUTHORED PUBLICATIONS)

SECTION 3
22
UNIVERSITY-INDUSTRY COLLABORATION
CASE STUDY: CASE STUDY:
Microsoft published over 7900 co-authored academic publications between 2015 and 2019. In the same period, they collaborated with over 2400 universities globally, the largest proportion in Europe (over 900), followed by North America (over 670) and East Asia (over 600). It is estimated that Microsoft has collaborated with over 200 institutions within China, to co-author over 1,600 publications.
In 2015 the University of Washington announced a new joint institute with China’s Tsinghua University, supported by $40 million USD in funding from Microsoft. Named the Global Innovation Exchange, the organisation assembled a network of leading universities and cross-sector partners committed to experiential learning and technological innovation in a global context. Today it has campuses in the Steve Ballmer Building in the greater Seattle region, and Tsinghua University, located in Beijing, China. Microsoft and Tsinghua University continue to have a prosperous collaborative relationship and continue to co-author research.
Microsoft has invested more than $1 billion USD in R&D in China over the past decade and grown its commitment there in other ways. Microsoft Research Asia has incubated several new groups, including the Microsoft Advanced Technology Centre (ATC), the Microsoft Search Technology Centre, and the Microsoft Tools and Server Business (Microsoft China Cloud and Artificial Intelligence) Division.
Samsung published over 800 co-authored academic publications between 2015 and 2019. The company has collaborated with over 1,400 universities globally during the same period. The largest proportion of academic collaborators is in East Asia (over 540), followed by Europe (over 430) and North America (over 380). It is estimated that Samsung has collaborated with over 300 institutions in the United States, to co-author over 1,500 publications.
In 2013 Samsung announced investment of $100 million USD in research projects centred around their Samsung Strategy and Innovation Centre, located in close proximity to Stanford University. Samsung continues to have strong connections with the university via the Samsung Catalyst Fund, including: their AI Fund start-up initiator, that aims to build transformative AI companies from the ground up; and Samsung Uventure supporting students who receive an offer to join Samsung as a 2021 summer intern and a $1,000 cash prize. During their internships, students work on their idea with support from a mentor and access to Samsung’s R&D resources.
Samsung and Stanford continue to have a prosperous collaborative relationship and continue to co-author research.
Microsoft - Tsinghua University co-authored publication
Jifeng, et al. “R-fcn: Object detection via region-based fully convolutional networks.” Advances in neural information processing systems. 2016.
COLLABORATORS: Microsoft Research, United States Tsinghua University, China
CITATIONS RECEIVED: 3,046
Samsung – Stanford co-authored publication
Liu, Wei, et al. “Flexible and stretchable energy storage: recent advances and future perspectives.” Advanced materials 29.1 (2017): 1603436.
COLLABORATORS: Department of Materials Science and
Engineering, Stanford University, United States
Samsung Advanced Institute of Technology, Samsung Electronics, South Korea
Stanford Institute for Materials and Energy Sciences, United States
CITATIONS RECEIVED:683
SECTION 3
23
UNIVERSITY-INDUSTRY COLLABORATION
Main entrance of the famous and prestigious Tsinghua University
Stanford University Hoover

SECTION 3
24
UNIVERSITY-INDUSTRY COLLABORATION
CASE STUDY:
CASE STUDY:
The origins of Alphabet (Google) are embedded in academia. Beginning as a graduate project of two Stanford University students, Sergey Brin and Larry Page, the company has grown to be one of the most widely recognised in the world.
Google published over 5,000 co-authored academic publications between 2015 and 2019. Whilst Google retains a strong, close relationship with Stanford University, its collaborations span the globe. Over the same period, it collaborated with academics from approximately 1,700 institutions across the world, mostly in North America (just under 4,000 publications involving over 600 institutions), followed by Europe (just under 1,500 publications involving 624 collaborating institutions).
Google’s funding of external research projects with universities covers topics such as machine learning, quantum computing, virtual reality, robotics, and bioscience. In 2018, as part of a £5.5 million initiative funded by the Engineering and Physical Sciences Research Council (EPSRC), Google partnered with University College London (UCL) and the University of Bristol to study and develop quantum software for modelling and simulation, and its work will help develop the foundation of a quantum software industry in the UK.
UCL has also collaborated with Google to contribute to the earlier global detection of influenza outbreaks through the Google Flu Trends service which uses flu‐related search queries to map flu activity in near real‐time. The collaboration aims to develop the models used for estimating flu and support a more accurate picture of influenza-like illnesses in the UK.
Outside of typical research partnerships with universities, Google typically engages with academics through unrestricted research grants, either with graduate students or postdocs at the start of their career through its Faculty Research Awards programme, or with more senior researchers with whom Google has developed a relationship through its Focused Research Awards. The company also proactively engages leaders in particular fields of interest to develop lasting relationships.
Huawei was listed as an institutional co-author in over 3,200 academic publications between 2015 and 2019. Huawei has collaborated with just over 1,000 institutions over that period. The largest proportion of its academic collaborators was in the Asia Pacific region (just under 400), over half of them being in China. This is followed by Europe (over 1,000 publications with almost 400 collaborating institutions), and North America (900 publications with 240 collaborating institutions).
In 2015 Huawei launched its European Research Institute (ERI), based in Belgium, which manages the company’s array of R&D facilities in Europe. This includes, for example, Huawei’s joint research into future mobile networks and the implementation of a 5G testbed at the University of Surrey’s 5G Innovation Centre in the UK in which Huawei has invested £5 million, as well as collaborative research on the future network with The Technical University of Munich (TUM), Germany.
Another university with which Huawei has developed close links is Aalto University, Finland. Researchers from the Department of Communications and Networking at Aalto University together with Huawei Technologies Finland, have built a 5G Ultra Dense Network testbed to develop ways of bringing high-data-rate services to moving cars and buses.
Google – UCL co-authored publication
Lampos, Miller, Crossan and Stefansen. “Advances in nowcasting influenza-like illness rates using search query logs.” Sci Rep 5, 12760 (2015).
COLLABORATORS: Department of Computer Science,
University College London, United Kingdom
School of Engineering and Applied Sciences, Harvard University, United States
Google, Flu Trends Team
CITATIONS RECEIVED: 58
Huawei – Aalto University co-authored publication
Taleb, Tarik, et al. “On multi-access edge computing: A survey of the emerging 5G network edge cloud architecture and orchestration.” IEEE Communications Surveys & Tutorials, 19.3 (2017).
COLLABORATORS: Aalto University, Finland Sejong University, South Korea Huawei European Research Centre,
Germany Nokia Bell Labs, Finland Intel, Germany
CITATIONS RECEIVED: 438
SECTION 3
25
UNIVERSITY-INDUSTRY COLLABORATION
University College London main building
Aerial view of the brand new Aalto university campus

SECTION 4
26
UNIVERSITY-INDUSTRY COLLABORATION
THE VITAL ROLE OF TECH
COMPANIES’ SUPPORT
FOR HIGHER EDUCATION RESEARCH
Throughout the world private sources of funding play an increasingly prominent role in funding higher education. This is reflected in THE’s World University Rankings metric which seeks to gauge such knowledge-transfer activity by measuring how much research income an institution attracts from industry. Although this is a global trend, universities in the United States, for example Stanford University reporting an average industry research income of $107,000 USD per academic staff member, dominate the field.
However, at a national level, universities from the Netherlands on average attracted the most research income from industry ($64,000 USD per academic staff) and produce more publications with commercial co-authorship (5.8%) than institutions in the other countries analysed. Comparative analysis of the proportion of commercial collaboration at university level shows universities in the Netherlands have the highest proportion, followed by their French, Swiss, German, British and American counterparts. Within these countries, industry collaborators are focusing their investment on subjects allied to Material Science, Engineering, Chemistry, Physics, Computer Science and Medicine.
The investment from global industry, particularly international tech companies, in R&D is significant and continues to grow. The financial outlay on R&D from these tech companies, such as Microsoft, Google, Huawei, and Samsung, provides a proxy to understand their year on year commitment to supporting university level R&D. Further evidence of their commitment to supporting innovation at this level is the volume of co-authorship and the scale of research publication. In all instances this collaborative commitment transcends national boundaries and, in many cases, involves institutional and commercial partners that span the globe. Our investigation has also highlighted the longevity of commitment from global tech giants to the provision of support for university level research.
The longer-term economic landscape facing global higher education will become clearer as the genuine impact of the pandemic is understood. Governments face unprecedented demands to secure public health and prevent monumental levels of unemployment. University industry collaboration has significant benefits for both university and commercial partners. Alliances of this nature help to ensure that high rates of research innovation are maintained, in support of societal progress. Barriers limiting the positive impact of university-industry collaboration, including political decision making, should be minimised. It is very clear that the type of university-industry collaboration that our analysis has exposed – not simply financial, but collaborative in the completion of ground breaking research – will be vital to ensure our world class universities continue to thrive.
CONTACTS
27
UNIVERSITY-INDUSTRY COLLABORATION
THE Consultancy provides strategic, data-driven guidance to universities, governments and organisations working with the higher education sector globally. Building on our vast sector expertise and long history, we support our partners to build effective and sustainable strategies aligned to their unique mission.
Understanding that all organisations are unique, we combine proprietary and primary data to design customised solutions. Our consultancy practice harnesses THE’s strong network in the sector, combining engagement of global stakeholders within our analyses.
Elizabeth Shepherd, Managing Director, THE Consultancy services
Mark Tweddle, Senior Higher Education Consultant
