university research and the location of business r&d - ifs
TRANSCRIPT

UNIVERSITY RESEARCH AND THE LOCATION OF BUSINESS R&D
Laura AbramovskyRupert Harrison
Helen Simpson
THE INSTITUTE FOR FISCAL STUDIESWP07/02

University Research and the Location of Business R&D
Laura Abramovsky*
Rupert Harrison*
Helen Simpson†
August 2006
Forthcoming in The Economic Journal
Abstract We investigate the relationship between the location of private sector R&D labs and university research departments in Great Britain. We combine establishment-level data on R&D activity with information on levels and changes in research quality from the Research Assessment Exercise. The strongest evidence for co-location is for pharmaceuticals R&D, which is disproportionately located near to relevant university research, particularly 5 or 5* rated chemistry departments. This relationship is stronger for foreign-owned labs, consistent with multinationals sourcing technology internationally. We also find some evidence for co-location with lower rated research departments in industries such as machinery and communications equipment.
Keywords: Innovation; Geography; Spillovers; Public Research
JEL classification: O3; R11; R13; I23
Acknowledgements: We would like to thank two anonymous referees and seminar participants at the University of Oxford and the 2006 RES conference for helpful comments, and the Gatsby Charitable Foundation, the ESRC Centre for the Microeconomic Analysis of Public Policy at the IFS, and AIM for financial support for this research. This work contains statistical data from ONS, which is Crown copyright and reproduced with the permission of the controller of HMSO and Queen’s Printer for Scotland. The use of the ONS statistical data in this work does not imply the endorsement of the ONS in relation to the interpretation or analysis of the statistical data. All errors are the responsibility of the authors.
Correspondence: [email protected] (corresponding author), [email protected]
* IFS and University College London; † IFS and Nuffield College, University of Oxford

Executive Summary
This paper provides the first comprehensive evidence on the extent to which business-
sector R&D activity is located in the vicinity of high quality university research
departments in Great Britain. We exploit rich data on R&D activity in specific product
groups at the establishment level, together with novel measures of the presence and quality
of university research in relevant subject areas from the Research Assessment Exercise
(RAE), at a fine level of geographic disaggregation. The findings shed new light on the
links between public research and business R&D and the role of geographic proximity in
public-private sector interactions, which are topical policy issues in the UK and elsewhere.
The strongest evidence for co-location is for pharmaceuticals R&D, which is
disproportionately located near to relevant university research, particularly high quality
chemistry departments. This relationship is stronger for foreign-owned labs, consistent with
multinationals sourcing technology internationally and confirming the importance of
world-class centres of research for attracting increasingly footloose R&D investment. We
also find some evidence for co-location with lower quality rated research departments in
industries such as machinery and communications equipment, which raises the possibility
that firms may benefit both from proximity to frontier basic university research and from
more applied public sector research activity. The latter may be measured as low quality
research for the purposes of the RAE and funding allocations, but our results suggest that it
may play a role in some areas of technology transfer and even in attracting foreign-owned
R&D investment. However, without further supporting evidence on the underlying
economic mechanisms at work, it is difficult to make specific policy recommendations
based on these results.

1 Introduction
This paper provides the first comprehensive evidence on the extent to which business-
sector R&D activity is located in the vicinity of high quality university research
departments in Great Britain. We exploit rich data on R&D activity in specific product
groups at the establishment level, together with novel measures of the presence and quality
of university research in relevant subject areas at a fine level of geographic disaggregation.
The findings shed new light on the links between public research and business R&D and
the role of geographic proximity in public-private sector interactions, which are topical
policy issues in the UK and elsewhere.
Our empirical approach relates the location pattern of private sector R&D establishments to
the presence of nearby relevant university research departments. We use data from the UK
Research Assessment Exercise (RAE) to separate research departments into those rated 5
or 5* by the RAE, which are deemed to perform world-class cutting edge research, and
those rated 4 or below. Figures 1 and 2 illustrate graphically the basic relationship
underlying our empirical strategy. Figure 1 shows the population distribution of R&D-
performing establishments for the six product groups we consider across UK postcode
areas in 2003, while Figure 2 shows the equivalent distribution of 5 and 5* university
departments assigned as relevant for those product groups, using information from the 2001
RAE.1 Postcode areas with higher numbers of R&D-performing establishments in Figure 1
or 5 and 5* relevant departments in Figure 2 are represented by darker shaded areas.
Comparison of Figures 1 and 2 shows a clear positive correlation between the location of
R&D-performing establishments in 2003 and the presence of high quality relevant
university research departments.
[Figures 1 and 2 here]
The correlation displayed in Figures 1 and 2 is not sufficient to infer any causal relationship
between the location of high quality university research and the distribution of business
R&D. In our empirical results we use a number of strategies in an attempt to separately
identify the impact of university research from other observed and unobserved
heterogeneity across locations. First, in the cross section we include controls for a range of
other observable factors which may influence the location of business R&D, including
measures of the agglomeration of economic activity, the skills of the local labour force, and
the location of science parks. Second, we relate the entry pattern of R&D-performing
establishments over 2001-2003 to the change in the presence and quality of university
research departments between the 1996 and 2001 RAEs. This should control for
unobserved heterogeneity across locations that is correlated with the level of university
research quality.
We find evidence for co-location of business R&D and university research departments
that is robust to controlling for various sources of observed and unobserved heterogeneity.
Our most consistent evidence is for the pharmaceuticals industry, where we find a positive
and significant relationship between the location of private sector R&D establishments and
both lower and high-quality chemistry departments. This relationship is strongest with
respect to departments rated 5 or 5*, and is even stronger when we restrict the analysis to
foreign-owned R&D establishments which are likely to be highly geographically mobile. In
the chemicals industry (excluding pharmaceuticals) we find a robust significant effect of
the presence of materials science departments rated 5 or 5*, while in industries such as
machinery and communications equipment we also find some evidence for co-location near
to relevant departments rated 4 or below.
What economic mechanisms might drive the co-location of business R&D and relevant
public sector research? Survey-based empirical evidence shows that the research base is an
important source of knowledge for businesses.2 There are a number of routes through
which university research might generate beneficial knowledge spillovers. Geographic
proximity is likely to be crucial if the primary mechanism through which such knowledge
is transferred is through direct personal interactions. However, if the main mechanism is
through codified knowledge such as journal publications then geographic proximity may be
less relevant. As well as pure spillovers, knowledge may also be transferred through formal
collaboration agreements, spin-out companies or consultancy. In addition to providing
information, university research departments may also support business R&D through the
supply of trained post-graduate research scientists.
In the context of these different ways in which businesses may benefit from proximity to
the public research base, the co-location of business R&D and relevant research
departments raises potentially interesting implications for policy, particularly for the
evaluation and funding of university research. However, without further information on the
exact mechanisms at work it is difficult to make specific policy recommendations. In each
of the examples described above there is varying potential for market failures, and the
implications for the direction of public funding and the design of incentives for scientists
and university administrators may be different. The routes through which university
research is transferred to businesses, and the ways in which university and private sector
scientists work together, may also differ across industries, and may depend on the nature of
the research being undertaken, for example whether it is basic or applied. Our results thus
provide a useful input into the policy process, but should not be taken in isolation as
supporting a particular direction of policy in this area.
This paper is part of an extensive empirical literature on innovation and location that
studies the existence of geographically mediated spillovers and considers location as a
determinant of innovative activity. The literature that investigates the effects of university

research on business innovation activity is particularly relevant to our research.3 For
example, Jaffe (1989) looked at the existence of spillovers from university research to
commercial innovation using state-level time-series data on firms’ patenting activity,
industrial R&D expenditure and university R&D expenditure for the US. He finds a
significant direct effect of university research on corporate patents in some specific
research areas, and an indirect effect on the local production of corporate patents by
fostering industrial R&D spending. These results indicate that knowledge spillovers
increase with geographic proximity and hence that innovative activity might be expected to
be more concentrated in areas where knowledge inputs such as the scale or quality of
university research are higher. Harhoff (1999) investigates the relationship between entry
and regional employment structure. He finds a positive relationship between new firm
formation in high-tech sectors and the presence of university and other research scientists
in a location.
The fact that our strongest results are for pharmaceuticals is also consistent with findings
elsewhere in the literature. For example, Branstetter and Ogura (2005) examine the large
increase in the propensity of patents in the US to cite academic science over the 1990s.
They find that the nature of inventive activity changed over the period, with an increased
emphasis on the use of knowledge created in universities. However, they also find that
citations to academic science are heavily concentrated in bioscience-related innovations.
The remainder of the paper is structured as follows. The next section provides some
information on recent policy developments in the UK. Section 3 provides a description of
the data. Section 4 discusses our empirical strategy and shows our main results and section
5 concludes.

2 Policy Background
The UK government has recently commissioned two reviews into innovation policy: the
Lambert Review of Business–University Collaboration (2003) and the Department of
Trade and Industry (DTI) Innovation Report (2003). Both stressed the importance of the
interaction between research institutions and businesses and the role of geographic
innovative clusters in improving the UK’s innovation performance. The Lambert Review
investigated specifically the extent and benefits of collaboration between businesses and
university research departments and stressed the importance of proximity to universities for
firms to access to research ideas. The final report made a number of recommendations
aimed at both universities and business, including recommendations for greater government
support for collaborative activities through DTI schemes such as LINK and Knowledge
Transfer Partnerships. The economic rationale for such schemes usually appeals to the
presence of spillovers and/or coordination failures that would result in a sub-optimal level
of collaboration activity and knowledge transfer in the absence of intervention. The report
also made recommendations for the way the funding system for research should operate to
enhance transfer knowledge from universities to businesses.
Public funding for research in Higher Education institutions in Great Britain is
administered under a dual support system. In this system the Higher Education Funding
Councils (HEFC) provide block grant funding to support research infrastructure and enable
institutions to undertake ground-breaking research.4 The HEFC funding constitutes the first
stream of funding for universities, most of which is allocated according to past research
performance determined by the Research Assessment Exercise. Top rated departments
receive a funding weight over three times higher than lower quality research departments.5
The definition of research for the purpose of the RAE includes work of direct relevance to
the needs of commerce and industry. However, there are concerns that in practice the

assessment panels that determine the quality of the research tend to rely on more academic
benchmarks, such as output in important journals, than world-class research in
collaboration with businesses.6 One of the recent initiatives to increase the diffusion of
research findings from universities into the economy has been the introduction of the
Higher Education Innovation Fund (HEIF), which supports Higher Education institutions in
knowledge transfer activities with business, public sector organisations and the wider
community. However, its contribution to university funding is modest compared to the
HEFC financial support.
3 Data and Descriptive Statistics
2.1 Business Sector R&D Activity
We use the Office for National Statistics (ONS) establishment-level UK Business
Enterprise Research and Development (BERD) data, for the period 2000-2003, to construct
measures of business sector R&D activity. The establishment-level BERD data provide
information on the population of establishments performing intramural R&D in Great
Britain. Each establishment’s full postcode, industry and ownership status are registered.7
The ONS collects more detailed information about R&D expenditure at the establishment
level by surveying a sample of establishments drawn from this population. The sample
includes a census of large R&D-performing establishments and a stratified sample of the
remainder of the population. Large R&D-doers answer detailed questions on the type of
R&D carried out (e.g. intramural, extramural, basic, applied or experimental), broken down
by the product group for which the R&D is being carried out, for example
pharmaceuticals.8 The rest of the sample receives a less detailed shorter form to report on
total R&D expenditure and employment.

Because not all establishments are surveyed each year, in our analysis we rely mainly on
basic information available for the whole population of R&D-doers rather than on the more
detailed information on the precise type of R&D conducted, which is only reported by large
R&D-performing establishments.9 We use information on the location of the population of
establishments carrying out intramural R&D and information on ownership status to
investigate where foreign-owned firms are carrying out R&D within Great Britain. We use
one additional piece of information that is not reported for all establishments - the product
group for which R&D is being conducted - which we discuss further below.
Using the population information we construct measures of the presence of business sector
R&D activity at the postcode area level, defined by the first two letters of the full postcode,
for example “BS” for Bristol. We aggregate all establishments located in central London
(E, EC, N, NW, S, SW, W, WC) into a single postcode area.10 This gives us 111 postcode
areas. We use postcode areas as the unit of observation because they are constructed around
centres of economic activity (around cities and towns) rather than on administrative
grounds. This is not the case for the central London postcodes and hence we aggregate
these areas. Some postcode areas are dominated by large cities and agglomerations of
economic activity, and so we pay careful attention in the empirical results to controlling for
a range of other factors that may determine the concentration of R&D establishments in a
particular postcode area.
We investigate the location of R&D activity related to different product groups separately.
We construct two measures for each postcode area for each product group. First, our main
measure is a count measure of the average number of establishments carrying out
intramural R&D expenditure over the period 2000 to 2003, and second a count of the total
number of greenfield entrants carrying out intramural R&D over the three years 2001 to
2003.11 We focus on six product groups that account for 54% of total intramural R&D in

2003: pharmaceuticals; chemicals; machinery; electrical machinery; TV, radio and
communication equipment; and motor vehicles.
Product group information is not collected for smaller, sampled R&D-performing
establishments and for non-sampled establishments. However, each company’s Standard
Industrial Classification (SIC) code is known and the ONS assumes that R&D expenditure
is for the product group corresponding to that SIC category. For example, R&D being
carried out in a small firm that operates in the chemicals industry will be assigned to the
chemicals product group. This results in a large number of small R&D establishments
being classified as R&D services providers, whereas it is very likely that they do R&D for
other product groups. This means that in our main analysis we may not be capturing the
locations of all R&D activity devoted to the six product groups, (although we will be
capturing the locations of establishments accounting for the vast majority of expenditure
within these product groups). As an additional exercise we thus look separately at the
pattern of location of R&D services labs around university research departments.
2.2 Measuring University Research Quality
In our main analysis we use the results of the most recent Research Assessment Exercise in
2001 to map the presence and the quality of research carried out by universities, and their
specific research departments in Great Britain. To look at changes over time in RAE scores
we also use data from the previous RAE in 1996. The Higher Education Funding Council
for England (HEFCE) collects the RAE, with the primary purpose being to produce ratings
of research quality used to allocate the main grant for research use among universities.
Each university submits research activity for assessment on all or some fraction of the
research staff in departments of their choice. In 2001, there were 2,598 submissions by 173
universities to the RAE on 68 subject research areas in the UK.12 Each department
submission is rated within a scale of 1, 2, 3, 4, 5 and 5*. The higher the number in the scale

the higher the department’s research is rated. In some cases, departments in the same
location from the same university chose to send more than one submission. We use the
maximum rating achieved by the multiple submissions, leaving us with 2,515 submissions.
Once we exclude Northern Ireland we have a total of 2,448 research departments.
Using the RAE information we first construct a variable to indicate the rating attached to
the university as a whole as an average of the ratings of that university’s submitted
departments weighted by the number of researchers submitted for assessment, (we turn the
rating 5* into 6 to do this). We then construct measures of university presence, (the total
count of universities), and the average quality of university research at the postcode area
level. We treat all departments belonging to a university as located within the same
postcode area, given by the postcode of the central administrative office.
We use information on each departmental submission to construct a measure of the
presence and quality of relevant research activity for each of the six product groups in each
location. To define the relevancy of the research areas we use the 1994 Carnegie Mellon
Survey (CMS) results that reports for each industry the importance of the following ten
research fields: biology; chemistry; physics; computer science; materials science; medical
and health science; chemical engineering; electrical engineering; mechanical engineering;
and mathematics.13 We consider a field to be relevant for a product group if it was rated
moderately or very important (a score of at least three on a four-point scale) for the
corresponding industry by over 50% of the survey respondents. We assign each of the RAE
departments to the ten CMS fields, as shown in Table A.1 in the Appendix.14
Then, for each research field in each postcode area we construct two variables that combine
the number and research quality of the university departments corresponding to that field:
the number of departments belonging to that field rated 5 and 5*; and the number of
departments rated 4 or below. It is worth noting that the departments are rated based on

their research quality but not necessarily on how well they interact with businesses, which
might be important for a business deciding where to locate its R&D activity. Further,
although the most recent RAE was carried out in 2001, the research submitted for
assessment was carried out in the five years to the end of 2000.
In our analysis using new entrants we construct measures of the change in the number of 5
and 5* departments and the change in the number of departments rated 4 or below in each
postcode area and research field using information from both the 1996 and 2001 RAEs.
This allows us to control for any unobserved heterogeneity across areas that may be
correlated with the level of relevant research quality.
2.3 Control Variables
We include a number of further area-level variables in our main analysis. We include three
variables to capture the size and industrial structure of each area. First, we use the log of
total manufacturing employment in the postcode area to control for the scale of each area
and potential agglomeration externalities. Some of the highest values of this variable
include large urban areas such as Manchester, Newcastle and Birmingham, and other
postcode areas in the Midlands. Second, we include an index of the diversification of
manufacturing employment to control for potential urbanisation economies.15 Third, we use
the percentage of total manufacturing employment in the postcode area that is in the
relevant industry, (i.e. the industry corresponding to each product group), to control for
potential industry localisation externalities, and the co-location of R&D facilities with
production.16 This final measure varies at the industry-area level. All three measures are
constructed using the ONS plant-level ABI-ARD population data for the year 2000.
We also include a control for the skill composition of the workforce which can determine
the types of firms operating in the area and also contribute to the innovation process and to

knowledge spillovers.17 We use the percentage of the economically active population in
that postcode area that are qualified to degree equivalent or above (Level 4), constructed
from official labour market statistics for local and national areas.18 We also include the log
of the total number of research students in all departments in the postcode area rated 4 or
below and the log of total research students in all departments in the area rated 5 or 5* to
capture the potential contribution of local universities to the local labour market.
We include a range of further measures in our robustness checks. First we include a
measure of the percentage of the working population who are employed as scientific and
technical professionals or associate professionals from the 2001 Census, as a further control
for the characteristics of the local labour force. We use this only as a robustness check
since these data are not available for Scotland. Finally we include measures of the presence
of science parks in each postcode area from the UK Science Park Association (UKSPA).
To the extent that science parks are located near to high quality research departments this is
likely to make it more difficult to separately identify significant effects of proximity to
relevant research.
2.4 Descriptive Statistics
Table 1 breaks down total intramural R&D expenditure and counts of R&D-doing
establishments by product group for Great Britain. In 2003, total business intramural R&D
expenditure in Great Britain amounted to approximately £13.6 billion in nominal terms.
Looking at the R&D expenditure distribution across product groups, the second column of
Table 1 indicates that business R&D expenditure is highly concentrated: the seven product
groups shown account for 66% of total business R&D expenditure. R&D expenditure in
pharmaceutical products is the most important, accounting for a quarter of the total,
followed by aerospace with 12% and motor vehicles with 9%.19

In 2003, 10,492 establishments are classified as performing intramural R&D. The
distribution of establishments is much less concentrated across products than the
distribution of expenditure, the same seven products account for less than 25% of total
establishments doing R&D. This suggests that a small number of establishments account
for a large share of total business R&D expenditure. This is in line with the fact that large
firms account for around 75% of total R&D performed in UK businesses, (National
Statistics, 2005). We also look at the location pattern of specialised small R&D labs,
operating in natural sciences and engineering. These comprise a further 15% of
establishments.
[Table 1 here]
Our main analysis centres on the location of R&D facilities and we focus on count
measures of R&D-doing establishments in each location rather than total expenditure. This
places equal weight on large and small establishments, and means that we capture small
spin-out commercial ventures from universities and other small R&D start-ups which may
be important in capturing any co-location of private sector R&D facilities and university
research departments in our data. Given that the distribution of R&D across establishments
is extremely skewed as discussed above, results using total expenditure would be
dominated by small number of very large establishments.
In 2003, R&D activity carried out by foreign-owned establishments represented 45% of
total intramural R&D expenditure and 15% of the total number of establishments. R&D
expenditure carried out by foreign-owned establishments is more concentrated in motor
vehicles, TV, radio and communication equipment and machinery and slightly less
concentrated in pharmaceuticals and aerospace compared to total expenditure. Regarding
the distribution of establishments across product groups, foreign-owned establishments are

more concentrated compared to all R&D-doing establishments in Great Britain: the seven
product groups account for 41% of foreign-owned R&D-doing establishments.
Table 2 provides descriptive information on the variables used in our main analysis. The
first three rows show general university characteristics: 64% of the postcode areas have at
least one university, which means that 40 postcode areas do not have a university at all. On
average, postcode areas have one and a half universities but there is variation across areas,
42 being the greatest number of universities found in one single area (inner London).20
Next we present descriptive statistics on the specific relevant departments by rating. The
figures show that the relevant departments are often concentrated in few postcode areas and
that departments rated 5 and 5* are even more concentrated. Medical departments rated 4
or below are present in the largest number of postcodes, with only 66 out of 111 postcode
areas having none, while materials science departments rated 5 or 5* are present in the
fewest number of postcodes, with 104 postcode areas having none.
[Table 2 here]
In the robustness section we use measures of the change in the number of relevant
departments between the 1996 and 2001 RAE. Table A.3 in the Appendix shows
descriptive statistics for changes over this period in all the of the university variables. There
is a general decrease in the number of departments rated 4 or below and a corresponding
increase in the number rated 5 or 5*. This may partly represent “grade inflation”, and to the
extent that these increases do not represent genuine changes in research quality this will
tend to make it harder to identify significant effects of changes in the number of relevant
departments. In addition, the number of postcode areas with no variation is generally higher
than was the case in levels. This will also tend to make it harder to identify significant
effects.

Descriptive statistics on the number of R&D labs by product group and ownership, our
dependent variables, are displayed with the regression results in the bottom row of each
table in section 3.
4 Empirical Strategy and Findings
This section outlines our empirical strategy and then discusses our findings. The motivation
for our empirical approach depends on the underlying model of firm behaviour in mind.
Our data cover a very heterogeneous set of R&D establishments. Some, in particular those
owned by multinational firms, are likely to be highly geographically mobile. For these
firms the relevant decision is whether locating in close proximity to a university is likely to
increase their R&D productivity, or lower their costs of carrying out R&D, relative to an
alternative location. In this case evidence of co-location with university research
departments could indicate that geographic proximity is important to capitalise on
potentially cost-reducing knowledge spillovers.
Other establishments in our data will be small start-ups. Here the relevant decision might
be whether an individual chooses to set up a new business in the area where he or she lives
or works, rather than where to set up a new business. Hence, in this case a positive
association with particular research departments is potentially in line with individuals in
those departments having a higher propensity to set up their own commercial ventures.
Given this potential heterogeneity in the underlying decision process, we estimate a
negative binomial count data model in order to capture the general pattern of location
outcomes in our data, rather than specify a more precise model for such a heterogeneous set
of firms.21,22 In our main specification we investigate the cross-section relationship between
the location of R&D establishments and the quality of the research base. We look at each
product group separately, as it is very likely that the importance of university research and
specific university research departments for the location of private sector R&D varies
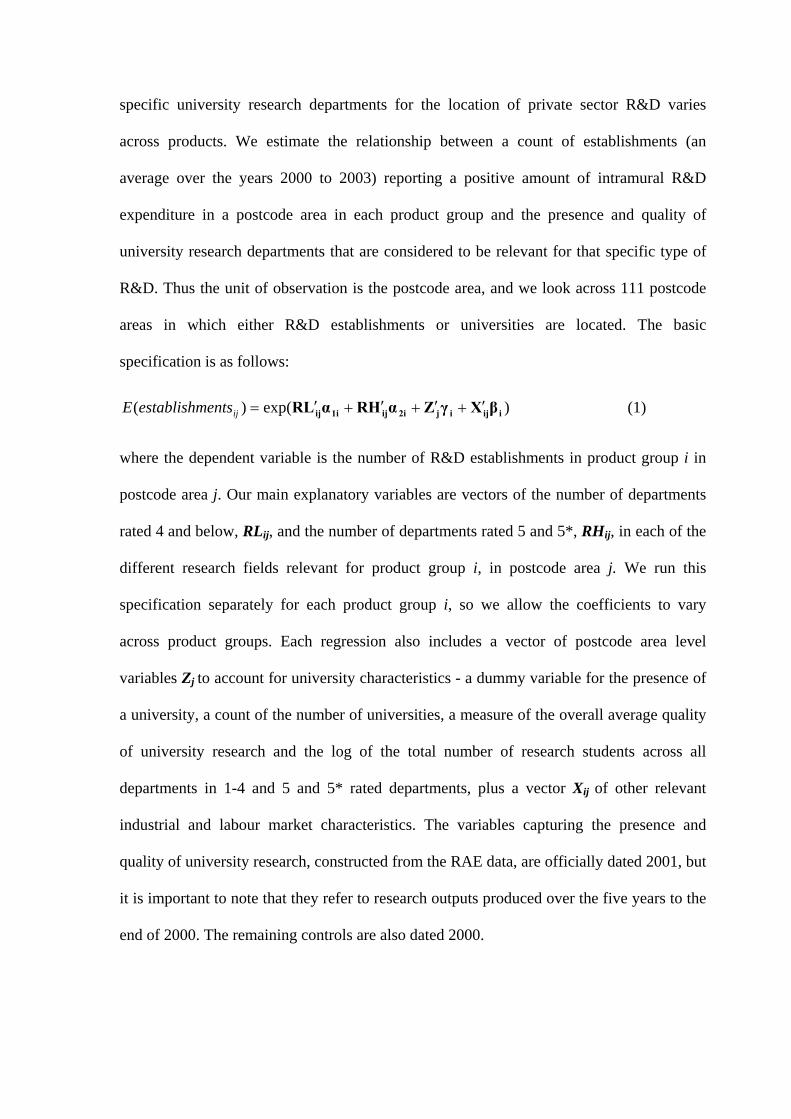
across products. We estimate the relationship between a count of establishments (an
average over the years 2000 to 2003) reporting a positive amount of intramural R&D
expenditure in a postcode area in each product group and the presence and quality of
university research departments that are considered to be relevant for that specific type of
R&D. Thus the unit of observation is the postcode area, and we look across 111 postcode
areas in which either R&D establishments or universities are located. The basic
specification is as follows:
)exp()( iijij2iij1iij βXγZαHRαLR ′+′+′+′=ijentsestablishmE (1)
where the dependent variable is the number of R&D establishments in product group i in
postcode area j. Our main explanatory variables are vectors of the number of departments
rated 4 and below, RLij, and the number of departments rated 5 and 5*, RHij, in each of the
different research fields relevant for product group i, in postcode area j. We run this
specification separately for each product group i, so we allow the coefficients to vary
across product groups. Each regression also includes a vector of postcode area level
variables Zj to account for university characteristics - a dummy variable for the presence of
a university, a count of the number of universities, a measure of the overall average quality
of university research and the log of the total number of research students across all
departments in 1-4 and 5 and 5* rated departments, plus a vector Xij of other relevant
industrial and labour market characteristics. The variables capturing the presence and
quality of university research, constructed from the RAE data, are officially dated 2001, but
it is important to note that they refer to research outputs produced over the five years to the
end of 2000. The remaining controls are also dated 2000.

While we attempt to control for other factors that may affect the location of business
research and development the results from the above specification should be interpreted as
correlations rather than causal relationships. For example, common unobserved factors may
determine both the quality of research departments and the location of R&D, or there may
be reverse causation from the location of business R&D to the quality of research
departments. In general these effects are likely to bias the results towards finding evidence
for the co-location of business R&D and relevant university research.
We conduct some further exercises to try and address the issue of correlated unobserved
heterogeneity across areas. First we experiment with adding a range of further control
variables as described in section 2.3. Second we estimate an alternative specification which
looks at the relationship between a count measure of greenfield entrants over the period
2001 to 2003 and changes in the university research quality variables described above
between the 1996 and 2001 RAEs. The resulting specification is as follows:
)exp()( 3 i1ijt1ijti1jt2i1ijt1i1ijt βXNγZαHRαLR −−−−− ′++′∆+′∆+′∆= iijtentrantsE α (2)
where the dependent variable is now the number of greenfield R&D entrants over the
period 2001 to 2003, the counts of relevant departments (and other variables relating to the
presence and quality of universities) are differences over the previous period between RAE
1996 and 2001,23 and Nijt-1 is the number of pre-existing R&D establishments in the
product group in that area in 2000. Differencing the RAE variables accounts for any
unobserved heterogeneity across areas that may be correlated with the level of relevant
research quality but not its change. Including the number of pre-existing establishments in
2000 should help to control for any residual unobserved heterogeneity in the attractiveness
of the area for R&D activity in the relevant product group during the period up until 2000.

The remaining controls capture aspects of agglomeration and the quality of the labour force
as before.24
We present all the results in the form of incidence rate ratios. An incidence rate ratio
greater than 1 corresponds to a positive coefficient, and an incidence rate below one
corresponds to a negative coefficient in the negative binomial model. For ease of
exposition, the coefficients displayed in the tables are the incidence rate ratios minus 1. For
example, an incidence rate ratio of 1.3 is displayed as 0.3 and means that for every one-unit
increase in the explanatory variable in an area, there is a 30% increase in the expected
number of R&D doing establishments in that area. An incidence rate of 0.65 is displayed as
–0.35 and means that for every one-unit increase in the explanatory variable, there is a 35%
decrease in the expected number of R&D-performing establishments. We report z-statistics
in parentheses, and indicate significant results at the 1% and 5% levels. Each table also
presents information on the dependent variable’s mean, standard error, maximum and the
number of postcode areas where the count of R&D-doing establishments is zero.
3.1 Location of Existing Establishments
Table 3 shows the results of the regressions for existing establishments. For each product
group we show the results for all establishments and foreign-owned establishments
separately. Conditional on the presence of departments in relevant fields, the number of
R&D establishments appears not to be correlated with the presence of universities in
general, the number of universities and overall research quality. One exception is electrical
machinery, where R&D labs are slightly less likely to be located in areas that have more
universities, although the effect of the dummy for the presence of a university is positive.
In all cases the coefficient on the log of manufacturing employment in the area is positive
and highly significant as expected, and in all but one case the coefficient on our measure of

area specialisation in the relevant industry is also positive and significant. In the case of
motor vehicles the diversification index also enters positively and significantly; taken
together with the other measures of industrial activity this indicates that R&D
establishments in this product group are likely to be located close to large centres of
manufacturing activity in both their own and other sectors. The proportion of the
population who have Level 4 skills or above enters positively and significantly in some
sectors with the effect being largest in pharmaceuticals.
Regarding the presence of specific university research fields rated 4 and below, there are a
number of positive coefficients that are significant at the 5% or 1% level, particularly for
foreign-owned establishments. Given the number of hypotheses being tested in Table 3 we
would expect to find some significant effects merely by chance. However, 7 out of the 56
estimated effects of the presence of specific departments in Table 3 are significant at the
1% level, indicating that the results are significantly stronger than would be expected by
chance.
For the pharmaceuticals sector both all establishments and foreign-owned establishments
are more likely to be located in areas with chemistry departments rated 4 or below,
compared to areas without a 1-4 rated department. The size of the coefficient in the first
column suggests that an additional department in a postcode area is associated with a 42%
increase in the expected number of establishments. On average a postcode area has
between one and two establishments performing R&D in pharmaceuticals, although the
distribution is skewed, with a maximum of 12, and 40 out of 111 postcode areas having
none at all. Note that an increase of one relevant department rated 4 or below is a large
change – as shown in Table 2, the average number of chemistry departments rated 4 or
below across all 111 postcode areas is only 0.2.

Along similar lines, an additional materials science department rated 4 or below in a
postcode area is associated with a 52% increase in the expected number of foreign-owned
establishments in machinery, and an extra electrical engineering department rated 4 or
below is associated with around a 69% increase in the expected number of foreign-owned
establishments in electrical machinery. All of these results seem fairly intuitive, and the
fact that these departments are not rated as carrying out world-class research suggests that a
positive relationship with the presence of foreign R&D establishments may be driven by
other factors such as technical support, consulting, or flows of students and personnel.
It is interesting to note that the number of mechanical engineering departments rated 4 or
below enters positively and significantly for machinery, TV and radio equipment and motor
vehicles if we drop the controls for manufacturing employment and the number of research
students. This suggests that the location of R&D establishments in these product groups is
correlated with the presence of these departments, but that they also tend to be located in
areas where there is a relatively large amount of manufacturing employment and/or a large
number of research students (across all departments).
Turning to the presence of departments rated 5 or 5*, the only consistent results are for
pharmaceuticals and chemicals. In particular, the number of chemistry departments rated 5
or 5* enters positively and significantly for pharmaceuticals, particularly for foreign-owned
establishments.25 The effects appear to be very large, but it is important to remember that
the average number of such departments in a postcode area is only about 0.2 as shown in
Table 2, so an increase of one is a large change. For foreign establishments there is also a
smaller positive and significant impact of the number of medical departments rated 5 or 5*.
Both of these results are consistent with the proposition that foreign-owned R&D
establishments in pharmaceuticals are particularly likely to locate near to centres of
relevant cutting edge research in order to source technology or expertise.26 This is
particularly interesting given that pharmaceuticals accounts for about a quarter of all
business R&D expenditure in Great Britain, and that foreign-owned establishments account
for around a third of R&D expenditure within the sector (see Griffith et al., 2004).
Surprisingly, we also find a significant negative impact of the presence of highly rated
biology departments on the expected number of establishments doing R&D in
pharmaceuticals. While the unconditional correlation between the location of these
establishments and highly rated biology departments is positive but insignificant, the
estimated relationship becomes negative once we condition on the other variables. There is
a strong positive correlation between the presence of highly rated chemistry and biology
departments, (areas with a 5 or 5* chemistry department always also have a 5 or 5* rated
biology department, but not vice versa), thus postcode areas with highly rated biology
departments but not highly rated chemistry departments are particularly unlikely to contain
establishments doing pharmaceuticals R&D. One possible interpretation is that this may
reflect something about the subject focus of biology departments that are not located close
to highly rated chemistry departments.
[Table 3 here]
The only other positive result for departments rated 5 or 5* is that establishments doing
R&D in chemicals are significantly more likely to be located in areas with more highly
rated materials science departments. This result appears to driven by domestically-owned
rather than foreign establishments.
3.2 Robustness
In this section we check the robustness of our strongest set of results, for all establishments
in the pharmaceuticals sector, to a range of alternative specifications. The results are shown
in Table 4, where only the coefficients on the numbers of relevant departments are reported

for ease of presentation. The first column repeats the results in the first column of Table 3,
except that London is dropped from the sample. The results are almost identical, although
the coefficient on the number of chemistry departments rated 4 or below becomes just
insignificant at the 5% level. Column (2) also repeats the specification from the first
column of Table 3 except that we include a set of region dummies, so that the results are
identified from variation within broad regions. Again the results are extremely similar, and
some of the region dummies enter significantly, with negative coefficients on all regions
relative to southern England.
Column (3) includes a measure of the percentage of the working population who are
employed as scientific and technical professionals or associate professionals from the 2001
Census, as a further control for the characteristics of the local labour force. These data are
not available for Scotland and so we lose 7 observations. The variable enters strongly
positively and significantly, with a one standard deviation increase of 0.5ppt in the working
population employed as scientific and technical professionals or associate professionals
being associated with about a 75% increase in the expected number of establishments
performing R&D in pharmaceuticals.27 Interestingly the coefficient on the proportion of the
population having Level 4 skills or above now becomes insignificant, with a coefficient (z-
statistic) of 0.050 (1.47). Most importantly however, the main results are not significantly
affected, and in fact the number of medical departments rated 4 or below now enters
positively and significantly.
[Table 4 here]
Columns (4) and (5) control for the presence of science parks. Many university spin-outs
and science-based businesses are located in science parks close to universities, and this
may play an important role in location decisions. Column (4) includes a zero-one dummy
for the presence of a science park in the postcode area, which enters positively but is not

quite significant at the 5% level. The main results for departments rated 5 or 5* are not
significantly affected, but the number of chemistry departments rated 4 or below becomes
just insignificant at the 5% level. Column (5) instead includes the absolute number of
science parks in the postcode area, and this enters positively and significantly, with an
additional science park associated with a 29% increase in the expected number of R&D
establishments. Interestingly, the effect of the number of chemistry departments rated 5 or
5* now becomes much smaller and insignificant, suggesting that the presence of science
parks may be driving the positive effect of highly rated chemistry departments. This does
not necessarily suggest that highly rated chemistry departments are not relevant for location
decisions, since the location of science parks is itself endogenous. Instead these results
suggest that science parks located close to highly rated chemistry departments are
positively correlated with the location of establishments performing R&D in
pharmaceuticals.28
We also investigated replacing the number of relevant departments rated 4 or below and 5
or 5* with the number of submitted researchers in relevant departments and the number of
research students (not reported). While the signs of the coefficients were similar to the
results using simply the number of departments, they were not significant, for example the
coefficient (z-statistic) on the number of active researchers in chemistry departments rated
5 or 5* was 0.021 (1.55). This suggests that it is the presence of relevant departments,
rather than their size or contribution to the local labour market, that is most associated with
the location of R&D establishments in pharmaceuticals.
Finally, column (6) replaces the dependent variable with a count of the number R&D
establishments recorded as being in the R&D services industry.29 As mentioned in section
2.1, there are some small, specialised R&D services labs for which the data does not
specify the product group for which they are doing R&D (the product group is assumed to
be the same as the industry in which they operate, R&D services), making it difficult to
know which fields of academic research are likely to be relevant for their activities. Of the
1,696 labs recorded as being in the R&D services industry in 2003, 112 do provide
information about the product group for which they are doing R&D. Of these just over 50%
report that they are performing R&D in pharmaceuticals, with about a further 25% spread
across the other product groups that we consider, and the remaining 25% in other product
groups. For this reason we investigate whether the location of R&D services labs is related
to the presence of research departments that are relevant to the pharmaceuticals industry.
The results in column (6) of Table 4 provide some evidence that the location pattern of
R&D services labs is related to the presence of relevant departments in a similar way to the
location of establishments performing R&D in pharmaceuticals, with a significant positive
effect of the number of highly rated chemistry departments, as well as a positive effect of
highly rated medical departments and a negative effect of medical departments rated 4 or
below. However, these results generally become insignificant if we include counts of all
other potentially relevant departments, although the number of highly rated medical
departments remains significant at the 10% level.
3.3 Location of Entrants
Even after controlling for a wide range of observable factors it is possible that the results in
Tables 3 and 4 are affected by unobserved heterogeneity across areas that is correlated with
the level of relevant research quality. In order to address this, Table 5 contains our results
for the relationship between the number of entrants over 2001-2003, and the change in the
number of university departments rated 4 or below, and 5 or 5*, between the 1996 and
2001 RAEs.30 As discussed above we also include the number of existing R&D
establishments of the relevant type in 2000 to capture any unobserved heterogeneity in the
attractiveness of the area for R&D activity in the relevant product group during the period

up until 2000. This variable enters positively in all cases but one, and is significant for the
chemicals, machinery and TV and radio equipment industries. We also include all our other
university-based variables in changes, while the controls for manufacturing employment,
diversification, industry specialisation and the skills of the workforce are included in levels
to control for any remaining scale and other constant area effects.
As expected given the smaller amount of variation in the changes, the number of significant
results is smaller than in the levels specification. This suggests either that some of the
levels results were driven by correlated unobserved heterogeneity across areas, or that there
has not been sufficient variation over this period in the RAE classifications of relevant
departments to identify the effect of changes on R&D location decisions.
However, our main results for the pharmaceuticals and chemicals sectors remain even in
the entrants specification, with a large and highly significant positive effect on the number
of entrants in pharmaceuticals of the change in the number of chemistry departments rated
5 or 5*, and a positive effect in chemicals of the change in the number of highly rated
materials science departments. These results provide even stronger evidence that the
location of R&D-doing establishments in these sectors is affected by the presence of
relevant high quality research departments. The effects are large, for example the 8
postcode areas that saw an increase of one in the number of highly rated chemistry
departments had an expected number of entrants in pharmaceuticals over 2001-2003 that
was almost ten times higher, even after controlling for the number of existing
establishments in 2000 and a range of other area controls.
These findings are also robust to the inclusion of our measure of the number of science
parks in each area. For example in pharmaceuticals the estimated coefficient on highly
rated chemistry departments halves to 4.366, but remains significant at the 5% level (z-
statistic, 2.16). The coefficient (z-statistic) on the number of science parks is positive and
significant at 0.282 (3.35).
We also find a number of other significant effects for changes in the number of relevant
departments rated 4 or below, with a significant positive effect of the number of
mechanical engineering departments in the machinery industry (but a negative effect in the
TV and radio equipment industry), and a positive effect of the number of electrical
engineering departments in the TV, radio and communications equipment industry.
[Table 5 here]
5 Conclusions
This paper provides the first comprehensive evidence on the extent to which business-
sector R&D activity is located in the vicinity of university research departments in Great
Britain. Even after controlling for various sources of observed and unobserved
heterogeneity across postcode areas we find robust evidence for the co-location of business
R&D with relevant university research departments. For high quality research departments
rated 5 or 5* by the RAE we find consistent evidence of co-location only in the
pharmaceuticals and chemicals industries, but we also find positive effects for research
departments rated 4 or below in other industries such as machinery and communications
equipment. Our strongest results in pharmaceuticals do not appear to be driven solely by
the supply of trained students or science professionals, though they do seem to be related to
the location of science parks. Some of our results are stronger for the location of foreign-
owned establishments, consistent with international technology sourcing by multinationals.
As discussed above, the importance of proximity to relevant university research may be
driven by a number of underlying economic mechanisms. These range from pure
knowledge spillovers mediated through informal networks and face-to-face interactions, to

formal collaboration agreements, consultancy or university spin-outs. The importance of
each of these mechanisms is likely to vary across subject areas and industries, and the
implications for policy may be different in each case. Our results in pharmaceuticals and
chemicals appear to confirm the importance of world-class centres of research for
attracting increasingly footloose R&D investment. However, the fact that we also find
some instances of co-location with lower rated university research departments raises the
possibility that firms may benefit both from proximity to frontier basic university research
and from more applied public sector research activity. The latter may be measured as low
quality research for the purposes of the RAE and funding allocations, but our results
suggest that it may play a role in some areas of technology transfer and even in attracting
foreign-owned R&D investment. However, without further supporting evidence on the
underlying economic mechanisms at work, it is difficult to make specific policy
recommendations based on these results.

Footnotes
1 See Table A.1 in the Appendix for a list of relevant departments. We discuss below how
we define which departments are relevant for a specific product group.
2 See, for example, Cohen et al. (2002) and Abramovsky et al. (2004).
3 See, for example, Audretsch and Feldman (1996), Audretsch and Feldman (1999), Cohen
et al. (2002) Rosenbloom (2004), Andersson and Karlsson, (2005) and Woodward et al.
(2006). Also, see Feldman (1999) for a review of this literature.
4 On the other side of the system, grants for specific projects and programmes are provided
by the Research Councils, charities, the European Union and government departments.
5 See HEFCE (2005).
6 Lambert Review of Business–University Collaboration: Final Report, (2003).
7 Establishments can in practice report on R&D carried out in plants at more than one
location, however in 2000 95% of establishments reported on a single plant. The ONS
constructs the data on the population of R&D-doers using information from other official
sources. We use the data over the period 2000 to 2003 as although the data are available
over the latter part of the 1990s, there are some significant jumps in the size of the
registered population which make the earlier data less reliable for our purposes.
8 Product groups use the same breakdown as industry groups, see Table A.1 in the
Appendix.
9 This more detailed information is imputed for non-sampled and non-respondent
establishments, see National Statistics (2005) for further details, but we do not use this
imputed information.
10 In the robustness section we test that our main results are robust to dropping London
from the sample.

11 We identify greenfield entrants as new identifier codes appearing in the years 2001 to
2003, which were not present in the population in 2000.
12 The RAE results are publicly available at http://www.hero.ac.uk/rae/Pubs/index.htm.
Though it is not mandatory, the incentives for participation are high as public research
funding depends on this assessment.
13 The Carnegie Mellon Survey on Industrial R&D is a survey of R&D managers of R&D
units located in the U.S. conducting R&D in manufacturing industries. The survey asks
firms’ R&D managers to evaluate, by field, the importance to their R&D of the
contribution of public research conducted over the prior 10 years, using a four-point Likert
scale. See Cohen et al. (2002) for a full description of the survey.
14 We exclude physics from the relevant research fields for the TV, radio and
communications equipment product group regression. It is never statistically significant
when included and does not affect the results. Physics is not classed as relevant for any of
the other product groups we examine.
15 Equal to (1-H)x100, where H = 2isΣ and is is the share of employment in 4-digit industry
i in total manufacturing employment in the postcode area. The index is increasing in the
extent of diversification. See, for example, Rosenthal and Strange (2003). The most
diversified areas include a number of large urban areas including Manchester, Birmingham
and Sheffield, and the least diversified areas include a number of postcode areas in
Scotland, plus the areas around Carlisle and Lancaster covering National Parks.
16 See, for example, Audretsch and Feldman (1996).
17 See, for example, Bartel and Lichtenberg (1987).
18 NOMIS, official labour market statistics for local and national areas, Labour Force
Survey.

19 The number of establishments performing R&D in aerospace is small relative to the
other product groups, and they are more concentrated geographically. This makes it hard to
identify the relevant effects and for this reason we exclude aerospace from the analysis.
20 In the robustness section we test that our main results are robust to dropping London
from the sample.
21 See Harhoff (1999) for a discussion of these issues in the context of a study of firm
formation in Germany.
22 We use the negative binomial regression instead of the Poisson regression to account for
overdispersion. In a Poisson distribution the mean and variance are equal. When the
variance is greater than the mean the distribution is said to display overdispersion and
Poisson estimation is inappropriate, yielding inefficient estimates. The negative binomial
regression corrects for this.
23 Because of the timing of the RAE this measures the change in research quality over the
period 1995 (the end of the 1996 RAE assessment period) to 2000 (the end of the 2001
RAE assessment period).
24 These controls vary very little over time, and we include them in levels to capture scale
effects and agglomeration effects that may not be captured by the number of pre-existing
establishments in 2000.
25 Interestingly this result is in line with the findings of the CMS survey of R&D managers,
with the importance placed on academic research in chemistry by R&D managers in the
drugs industry being one of the strongest findings in the survey. See Table A.2. in the
Appendix.
26 See Griffith, Harrison and Van Reenen (2006) for a discussion of technology sourcing by
UK firms.

27 Note that this variable is highly endogenous, hence this finding should not be interpreted
as causal.
28 The correlation between the number of science parks and the presence of 5 and 5*
chemistry departments is 0.51, with 15 out of the 18 postcode areas with 5 or 5* rated
chemistry departments containing science parks.
29 We look only at R&D services labs performing research in natural sciences and
engineering, as opposed to social sciences and humanities.
30 We do not present separate results for foreign entrants due to the low number of foreign
entrants over the period in most of the sectors, making it hard to identify the relevant
effects.
References Abramovsky L., Harrison, R. and Simpson, H. (2004). ‘Increasing innovative activity in the
UK? Where now for government support for innovation and technology transfer’, IFS
Briefing Note BN53.
Andersson, M. and Karlsson, C. (2005). ‘The location of industry R&D and the location of
university R&D – how are they related?’, CESIS Paper No. 38.
Audretsch, D.B. and Feldman, M.P. (1996). ‘R&D spillovers and the geography of
innovation and production’, American Economic Review, vol. 86(3), pp.630-640.
Audretsch, D.B. and Feldman, M.P. (1999). ‘Innovation in cities: science-based diversity,
specialization and localized competition’, European Economic Review, vol. 43, pp.
409-429.
Bartel, A.P. and Lichtenberg, F.R. (1987). ‘The comparative advantage of educated
workers in implementing new technology: some empirical evidence”, Review of
Economics and Statistics, vol. LXIX, No. 1, pp. 1-11.
Branstetter, L. and Ogura Y. (2005). ‘Is academic science driving a surge in industrial
innovation? Evidence from patent citations’, NBER Working Paper No. 11561
Cohen, W., Nelson R. and Walsh, J. (2002). ‘Links and impacts: the influence of public
research on industrial R&D’, Management Science, vol. 48(1), pp. 1-23.
Department of Trade and Industry, (2003). Innovation Report – Competing in the Global
Economy: The Innovation Challenge, www.dti.gov.uk/innovationreport/
Feldman, M. (1994). The Geography of Innovation, Boston; Kluwer Academic Publishers.
Feldman, M. (1999). ‘The new economics of innovation, spillovers and sgglomeration: a
review of empirical studies’, Economics of Innovation and New Technology, vol. 8, pp.
5-25.

Griffith, R., Harrison, R. and Van Reenen, J. (2006). ‘How special is the special
relationship? Using the impact of US R&D spillovers on UK firms as a test of
technology sourcing’, American Economic Review, vol. 96(5)
Griffith, R., Redding, S. and Simpson, H. (2004). ‘Foreign ownership and productivity:
new evidence from the service sector and the R&D lab’, Oxford Review of Economic
Policy, vol. 20(3), 533-564.
Harhoff, D. (1999). ‘Firm formation and regional spillovers – evidence from Germany”,
Economics of Innovation and New Technology, vol. 8, pp.27-55.
HEFCE (2005). Funding Higher Education in England,
http://www.hefce.ac.uk/Pubs/hefce/2005/05_34/05_34.pdf
Jaffe, A. (1989). ‘Real effects of academic research”, American Economic Review, vol.
79(5), pp.957-970.
Lambert Review of Business–University Collaboration: Final Report, December 2003,
HMSO, www.hm-treasury.gov.uk/media//EA556/lambert_review_final_450.pdf
National Statistics (2005). Research and Development in UK Businesses, 2003. Business
Monitor MA14,
http://www.statistics.gov.uk/downloads/theme_commerce/MA14_2003.pdf
Rosenbloom, J.L. (2004). ‘The geography of innovation commercialization in the United
States during the 1990s’. The University of Kansas Working Paper Series in
Theoretical and Applied Economics, WP Number 200502.
Rosenthal, S.E. and Strange W. C. (2003). ‘Geography, industrial organization, and
agglomeration’, The Review of Economics and Statistics, vol. 85(2), pp. 377-393.
Woodward, D., Figueiredo, O. and Guimarães P. (2006). ‘Beyond the silicon valley:
university R&D and high-technology location’, Journal of Urban Economics, vol. 60,
pp. 15-32.

Appendix
[Table A.1 here]
[Table A.2 here]
[Table A.3 here]

Fig. 1. Distribution of R&D establishments across postcode areas, 2003
Note: Product groups included are pharmaceuticals, chemicals, machinery, electrical machinery, TV and radio equipment and motor vehicles. Source: Authors’ calculations using BERD (Source: ONS).
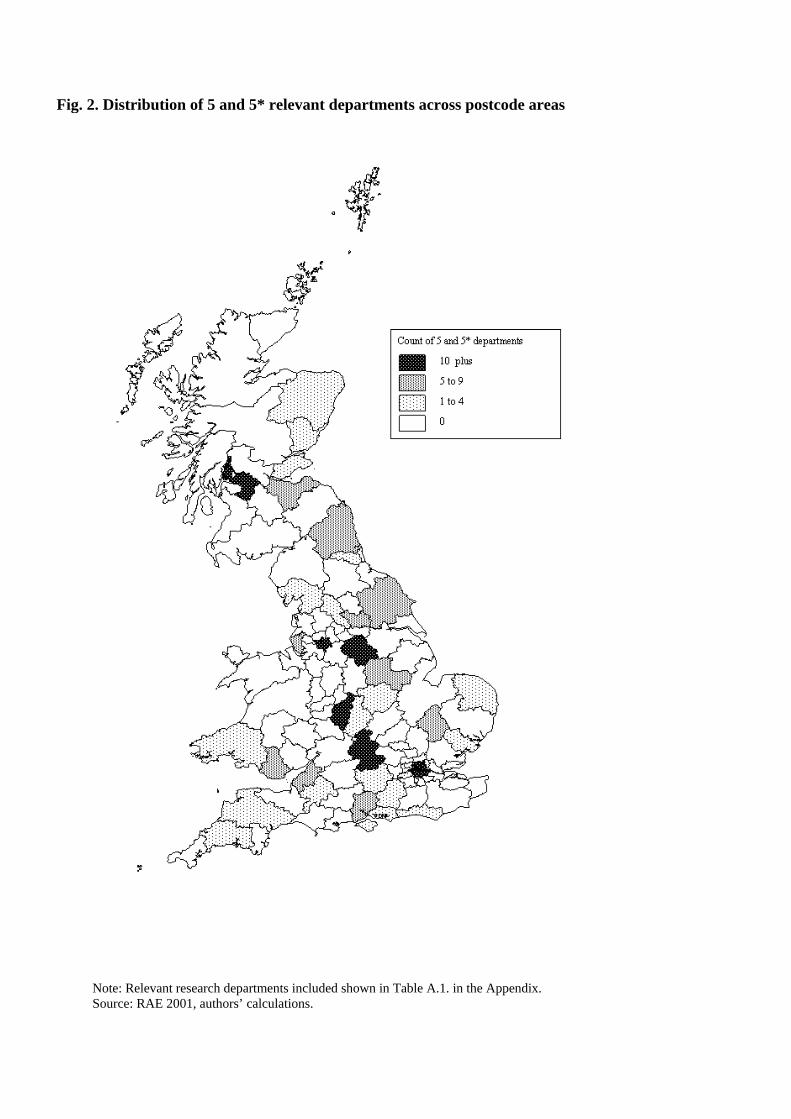
Fig. 2. Distribution of 5 and 5* relevant departments across postcode areas
Note: Relevant research departments included shown in Table A.1. in the Appendix. Source: RAE 2001, authors’ calculations.

Table 1. Total intramural R&D in 2003, by product group, Great Britain.
Product group Expenditure Establishments
£bn % Number %
Pharmaceuticals 3.24 24% 158 2% Aerospace 1.65 12% 72 1% Motor vehicles 1.17 9% 236 2% Machinery 0.97 7% 782 7% TV and radio equipment 0.93 7% 250 2% Chemicals 0.54 4% 382 4% Electrical machinery 0.44 3% 442 4% R&D services (natural science and engineering) 0.33 2% 1,584 15% Other 4.31 32% 6,586 63% Total 13.57 100% 10,492 100%
Source: Authors’ calculations using BERD (Source ONS) data.
Table 2. Descriptive statistics: main university research and control variables Variable Mean Standard
Deviation Number of postcode
areas with zero
Maximum in postcode
area
Dummy: Presence of university 0.64 0.48 40 -- Number of universities 1.52 4.07 40 42 Average university quality 2.42 1.93 40 5.58 Rated 4 and below
Biology 0.26 0.57 86 4 Chemistry 0.23 0.55 92 3 Medicine 1.23 3.07 66 28 Materials science 0.15 0.43 97 2 Mechanical engineering 0.22 0.49 91 2 Electrical engineering 0.21 0.54 92 4 Computer science 0.48 1.17 74 11
Rated 5 and 5* Biology 0.28 0.63 85 5 Chemistry 0.17 0.40 93 2 Medicine 0.85 2.74 86 25 Materials science 0.09 0.37 104 2 Mechanical engineering 0.16 0.53 98 4 Electrical engineering 0.17 0.46 95 3 Computer science 0.22 0.43 88 2
Control variables Log (total manufacturing employment) 10.17 0.79 -- 12.00 Diversification Index 96.00 2.64 -- 98.57 Industry % manufacturing employment 4.56 5.03 -- 36.20 % population with L4 or above skills 25.04 4.40 -- 41.14 Log (number research students in 5,5* departments) 2.51 3.04 -- 8.99 Log (number research students in 1-4 departments) 3.20 2.67 -- 7.96 % working population science and technology professionals & associate professionals
2.57 0.47 -- 4.08
Science park dummy 0.41 0.49 65 1 Number science parks 0.70 1.23 65 9
Source: Authors’ calculations using ARD-ABI data (Source: ONS), RAE, NOMIS, UKSPA data.

Table 3. Location of establishments conducting intramural R&D, average 2000-2003. Dependant variable: Number of establishments conducting intramural R&D
Product group and ownership
Pharmaceuticals Chemicals Machinery Electrical machinery All Foreign All Foreign All Foreign All Foreign
Dummy: Presence of university -0.423 (0.34)
0.213 (0.10)
-0.384 (0.58)
-0.391 (0.43)
-0.523 (1.51)
-0.507 (0.70)
2.112 (1.31)
1.383 (0.87)
Number of universities -0.023 (0.38)
-0.038 (0.45)
-0.010 (0.67)
-0.015 (0.79)
-0.012 (1.39)
-0.055 (2.54)*
-0.033 (2.42)*
-0.124 (4.94)**
Average university quality 0.349 (0.75)
-0.014 (0.04)
0.120 (0.42)
0.086 (0.23)
0.150 (0.89)
0.357 (1.17)
-0.338 (1.57)
-0.338 (1.33)
Number of departments rated 1 to 4:
Biology 0.136 (0.54)
-0.339 (1.63)
Chemistry 0.422 (1.97)*
0.813 (2.23)**
-0.071 (0.50)
-0.038 (0.15)
Medical 0.073 (0.93)
0.044 (0.40)
Materials science 0.056 (0.38)
-0.095 (0.44)
-0.027 (0.39)
0.516 (3.22)**
Computer science
Electrical engineering 0.086 (0.74)
0.688 (2.61)**
Mechanical engineering -0.059 (0.63)
0.140 (0.86)
Number of departments rated 5 and 5*
Biology -0.748 (3.98)**
-0.833 (3.10)**
Chemistry 1.828 (2.81)*
2.672 (2.70)**
-0.089 (0.28)
-0.219 (0.56)
Medical 0.077 (1.00)
0.220 (2.17)*
Materials science 0.475 (2.74)**
0.323 (1.53)
0.062 (0.90)
-0.135 (0.82)
Computer science
Electrical engineering 0.011
(0.07) 0.104 (0.34)
Mechanical engineering -0.073
(0.86) -0.037 (0.20)
Log manufacturing employment 0.950 (4.04)**
0.970 (2.91)**
1.517 (6.48)**
1.660 (5.06)**
1.643 (13.13)**
1.608 (6.43)**
1.111 (6.34)**
1.707 (4.37)**
Diversification index 0.112 (1.33)
0.028 (0.23)
0.023 (1.08)
-0.037 (0.96)
0.037 (1.73)
-0.043 (1.22)
0.045 (1.19)
-0.056 (1.10)
Industry % manufacturing employment
0.073 (2.98)**
0.060 (1.90)
0.065 (6.58)**
0.068 (6.08)**
0.050 (6.26)**
0.077 (5.18)**
0.087 (4.66)**
0.134 (4.66)**
% population with L4 or above skills 0.159 (5.88)**
0.109 (2.97)**
0.022 (1.28)
0.046 (2.28)*
0.011 (1.15)
0.034 (2.04)*
0.059 (4.20)**
0.082 (3.10)**
Log total no. research students in 5,5* departments
0.022 (0.19)
0.072 (0.45)
-0.072 (0.99)
-0.018 (0.19)
-0.037 (0.88)
-0.011 (0.13)
0.141 (1.31)
0.134 (1.11)
Log total no. research students in 1-4 departments
0.841 (0.96)
-0.048 (0.17)
0.050 (0.61)
0.040 (0.35)
0.089 (1.37)
-0.084 (0.76)
-0.013 (0.14)
-0.006 (0.04)
Pseudo R-squared 0.22 0.19 0.20 0.18 0.26 0.21 0.18 0.18
Number of observations with dependent variable equal to zero
40 70 9 43 4 29 8 42
Dependent variable mean (standard error) [Maximum in a postcode area]
1.49 (2.11) [12]
0.56 (0.87)
[4]
3.65 (3.93) [21]
0.98 (1.12)
[5]
6.83 (5.89) [40]
1.38 (1.60) [11]
3.63 (3.21) [13]
1.06 (1.38)
[9]
Observations 111 111 111 111 111 111 111 111
Values shown are incident rate ratios minus one. z-statistics in parentheses. * significant at 5% level, ** significant at 1% level. Source: Authors’ calculations using BERD, ARD-ABI (Source: ONS), RAE and NOMIS data.
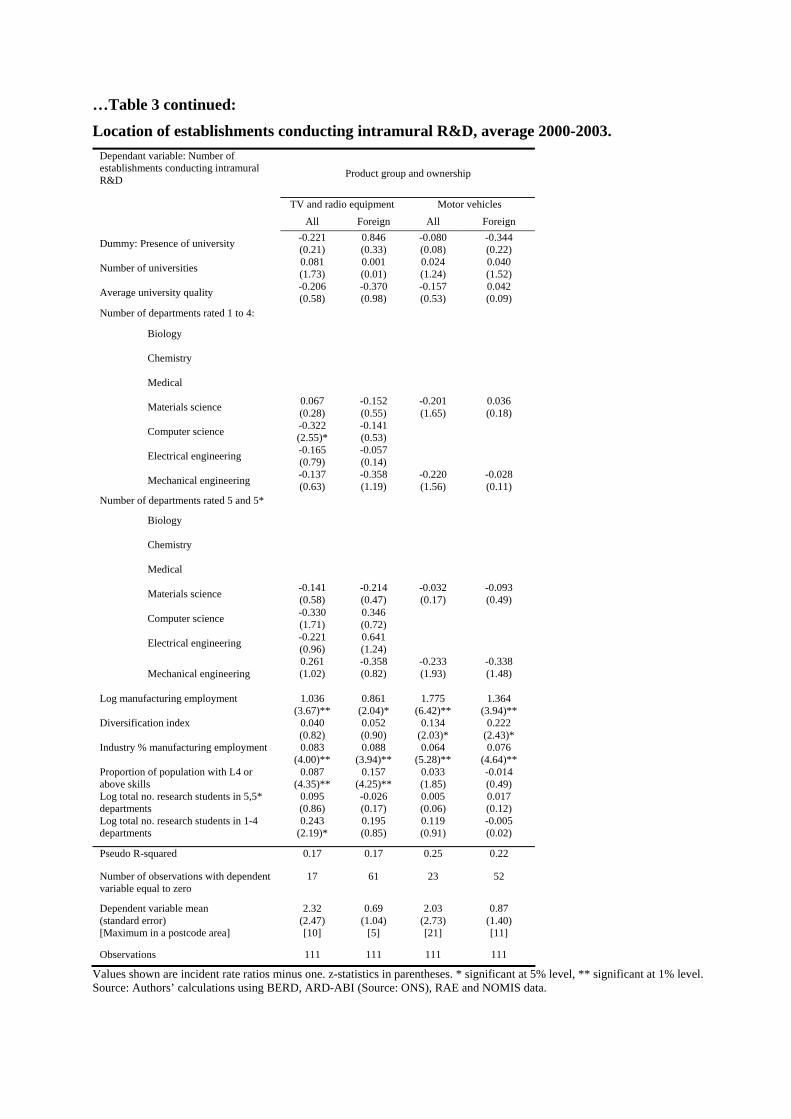
…Table 3 continued:
Location of establishments conducting intramural R&D, average 2000-2003. Dependant variable: Number of establishments conducting intramural R&D Product group and ownership
TV and radio equipment Motor vehicles
All Foreign All Foreign
Dummy: Presence of university -0.221 (0.21)
0.846 (0.33)
-0.080 (0.08)
-0.344 (0.22)
Number of universities 0.081 (1.73)
0.001 (0.01)
0.024 (1.24)
0.040 (1.52)
Average university quality -0.206 (0.58)
-0.370 (0.98)
-0.157 (0.53)
0.042 (0.09)
Number of departments rated 1 to 4:
Biology
Chemistry
Medical
Materials science 0.067 (0.28)
-0.152 (0.55)
-0.201 (1.65)
0.036 (0.18)
Computer science -0.322 (2.55)*
-0.141 (0.53)
Electrical engineering -0.165 (0.79)
-0.057 (0.14)
Mechanical engineering -0.137 (0.63)
-0.358 (1.19)
-0.220 (1.56)
-0.028 (0.11)
Number of departments rated 5 and 5*
Biology
Chemistry
Medical
Materials science -0.141 (0.58)
-0.214 (0.47)
-0.032 (0.17)
-0.093 (0.49)
Computer science -0.330 (1.71)
0.346 (0.72)
Electrical engineering -0.221 (0.96)
0.641 (1.24)
Mechanical engineering 0.261 (1.02)
-0.358 (0.82)
-0.233 (1.93)
-0.338 (1.48)
Log manufacturing employment 1.036 (3.67)**
0.861 (2.04)*
1.775 (6.42)**
1.364 (3.94)**
Diversification index 0.040 (0.82)
0.052 (0.90)
0.134 (2.03)*
0.222 (2.43)*
Industry % manufacturing employment 0.083 (4.00)**
0.088 (3.94)**
0.064 (5.28)**
0.076 (4.64)**
Proportion of population with L4 or above skills
0.087 (4.35)**
0.157 (4.25)**
0.033 (1.85)
-0.014 (0.49)
Log total no. research students in 5,5* departments
0.095 (0.86)
-0.026 (0.17)
0.005 (0.06)
0.017 (0.12)
Log total no. research students in 1-4 departments
0.243 (2.19)*
0.195 (0.85)
0.119 (0.91)
-0.005 (0.02)
Pseudo R-squared 0.17 0.17 0.25 0.22
Number of observations with dependent variable equal to zero
17 61 23 52
Dependent variable mean (standard error) [Maximum in a postcode area]
2.32 (2.47) [10]
0.69 (1.04)
[5]
2.03 (2.73) [21]
0.87 (1.40) [11]
Observations 111 111 111 111
Values shown are incident rate ratios minus one. z-statistics in parentheses. * significant at 5% level, ** significant at 1% level. Source: Authors’ calculations using BERD, ARD-ABI (Source: ONS), RAE and NOMIS data.

Table 4. Robustness, pharmaceuticals R&D
All specifications include controls: dummy presence of university, number of universities, average university quality, log manufacturing employment, diversification index, pharmaceutical industry % manufacturing employment, % population with L4 or above skills, log total no. research students in 5,5* departments, log total no. research students in 1-4 departments. Region dummies are relative to Southern England, IRR-1 (z-statistic): Midlands –0.518 (2.13)*; Northern England –0.361 (1.75); Wales –0.710 (3.24)**; Scotland –0.392 (1.62). Values shown are incident rate ratios minus one. z-statistics in parentheses. * significant at 5% level, ** significant at 1% level. Source: Authors’ calculations using BERD, ARD-ARD (Source: ONS), RAE, NOMIS and UKSPA data.
Dependant variable: Number of establishments conducting intramural R&D Pharmaceuticals R&D
services
(1) Drop
London
(2) Region
Dummies
(3) Science and technology
professionals
(4) Science park
Y / N
(5) Number science Parks
(6)
Number of departments rated 1 to 4:
Biology 0.171 (0.63)
0.090 (0.38)
0.133 (0.63)
0.064 (0.27)
0.404 (2.23)*
-0.088 (0.66)
Chemistry 0.413 (1.95)
0.658 (2.59)**
0.539 (2.38)*
0.352 (1.81)
0.126 (0.73)
0.133 (0.82)
Medical 0.067 (0.86)
0.130 (1.39)
0.166 (1.99)*
0.022 (0.29)
0.059 (0.90)
-0.128 (3.33)**
Number of departments rated 5 and 5*
Biology -0.750 (4.01)**
-0.719 (3.47)**
-0.670 (2.99)**
-0.675 (3.08)**
-0.573 (2.90)**
-0.471 (2.79)**
Chemistry 1.793 (2.83)**
1.997 (2.80)**
1.531 (2.44)*
1.588 (2.59)**
0.173 (0.46)
0.544 (2.00)*
Medical 0.083 (1.10)
0.023 (0.32)
0.110 (1.55)
0.058 (0.79)
-0.009 (0.21)
0.102 (2.14)*
% working pop. science and technology professionals & associate professionals
1.493 (3.74)**
Science park dummy 0.580 (1.89)
Number science parks
0.294 (6.46)**
Pseudo R-squared 0.21 0.25 0.25 0.23 0.27 0.17
Observations 110 111 104 111 111 111

Table 5. Location of entrants conducting intramural R&D, 2001-2003. Dependant variable: Number of entrant establishments conducting intramural R&D
Product group
Pharmaceuticals Chemicals Machinery Electrical machinery
TV and radio equipment
Motor vehicles
Number of est. in 2000 0.126 (1.16)
0.060 (2.56)*
0.035 (2.43)*
0.068 (1.38)
0.107 (2.39)*
-0.011 (0.35)
Change in dummy: Presence of university
-0.679 (0.71)
-0.815 (2.06)*
-0.465 (0.81)
-0.567 (1.72)
-0.970 (2.98)**
-0.842 (1.88)
Change in number of universities 0.408 (0.70)
0.250 (0.92)
0.029 (0.18)
0.331 (1.97)*
0.484 (1.22)
0.324 (1.03)
Change in average university quality
-0.370 (0.73)
0.286 (1.21)
0.353 (1.55)
-0.004 (0.02)
-0.086 (0.30)
-0.022 (0.08)
Change in number of departments rated 1 to 4: Biology 0.441
(0.66)
Chemistry 0.993 (1.56)
0.184 (0.59)
Medical -0.004 (0.02)
Materials science 0.341 (1.65)
0.140 (1.16)
0.225 (0.77)
0.278 (1.49)
Computer science -0.375 (1.60)
Electrical engineering 0.264 (1.18)
1.018 (2.09)*
Mechanical engineering 0.246 (3.58)**
-0.346 (1.98)*
-0.044 (0.27)
Change in number of departments rated 5 and 5*
Biology 1.166 (1.00)
Chemistry 9.504 (2.81)**
-0.287 (0.49)
Medical -0.073 (0.39)
Materials science 3.239 (2.38)*
0.340 (0.96)
-0.578 (1.44)
-0.267 (1.09)
Computer science -0.248 (0.55)
Electrical engineering -0.450 (1.90)
-0.369 (0.99)
Mechanical engineering 0.166 (1.13)
-0.115 (0.42)
-0.226 (1.00)
Log manufacturing employment 0.676 (1.13)
0.733 (3.36)**
0.747 (3.40)**
2.158 (6.05)**
1.306 (2.66)**
1.392 (3.73)**
Diversification index 0.504 (1.41)
0.050 (0.90)
0.035 (0.77)
-0.042 (0.77)
0.178 (1.49)
0.252 (2.56)*
Industry % manufacturing employment
0.084 (1.79)
0.028 (2.02)*
0.034 (2.11)*
0.077 (1.77)
0.076 (1.65)
0.071 (3.22)**
Proportion of population with L4 or above skills
0.029 (0.41)
-0.012 (0.71)
0.028 (2.06)*
0.001 (0.03)
0.093 (3.13)**
-0.013 (0.52)
Change in log total no. research students in 5,5* departments
-0.577 (0.45)
-0.349 (0.53)
0.295 (0.71)
-0.274 (0.55)
-0.671 (1.32)
-0.848 (3.00)**
Change in log total no. research students in 1-4 departments
-0.127 (0.24)
-0.433 (1.23)
0.039 (0.13)
0.667 (2.92)**
0.093 (0.15)
0.415 (1.16)
Pseudo R-squared 0.18 0.20 0.16 0.17 0.21 0.21 Number of observations with dependent variable equal to zero
85 104 44 85 23 81
Dependent variable mean (standard error) [Maximum in a postcode area]
0.32 (0.70)
[4]
0.10 (0.46)
[4]
1.19 (1.37)
[7]
0.31 (0.71)
[5]
2.67 (2.69) [14]
0.50 (1.38) [12]
Observations 111 111 111 111 111 111 Values shown are incident rate ratios minus one. z-statistics in parentheses. * significant at 5% level, ** significant at 1% level. Source: Authors’ calculations using BERD, ARD-ABI (Source: ONS), RAE and NOMIS data.

Appendix
Table A.1. Linking R&D product groups, industries, research fields and departments R&D product group
Corresponds to products in BERD
Corresponds to UK SIC92 codes
Corresponds to US industry codes in CMS Cohen et al. 2002
Relevant fields (CMS, Cohen et al., 2002)1
UK university departments (RAE 2001)
Pharmaceuticals 15 (H) pharmaceuticals 24.4 2423 BIO CHEM MED
14 Biology 18 Chemistry 1 to 5 Clinical medicine, 6 Anatomy, 7 Physiology, 8 Pharmacology, 9 Pharmacy, 10 to 11 Other medical
Chemicals 14 (G) chemicals 24 (excl. 24.4) 2400 2411 2413 2429 CHEM MATSCI
18 Chemistry 32 Metallurgy and materials
Machinery 21 (N) machinery 29 2910 2920 2922 MATSCI MECHE
32 Metallurgy and materials 30 Mechanical, aeronautical and manufacturing engineering
Electrical Machinery
23 (P) electrical machinery
31
3100 3110 EE
29 Electrical and electronic engineering
TV and radio equipment
24 (Q) TV / radio 32 3210 3211 3220 3230 MATSCI 2
COMPSCI EE MECHE
32 Metallurgy and materials 25 Computer science 29 Electrical and electronic engineering 30 Mechanical, aeronautical and manufacturing engineering
Motor vehicles 26 (S) motor vehicles 34 3410 3430 MATSCI EE MECHE
32 Metallurgy and materials 29 Electrical and electronic engineering 30 Mechanical, aeronautical and manufacturing engineering
1 University sectors that over 50% respondents say are moderately or very important in this industry. 2 We exclude PHYSICS from the relevant research fields for this product group to reduce the number of right hand side variables in the regression. It is never statistically significant when included.

Table A.2. Importance of academic research in different fields of science for industrial R&D managers in the US
Percentage of respondents indicating research “moderately important” or “very important” Industry (ISIC code)
Description Sample size BIO CHEM PHYS COMPSC MATSC MED CHEME EE MECHE MATH
2400 Chemicals 75 13.3 52.0 8.0 24.0 22.7 17.3 34.7 1.3 5.3 5.3
2411 Basic Chemicals 42 14.3 47.6 7.1 23.8 23.8 16.7 40.5 2.4 4.8 2.4
2413 Plastic Resins 30 13.3 56.7 13.3 30.0 50.0 6.7 46.7 3.3 3.3 6.7
2423 Drugs 70 64.3 74.3 7.1 30.0 26.5 75.7 22.9 5.7 5.7 4.3
2429 Miscellaneous Chemicals 32 12.5 62.5 9.4 31.3 46.9 12.5 37.5 3.1 12.5 9.4
2910 General Purpose Machinery
79 1.3 13.9 10.1 29.1 53.2 5.1 21.5 26.6 59.5 10.3
2920 Special Purpose Machinery
74 10.8 23.0 25.7 35.1 38.4 5.4 20.3 31.1 36.5 14.9
2922 Machine Tools 11 0.0 0.0 0.0 36.4 36.4 0.0 0.0 27.3 36.4 0.0
3100 Electrical Equipment 23 0.0 13.0 8.7 8.7 21.7 8.7 8.7 17.4 21.7 8.7
3110 Motor/Generators 24 0.0 4.2 12.5 29.2 41.7 0.0 4.2 58.3 33.3 8.3
3210 Electronic Components 28 3.6 25.0 28.6 32.1 53.6 7.1 10.7 63.0 50.0 28.6
3211 Semiconductors 26 11.5 46.2 61.5 46.2 76.9 11.5 30.8 65.4 42.3 26.9
3220 Comm equipment 37 2.7 8.1 29.7 54.1 27.0 2.7 5.4 70.3 37.8 24.3
3230 TV/radio 9 0.0 11.1 33.3 44.4 55.6 11.1 22.2 66.7 33.3 22.2
3410 Car/Truck 9 11.1 22.2 33.3 44.4 55.6 11.1 22.2 33.3 44.4 22.2
3430 Auto Parts 34 2.9 14.7 23.5 41.2 54.6 2.9 20.6 50.0 58.8 23.5
Fields: Biology (BIO), Chemistry (CHEM), Physics (PHYS), Computer Science (COMPSC), Materials Science (MATSC), Medical and Health Science (MED), Chemical Engineering (CHEME), Electrical Engineering (EE), Mechanical Engineering (ME) and Mathematics (MATH). Source: CMS survey reported in Cohen, Nelson and Walsh (2002).
Table A.3. Descriptive statistics: changes in university variables 1996 to 2001 Variable Mean Standard
Deviation Number of postcode
areas with zero
Minimum in postcode
area
Maximum in postcode
area
Dummy: Presence of university 0.02 0.19 107 -1 1 Number of universities -0.05 0.37 96 -1 1 Average university quality 0.50 0.64 39 -2.5 3 Rated 4 and below
Biology -0.22 0.49 88 -2 1 Chemistry -0.22 0.57 92 -3 0 Medicine -0.49 1.37 75 -6 1 Materials science -0.06 0.39 97 -2 1 Mechanical engineering -0.16 0.63 91 -4 1 Electrical engineering -0.24 0.58 85 -3 1 Computer science -0.15 0.51 92 -2 1
Rated 5 and 5* Biology 0.09 0.29 101 0 1 Chemistry 0.07 0.26 103 0 1 Medicine 0.40 1.30 93 -1 9 Materials science 0.00 0.13 109 -1 1 Mechanical engineering 0.06 0.34 101 -1 2 Electrical engineering 0.07 0.26 103 0 1 Computer science 0.07 0.32 99 -1 1
Control variables Log (number research students in 5,5* departments) 0.02 0.13 62 -0.56 0.82 Log (number research students in 1-4 departments) 0.12 0.37 42 -0.45 2.08
Source: Authors’ calculations using RAE data.