university of pÉcs - pécsi...
TRANSCRIPT

UNIVERSITY OF PÉCS,
FACULTY OF HEALTH SCIENCES
PH.D. SCHOOL OF HEALTH SCIENCES
HEAD OF THE PH.D. SCHOOL:
JÓZSEF BÓDIS, PROF., M.D., D.SC., TEACHER OF THE UNIVERSITY,
RECTOR
DEVELOPING ADVANCED 3D CONFORMAL
RADIOTHERAPY PLANNING TECHNIQUES FOR PANCREAS,
PROSTATE, CEREBRAL , AND CRANIOSPINAL IRRADIATION
PH.D. DISSERTATION
ZSOLT SEBESTYÉN
PROGRAM SUPERVISOR: ISTVÁN EMBER, PROF., M.D., D.SC.
SUPERVISOR: TIBOR CSERE, M.D., PH.D.
CO-SUPERVISOR: LÁSZLÓ MANGEL, M.D., MED. HABIL .
PÉCS, 2011.
2
1. TABLE OF CONTENTS
1. Table of contents ....................................................................................................2
2. Abbreviation table ..................................................................................................5
3. General introduction...............................................................................................8
3.1. Three-dimensional (3D) conformal radiotherapy planning procedure..........9
3.1.1. Step 1 – Patient positioning and immobilization ................................11
3.1.2. Step 2 – Image acquisition and input..................................................11
3.1.3. Step 3 – Anatomy definition ...............................................................12
3.1.4. Step 4 – Dose prescription ..................................................................13
3.1.5. Step 5 – Beam technique.....................................................................14
3.1.6. Step 6-7-8-9 – Dose calculation and plan evaluation, improvement,
review, documentation, implementation and verification ......................16
3.2. Motivation and concepts..............................................................................17
4. Main objectives ....................................................................................................19
5. Wedge Direction Determination (WEDDE) algorithm........................................20
5.1. Determination of the required collimator angles.........................................21
6. CONKISS: Conformal Kidneys Sparing 3D non-coplanar radiotherapy treatment
for pancreatic cancer as an alternative to IMRT ..................................................23
6.1. Introduction .................................................................................................23
6.2. Methods and materials.................................................................................24
6.2.1. Contouring ..........................................................................................24
6.2.2. ST 3D-CRT treatment planning..........................................................25
6.2.3. CONKISS planning method ...............................................................25
6.2.4. Plan evaluation and comparison .........................................................27
6.3. Results .........................................................................................................29
6.3.1. PTV coverage......................................................................................29
6.3.2. Dose to OARs .....................................................................................30
6.4. Discussion....................................................................................................33
6.4.1. Advantages of lateral beam directions................................................34
6.4.2. CONKISS vs. IMRT comparison .......................................................35
3
6.4.3. Limit of physical wedge direction usage ............................................37
6.4.4. Balancing the dose to the OARs .........................................................37
6.5. Conclusion ...................................................................................................39
7. CONRES: Conformal Rectum Sparing 3D non-coplanar radiotherapy treatment
for prostate cancer as an alternative to IMRT......................................................40
7.1. Introduction .................................................................................................40
7.2. Methods and materials.................................................................................41
7.2.1. Contouring ..........................................................................................41
7.2.2. Planning priorities and OAR tolerance dose limits.............................42
7.2.3. ST 3D-CRT treatment planning..........................................................42
7.2.4. CONRES planning method.................................................................43
7.2.5. Plan evaluation and comparison .........................................................44
7.3. Results .........................................................................................................45
7.3.1. PTV coverage......................................................................................45
7.3.2. Dose to OARs .....................................................................................46
7.4. Discussion....................................................................................................49
7.5. Conclusion ...................................................................................................53
8. A non-coplanar three-field box technique (3FB) to treat cerebral tumors...........54
8.1. Introduction .................................................................................................54
8.2. Method and materials ..................................................................................55
8.3. Results .........................................................................................................56
8.4. Conclusion ...................................................................................................57
9. Modern 3D conformal craniospinal radiotherapy planning method ....................58
9.1. Introduction .................................................................................................58
9.2. Methods and materials.................................................................................58
9.3. Results .........................................................................................................62
9.4. Discussion....................................................................................................65
9.5. Conclusion ...................................................................................................66
10. General conclusions .............................................................................................67
11. Bibliography.........................................................................................................68
12. Summary ..............................................................................................................79

4
12.1. CONKISS: Conformal Kidneys Sparing 3D non-coplanar radiotherapy
treatment for pancreatic cancer as an alternative to IMRT ...........................79
12.2. CONRES: Conformal Rectum Sparing 3D non-coplanar radiotherapy
treatment for prostate cancer as an alternative to IMRT...............................80
12.3. Modern 3D conformal craniospinal radiotherapy planning method ........81
13. Publications and conference abstracts catalog .....................................................82
13.1. Publications...............................................................................................82
13.2. Conference abstracts.................................................................................83
14. Acknowledgements ..............................................................................................84
5
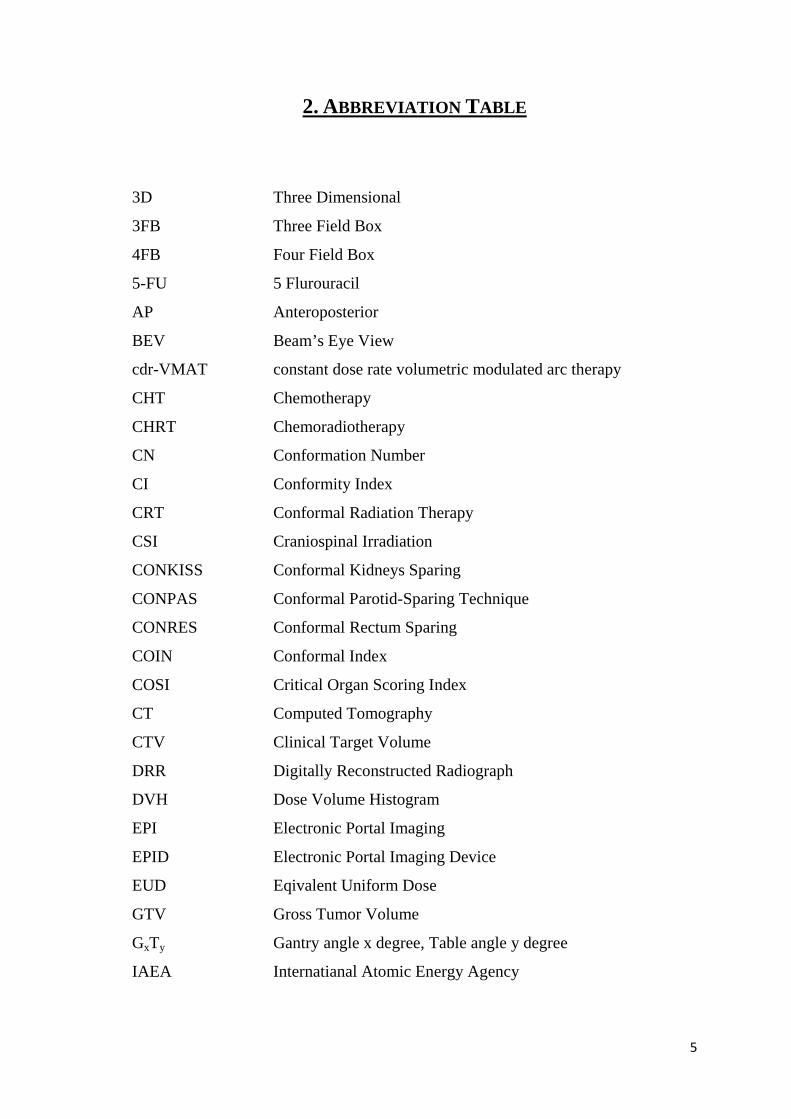
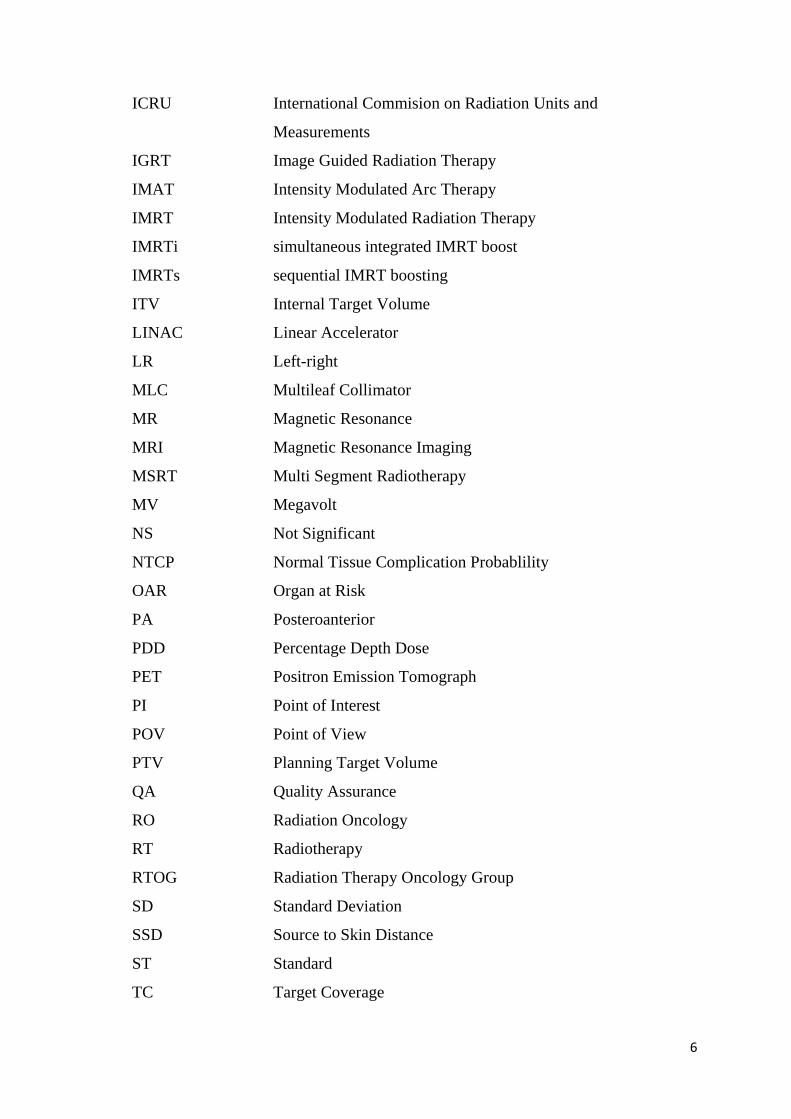
2. ABBREVIATION TABLE
3D Three Dimensional
3FB Three Field Box
4FB Four Field Box
5-FU 5 Flurouracil
AP Anteroposterior
BEV Beam’s Eye View
cdr-VMAT constant dose rate volumetric modulated arc therapy
CHT Chemotherapy
CHRT Chemoradiotherapy
CN Conformation Number
CI Conformity Index
CRT Conformal Radiation Therapy
CSI Craniospinal Irradiation
CONKISS Conformal Kidneys Sparing
CONPAS Conformal Parotid-Sparing Technique
CONRES Conformal Rectum Sparing
COIN Conformal Index
COSI Critical Organ Scoring Index
CT Computed Tomography
CTV Clinical Target Volume
DRR Digitally Reconstructed Radiograph
DVH Dose Volume Histogram
EPI Electronic Portal Imaging
EPID Electronic Portal Imaging Device
EUD Eqivalent Uniform Dose
GTV Gross Tumor Volume
GxTy Gantry angle x degree, Table angle y degree
IAEA Internatianal Atomic Energy Agency
6
ICRU International Commision on Radiation Units and
Measurements
IGRT Image Guided Radiation Therapy
IMAT Intensity Modulated Arc Therapy
IMRT Intensity Modulated Radiation Therapy
IMRTi simultaneous integrated IMRT boost
IMRTs sequential IMRT boosting
ITV Internal Target Volume
LINAC Linear Accelerator
LR Left-right
MLC Multileaf Collimator
MR Magnetic Resonance
MRI Magnetic Resonance Imaging
MSRT Multi Segment Radiotherapy
MV Megavolt
NS Not Significant
NTCP Normal Tissue Complication Probablility
OAR Organ at Risk
PA Posteroanterior
PDD Percentage Depth Dose
PET Positron Emission Tomograph
PI Point of Interest
POV Point of View
PTV Planning Target Volume
QA Quality Assurance
RO Radiation Oncology
RT Radiotherapy
RTOG Radiation Therapy Oncology Group
SD Standard Deviation
SSD Source to Skin Distance
ST Standard
TC Target Coverage
7
TCP Tumor Control Probablility
TP Treatment Planning
TPS Treatment Planning System
WB Wedged Beam
Vx(%) percentage of total volume receiving x Gy
vdr-VMAT variable dose rate Volumetric Modulated Arc Therapy
VMAT Volumetric Modulated Arc Therapy
WEDDE Wedge Direction Determination
WBRT Whole Brain Radiation Therapy
8
3. GENERAL INTRODUCTION
An average 65 000 new cases of malignant tumor are diagnosed in Hungary
every year (1). That is why the irradiation treatment quality of these patients is a
very important issue.
The goal of radiation therapy is to irradiate tumor-bearing tissues while
sparing normal structures. Specifically, we would like to deliver a dose of radiation
to tumor cells that is large enough to produce cell kill at a sufficiently high
probability level to control malignant disease, while at the same time limiting the
dose to uninvolved surrounding tissues so that the probability of inducing damage to
these tissues is kept to a minimum. In external-beam radiation therapy, in which
beams of radiation necessarily traverse normal tissues in order to treat tumor-bearing
anatomic sites, this goal is often difficult. At dose levels at which tumor control
becomes reasonably probable, normal tissue damage becomes a serious
consideration (2).
A major constraint in the treatment of cancer using radiation is the limitation
in the dose that can be delivered to the tumor because of the dose tolerance of the
critical normal tissues surrounding or near the target volume (3).
The main distinction between treatment planning of 3-D CRT and that of
conventional radiation therapy is that the former requires the availability of 3-D
anatomic information and a treatment-planning system that allows optimization of
dose distribution in accordance with the clinical objectives (4).
It should be recognized that 3-D CRT is not a new modality of treatment, nor
is it synonymous with better results than successful and well-tested conventional
radiation therapy. Its superiority rests entirely on how accurate the PTV is and how
much better the dose distribution is. So, instead of calling it a new modality, it
should be considered as a superior tool for treatment planning with a potential of
achieving better results (4).
Three-dimensional treatment planning systems (3DTPS) have been
commercially available since the early 1990's and three-dimensional conformal
radiation therapy (3-D CRT) is now firmly in place as the standard of practice. In

9
addition, advances in radiation treatment-delivery technology continue and medical
linear accelerators come equipped with sophisticated computer-controlled multileaf
collimator systems (MLCs) and integrated volumetric imaging systems that provide
beam aperture and/or beam-intensity modulation capabilities that allow precise
shaping and positioning of the patient's dose distributions (3).
3.1. THREE-DIMENSIONAL (3D) CONFORMAL RADIOTHERAPY PLANNING PROCEDURE
Forward-based 3D planning for conformal therapy typically involves a series
of procedures summarized in Table 1; these include establishing the patient's
treatment position (including constructing a patient repositioning immobilization
device when needed), obtaining a volumetric image dataset of the patient in
treatment position, contouring target volume(s) and critical normal organs using the
volumetric planning image dataset, determining beam orientation and designing
beam MLC leaf settings, computing a 3D dose distribution according to the dose
prescription, evaluating the treatment plan, and, if needed, modifying the plan (e.g.,
beam orientations, apertures, weights) until an acceptable plan is approved by the
radiation oncologist. The approved plan must then be implemented on the treatment
machine and the patient's treatment verified using appropriate quality assurance
(QA) procedures. All of these tasks make up the forward-planned conformal therapy
process (3).
Table 1. Three-Dimensional Treatment Planning Process
Step 1: Patient positioning and immobilization
• Construct patient repositioning/immobilization device
• Establish patient reference marks/patient coordinate system
Step 2: Image acquisition and input
• Acquire/input CT into three-dimensional radiation therapy treatment
planning system.
Step 3: Anatomy definition
• Geometrically register all input data (such as CT, MR, PET)
• Define and display contours and surfaces for organs at risk

10
• Define and display contours and surfaces for target volumes
• Generate electron density representation from CT or from assigned bulk
density information
Step 4: Dose prescription
• Specify dose prescription for planning target volume(s)
• Specify dose tolerances for organs at risk
Step 5: Beam technique
• Determine beam arrangements (using beam's-eye-view and room's-eye-view
displays)
• Design field shape (multileaf collimator leaf settings)
• Determine beam modifiers (wedges, partial transmission blocks, segments)
• Determine beam weighting
Step 6: Dose calculations
• Select dose-calculation algorithm and calculation grid
• Input dose prescription
• Perform dose calculations
• Set relative and absolute dose normalizations
Step 7: Plan evaluation/improvement
• Generate two- and three-dimensional isodose displays
• Generate dose-volume histograms
• Perform visual DVH and isodose comparisons
• Use automated optimization tools if available
• Modify plan based on evaluation of the dose distribution
Step 8: Plan review and documentation
• Perform overall review of all aspects of plan and obtain physician approval
• Generate hard copy output including digitally reconstructed radiographs
Step 9: Plan implementation and verification
• Transfer plan parameters into treatment machine (preferably to a record-and-
verify system)
• Set up (register) the real patient according to plan (verification simulation
optional)
• Perform patient treatment QA checks including independent check of
11
monitor units
CT, computed tomography; MR, magnetic resonance; DVH, dose-volume
histogram; QA, quality assurance.
3.1.1. Step 1 – Patient positioning and immobilization
Ensuring accurate daily positioning of the patient in the treatment position
and reduction of patient movement during treatment is essential to deliver the
prescribed dose and achieve the planned dose distribution. The reproducibility
achievable in the daily positioning of a patient for treatment depends on several
factors other than the anatomic site under treatment, including the patient's age,
general health, and weight (3).
3.1.2. Step 2 – Image acquisition and input
Modern anatomic imaging technologies, such as x-ray computed tomography
(CT) and magnetic resonance imaging (MRI) provide a fully three-dimensional
model of the cancer patient's anatomy, which is often complemented with functional
imaging, such as positron emission tomography (PET) or magnetic resonance
spectroscopy. Such advanced imaging now allows the radiation oncologist to more
accurately identify tumor volumes and their relationship with other critical normal
organs (3).
The CT scan must be performed with the patient in the treatment position, as
determined in the preplanning step. Radiopaque markers are typically placed on the
patient's skin and the immobilization device to serve as fiducial marks to assist in
any coordinate transformation needed as a result of 3D planning and eventual plan
implementation (3).
12
3.1.3 Step 3 – Anatomy definition
The anatomic information is usually obtained in the form of closely spaced
transverse images, which can be processed to reconstruct anatomy in any plane, or
in three dimensions. Depending on the imaging modality, visible tumor, critical
structures, and other relevant landmarks are outlined slice-by-slice. The radiation
oncologist draws the target volumes in each slice with appropriate margins to
include visible tumor, the suspected tumor spread, and patient motion uncertainties.
This process of delineating targets and relevant anatomic structures is called
segmentation (4).
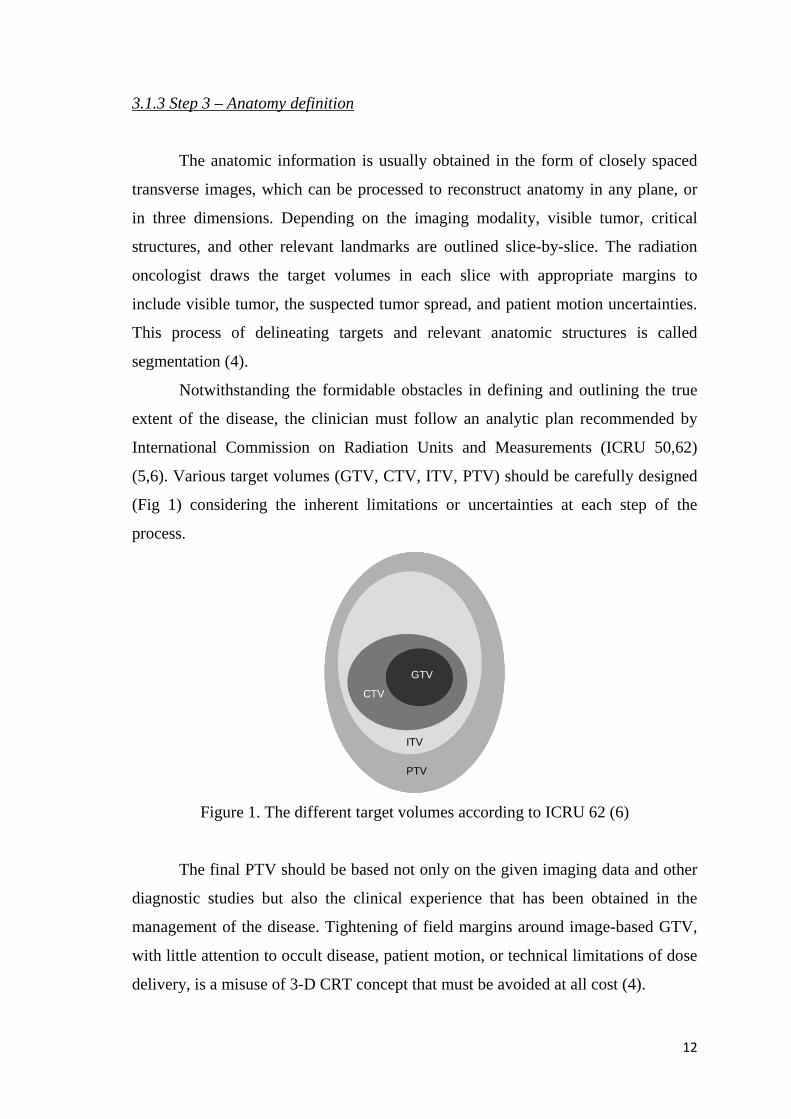
Notwithstanding the formidable obstacles in defining and outlining the true
extent of the disease, the clinician must follow an analytic plan recommended by
International Commission on Radiation Units and Measurements (ICRU 50,62)
(5,6). Various target volumes (GTV, CTV, ITV, PTV) should be carefully designed
(Fig 1) considering the inherent limitations or uncertainties at each step of the
process.
GTV
CTV
ITV
PTV
GTV
CTV
ITV
PTV
GTV
CTV
ITV
PTV
GTV
CTV
ITV
PTV
Figure 1. The different target volumes according to ICRU 62 (6)
The final PTV should be based not only on the given imaging data and other
diagnostic studies but also the clinical experience that has been obtained in the
management of the disease. Tightening of field margins around image-based GTV,
with little attention to occult disease, patient motion, or technical limitations of dose
delivery, is a misuse of 3-D CRT concept that must be avoided at all cost (4).
13
If any part of the diseased tissue is missed or seriously understood, it will
inevitably result in failure despite all the care and effort expended in treatment
planning, treatment delivery, and quality assurance. From the TCP point of view,
accuracy in localization of CTV is more critical in 3-D CRT than in techniques that
use generously wide fields and simpler beam arrangements to compensate for the
uncertainty in tumor localization (4).
Patient motion, including that of tumor volume, critical organs and external
fiducial marks during imaging, simulation, and treatment, can give rise to systematic
as well as random errors that must be accounted for when designing the planning
target volume (PTV).
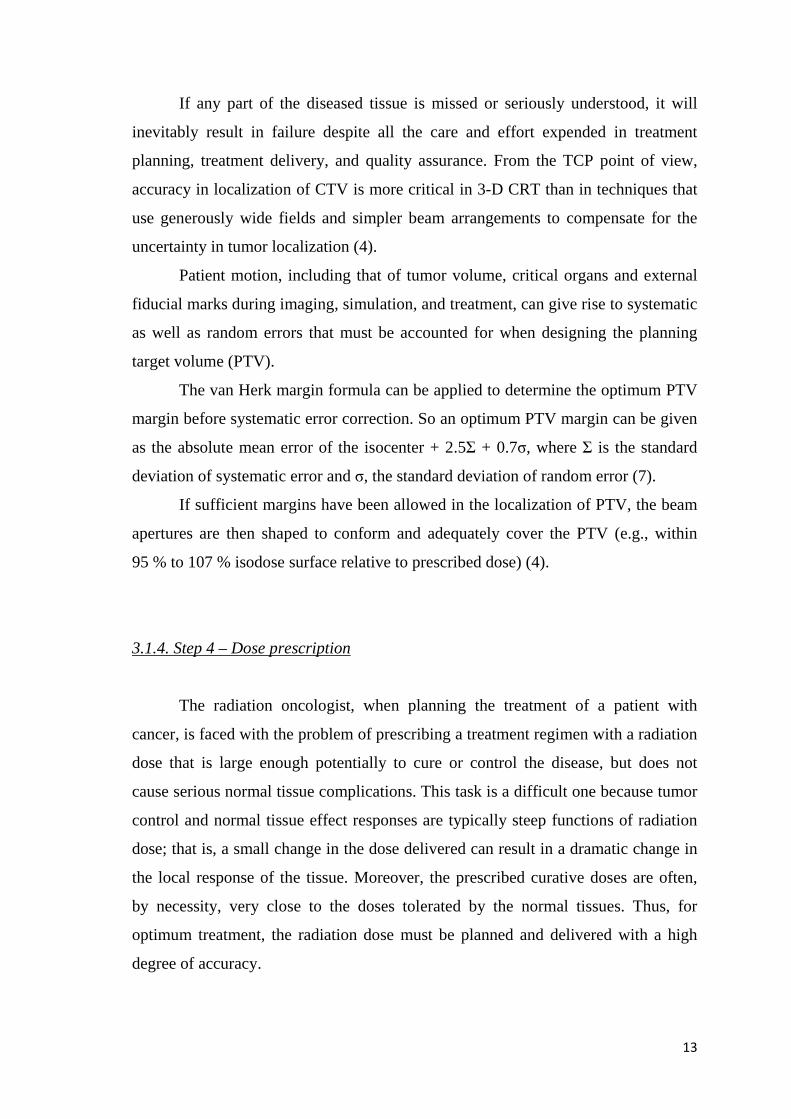
The van Herk margin formula can be applied to determine the optimum PTV
margin before systematic error correction. So an optimum PTV margin can be given
as the absolute mean error of the isocenter + 2.5Σ + 0.7σ, where Σ is the standard
deviation of systematic error and σ, the standard deviation of random error (7).
If sufficient margins have been allowed in the localization of PTV, the beam
apertures are then shaped to conform and adequately cover the PTV (e.g., within
95 % to 107 % isodose surface relative to prescribed dose) (4).
3.1.4. Step 4 – Dose prescription
The radiation oncologist, when planning the treatment of a patient with
cancer, is faced with the problem of prescribing a treatment regimen with a radiation
dose that is large enough potentially to cure or control the disease, but does not
cause serious normal tissue complications. This task is a difficult one because tumor
control and normal tissue effect responses are typically steep functions of radiation
dose; that is, a small change in the dose delivered can result in a dramatic change in
the local response of the tissue. Moreover, the prescribed curative doses are often,
by necessity, very close to the doses tolerated by the normal tissues. Thus, for
optimum treatment, the radiation dose must be planned and delivered with a high
degree of accuracy.
14
The frequently used tolerance doses for these organs are not absolute, and larger
doses are sometimes given to fractional volumes of these organs (3, 8).
3.1.5. Step 5 – Beam technique
It is necessary to deliver higher doses to the tumor than to the surrounding
uninvolved tissue. This is accomplished by selectively targeting tumor volumes with
multiple radiation beams (2).
External photon beam radiotherapy is usually carried out with more than one
radiation beam in order to achieve a uniform dose distribution inside the target
volume and an as low dose as possible in healthy tissues surrounding the target.
ICRU Report No. 50 recommends a target dose uniformity within +7% and –5% of
the dose delivered to a well defined prescription point within the target (9).
Conformal treatment plans generally use an increased number of radiation
beams that are shaped to conform to the target volume. To improve the conformity
of the dose distribution, conventional beam modifiers (e.g., wedges, partial
transmission blocks, segments) are sometimes used. This forward planning approach
to 3DCRT is rapidly giving way to an inverse planning approach referred to as
intensity-modulated radiation therapy (IMRT), which can achieve even greater
conformity by optimally modulating the individual beamlets that make up the
radiation beams. IMRT dose distributions can be created to conform much more
closely to the target volume, particularly for those volumes having complex/concave
shapes, and shaped to avoid critical normal tissues in the irradiated volume. This
increased conformality results in IMRT treatments being much more sensitive to
geometric uncertainties than the two-dimensional or 3DCRT approaches, and has
spurred the development of treatment machines integrated with advanced volumetric
imaging capabilities, which is again pushing the edge of the frontiers in conformal
therapy practice from IMRT to what is now referred to as image-guided IMRT, or
simply image-guided radiation therapy (IGRT) (3).
BEV: type of display, called beam's-eye-view (BEV), which simulates the
treatment planner's viewing point from the perspective of the radiation source
15
looking out along the axis of the radiation beam, similar to that obtained when
viewing a simulation radiograph (3).
Beam’s-eye-view (BEV) visualization of the delineated targets and other
structures. The term BEV denotes display of the segmented target and normal
structures in a plane perpendicular to the central axis of the beam, as if being viewed
from the vantage point of the radiation source. Using the BEV option, fields margins
(distance between field edged and the PTV outline) are set to cover the PTV
dosimetrically within a sufficiently high isodose level (e.g., greater than equal to
95 % of the prescribed dose) (4).
Optimization of a treatment plan requires not only the design of optimal field
apertures, but also appropriate beam directions, number of fields, beam weights, and
intensity modifiers (e.g., wedge, MLC, etc.) In a forward-planning system, these
parameters are selected iteratively or on a trial-and-error basis and therefore, for a
complex case, the whole process can become very labor intensive if a high degree of
optimization is desired. In practice, however, most planners start with a standard
technique and optimize it for the given patient using 3-D treatment-planning tools
such as BEV, 3-D dose displays, non-coplanar beam options, inensity modulation,
and dose-volume histograms (4).
One of the important features of 3-D CRT is that beam directions are chosen
and the beam MLC setting boundaries are defined according to 3-D based target and
anatomic information. Non-coplanar beam directions make available many more
choices of treatment technique. At present the beam’s eye view (BEV) projection is
the most prominent mechanism for interactively determining beam directions and
defining beam MLC settings (2).
By three-dimensional conformal radiotherapy (3D-CRT), I mean treatments
that are based on 3-D anatomic information and use dose distributions that conform
as closely as possible to the target volume in terms of adequate dose to the tumor
and minimum possible dose to normal tissue. The concept of conformal dose
distribution has also been extended to include clinical objectives such as maximizing
tumor control probability (TCP) and minimizing normal tissue complication
16
probability (NTCP). Thus, the 3D-CRT technique encompasses both the physical
and biologic rationales in achieving the desired clinical results (4).
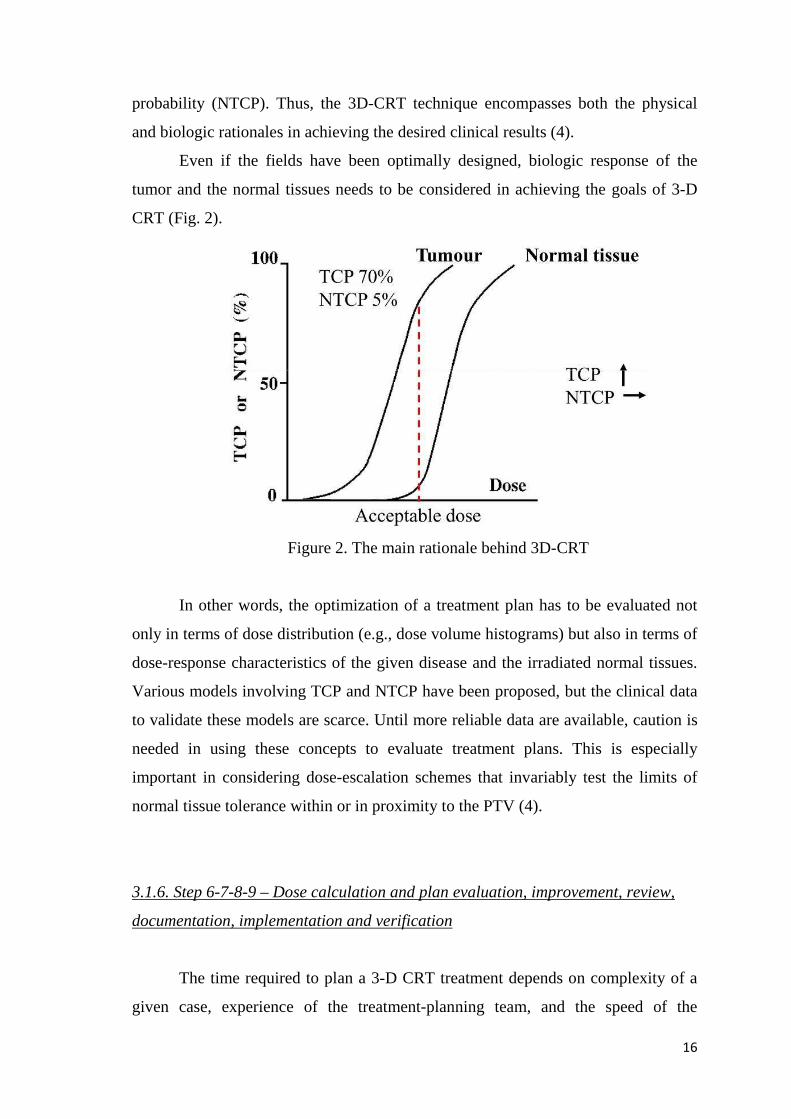
Even if the fields have been optimally designed, biologic response of the
tumor and the normal tissues needs to be considered in achieving the goals of 3-D
CRT (Fig. 2).
Figure 2. The main rationale behind 3D-CRT
In other words, the optimization of a treatment plan has to be evaluated not
only in terms of dose distribution (e.g., dose volume histograms) but also in terms of
dose-response characteristics of the given disease and the irradiated normal tissues.
Various models involving TCP and NTCP have been proposed, but the clinical data
to validate these models are scarce. Until more reliable data are available, caution is
needed in using these concepts to evaluate treatment plans. This is especially
important in considering dose-escalation schemes that invariably test the limits of
normal tissue tolerance within or in proximity to the PTV (4).
3.1.6. Step 6-7-8-9 – Dose calculation and plan evaluation, improvement, review,
documentation, implementation and verification
The time required to plan a 3-D CRT treatment depends on complexity of a
given case, experience of the treatment-planning team, and the speed of the
17
treatment-planning system. The final product, the treatment plan, is as good as its
individual components, namely, the quality of input patient data, image
segmentation, image registration, field apertures, dose computation, plan evaluation,
and plan optimization (4).
Despite considerable progress in improving the accuracy and precision of
radiation therapy, many sources of uncertainty remain. These include the limitations
of imaging devices to reveal the true extent of the disease, displacement of the
internal anatomy at the time of treatment relative to its position at the time of
imaging, motion of patient and internal organs during treatment, variation of
response to dose from one patient to the next, intratumor variation in response,
dosimetric inaccuracies, and so on. These are complex problems, but a reduction in
uncertainties is essential for the accumulation of more accurate data and for an
improvement of the state of the art of radiotherapy (2).
The concept of image guidance is not revolutionary, and really should be
viewed as an evolutionary component in the development of conformal therapy. In
the past, many systems and/or processes have been developed to help better localize
the patient for treatment (and hence conform the dose), including dedicated x-ray
simulators, megavoltage radiographic port films, electronic portal imaging devices,
implanted radiopaque markers, ultrasound imaging systems, and optical surface
tracking systems (3).
3.2. MOTIVATION AND CONCEPTS
The primary obstacles to achieve the maximum possible therapeutic
advantage in favour of the patient being treated with conventional radiotherapy are
the limitations of existing ST 3-D CRT methods to produce desirable radiation dose
distributions and to ensure that unacceptable normal tissue complications are
prevented (2).
3D-conformal radiotherapy planning techniques are still widely used in
places where either the treatment planning system, or the linear accelerator or the
dosimetry equipments are not allowing the implementation of IMRT and IMAT

18
advanced planning techniques. Applying them instead of 3-D CRT is not cost-
beneficial in many tumor-regions, even in places where these advanced techniques
are available.
19
4. MAIN OBJECTIVES
In many tumor regions (e.g. pancreas, prostate, cerebral, etc.) the use of ST
3-D CRT techniques are not allowing to treat the PTV with the prescription dose –
needed for adequate tumor control – homogeniously and at the same time spare
normal tissues to receive less dose than their tolerance limits.
So my aim was to reach better OAR sparing with same target coverage. That
could be made with IMRT, IMAT techniques, but for them a better (more precise
Isocenter) LINAC and dosimetry equipments are needed and a time-consuming QA
procedure. These are not available in many oncology centers, so dealing with this
problem is still an actual challenge.
Developing advanced more efficient conformal 3-D CRT planning methods
allows better OAR sparing at those places (still many) where a linear accelerator
(LINAC) and/or dosimetry equipments are not allowing the application of latest
IMRT and IMAT techniques. Secondly it can spare the time of additional QA
procedure needed for them.
My aim was to find new, but still 3D conformal planning methods to treat the
PTVs with at least the same homogeneity and conformity, meanwhile decrease the
dose to critical OARs receiving too high dose – similar to IMRT, but taking minimal
time and technical requirements.
My main concept was to use such beam directions, where from their BEV the
OAR – PTV positions are optimal, thus the least OAR areas are in their MLC
setting, meanwhile the PTV is sufficiently covered.
Finally a completely different challenge was the main problem of cranio-
spinal irradiation (CSI) – in between the matching of the fields.
20
5. WEDGE DIRECTION DETERMINATION (WEDDE)
ALGORITHM
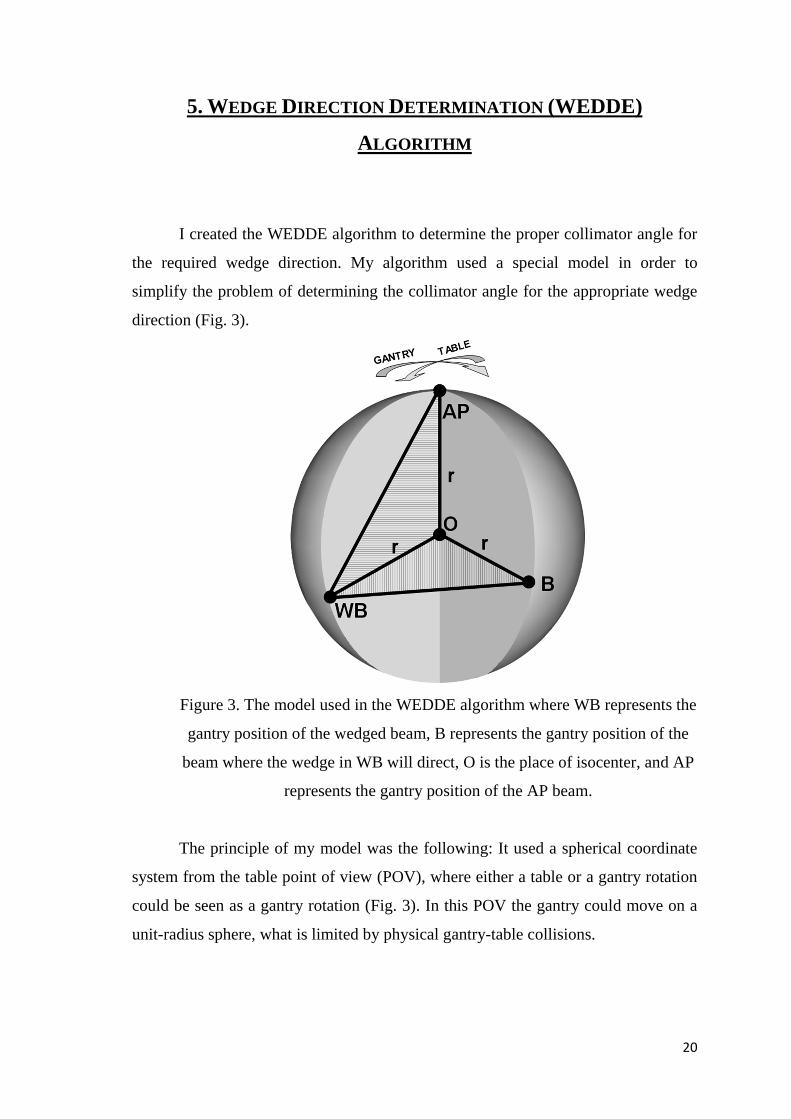
I created the WEDDE algorithm to determine the proper collimator angle for
the required wedge direction. My algorithm used a special model in order to
simplify the problem of determining the collimator angle for the appropriate wedge
direction (Fig. 3).
Figure 3. The model used in the WEDDE algorithm where WB represents the
gantry position of the wedged beam, B represents the gantry position of the
beam where the wedge in WB will direct, O is the place of isocenter, and AP
represents the gantry position of the AP beam.
The principle of my model was the following: It used a spherical coordinate
system from the table point of view (POV), where either a table or a gantry rotation
could be seen as a gantry rotation (Fig. 3). In this POV the gantry could move on a
unit-radius sphere, what is limited by physical gantry-table collisions.
21
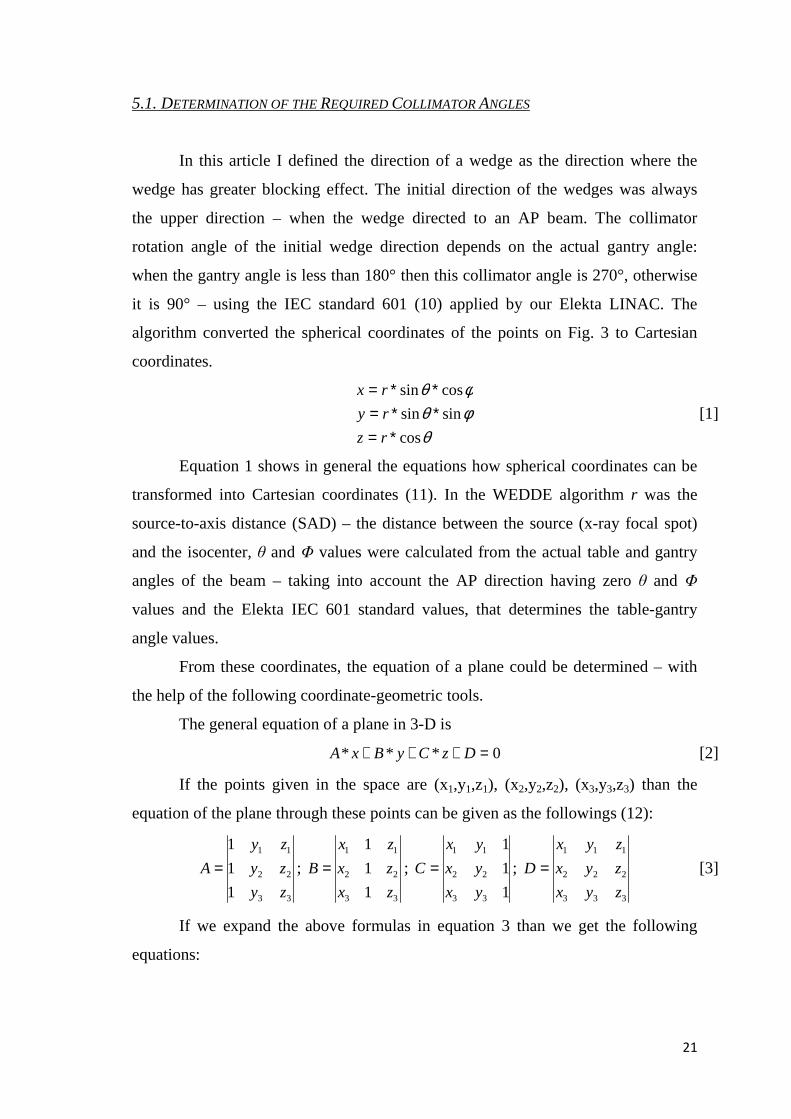
5.1. DETERMINATION OF THE REQUIRED COLLIMATOR ANGLES
In this article I defined the direction of a wedge as the direction where the
wedge has greater blocking effect. The initial direction of the wedges was always
the upper direction – when the wedge directed to an AP beam. The collimator
rotation angle of the initial wedge direction depends on the actual gantry angle:
when the gantry angle is less than 180° then this collimator angle is 270°, otherwise
it is 90° – using the IEC standard 601 (10) applied by our Elekta LINAC. The
algorithm converted the spherical coordinates of the points on Fig. 3 to Cartesian
coordinates.
θφθφθ
cos
sinsin
cossin
∗=∗∗=∗∗=
rz
ry
rx
[1]
Equation 1 shows in general the equations how spherical coordinates can be
transformed into Cartesian coordinates (11). In the WEDDE algorithm r was the
source-to-axis distance (SAD) – the distance between the source (x-ray focal spot)
and the isocenter, θ and Φ values were calculated from the actual table and gantry
angles of the beam – taking into account the AP direction having zero θ and Φ
values and the Elekta IEC 601 standard values, that determines the table-gantry
angle values.
From these coordinates, the equation of a plane could be determined – with
the help of the following coordinate-geometric tools.
The general equation of a plane in 3-D is
0*** =+++ DzCyBxA [2]
If the points given in the space are (x1,y1,z1), (x2,y2,z2), (x3,y3,z3) than the
equation of the plane through these points can be given as the followings (12):
33
22
11
1
1
1
zy
zy
zy
A = ;
33
22
11
1
1
1
zx
zx
zx
B = ;
1
1
1
33
22
11
yx
yx
yx
C = ;
333
222
111
zyx
zyx
zyx
D = [3]
If we expand the above formulas in equation 3 than we get the following
equations:

22
)()()(
)()()(
)()()(
)()()(
122133113223321
213132321
213132321
213132321
zyzyxzyzyxzyzyxD
yyxyyxyyxC
xxzxxzxxzB
zzyzzyzzyA
∗−∗∗+∗−∗∗+∗−∗∗=−∗+−∗+−∗=
−∗+−∗+−∗=−∗+−∗+−∗=
[4]
If we have the following two planes:
0
0
2222
1111
=+++=+++
DCBA
DCBA [5]
Then the dihedral angle (the angle between these two planes) can be
determined with the following formula (13):
22
22
22
21
21
21
212121cosCBACBA
CCBBAA
++∗++∗+∗+∗=α [6]
So using this formula I determined the equation of the two planes defined by
points AP, O, WB and O, WB, B (Fig. 3). This dihedral angle (equation 6) was the
required collimator rotation angle to direct the wedge to another beam. Using these
principles my algorithm determined the exact collimator angle in all the four lateral
fields. This method can be efficiently applied in many treatment planning situations.
23
6. CONK ISS: CONFORMAL K IDNEYS SPARING 3D NON-
COPLANAR RADIOTHERAPY TREATMENT
FOR PANCREATIC CANCER AS AN ALTERNATIVE TO IMRT
6.1. INTRODUCTION
Pancreatic cancer is the fourth leading cause of cancer mortality in the
western world (14) and in the United States too, where an estimated 37,680 deaths
are attributed to this disease in 2008 (15). About 80-85 % of these patients have an
inoperable disease at the time of diagnosis. Approximately 50 % of these patients
are classified as having locally advanced unresectable pancreatic cancer without
evidence of radiographically apparent extrapancreatic metastases. The optimal
strategy for treating these patients is still controversial because this disease is not
curable using the existing treatment techniques. This reflects the aggressiveness of
this disease and the inherent resistance to chemotherapy (CHT) and radiotherapy
(RT), the two modalities used to manage it (14, 16).
Several authors have already published the importance of different
chemotherapies used as a part of a chemoradiotherapy (CHRT) treatment of patients
present with unresectable, locally advanced pancreatic cancer (14, 17-20).
Considering these data, RT is widely used as a part of the treatment strategy.
Delivering adequate radiation doses to the pancreas is limited by the presence of
radiation-sensitive normal structures in the upper abdomen. These include the
kidneys, liver, small bowels, stomach, and the spinal cord (19).
The 5-FU based CHT combined with the standard (ST) 3D conformal RT
treatment (3D-CRT) technique was used in our department (21). The disadvantage
of the ST technique is that the kidneys often receive higher mean dose than their
generally accepted tolerance limit. Is there a way to reduce the too high dose to the
kidneys? With Intensity-Modulated RT (IMRT) techniques the dose to the kidneys
could be significantly reduced (22). My aim was to find a conformal treatment
24
technique that delivers lower dose to the kidneys than their tolerance limit – similar
to IMRT, but taking minimal time and technical requirements.
6.2. METHODS AND MATERIALS
Between February 2005 and August 2008, consecutive 23 patients in our
department with locally advanced, unresectable pancreatic cancer were treated with
standard 3D conformal RT treatment (3D-CRT) technique (ST) (21). The patient
immobilization was done using individual vacuum cushion in supine position.
During RT procedure 10 mm increment computer tomography (CT) scans were
taken with a Siemens Somatom CT (Siemens, Erlangen, Germany) scanner and
transferred to the Precise Plan treatment planning system (TPS) (Elekta,
PrecisePLAN 2.02/2.03, Atlanta GA, USA). The prescribed dose was 45 Gy to the
PTV in 1.8 Gy per fractions. During the planning process the ICRU 50, 62
recommendations were followed (5, 6).
6.2.1. Contouring
First the primary gross tumor volume (GTV) and the clinical target volume
(CTV) were defined. Organ motion and set-up errors were also considered, thus the
planning target volume (PTV) was defined as CTV with a uniform margin of
15 mm. The clinically uninvolved regional lymphatics were not included into any of
the target volumes. As organs at risk (OAR), the kidneys, liver, small bowels, and
spinal cord were contoured on all CT images.
Planning priorities and OAR tolerance dose limits
Main priority was to deliver the 45 Gy prescribed mean dose to the PTV
homogeneously. Secondly to keep the OAR’s mean doses and relative volume doses
below their tolerance limits (19,22-24) (Table 2). The kidney and the spinal cord
limit were respected with higher priority within the OARs.
25
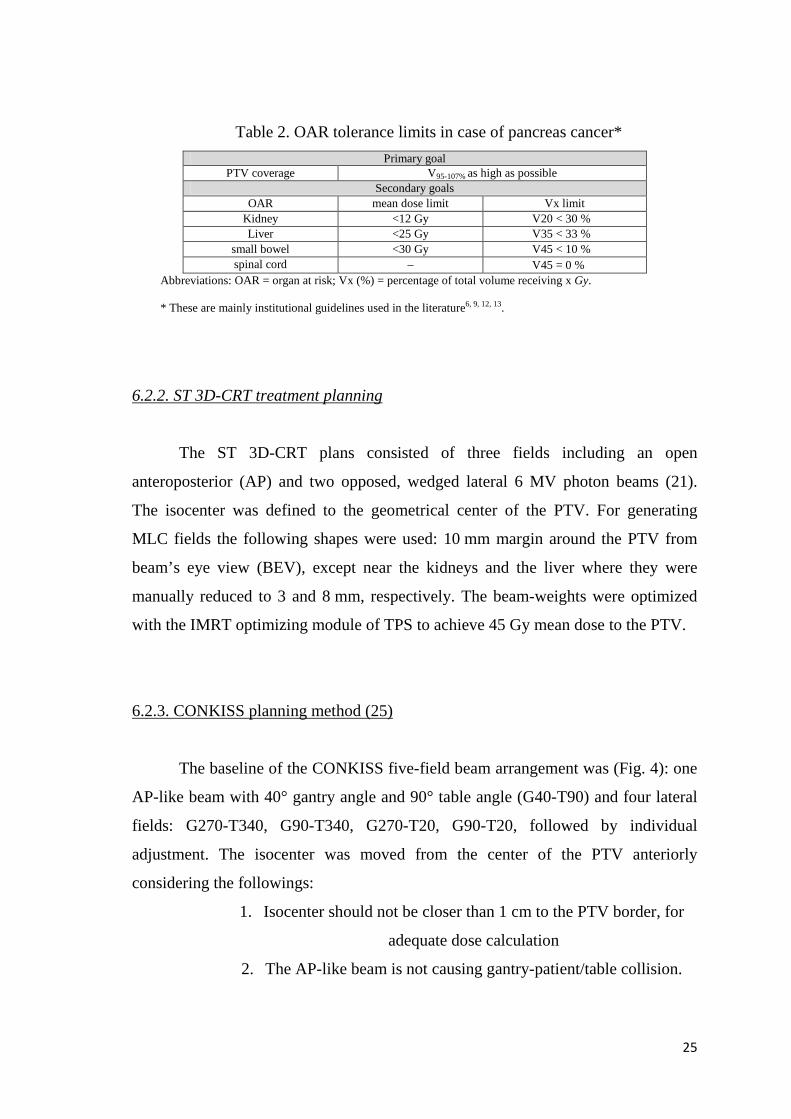
Table 2. OAR tolerance limits in case of pancreas cancer*
Primary goal PTV coverage V95-107% as high as possible
Secondary goals OAR mean dose limit Vx limit
Kidney <12 Gy V20 < 30 % Liver <25 Gy V35 < 33 %
small bowel <30 Gy V45 < 10 % spinal cord – V45 = 0 %
Abbreviations: OAR = organ at risk; Vx (%) = percentage of total volume receiving x Gy.
* These are mainly institutional guidelines used in the literature6, 9, 12, 13.
6.2.2. ST 3D-CRT treatment planning
The ST 3D-CRT plans consisted of three fields including an open
anteroposterior (AP) and two opposed, wedged lateral 6 MV photon beams (21).
The isocenter was defined to the geometrical center of the PTV. For generating
MLC fields the following shapes were used: 10 mm margin around the PTV from
beam’s eye view (BEV), except near the kidneys and the liver where they were
manually reduced to 3 and 8 mm, respectively. The beam-weights were optimized
with the IMRT optimizing module of TPS to achieve 45 Gy mean dose to the PTV.
6.2.3. CONKISS planning method (25)
The baseline of the CONKISS five-field beam arrangement was (Fig. 4): one
AP-like beam with 40° gantry angle and 90° table angle (G40-T90) and four lateral
fields: G270-T340, G90-T340, G270-T20, G90-T20, followed by individual
adjustment. The isocenter was moved from the center of the PTV anteriorly
considering the followings:
1. Isocenter should not be closer than 1 cm to the PTV border, for
adequate dose calculation
2. The AP-like beam is not causing gantry-patient/table collision.
26
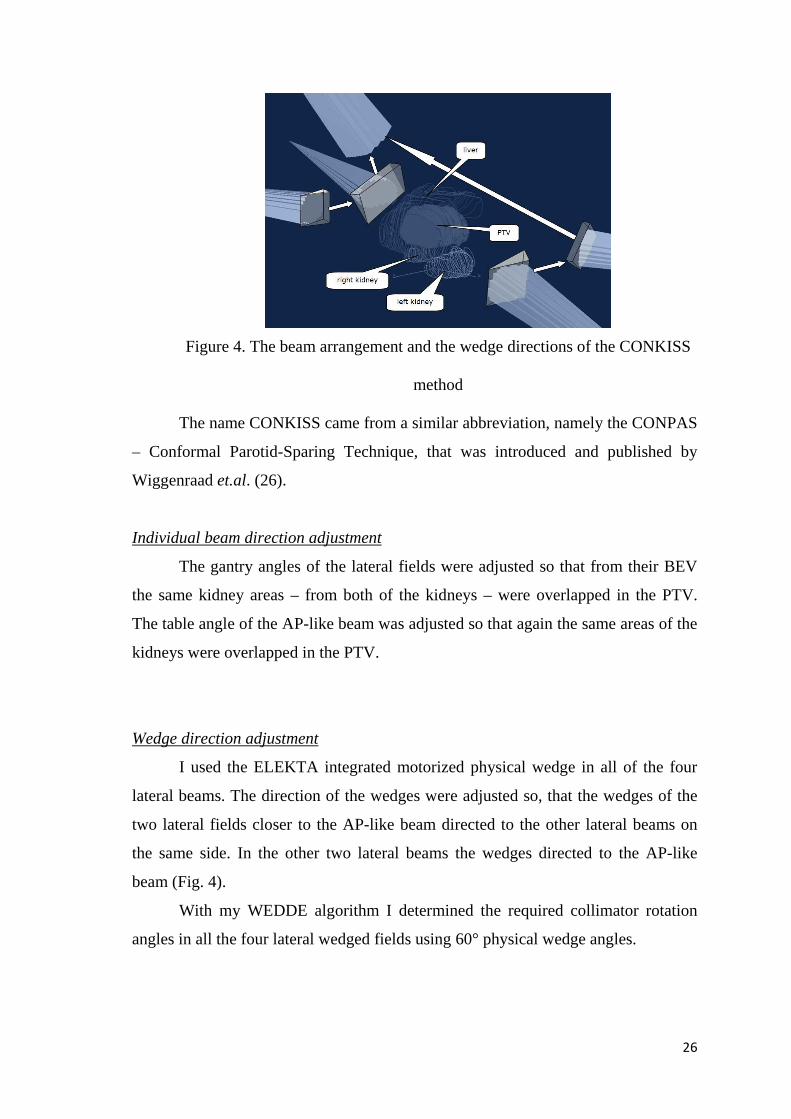
Figure 4. The beam arrangement and the wedge directions of the CONKISS
method
The name CONKISS came from a similar abbreviation, namely the CONPAS
– Conformal Parotid-Sparing Technique, that was introduced and published by
Wiggenraad et.al. (26).
Individual beam direction adjustment
The gantry angles of the lateral fields were adjusted so that from their BEV
the same kidney areas – from both of the kidneys – were overlapped in the PTV.
The table angle of the AP-like beam was adjusted so that again the same areas of the
kidneys were overlapped in the PTV.
Wedge direction adjustment
I used the ELEKTA integrated motorized physical wedge in all of the four
lateral beams. The direction of the wedges were adjusted so, that the wedges of the
two lateral fields closer to the AP-like beam directed to the other lateral beams on
the same side. In the other two lateral beams the wedges directed to the AP-like
beam (Fig. 4).
With my WEDDE algorithm I determined the required collimator rotation
angles in all the four lateral wedged fields using 60° physical wedge angles.
27
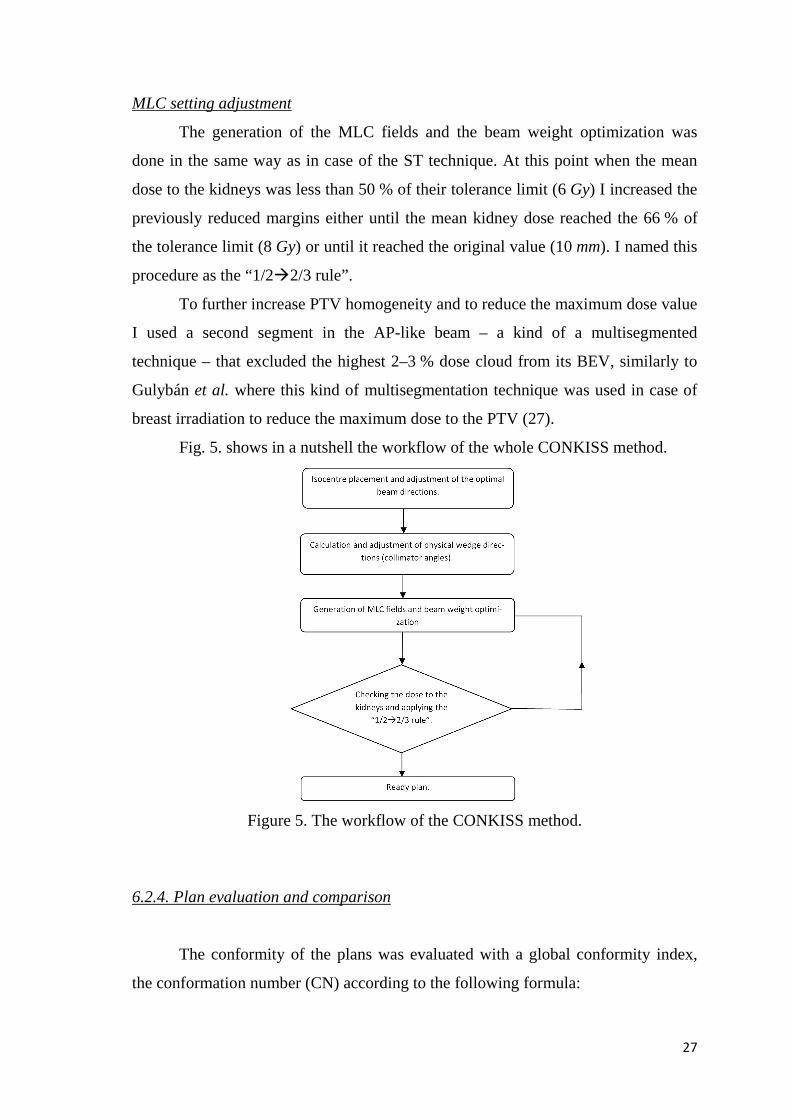
MLC setting adjustment
The generation of the MLC fields and the beam weight optimization was
done in the same way as in case of the ST technique. At this point when the mean
dose to the kidneys was less than 50 % of their tolerance limit (6 Gy) I increased the
previously reduced margins either until the mean kidney dose reached the 66 % of
the tolerance limit (8 Gy) or until it reached the original value (10 mm). I named this
procedure as the “1/2�2/3 rule”.
To further increase PTV homogeneity and to reduce the maximum dose value
I used a second segment in the AP-like beam – a kind of a multisegmented
technique – that excluded the highest 2–3 % dose cloud from its BEV, similarly to
Gulybán et al. where this kind of multisegmentation technique was used in case of
breast irradiation to reduce the maximum dose to the PTV (27).
Fig. 5. shows in a nutshell the workflow of the whole CONKISS method.
Figure 5. The workflow of the CONKISS method.
6.2.4. Plan evaluation and comparison
The conformity of the plans was evaluated with a global conformity index,
the conformation number (CN) according to the following formula:

28
PI
PIT
T
PIT
V
V
V
VCN ,, ×= [7]
where VT,PI is the volume of PTV receiving at least the prescription dose, VPI is the
volume enclosed by the prescription isodose, and VT is the PTV (28, 29).
The homogeneity was evaluated in two different ways using the cumulative
dose volume histogram (DVH): First according to ICRU 50, 62 recommendations
(5, 6), where the V95-107% represents the percentage of PTV that receives more than
95 % and less than 107 % of the prescribed dose. Secondly the homogeneity was
evaluated with the D95-5% according to van Asselen et al. (30) with the following
formula:
PI
DDD %95%5
%595
−=− [8]
where D5%, and D95% were the doses received by 5 , and 95 % of the PTV volume
according to the DVH of the plans, respectively and PI is the prescribed isodose.
For the better comparison of the different planning techniques I used a
graphical representation of the conformity index (CI) and the critical organ scoring
index (COSI) according to Menhel et al. (31). According to Lomax and Schieb (32)
the definition of CI is:
PI
PIT
V
VCI ,= [9]
According to Weber et al. (33) for the CI I used not the prescription dose but just the
95 % of it because only the 95 % isodose cloud should cover the whole PTV
according to ICRU 50, 62 (5, 6). The definition of COSI is:
V
tolOAR
TC
VCOSI >−= )(1 [10]
where V(OAR)>tol is the fraction of volume of an OAR receiving more than the
tolerance dose, and TCV is the fraction of PTV volume covered by the prescription
dose.
As regards the OARs I evaluated the mean dose to the kidneys, liver and the
small bowels, the maximum dose to the spinal cord, the percentage of kidneys and
total kidney volumes receiving 20 Gy (V20), the percentage of liver receiving 35 Gy
(V35), and the percentage of small bowel receiving 45 Gy (V45) (19, 22). Similarly
to Kozak et al. I evaluated the doses to the OARs in percentage of the total mean
29
prescribed PTV dose too (34). The same way as Hsiung-Stripp DC et al. (35)
reported, I compared the two techniques by giving the OAR’s dose reductions in
percentages. So to compare the two techniques relative evaluation was performed
using the percentage OAR dose reduction values.
Statistical analyses
All data are presented in mean dose ± standard deviation and as percentage of
tolerance limit too. I made 2-tailed t significance tests to decide whether the
difference of the results between the ST and CONKISS planning technique are
significant. The 5 % probability level (p < 0.05) was considered to be statistical
significant.
6.3. RESULTS
6.3.1. PTV coverage
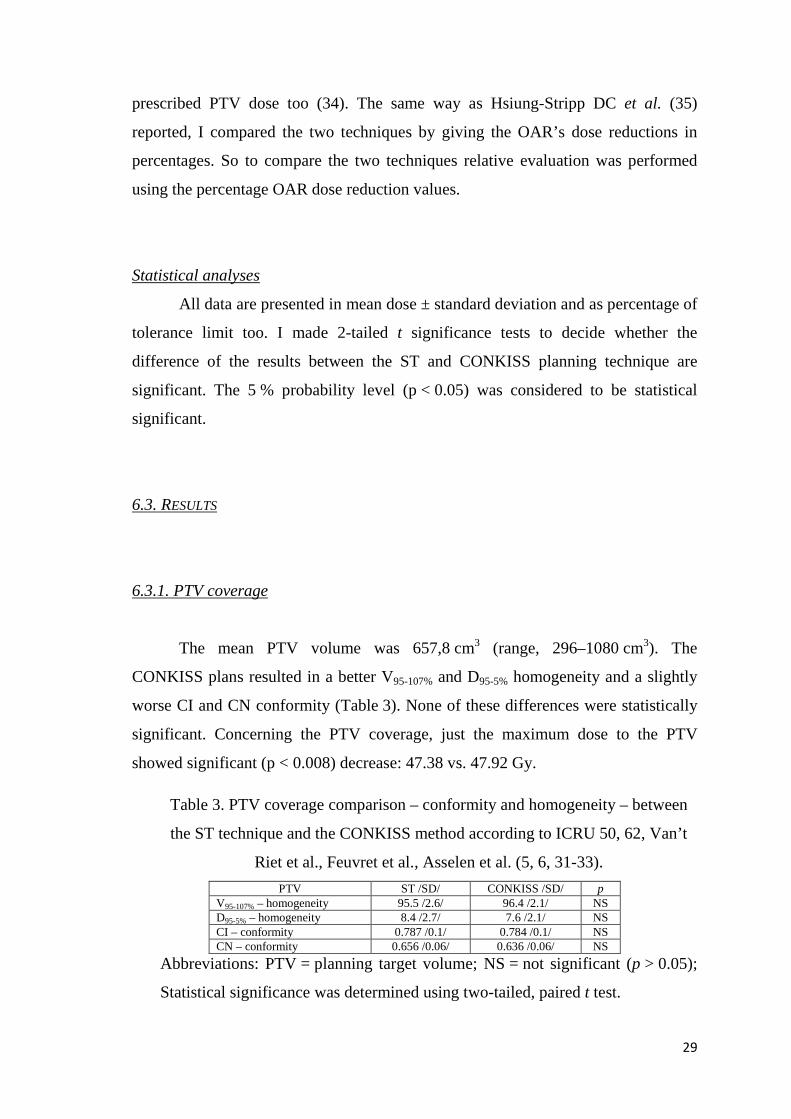
The mean PTV volume was 657,8 cm3 (range, 296–1080 cm3). The
CONKISS plans resulted in a better V95-107% and D95-5% homogeneity and a slightly
worse CI and CN conformity (Table 3). None of these differences were statistically
significant. Concerning the PTV coverage, just the maximum dose to the PTV
showed significant (p < 0.008) decrease: 47.38 vs. 47.92 Gy.
Table 3. PTV coverage comparison – conformity and homogeneity – between
the ST technique and the CONKISS method according to ICRU 50, 62, Van’t
Riet et al., Feuvret et al., Asselen et al. (5, 6, 31-33).
PTV ST /SD/ CONKISS /SD/ p V95-107% – homogeneity 95.5 /2.6/ 96.4 /2.1/ NS D95-5% – homogeneity 8.4 /2.7/ 7.6 /2.1/ NS CI – conformity 0.787 /0.1/ 0.784 /0.1/ NS CN – conformity 0.656 /0.06/ 0.636 /0.06/ NS
Abbreviations: PTV = planning target volume; NS = not significant (p > 0.05);
Statistical significance was determined using two-tailed, paired t test.
30
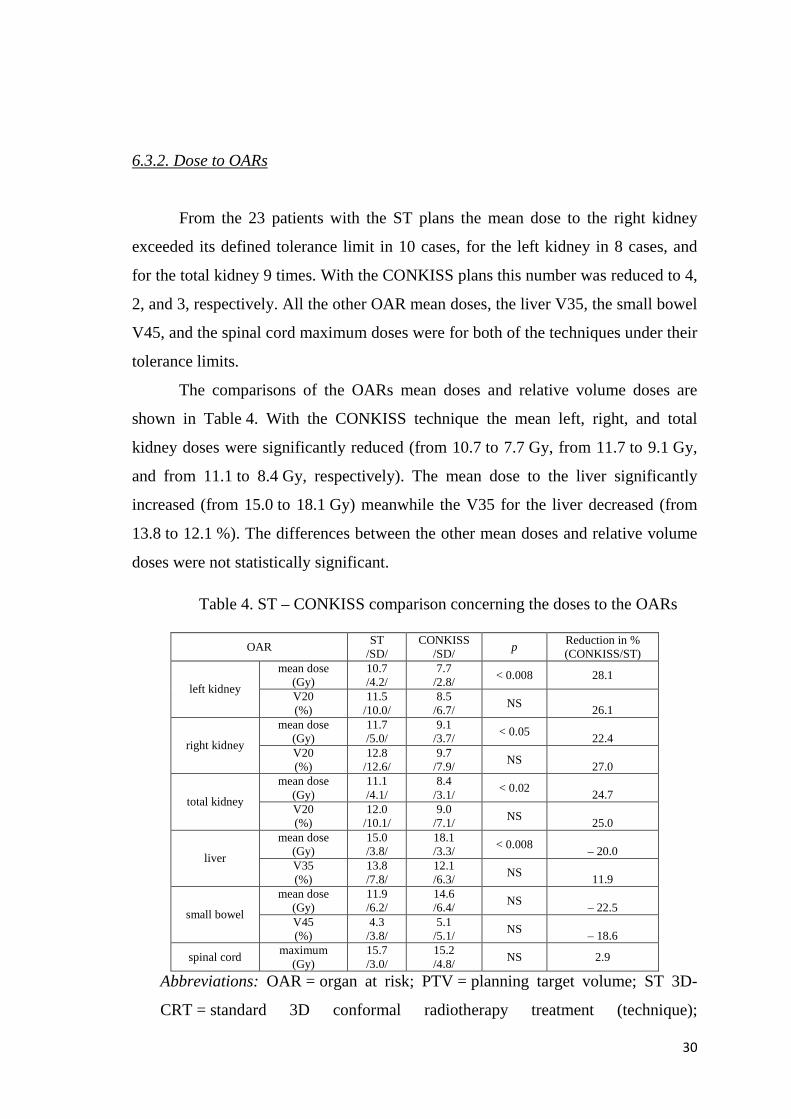
6.3.2. Dose to OARs
From the 23 patients with the ST plans the mean dose to the right kidney
exceeded its defined tolerance limit in 10 cases, for the left kidney in 8 cases, and
for the total kidney 9 times. With the CONKISS plans this number was reduced to 4,
2, and 3, respectively. All the other OAR mean doses, the liver V35, the small bowel
V45, and the spinal cord maximum doses were for both of the techniques under their
tolerance limits.
The comparisons of the OARs mean doses and relative volume doses are
shown in Table 4. With the CONKISS technique the mean left, right, and total
kidney doses were significantly reduced (from 10.7 to 7.7 Gy, from 11.7 to 9.1 Gy,
and from 11.1 to 8.4 Gy, respectively). The mean dose to the liver significantly
increased (from 15.0 to 18.1 Gy) meanwhile the V35 for the liver decreased (from
13.8 to 12.1 %). The differences between the other mean doses and relative volume
doses were not statistically significant.
Table 4. ST – CONKISS comparison concerning the doses to the OARs
OAR ST
/SD/ CONKISS
/SD/ p
Reduction in % (CONKISS/ST)
mean dose (Gy)
10.7 /4.2/
7.7 /2.8/
< 0.008 28.1 left kidney
V20 (%)
11.5 /10.0/
8.5 /6.7/
NS 26.1
mean dose (Gy)
11.7 /5.0/
9.1 /3.7/
< 0.05 22.4
right kidney V20 (%)
12.8 /12.6/
9.7 /7.9/
NS 27.0
mean dose (Gy)
11.1 /4.1/
8.4 /3.1/
< 0.02 24.7
total kidney V20 (%)
12.0 /10.1/
9.0 /7.1/
NS 25.0
mean dose (Gy)
15.0 /3.8/
18.1 /3.3/
< 0.008 – 20.0
liver V35 (%)
13.8 /7.8/
12.1 /6.3/
NS 11.9
mean dose (Gy)
11.9 /6.2/
14.6 /6.4/
NS – 22.5
small bowel V45 (%)
4.3 /3.8/
5.1 /5.1/
NS – 18.6
spinal cord maximum
(Gy) 15.7 /3.0/
15.2 /4.8/
NS 2.9
Abbreviations: OAR = organ at risk; PTV = planning target volume; ST 3D-
CRT = standard 3D conformal radiotherapy treatment (technique);
31
CONKISS = conformal kidneys sparing (method); Vx (%) = percentage of total
volume receiving x Gy; NS = not significant (p > 0.05); Statistical significance
was determined using two-tailed, paired t test.
With the CONKISS method the following mean dose reductions were
achieved: left kidney – 28.0 %, right kidney – 22.2 %, total kidney – 24.3 %. The
mean dose to the liver increased by 20.7 %. Concerning the relative volume doses
the reduction was 26.1, 24.2, 25.0, and 12.3 %, respectively (Table 4).
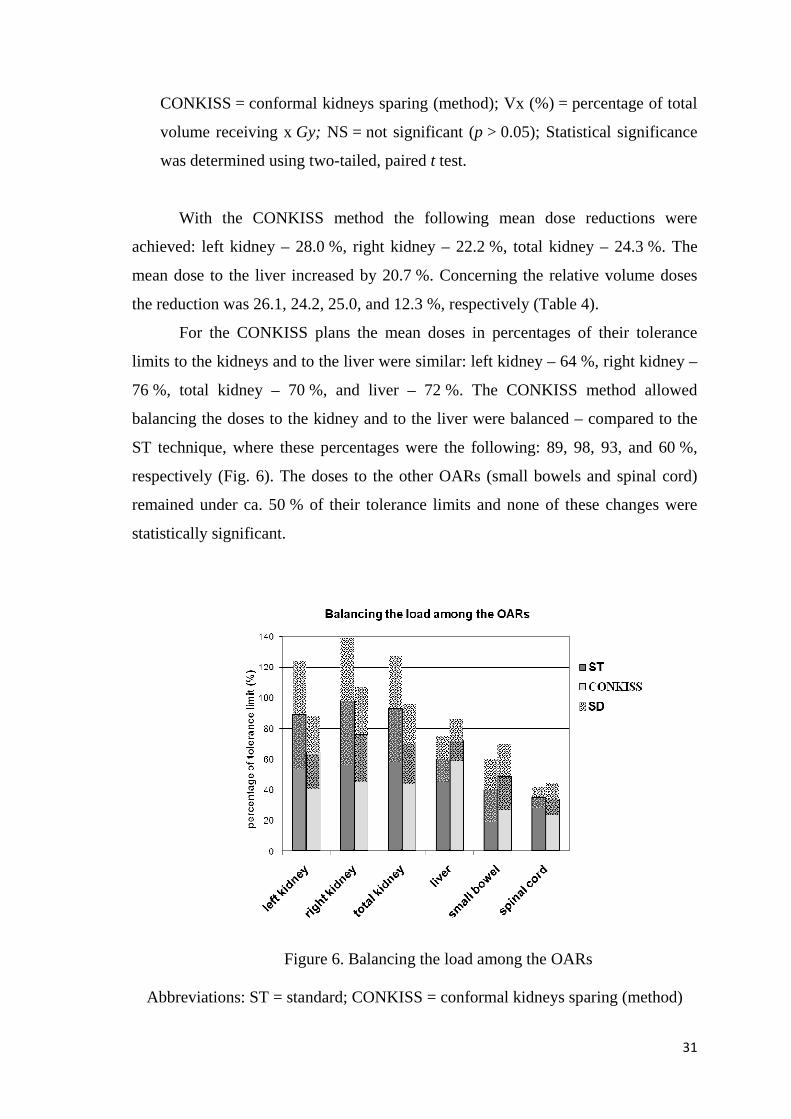
For the CONKISS plans the mean doses in percentages of their tolerance
limits to the kidneys and to the liver were similar: left kidney – 64 %, right kidney –
76 %, total kidney – 70 %, and liver – 72 %. The CONKISS method allowed
balancing the doses to the kidney and to the liver were balanced – compared to the
ST technique, where these percentages were the following: 89, 98, 93, and 60 %,
respectively (Fig. 6). The doses to the other OARs (small bowels and spinal cord)
remained under ca. 50 % of their tolerance limits and none of these changes were
statistically significant.
Figure 6. Balancing the load among the OARs
Abbreviations: ST = standard; CONKISS = conformal kidneys sparing (method)

32
The CONKISS plans were superior to the ST plans concerning the COSI
values for the different OARs – mainly for the doses to the OARs, meanwhile the CI
was just slightly better for the ST plans (Table 5).
Table 5. ST – CONKISS comparison concerning the COSI value
ST 3D-CRT CONKISS
CI 0.787 /SD: 0.100/ 0.784 /SD: 0.086/
COSI left kidney V20 0.879 /SD: 0.105/ 0.911 /SD: 0.072/
COSI right kidney V20 0.866 /SD: 0.132/ 0.906 /SD: 0.084/
COSI total kidney V20 0.874 /SD: 0.106/ 0.906 /SD: 0.076/
COSI liver V35 0.856 /SD: 0.080/ 0.875 /SD: 0.066/
Abbreviations: CI = conformity index; COSI = critical organ scoring index; ST
3D-CRT = standard 3D conformal radiotherapy treatment (technique);
CONKISS = conformal kidneys sparing (method); Vx (%) = percentage of total
volume receiving x Gy
The 2D COSI–CI graph (Fig. 7) shows visually the reason why the
CONKISS plans were superior to the ST plans.
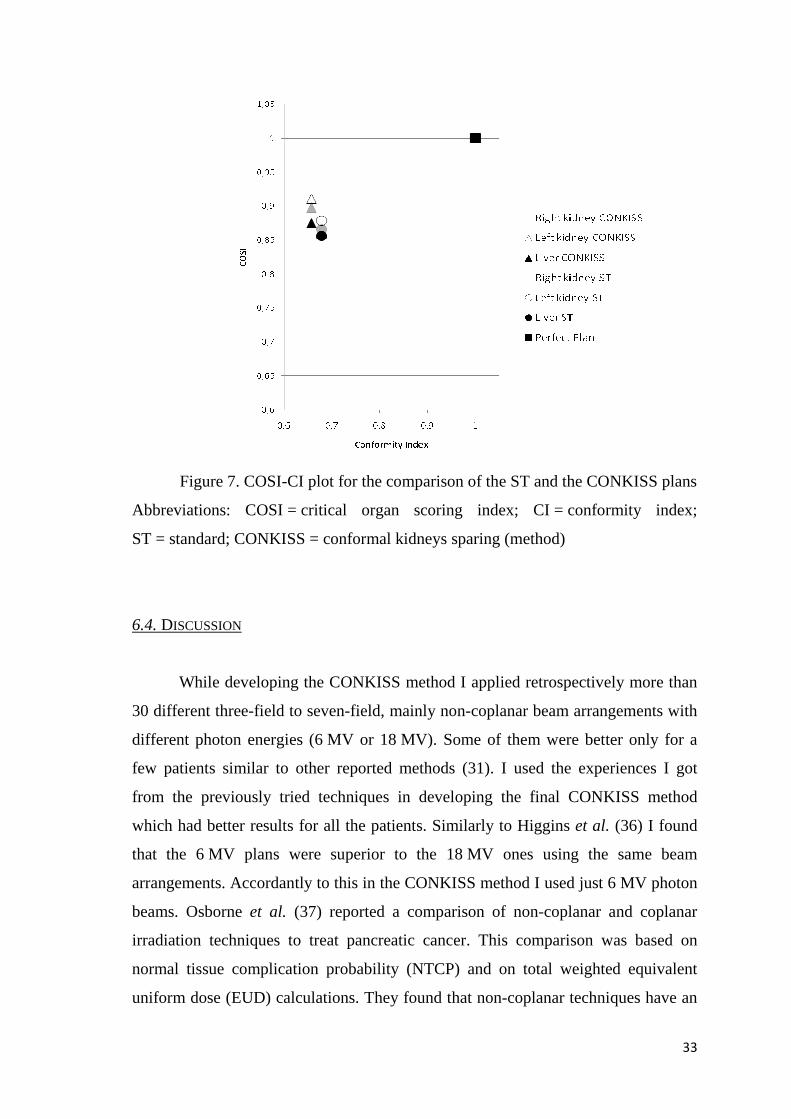
33
Figure 7. COSI-CI plot for the comparison of the ST and the CONKISS plans
Abbreviations: COSI = critical organ scoring index; CI = conformity index;
ST = standard; CONKISS = conformal kidneys sparing (method)
6.4. DISCUSSION
While developing the CONKISS method I applied retrospectively more than
30 different three-field to seven-field, mainly non-coplanar beam arrangements with
different photon energies (6 MV or 18 MV). Some of them were better only for a
few patients similar to other reported methods (31). I used the experiences I got
from the previously tried techniques in developing the final CONKISS method
which had better results for all the patients. Similarly to Higgins et al. (36) I found
that the 6 MV plans were superior to the 18 MV ones using the same beam
arrangements. Accordantly to this in the CONKISS method I used just 6 MV photon
beams. Osborne et al. (37) reported a comparison of non-coplanar and coplanar
irradiation techniques to treat pancreatic cancer. This comparison was based on
normal tissue complication probability (NTCP) and on total weighted equivalent
uniform dose (EUD) calculations. They found that non-coplanar techniques have an

34
overall benefit compared to the coplanar ones. My experiences similarly showed that
all the coplanar beam arrangements I tried (including the ST technique) were worse
than the CONKISS method that contained five non-coplanar beams.
The lower SD values of the CONKISS method showed that the reproduction
of its results were easier than that of the ST technique. The advantage of my method
was that it accommodated individually to each patient and had a unique beam
arrangement due to adequate beam direction adjustments, beam weight optimization,
and wedge direction adjustments.
6.4.1 Advantages of lateral beam directions
The reason why I used four lateral fields was that the kidneys were mainly
under the PTV from an axial POV and using mainly lateral fields the dose gradient
was higher in the AP direction. Thus the kidneys received the least dose when the
lateral fields went through on the least kidney area seen from the BEV. Concerning
the mean dose to the kidneys I came to the same conclusion, taking into account the
shape of the photon percentage depth dose (PDD) curve and the total kidney volume
in the beams. I achieved this by adjusting the equivalent kidney areas from BEV.
Another reason for this was that according to Bussels et al. (38) the
respiration-induced movement of the pancreas and the OARs in the AP direction is
the least compared to the movements in other directions. Gierga et al. similarly
reported the movements in the abdomen: in the craniocaudal direction an average
21.6 mm, in the LR direction an average 12.0 mm, and in the AP direction and
average 6.0 mm (39). The use of mostly lateral fields – during the treatments –
allowed a higher probability in delivering the planned dose to the PTV and to the
OARs.
The isocenter was moved upward to allow the use of the AP beam that was
declined in the caudal direction thus avoiding the possibility of any collision caused
by the physical extents of the gantry, table, and the patient. Even with this the table
angles of the lateral fields were unfortunately not arbitrary because I had to avoid
any table-gantry collision. This could be achieved – with an ELEKTA accelerator –
35
by using lateral fields with no more than 20° table rotation. With such lateral fields
the best PTV coverage and OARs sparing I could achieve– concerning the PTV
homogeneity and conformity – was created with the use of physical wedges.
6.4.2. CONKISS vs.IMRT comparison
Brown et al. (22) compared three different pancreas planning methods in
between there were 2 IMRT and one conformal technique for 15 patients – similarly
to us – retrospectively. The average volume of the PTV was almost the same as ours
– in their case 678.2 cm3 (PTV1) and in our case 658.6 cm3 (PTV). Concerning the
PTV volumes the results were fairly comparable. The prescription dose was
different: they made a three step irradiation: 45 Gy to the PTV (PTV1), 59.4 Gy to
the PTV-0.5 cm (PTV2), and 64.8 Gy to the PTV-1 cm (PTV3). So they reduced the
PTV volume in two steps and thus they irradiated only the smallest PTV-1 cm
volume with the 64.8 Gy total dose. In our case the prescription dose was just 45 Gy
to the PTV that corresponded to the PTV1 in case of the IMRT plans. To compare
my results with these reported IMRT plans I only increased the number of fractions
in my plans so, that the total dose to our PTV was 64.8 Gy. I did not decrease the
PTV volume and thus the estimated doses to the OARs were a considerable
overestimation of the doses that would be given to the OARs, when the PTV would
have been reduced in two steps. Table 6 shows the comparison of the OAR relative
volume doses for a 64.8 Gy total prescription dose. When counting the dose to the
total kidney I took into consideration the slightly different volumes of the left and
the right kidneys. Without sufficient data I had no possibility to make any
significance test.
In the comparison of the simultaneous integrated IMRT boost (IMRTi),
sequential IMRT boosting (IMRTs) techniques and the CONKISS method the liver
V35 and the small bowel V45 exceeded their tolerance limits in case of the
CONKISS technique (Table 6). In this comparison the mean dose to our PTV was
64.8 Gy. Our original mean prescription dose was just 45 Gy for our CHRT
treatment and in my original CONKISS plans the doses to the liver and to the small
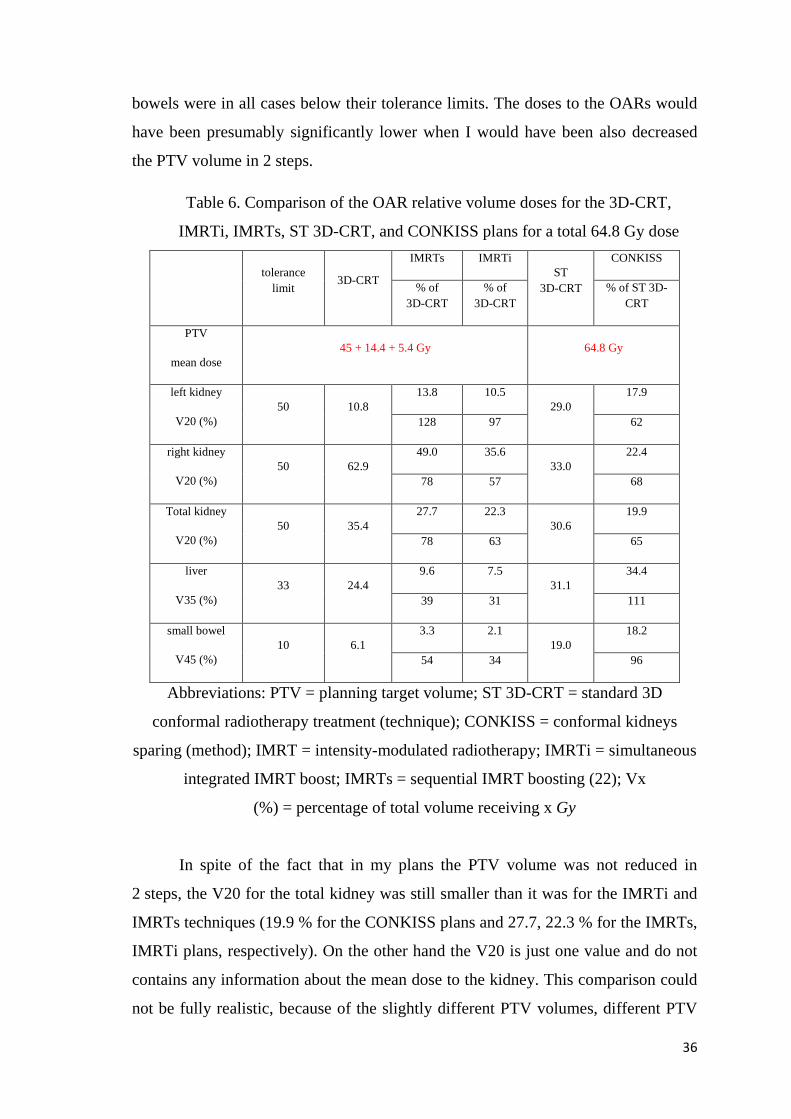
36
bowels were in all cases below their tolerance limits. The doses to the OARs would
have been presumably significantly lower when I would have been also decreased
the PTV volume in 2 steps.
Table 6. Comparison of the OAR relative volume doses for the 3D-CRT,
IMRTi, IMRTs, ST 3D-CRT, and CONKISS plans for a total 64.8 Gy dose
IMRTs IMRTi CONKISS
tolerance
limit 3D-CRT
% of 3D-CRT
% of 3D-CRT
ST 3D-CRT % of ST 3D-
CRT
PTV
mean dose 45 + 14.4 + 5.4 Gy 64.8 Gy
13.8 10.5 17.9 left kidney
V20 (%) 50 10.8
128 97 29.0
62
49.0 35.6 22.4 right kidney
V20 (%) 50 62.9
78 57 33.0
68
27.7 22.3 19.9 Total kidney
V20 (%) 50 35.4
78 63 30.6
65
9.6 7.5 34.4 liver
V35 (%) 33 24.4
39 31 31.1
111
3.3 2.1 18.2 small bowel
V45 (%) 10 6.1
54 34 19.0
96
Abbreviations: PTV = planning target volume; ST 3D-CRT = standard 3D
conformal radiotherapy treatment (technique); CONKISS = conformal kidneys
sparing (method); IMRT = intensity-modulated radiotherapy; IMRTi = simultaneous
integrated IMRT boost; IMRTs = sequential IMRT boosting (22); Vx
(%) = percentage of total volume receiving x Gy
In spite of the fact that in my plans the PTV volume was not reduced in
2 steps, the V20 for the total kidney was still smaller than it was for the IMRTi and
IMRTs techniques (19.9 % for the CONKISS plans and 27.7, 22.3 % for the IMRTs,
IMRTi plans, respectively). On the other hand the V20 is just one value and do not
contains any information about the mean dose to the kidney. This comparison could
not be fully realistic, because of the slightly different PTV volumes, different PTV
37
reductions, and of the different patient groups. Thus I did not want to make any clear
decision on this IMRT – CONKISS comparison. Both of them are much better
compared to the actual (ST) 3D-CRT plans – made for the same patient group.
In addition to these Menhel et al. (31) reported that with their COSI-CI 2D
representation the non-coplanar 3D plans were superior to the IMRT plans in several
cases. This shows that it should be possible to make such non-coplanar beam
arrangements that have similar results to IMRT.
6.4.3. Limit of physical wedge direction usage
In general to direct a wedge to another beam using a physical wedge has a
limitation depending on the PTV shape and on the PTV-OARs arrangement in
space. When the PTV outline – and so the MLC shape – is convex from the BEV
then the direction of the collimator can be arbitrary, but when the PTV outline is
concave then there are such collimator angles where the MLC setting would not be
sufficiently fitted to the PTV outline from the BEV. This is due to the fact, that the
required physical wedge direction can be adjusted with proper collimator rotation.
Thus in case of a concave PTV outline from the BEV it is possible, that the made
MLC setting would not fit sufficiently to the PTV. Using the required collimator
angle in such cases when the MLC setting would not fit to the PTV, the Elekta
Precise Plan planning system allows to use a kind of virtual wedge, called Omni
wedge®. Using Omni wedges the collimator angle can be adjusted to fit the MLC
setting to the PTV, meanwhile the proper wedge direction can be adjusted
separately.
6.4.4. Balancing the dose to the OARs
According to Wilkowski et al. concurrent chemotherapy, especially the use
of cisplatin and other nephrotoxic agents (e.g. aminoglycoside antibiotics) can
significantly reduce the tolerance level of the kidneys, therefore they aimed not to
38
expose 30 % of a kidney to more than 20 Gy. In addition, prior to starting the
therapy, creatinin clearance should be checked, if possible for each kidney
separately, with an isotope nephrogram in order to take individual differences in
kidney function into account before planning radiation treatment (23). If one kidney
is not functioning well than it can be sacrificed in order to spare as much of the
other, well functioning kidney as possible. In this case of course the whole
CONKISS method should be altered to exclude as much the well functioning kidney
from the beams as reasonably achievable.
The issue concerning the liver seems to be controversial. On one hand
Dawson et al. – based on NTCP estimation – indicated a higher tolerance of the liver
tissue: just 5 % risk of radiogenic liver damage at 47 Gy or 31 Gy for 75 % or 100 %
of the liver volume (24), respectively. On the other hand according to Wilkowski et
al. the dose tolerance limit of the liver should be further reduced due to concurrent
chemotherapy to a maximum 25 Gy, or 37.5 Gy for 50 % or 25 % of the liver
volume, respectively (23). Based on a liver function test, the use of a patient-specific
liver dose tolerance limit should be considered.
With other pancreas treatment techniques usually the right kidney received
much higher dose than the left. Using the CONKISS technique the dose to the
kidneys and to the liver will be almost the same in the percentage of their tolerance
limits (Fig. 6) left kidney – 64 %, right kidney – 76 %, total kidney – 70 %, liver –
72 %, thus ca. 70 % for the kidneys and the liver too. So the CONKISS method
makes a balance in between the kidneys and the liver.
The fact that the mean dose to the liver increased meanwhile its V35
decreased shows, that the increase in the overall biological effect due to the
increased mean liver dose would be not so severe because simultaneously the liver
V35 decreased.
The CONKISS method took under consideration what could be more
important concerning the dose to the kidneys and the PTV coverage. According to
this I checked the dose to the kidneys and when the kidneys received less than – a
certain value – 50 % of their tolerance dose limit, then I made the PTV homogeneity
and conformity better by increasing the previously reduced MLC margins
(maximum to the original 10 mm) near the kidneys until they got still less than 66 %
39
of their tolerance dose limit (1/2�2/3 rule). This was done because my primary aim
was to deliver the prescribed dose homogeneously to the PTV to get the required
effect on the tumor.
6.5. CONCLUSION
The CONKISS method is an effective and individualizable treatment
planning method to significantly reduce the dose to kidneys, without any significant
change in the conformity and homogeneity. This OAR sparing could potentially
allow either dose escalation – thus further enhancing the loco regional control – or to
further decrease the possibility of OAR related side effects – thus ensuring the
possibility to apply any further chemotherapy regimens. The WEDDE algorithm
gives possibility to develop other new conformal planning techniques in order to
improve OAR sparing – similarly to the CONKISS method. Using 3D-CRT the
CONKISS method can be a simple, smart alternative to IMRT.
40
7. CONRES: CONFORMAL RECTUM SPARING 3D NON-
COPLANAR RADIOTHERAPY TREATMENT
FOR PROSTATE CANCER AS AN ALTERNATIVE TO IMRT
7.1. INTRODUCTION
In Europe 25 from every 100 men having tumor were diagnosed with prostate
cancer in 2008 (15). Even with definitive treatment, it is estimated that 40% of men
with clinically localized prostate cancer will experience biochemical relapse within 5
years (40). These show the importance of treating these patients, especially with
radiotherapy.
Curative radiation for prostate cancer was delivered until the mid-1990s, in
many centers, using a standardized 4-field ‘‘box’’ arrangement to the pelvis with
little conformation around the target to a typical dose of 60–70 Gy. It was already
felt then that this radiation dose was not optimal for cure (41, 42) but dose increment
was limited by the known toxicity (43, 44). This problem was remedied in part by
conventional 3D conformal radiotherapy (3D-CRT), which uses CT scans for the
initial planning. Dose escalation with 3D-CRT increased biochemical control
compared to historical cases in single (45–47) and multi-institutional studies
(48, 49). Moreover, 3D-CRT was convincingly shown in the late-1990s to be
superior to standard field radiation with regard to acute and late side effects as
demonstrated in randomized trials (50, 51). 3D-CRT side effects were improved but
still remained common, especially at high doses. This is of concern since there is
now strong evidence that freedom-from-failure is favoured with dose escalation to
78–79.2 Gy in three published randomized trials (52–55). These latter, taken
together, also seem to show that dose escalation might lead to more complications
unless one sacrifices the posterior CTV-to-PTV margin to 0 mm for the boost or
uses some form of highly conformal RT. This last option seems to be preferable, and
there is thus great interest in improving the precision of radiation to the prostate.

41
The use of three-dimensional conformal intensity-modulated radiotherapy
(3D-IMRT) to treat prostate cancer more efficiently has been advocated for many
years (56, 57). 3D-IMRT can offer similar or better coverage of the prostate than
3D-CRT while decreasing dosage to OARs (58). Its superiority over 3D-CRT has
been confirmed clinically in dose escalation with respect to side effects and its
efficiency for tumor control (59-66).
Thus when treating prostate cancer using ST 3D-CRT beam arrangements the
rectum – especially the rectum V40, V50 values – often receive higher dose than
their probable tolerance limit –by delivering adequate dose to the PTV. My aim was
to elaborate a new planning method that – similarly to IMRT –effectively spares the
rectum without compromising the target coverage.
7.2. METHODS AND MATERIALS
Between May 2009 and September 2010, 27 patients with low risk prostate
cancer were treated in our department. During RT procedure 5 mm increment
computer tomography (CT) scans were taken with a Siemens Somatom CT
(Siemens, Germany) scanner and transferred to Precise Plan treatment planning
system (TPS) (Elekta, PrecisePLAN 2.02/2.03, Atlanta GA, USA). The prescription
dose was 74 Gy to the PTV in 2 Gy per fractions. The treatments were done with an
ELEKTA Precise TS LINAC (Elekta, Crawley, UK) that has an MLC with 10 mm
leaf width.
7.2.1. Contouring
The primary GTV and the CTV were defined according to ICRU Report 50,
62 (5, 6). Organ motion and set-up errors were also considered in the setting of the
margins, thus the planning target volume (PTV) was defined as CTV with an
additional uniform margin of 10 mm. As organs at risk (OAR), the rectum (rectum
42
anterior and posterior separately), the bladder, the anus, and the femoral heads were
contoured on all CT images.
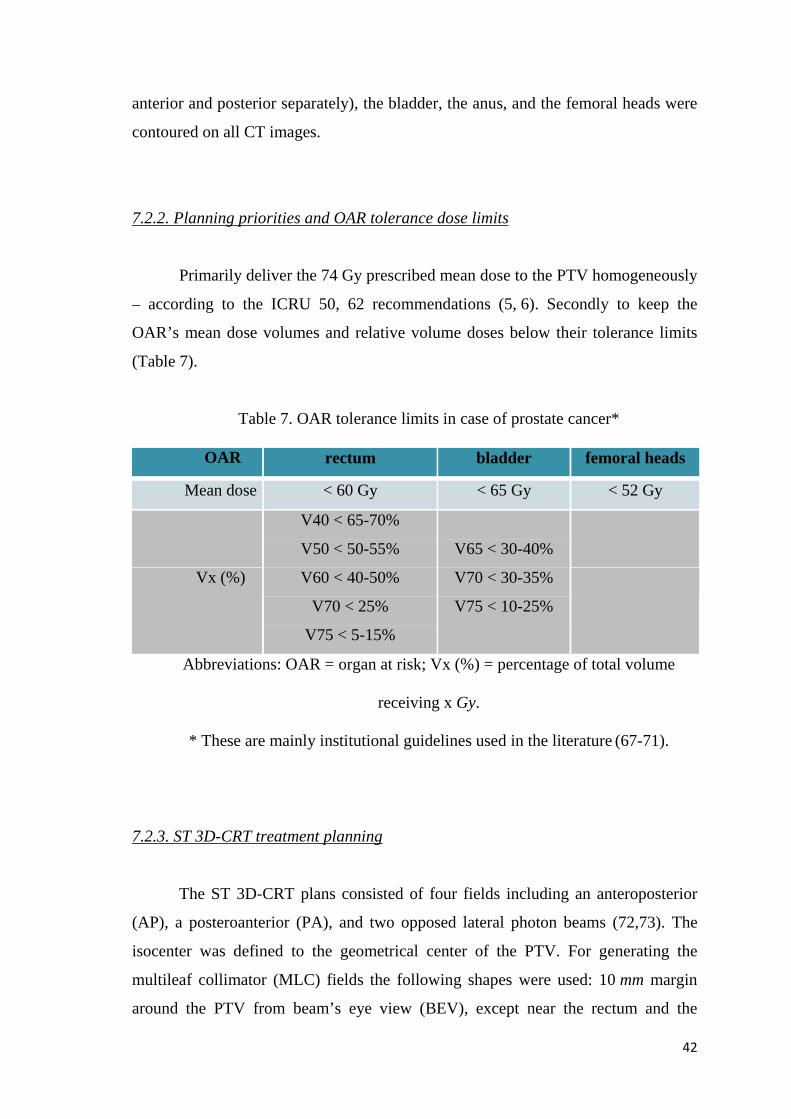
7.2.2. Planning priorities and OAR tolerance dose limits
Primarily deliver the 74 Gy prescribed mean dose to the PTV homogeneously
– according to the ICRU 50, 62 recommendations (5, 6). Secondly to keep the
OAR’s mean dose volumes and relative volume doses below their tolerance limits
(Table 7).
Table 7. OAR tolerance limits in case of prostate cancer*
OAR rectum bladder femoral heads
Mean dose < 60 Gy < 65 Gy < 52 Gy
Vx (%)
V40 < 65-70%
V50 < 50-55%
V60 < 40-50%
V70 < 25%
V75 < 5-15%
V65 < 30-40%
V70 < 30-35%
V75 < 10-25%
Abbreviations: OAR = organ at risk; Vx (%) = percentage of total volume
receiving x Gy.
* These are mainly institutional guidelines used in the literature (67-71).
7.2.3. ST 3D-CRT treatment planning
The ST 3D-CRT plans consisted of four fields including an anteroposterior
(AP), a posteroanterior (PA), and two opposed lateral photon beams (72,73). The
isocenter was defined to the geometrical center of the PTV. For generating the
multileaf collimator (MLC) fields the following shapes were used: 10 mm margin
around the PTV from beam’s eye view (BEV), except near the rectum and the
43
bladder where they were manually reduced to 4 and 8 mm, respectively. The beam-
weights were optimized with the IMRT optimizing module of Elekta PrecisePlan
TPS only with a mean dose constraint at 74 Gy for the PTV.
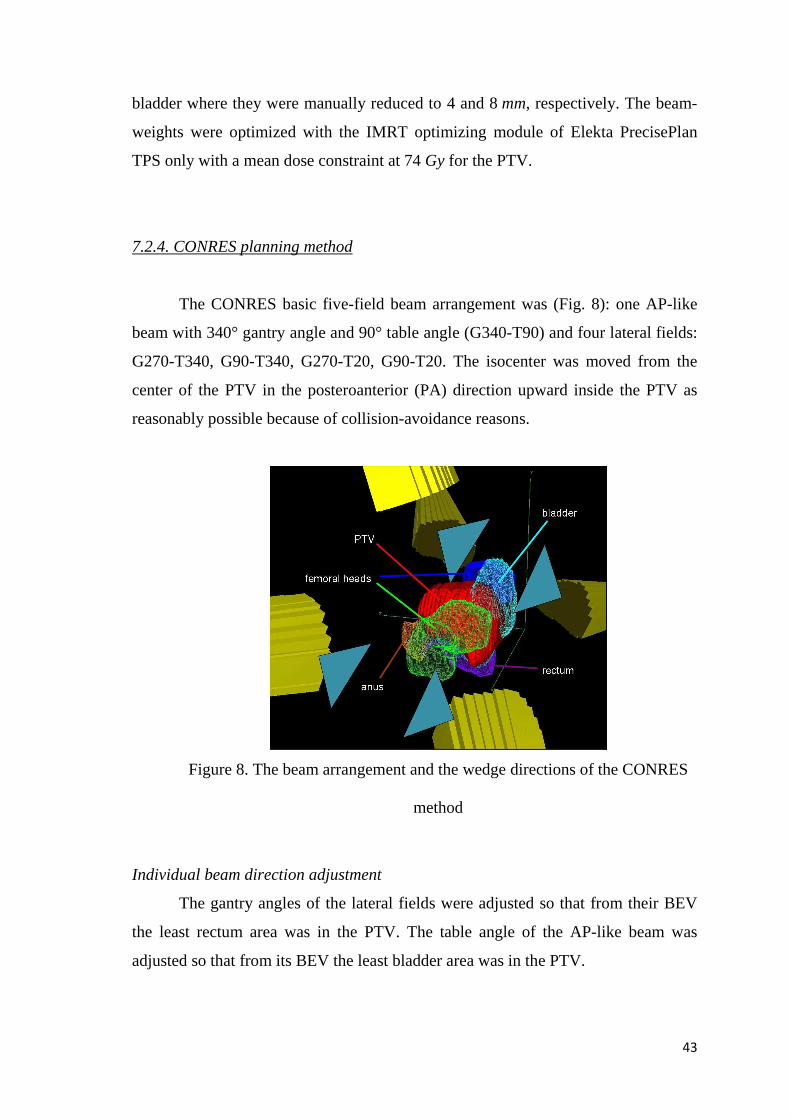
7.2.4. CONRES planning method
The CONRES basic five-field beam arrangement was (Fig. 8): one AP-like
beam with 340° gantry angle and 90° table angle (G340-T90) and four lateral fields:
G270-T340, G90-T340, G270-T20, G90-T20. The isocenter was moved from the
center of the PTV in the posteroanterior (PA) direction upward inside the PTV as
reasonably possible because of collision-avoidance reasons.
Figure 8. The beam arrangement and the wedge directions of the CONRES
method
Individual beam direction adjustment
The gantry angles of the lateral fields were adjusted so that from their BEV
the least rectum area was in the PTV. The table angle of the AP-like beam was
adjusted so that from its BEV the least bladder area was in the PTV.
44
Wedge direction adjustment
I used the ELEKTA integrated motorized physical wedge in all of the four
lateral beams. The direction of the wedges were adjusted so, that the wedges of the
two lateral fields closer to the AP-like beam directed to the other lateral beams on
the same side. In the other two lateral beams the wedges directed to the lateral beam
closer to the AP-like beam (Fig. 8).
With my WEDDE algorithm I determined the required collimator rotation
angles in all the four lateral wedged fields using 60° physical wedge angles.
MLC setting adjustment
The generation of the MLC fields and the beam weight optimization was
done the same way as in case of the ST technique.
To further increase the PTV homogeneity and to reduce the maximum dose
value I used a second segment in the AP-like beam from its BEV – a kind of a
multisegmented technique – that excluded the highest 2–3 % dose cloud, similarly to
Gulybán et al. (27).
7.2.5. Plan evaluation and comparison
The homogeneity was evaluated in two different ways: First according to
ICRU 50, 62 recommendations (5, 6), with the V95-107%. Secondly the homogeneity
was evaluated with the D95-5% according to van Asselen et al. (30).
Concerning the OARs I evaluated the mean dose to the rectum, bladder, anus,
femoral heads, the percentage of rectum volume receiving 40 Gy (V40), 50 Gy
(V50), 60 Gy (V60), 70 Gy (V70), 75 Gy (V75), and the percentage of bladder
receiving 65 Gy (V65), 70 Gy (V70), 75 Gy (V75) (Table 7). Additionally the
rectum anterior and rectum posterior mean doses were evaluated too according to
Wolff et. al. (74).
Statistical analyses
45
All data are presented in mean dose ± standard deviation and as percentage of
tolerance limit too. I made 2-tailed t tests to decide whether the difference of the
results between the ST and CONRES planning technique are significant. The 5 %
probability level (p < 0.05) was considered to be statistical significant.
7.3. RESULTS
7.3.1. PTV coverage
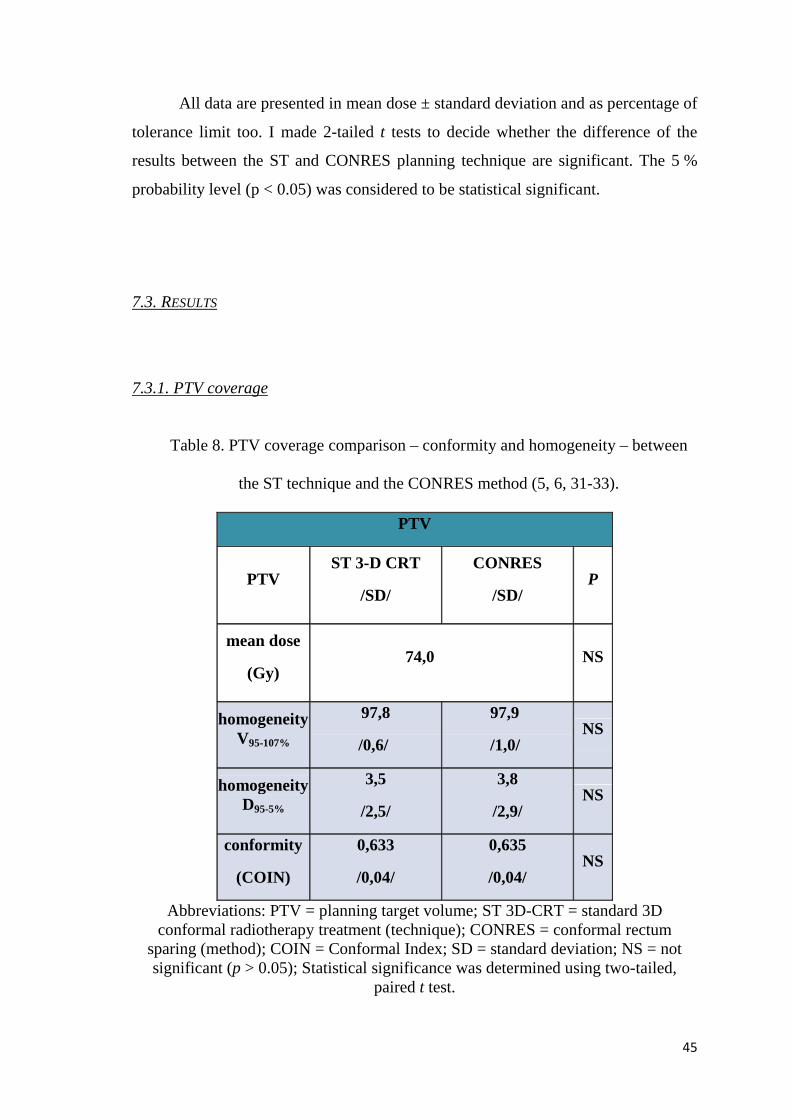
Table 8. PTV coverage comparison – conformity and homogeneity – between
the ST technique and the CONRES method (5, 6, 31-33).
PTV
PTV ST 3-D CRT
/SD/
CONRES
/SD/ P
mean dose
(Gy) 74,0 NS
homogeneity V95-107%
97,8
/0,6/
97,9
/1,0/ NS
homogeneity D95-5%
3,5
/2,5/
3,8
/2,9/ NS
conformity
(COIN)
0,633
/0,04/
0,635
/0,04/ NS
Abbreviations: PTV = planning target volume; ST 3D-CRT = standard 3D conformal radiotherapy treatment (technique); CONRES = conformal rectum
sparing (method); COIN = Conformal Index; SD = standard deviation; NS = not significant (p > 0.05); Statistical significance was determined using two-tailed,
paired t test.
46
The mean PTV volume was 222,5 cm3 (range, 137–341 cm3). The CONRES
plans resulted in a slightly better V95-107%, a slightly worse D95-5% homogeneity, and a
slightly better COIN conformity (Table 8). None of these differences were
statistically significant.
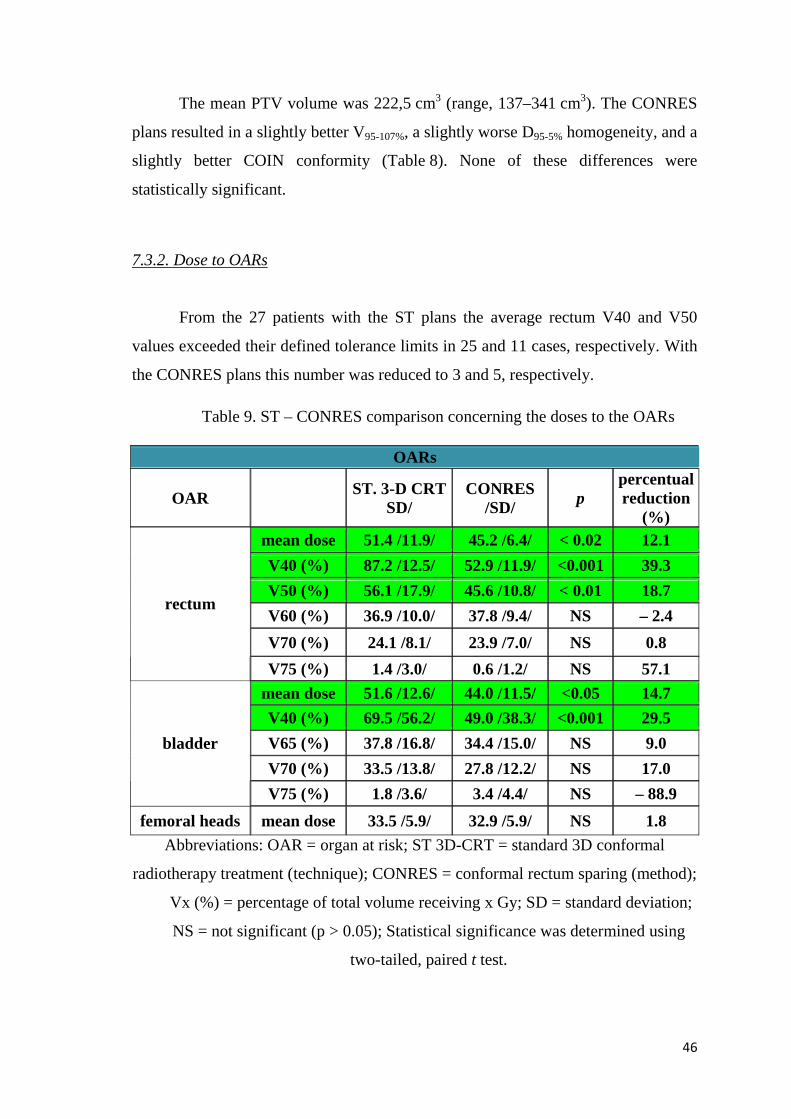
7.3.2. Dose to OARs
From the 27 patients with the ST plans the average rectum V40 and V50
values exceeded their defined tolerance limits in 25 and 11 cases, respectively. With
the CONRES plans this number was reduced to 3 and 5, respectively.
Table 9. ST – CONRES comparison concerning the doses to the OARs
OARs
OAR ST. 3-D CRT SD/
CONRES /SD/ p
percentual reduction
(%) mean dose 51.4 /11.9/ 45.2 /6.4/ < 0.02 12.1
V40 (%) 87.2 /12.5/ 52.9 /11.9/ <0.001 39.3
V50 (%) 56.1 /17.9/ 45.6 /10.8/ < 0.01 18.7
V60 (%) 36.9 /10.0/ 37.8 /9.4/ NS – 2.4
V70 (%) 24.1 /8.1/ 23.9 /7.0/ NS 0.8
rectum
V75 (%) 1.4 /3.0/ 0.6 /1.2/ NS 57.1
mean dose 51.6 /12.6/ 44.0 /11.5/ <0.05 14.7
V40 (%) 69.5 /56.2/ 49.0 /38.3/ <0.001 29.5
V65 (%) 37.8 /16.8/ 34.4 /15.0/ NS 9.0
V70 (%) 33.5 /13.8/ 27.8 /12.2/ NS 17.0
bladder
V75 (%) 1.8 /3.6/ 3.4 /4.4/ NS – 88.9
femoral heads mean dose 33.5 /5.9/ 32.9 /5.9/ NS 1.8
Abbreviations: OAR = organ at risk; ST 3D-CRT = standard 3D conformal
radiotherapy treatment (technique); CONRES = conformal rectum sparing (method);
Vx (%) = percentage of total volume receiving x Gy; SD = standard deviation;
NS = not significant (p > 0.05); Statistical significance was determined using
two-tailed, paired t test.
47
Concerning the average bladder V65 and V70 values, they exceeded their
defined tolerance limits in 13 and 13 cases, respectively. With the CONRES plans
this number was reduced to 9 and 5, respectively. With the ST plans the rectum and
bladder mean doses exceeded their tolerance limit in 2 and 1 cases, respectively.
With the CONRES plans both of these numbers were reduced to zero. All the other
OAR mean doses, the rectum V60, V70, V75 the bladder V75 values were for both
of the techniques under their tolerance limits.
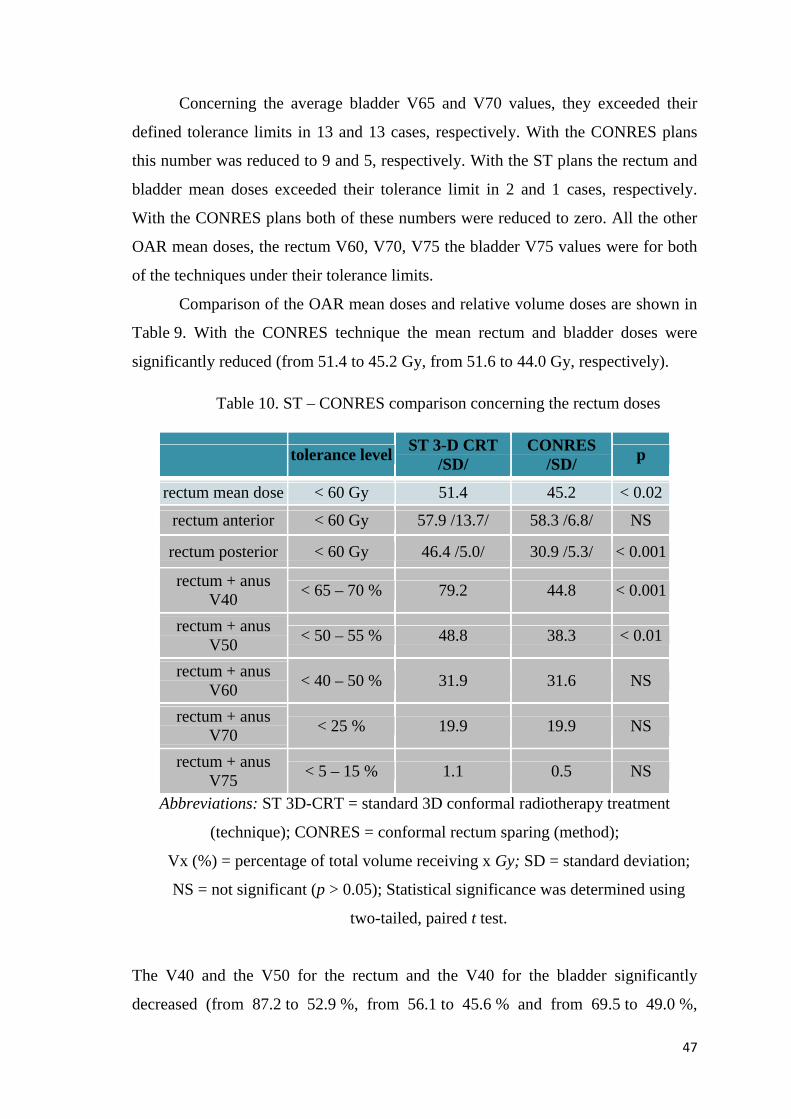
Comparison of the OAR mean doses and relative volume doses are shown in
Table 9. With the CONRES technique the mean rectum and bladder doses were
significantly reduced (from 51.4 to 45.2 Gy, from 51.6 to 44.0 Gy, respectively).
Table 10. ST – CONRES comparison concerning the rectum doses
tolerance level ST 3-D CRT
/SD/ CONRES
/SD/ p
rectum mean dose < 60 Gy 51.4 45.2 < 0.02
rectum anterior < 60 Gy 57.9 /13.7/ 58.3 /6.8/ NS
rectum posterior < 60 Gy 46.4 /5.0/ 30.9 /5.3/ < 0.001
rectum + anus V40
< 65 – 70 % 79.2 44.8 < 0.001
rectum + anus V50
< 50 – 55 % 48.8 38.3 < 0.01
rectum + anus V60
< 40 – 50 % 31.9 31.6 NS
rectum + anus V70
< 25 % 19.9 19.9 NS
rectum + anus V75
< 5 – 15 % 1.1 0.5 NS
Abbreviations: ST 3D-CRT = standard 3D conformal radiotherapy treatment
(technique); CONRES = conformal rectum sparing (method);
Vx (%) = percentage of total volume receiving x Gy; SD = standard deviation;
NS = not significant (p > 0.05); Statistical significance was determined using
two-tailed, paired t test.
The V40 and the V50 for the rectum and the V40 for the bladder significantly
decreased (from 87.2 to 52.9 %, from 56.1 to 45.6 % and from 69.5 to 49.0 %,

48
respectively). The differences between the other mean doses and relative volume
doses were not statistically significant.
Comparing the ST 3-D CRT and the CONRES techniques, there were no
significant changes in the rectum anterior doses, but with the CONRES method the
rectum and rectum posterior doses were significantly reduced (Table 10).
Concerning the fact that the PTV was partially inside the rectum anterior part, these
show too, that the CONRES method delivers the prescribed dose to the PTV with
same homogeneity and the rectum mean dose reduction favourably comes from a
significant reduction of the rectum posterior mean doses.
Additionally I evaluated the rectum and the anus together for the same
relative volume doses as for the rectum. I used the same tolerance levels as for the
rectum. Similarly the rectum + anus V40 and V50 values decreased significantly.
Comparing same relative volume doses, all the rectum + anus values were lower
than the values for the rectum alone.
With the CONRES method the following significant percental mean dose
reductions were achieved: rectum – 12.1 %, bladder – 14.7 %. Concerning the
rectum V40, V50 and bladder V40 relative volume doses the reduction was 39.3 %,
18.7 % and 29.5 %, respectively (Table 9).
Comparing organ at risk tolerance doses in percentage of their tolerance limits
0,00
20,00
40,00
60,00
80,00
100,00
120,00
140,00
mea
n rect
um d
ose
mea
n blad
der d
ose
mea
n fem
oral h
eads d
ose
rect
um V
40
rect
um V
50
rect
um V
60
rect
um V
70
rect
um V
75
bladder
V65
bladder
V70
bladder
V75
PTV D 95
-5%
COIN
PTV V95
-107
%
per
cen
tag
e o
f to
lera
nce
lim
it (
%)
ST
CONRES
Figure 9. Organ at risk tolerance doses in percentage of their tolerance limit
Abbreviations: ST = standard; CONRES = conformal rectum sparing (method)
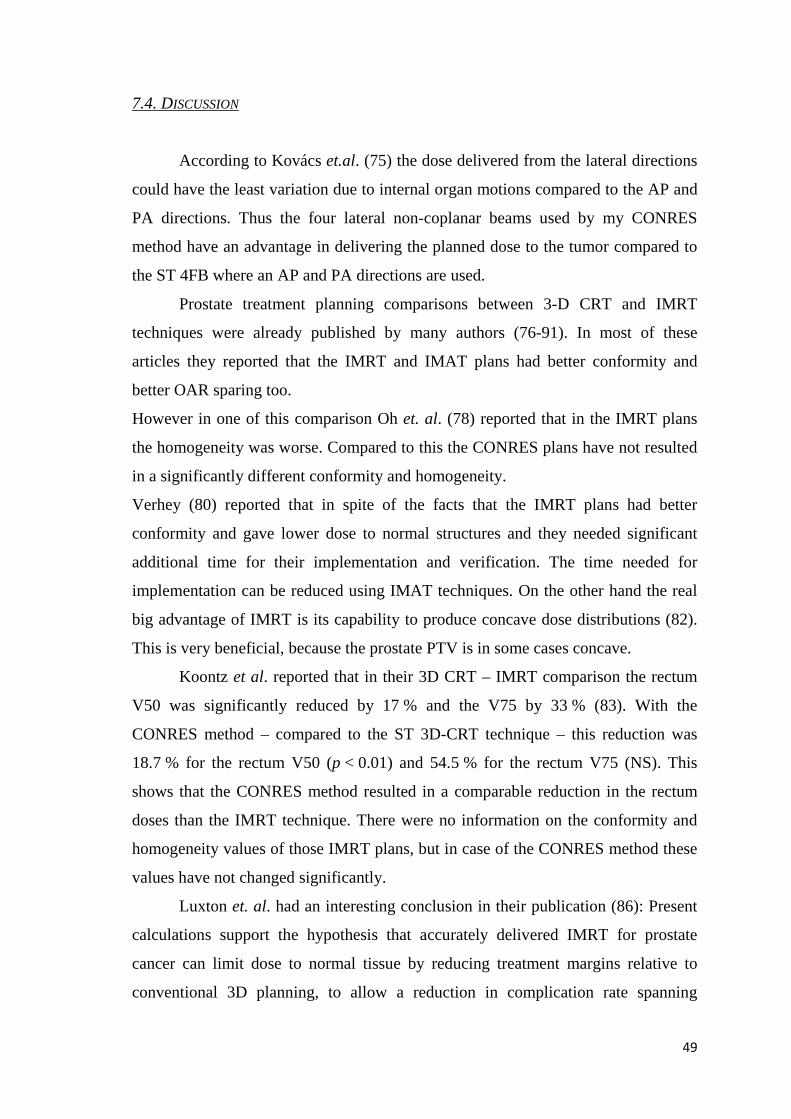
49
7.4. DISCUSSION
According to Kovács et.al. (75) the dose delivered from the lateral directions
could have the least variation due to internal organ motions compared to the AP and
PA directions. Thus the four lateral non-coplanar beams used by my CONRES
method have an advantage in delivering the planned dose to the tumor compared to
the ST 4FB where an AP and PA directions are used.
Prostate treatment planning comparisons between 3-D CRT and IMRT
techniques were already published by many authors (76-91). In most of these
articles they reported that the IMRT and IMAT plans had better conformity and
better OAR sparing too.
However in one of this comparison Oh et. al. (78) reported that in the IMRT plans
the homogeneity was worse. Compared to this the CONRES plans have not resulted
in a significantly different conformity and homogeneity.
Verhey (80) reported that in spite of the facts that the IMRT plans had better
conformity and gave lower dose to normal structures and they needed significant
additional time for their implementation and verification. The time needed for
implementation can be reduced using IMAT techniques. On the other hand the real
big advantage of IMRT is its capability to produce concave dose distributions (82).
This is very beneficial, because the prostate PTV is in some cases concave.
Koontz et al. reported that in their 3D CRT – IMRT comparison the rectum
V50 was significantly reduced by 17 % and the V75 by 33 % (83). With the
CONRES method – compared to the ST 3D-CRT technique – this reduction was
18.7 % for the rectum V50 (p < 0.01) and 54.5 % for the rectum V75 (NS). This
shows that the CONRES method resulted in a comparable reduction in the rectum
doses than the IMRT technique. There were no information on the conformity and
homogeneity values of those IMRT plans, but in case of the CONRES method these
values have not changed significantly.
Luxton et. al. had an interesting conclusion in their publication (86): Present
calculations support the hypothesis that accurately delivered IMRT for prostate
cancer can limit dose to normal tissue by reducing treatment margins relative to
conventional 3D planning, to allow a reduction in complication rate spanning
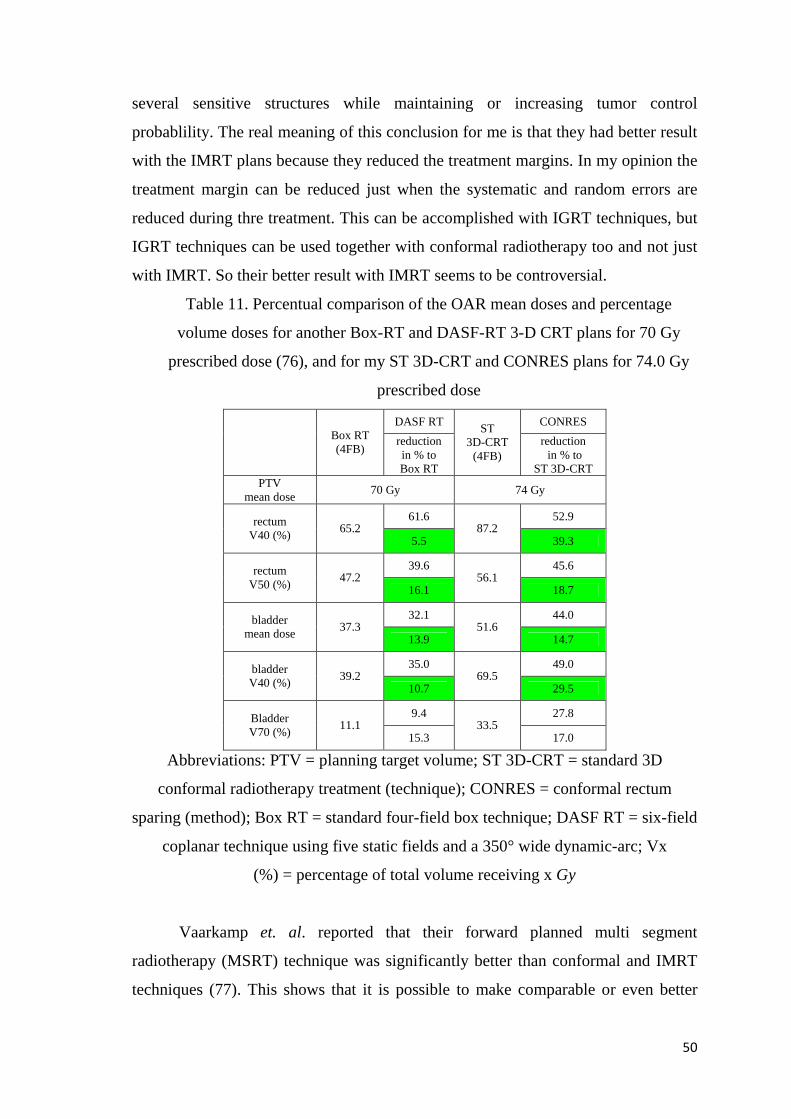
50
several sensitive structures while maintaining or increasing tumor control
probablility. The real meaning of this conclusion for me is that they had better result
with the IMRT plans because they reduced the treatment margins. In my opinion the
treatment margin can be reduced just when the systematic and random errors are
reduced during thre treatment. This can be accomplished with IGRT techniques, but
IGRT techniques can be used together with conformal radiotherapy too and not just
with IMRT. So their better result with IMRT seems to be controversial.
Table 11. Percentual comparison of the OAR mean doses and percentage
volume doses for another Box-RT and DASF-RT 3-D CRT plans for 70 Gy
prescribed dose (76), and for my ST 3D-CRT and CONRES plans for 74.0 Gy
prescribed dose
DASF RT CONRES
Box RT (4FB)
reduction in % to Box RT
ST 3D-CRT (4FB)
reduction in % to
ST 3D-CRT PTV
mean dose 70 Gy 74 Gy
61.6 52.9 rectum V40 (%)
65.2 5.5
87.2 39.3
39.6 45.6 rectum V50 (%)
47.2 16.1
56.1 18.7
32.1 44.0 bladder mean dose
37.3 13.9
51.6 14.7
35.0 49.0 bladder V40 (%)
39.2 10.7
69.5 29.5
9.4 27.8 Bladder V70 (%)
11.1 15.3
33.5 17.0
Abbreviations: PTV = planning target volume; ST 3D-CRT = standard 3D
conformal radiotherapy treatment (technique); CONRES = conformal rectum
sparing (method); Box RT = standard four-field box technique; DASF RT = six-field
coplanar technique using five static fields and a 350° wide dynamic-arc; Vx
(%) = percentage of total volume receiving x Gy
Vaarkamp et. al. reported that their forward planned multi segment
radiotherapy (MSRT) technique was significantly better than conformal and IMRT
techniques (77). This shows that it is possible to make comparable or even better
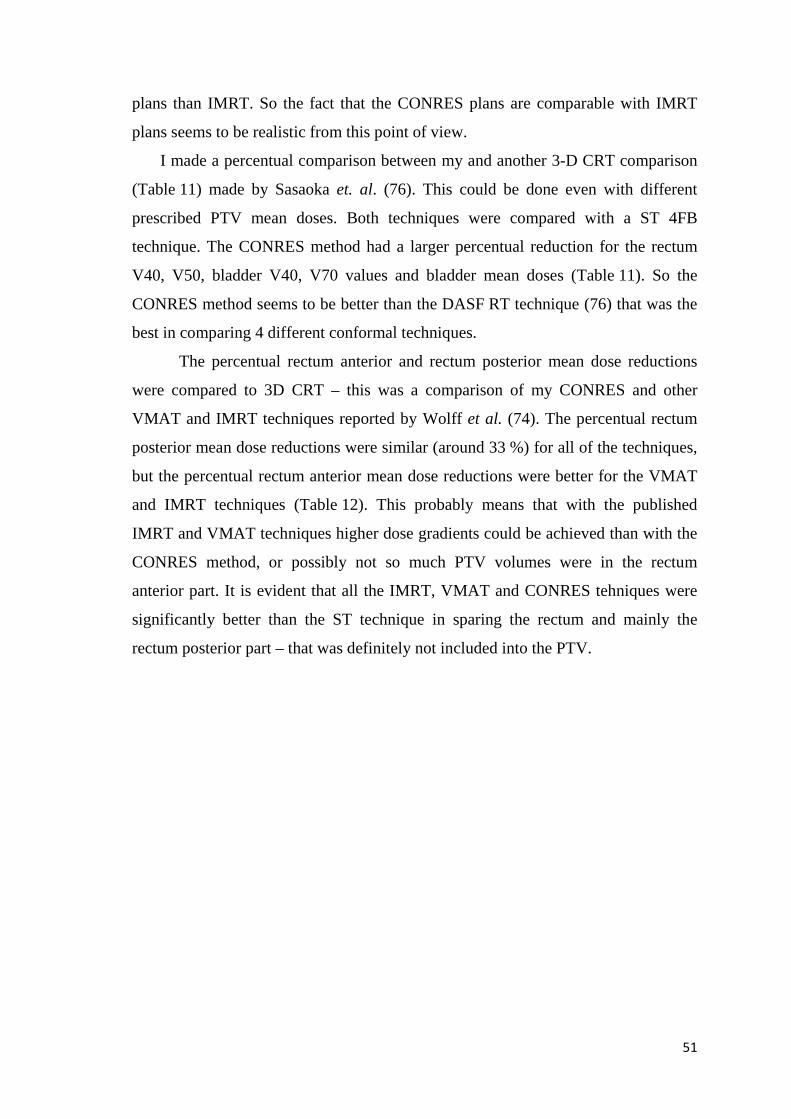
51
plans than IMRT. So the fact that the CONRES plans are comparable with IMRT
plans seems to be realistic from this point of view.
I made a percentual comparison between my and another 3-D CRT comparison
(Table 11) made by Sasaoka et. al. (76). This could be done even with different
prescribed PTV mean doses. Both techniques were compared with a ST 4FB
technique. The CONRES method had a larger percentual reduction for the rectum
V40, V50, bladder V40, V70 values and bladder mean doses (Table 11). So the
CONRES method seems to be better than the DASF RT technique (76) that was the
best in comparing 4 different conformal techniques.
The percentual rectum anterior and rectum posterior mean dose reductions
were compared to 3D CRT – this was a comparison of my CONRES and other
VMAT and IMRT techniques reported by Wolff et al. (74). The percentual rectum
posterior mean dose reductions were similar (around 33 %) for all of the techniques,
but the percentual rectum anterior mean dose reductions were better for the VMAT
and IMRT techniques (Table 12). This probably means that with the published
IMRT and VMAT techniques higher dose gradients could be achieved than with the
CONRES method, or possibly not so much PTV volumes were in the rectum
anterior part. It is evident that all the IMRT, VMAT and CONRES tehniques were
significantly better than the ST technique in sparing the rectum and mainly the
rectum posterior part – that was definitely not included into the PTV.

52
Table 12. Percentual comparison of the rectum anterior and rectum posterior
mean doses for another two VMAT and one IMRT plans plans for 76 Gy
prescribed dose (74), and for my ST 3D-CRT and CONRES plans for 74.0 Gy
prescribed dose
VMAT1x VMAT2x IMRT CONRES
3D CRT reduction in % to 3D CRT
reduction in % to 3D CRT
reduction in % to 3D CRT
ST 3D-CRT (4FB)
reduction in % to
ST 3D-CRT PTV
mean dose 76 Gy 74 Gy
61.6 61.3 54.0 58.3 rectum anterior mean
dose (Gy) 66.3
7.1 7.5 8.1 57.9
–0.7
38.6 38.8 34.9 30.9 rectum posterior mean
dose (Gy) 55.4
30.3 30.0 37.0 46.4
33.4
Abbreviations: PTV = planning target volume; ST 3D-CRT = standard 3D
conformal radiotherapy treatment (technique); CONRES = conformal rectum
sparing (method); VMAT1x = volumetric modulated arc therapy with one rotation;
VMAT2x = volumetric modulated arc therapy with two rotations (74)
Today the best way to irradiate prostate tumors seems to be possible with
IMAT techniques. Palma et. al. reported that their variable dose rate volumetric arc
therapy technique (vdr-VMAT) was superior to other IMRT and to constant dose
rate VMAT (cdr-VMAT) techniques. The vdr-VMAT technique resulted in a more
favourable dose distribution and it reduced the monitor units required compared to
IMRT (92). By decreasing the monitor units, the VMAT technique can reduce beam
on time up to 55% while maintaining dosimetric quality comparable to that of the
standard IMRT approach (93).
7.5. CONCLUSION
With the CONRES method the mean dose to the rectum and bladder, the
rectum V40, V50 values and the bladder V40 values could be significantly reduced,
meanwhile the conformity of the plans, the PTV homogeneity and the doses to other

53
OARs have not changed significantly. Using 3-D CRT the CONRES method allows
the possibility of better OAR sparing and further dose escalation. It could be a smart
alternative to IMRT.
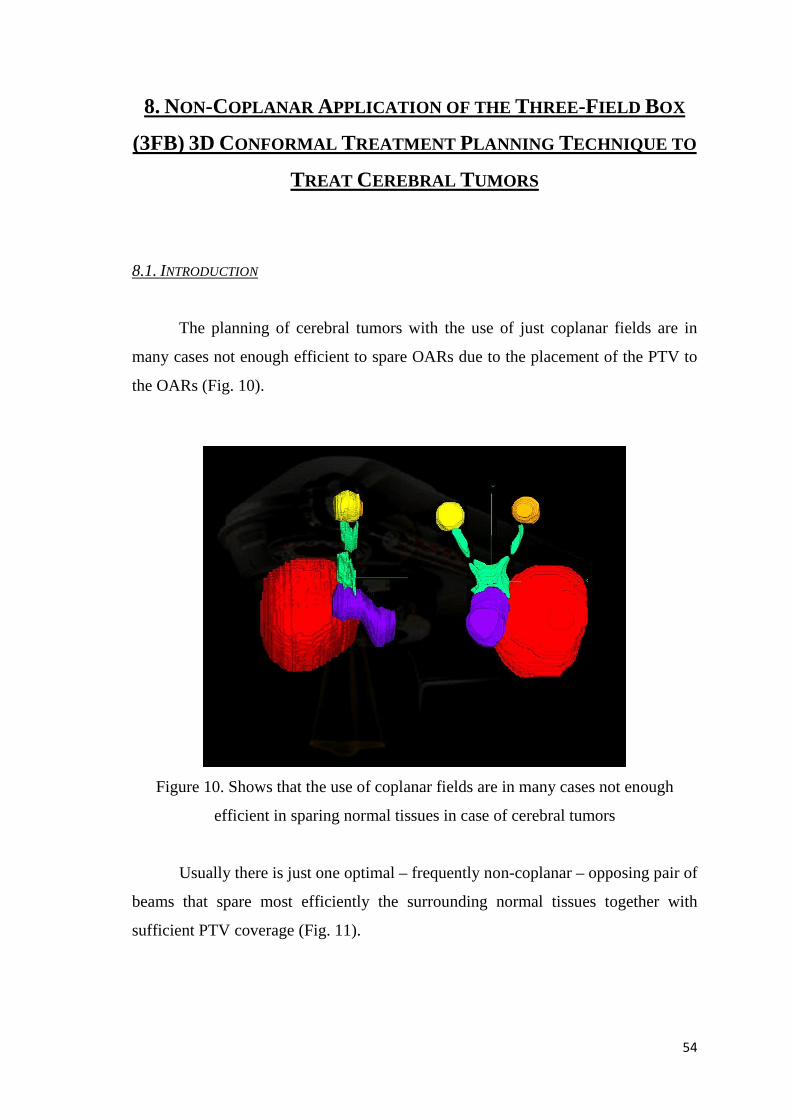
54
8. NON-COPLANAR APPLICATION OF THE THREE-FIELD BOX
(3FB) 3D CONFORMAL TREATMENT PLANNING TECHNIQUE TO
TREAT CEREBRAL TUMORS
8.1. INTRODUCTION
The planning of cerebral tumors with the use of just coplanar fields are in
many cases not enough efficient to spare OARs due to the placement of the PTV to
the OARs (Fig. 10).
Figure 10. Shows that the use of coplanar fields are in many cases not enough
efficient in sparing normal tissues in case of cerebral tumors
Usually there is just one optimal – frequently non-coplanar – opposing pair of
beams that spare most efficiently the surrounding normal tissues together with
sufficient PTV coverage (Fig. 11).
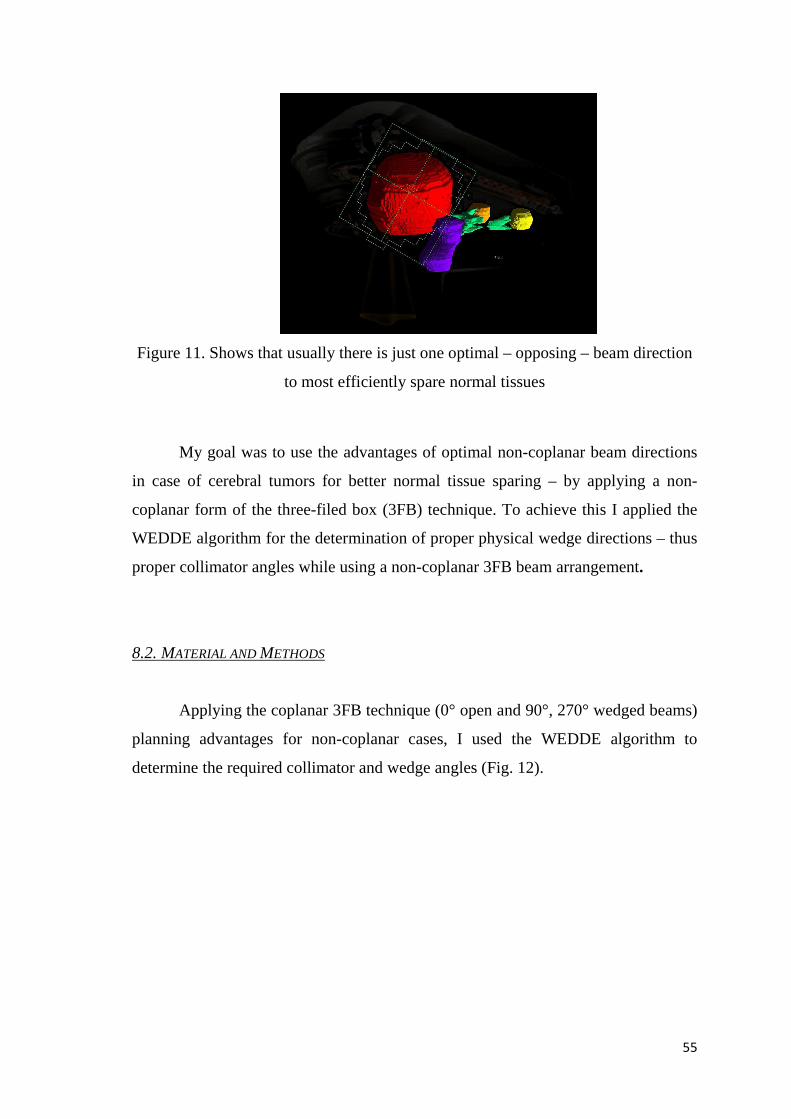
55
Figure 11. Shows that usually there is just one optimal – opposing – beam direction
to most efficiently spare normal tissues
My goal was to use the advantages of optimal non-coplanar beam directions
in case of cerebral tumors for better normal tissue sparing – by applying a non-
coplanar form of the three-filed box (3FB) technique. To achieve this I applied the
WEDDE algorithm for the determination of proper physical wedge directions – thus
proper collimator angles while using a non-coplanar 3FB beam arrangement.
8.2. MATERIAL AND METHODS
Applying the coplanar 3FB technique (0° open and 90°, 270° wedged beams)
planning advantages for non-coplanar cases, I used the WEDDE algorithm to
determine the required collimator and wedge angles (Fig. 12).
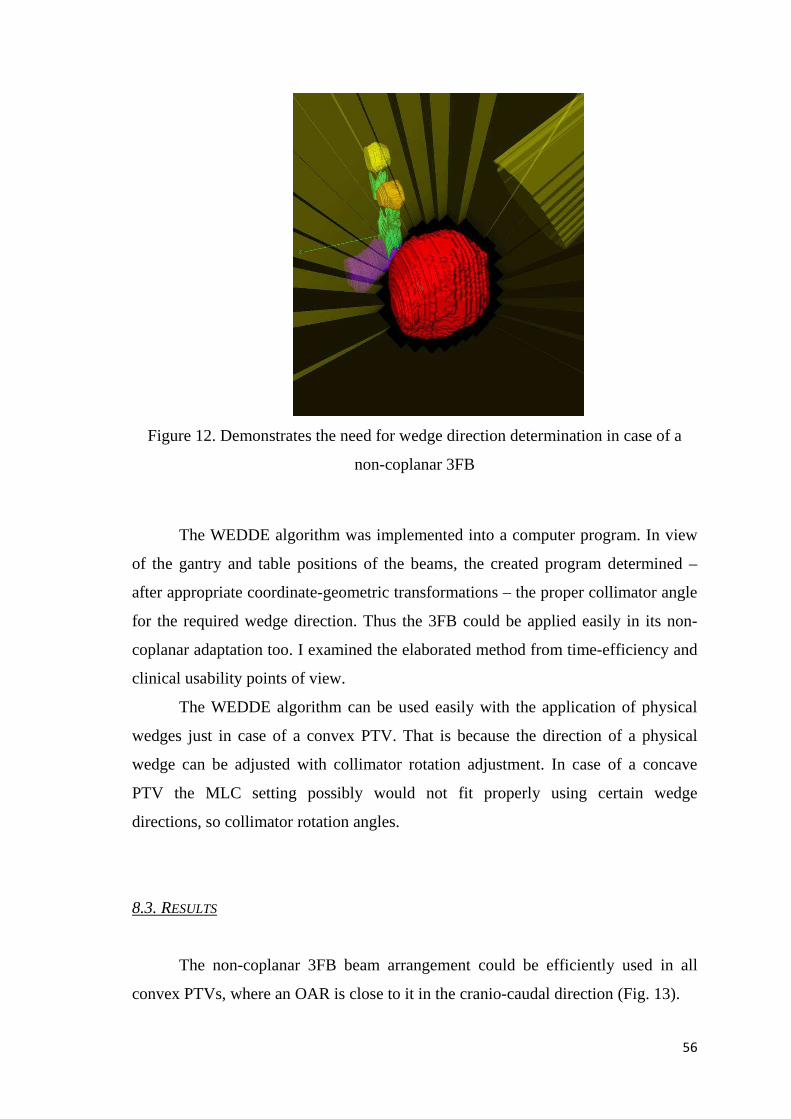
56
Figure 12. Demonstrates the need for wedge direction determination in case of a
non-coplanar 3FB
The WEDDE algorithm was implemented into a computer program. In view
of the gantry and table positions of the beams, the created program determined –
after appropriate coordinate-geometric transformations – the proper collimator angle
for the required wedge direction. Thus the 3FB could be applied easily in its non-
coplanar adaptation too. I examined the elaborated method from time-efficiency and
clinical usability points of view.
The WEDDE algorithm can be used easily with the application of physical
wedges just in case of a convex PTV. That is because the direction of a physical
wedge can be adjusted with collimator rotation adjustment. In case of a concave
PTV the MLC setting possibly would not fit properly using certain wedge
directions, so collimator rotation angles.
8.3. RESULTS
The non-coplanar 3FB beam arrangement could be efficiently used in all
convex PTVs, where an OAR is close to it in the cranio-caudal direction (Fig. 13).
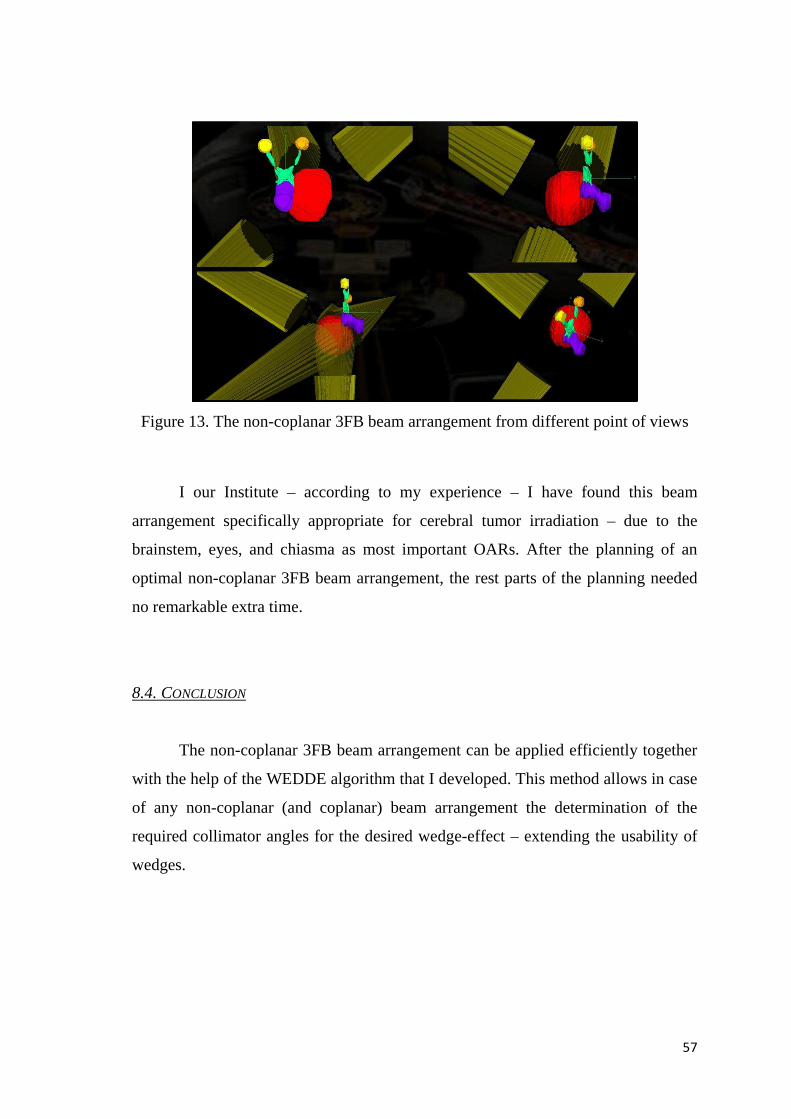
57
Figure 13. The non-coplanar 3FB beam arrangement from different point of views
I our Institute – according to my experience – I have found this beam
arrangement specifically appropriate for cerebral tumor irradiation – due to the
brainstem, eyes, and chiasma as most important OARs. After the planning of an
optimal non-coplanar 3FB beam arrangement, the rest parts of the planning needed
no remarkable extra time.
8.4. CONCLUSION
The non-coplanar 3FB beam arrangement can be applied efficiently together
with the help of the WEDDE algorithm that I developed. This method allows in case
of any non-coplanar (and coplanar) beam arrangement the determination of the
required collimator angles for the desired wedge-effect – extending the usability of
wedges.

58
9. A MODERN 3D CONFORMAL CRANIOSPINAL RADIOTHERAPY
PLANNING METHOD
(MODERN 3D KONFORMÁLIS CRANIOSPINÁLIS BESUGÁRZÁSI
TECHNIKA )
9.1. INTRODUCTION (BEVEZETÉS)
Az előforduló rosszindulatú daganatok kb. 2 %-át a központi idegrendszeri
malignomák teszik ki (94), de gyermekkorban minden harmadik malignoma az
idegrendszerből indul ki. A liquorba történő tumoros disszemináció miatt főleg
gyermekkori és fiatalkori tumorok, mint például a medulloblastoma,
ependymoblastoma esetén a teljes koponya és gerinc besugárzás a rutin onkológiai
ellátás része (95). A craniospinalis irradiáció (CSI) legkritikusabb része a koponyát
és a gerincvelőt tartalmazó hosszú és bonyolult (irreguláris) tervezési céltérfogat
(TCT) miatt alkalmazott mezőillesztések biztonságos és pontosan reprodukálható
megvalósítása. Ha az illesztéseknél aluldozírozunk, akkor nem lesz megfelelő a
tumorkontroll, és ha túldozírozunk, akkor a gerincvelőt a maximális toleranciadózisa
feletti dózissal terheljük. A CSI besugárzástervezése és napi beállítása az egyik
legnehezebb tervezési és sugárterápiás feladat, így célunk a mezők biztonságos
illesztését megkönnyítő, könnyen reprodukálható besugárzási technika kidolgozása
volt.
9.2. MATERIAL AND METHODS (ANYAG ÉS MÓDSZEREK)
Intézetünkben 2007 óta 8 beteg részesült CT alapú 3D konformális CSI
sugárkezelésben postoperatív indikáció alapján (a szövettan 5 esetben
medulloblastoma, és 3 esetben ependymoma volt). Először a beteg megfelelő
rögzítését kellett meghatározni. Ez azért is kiemelten fontos, mert többnyire
gyermekeket, sokszor rosszul kooperáló pácienseket kell kezelnünk. Lényeges, hogy
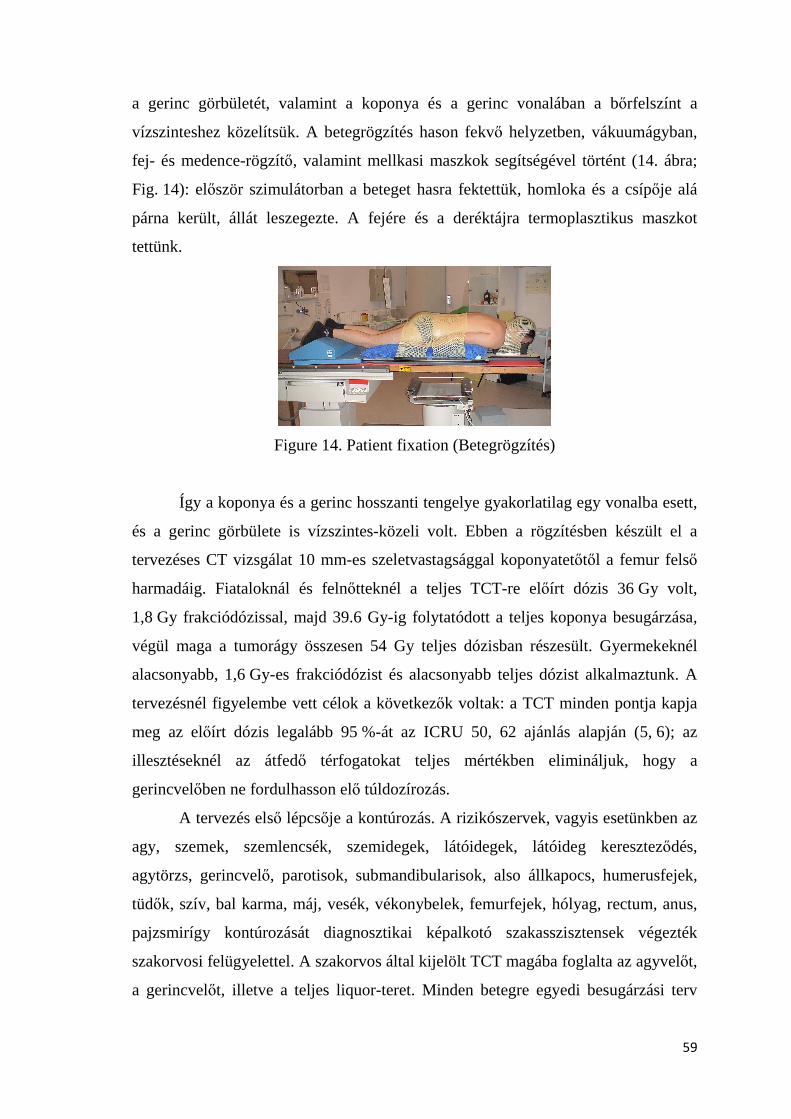
59
a gerinc görbületét, valamint a koponya és a gerinc vonalában a bőrfelszínt a
vízszinteshez közelítsük. A betegrögzítés hason fekvő helyzetben, vákuumágyban,
fej- és medence-rögzítő, valamint mellkasi maszkok segítségével történt (14. ábra;
Fig. 14): először szimulátorban a beteget hasra fektettük, homloka és a csípője alá
párna került, állát leszegezte. A fejére és a deréktájra termoplasztikus maszkot
tettünk.
Figure 14. Patient fixation (Betegrögzítés)
Így a koponya és a gerinc hosszanti tengelye gyakorlatilag egy vonalba esett,
és a gerinc görbülete is vízszintes-közeli volt. Ebben a rögzítésben készült el a
tervezéses CT vizsgálat 10 mm-es szeletvastagsággal koponyatetőtől a femur felső
harmadáig. Fiataloknál és felnőtteknél a teljes TCT-re előírt dózis 36 Gy volt,
1,8 Gy frakciódózissal, majd 39.6 Gy-ig folytatódott a teljes koponya besugárzása,
végül maga a tumorágy összesen 54 Gy teljes dózisban részesült. Gyermekeknél
alacsonyabb, 1,6 Gy-es frakciódózist és alacsonyabb teljes dózist alkalmaztunk. A
tervezésnél figyelembe vett célok a következők voltak: a TCT minden pontja kapja
meg az előírt dózis legalább 95 %-át az ICRU 50, 62 ajánlás alapján (5, 6); az
illesztéseknél az átfedő térfogatokat teljes mértékben elimináljuk, hogy a
gerincvelőben ne fordulhasson elő túldozírozás.
A tervezés első lépcsője a kontúrozás. A rizikószervek, vagyis esetünkben az
agy, szemek, szemlencsék, szemidegek, látóidegek, látóideg kereszteződés,
agytörzs, gerincvelő, parotisok, submandibularisok, also állkapocs, humerusfejek,
tüdők, szív, bal karma, máj, vesék, vékonybelek, femurfejek, hólyag, rectum, anus,
pajzsmirígy kontúrozását diagnosztikai képalkotó szakasszisztensek végezték
szakorvosi felügyelettel. A szakorvos által kijelölt TCT magába foglalta az agyvelőt,
a gerincvelőt, illetve a teljes liquor-teret. Minden betegre egyedi besugárzási terv
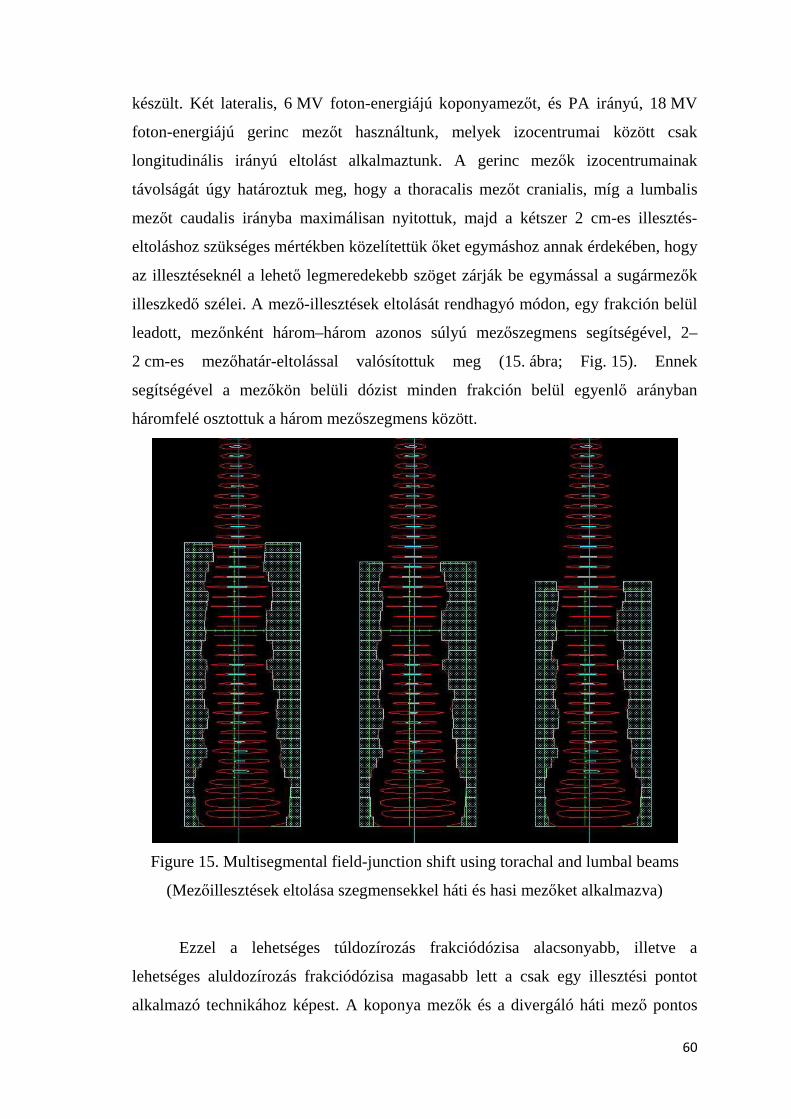
60
készült. Két lateralis, 6 MV foton-energiájú koponyamezőt, és PA irányú, 18 MV
foton-energiájú gerinc mezőt használtunk, melyek izocentrumai között csak
longitudinális irányú eltolást alkalmaztunk. A gerinc mezők izocentrumainak
távolságát úgy határoztuk meg, hogy a thoracalis mezőt cranialis, míg a lumbalis
mezőt caudalis irányba maximálisan nyitottuk, majd a kétszer 2 cm-es illesztés-
eltoláshoz szükséges mértékben közelítettük őket egymáshoz annak érdekében, hogy
az illesztéseknél a lehető legmeredekebb szöget zárják be egymással a sugármezők
illeszkedő szélei. A mező-illesztések eltolását rendhagyó módon, egy frakción belül
leadott, mezőnként három–három azonos súlyú mezőszegmens segítségével, 2–
2 cm-es mezőhatár-eltolással valósítottuk meg (15. ábra; Fig. 15). Ennek
segítségével a mezőkön belüli dózist minden frakción belül egyenlő arányban
háromfelé osztottuk a három mezőszegmens között.
Figure 15. Multisegmental field-junction shift using torachal and lumbal beams
(Mezőillesztések eltolása szegmensekkel háti és hasi mezőket alkalmazva)
Ezzel a lehetséges túldozírozás frakciódózisa alacsonyabb, illetve a
lehetséges aluldozírozás frakciódózisa magasabb lett a csak egy illesztési pontot
alkalmazó technikához képest. A koponya mezők és a divergáló háti mező pontos

61
illesztését megfelelő kollimátor-forgatással állítottuk be (16. ábra; Fig. 16). A
PrecisePLAN (Elekta, PrecisePLAN 2.02/2.03, Crawley, UK) tervezőrendszerrel
készült tervet onkoterápiás team fogadta el, majd a betegek a sugárkezelést Elekta
Precise TS gyorsítón kapták meg.
Figure 16 The matching of cerebral and torachal beams with proper collimator
rotation (Koponya mezők háti mezőhöz illesztése megfelelő kollimátor-forgatással)
A módszer továbbfejlesztésére és a szövődmények esélyének csökkentésére
egy másik változtatást is bevezettünk az elmúlt időszakban. A beteg testalkatától,
magasságától függően az illesztések számát kettőről egyre csökkentettük a
gerincvelőt ellátó thoracalis és lumbalis mezők helyett használt egy háti mező
fókusz-bőr távolságának (SSD) növelésével (17. ábra; Fig. 17).

62
Figure 17. Multisegmental field-junction shift using one torachal beam
(Mezőillesztés eltolása szegmensekkel egy háti mezők alkalmazva)
A sugármezők térbeli elhelyezkedését az egy illetve két illesztést alkalmazó
CSI esetén a 18. ábra (Fig. 18) szemlélteti.
Figure 18. The spatial arrangement of irradiation beams using (a) one or (b) two
field-junctions (A sugármezők tárbeli elhelyezkedése egy (a) illetve két (b) illesztést
alkalmazó craniospinális besugárzás esetén)
CSI alkalmazásánál a sokszor TCT-n kívülre eső maximális dózisok
csökkentése érdekében egy másik – multiszegmentális emlőbesugárzásnál használt –
technikát is alkalmaztunk. Ennek során a százalékos dózisfelhőben a maximális
dózishoz képest 3-4 %-al alacsonyabb dózist fennhagyva olyan kis súlyú szegmenst
hoztunk létre, mely a maximális dózisú részeket kitakarja. Így több százalékkal
csökkentettük a maximális dózist (27).
A kezelés előtti szimulálás során a koponyamezők izocentrumát jelöltük be.
A thorachalis és lumbalis gereincmezők izocentrumát a kezeléskor longitudinális
irányú eltolással állítottuk be. Az első kezelés előtt a terápiás sugárnyalábok és
lateralis irányú ellenőrző mezők felhasználásával röntgen-felvételek (EPI-k)
készültek mindegyik izocentrumról, amelyek alapján szükséges esetben a
betegbeállítás javítását (módosítását) elvégeztük.
9.3. RESULTS (EREDMÉNYEK)
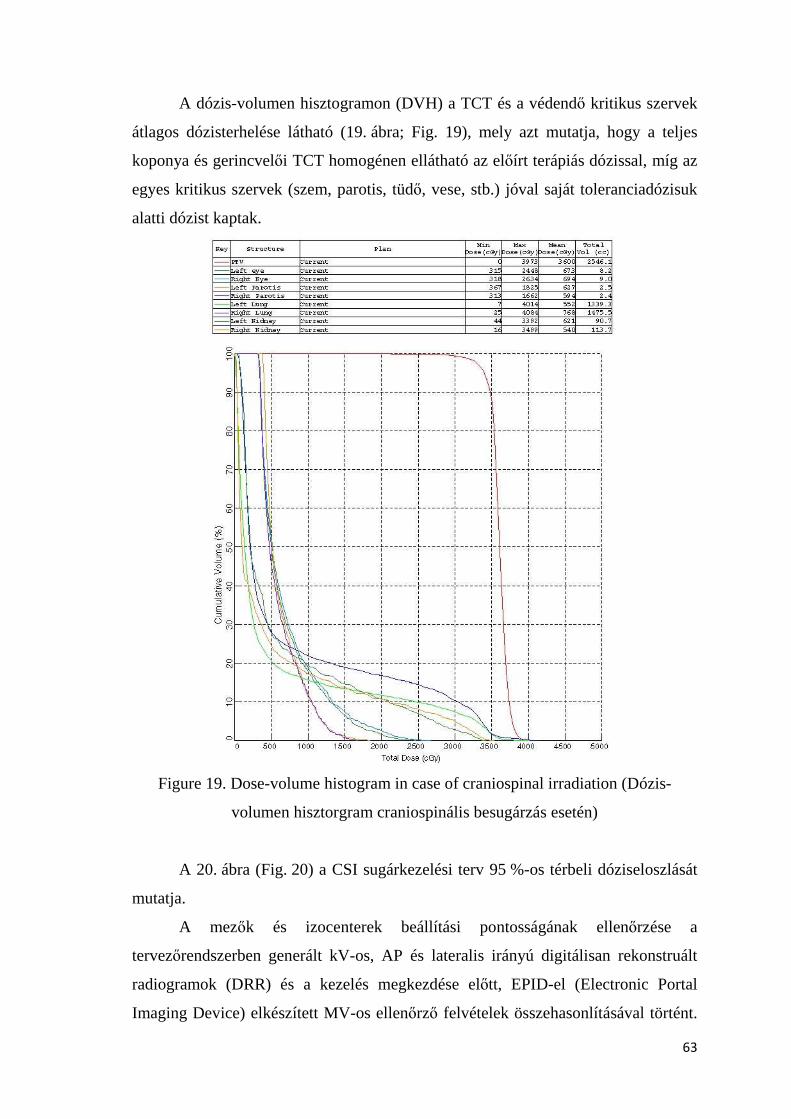
63
A dózis-volumen hisztogramon (DVH) a TCT és a védendő kritikus szervek
átlagos dózisterhelése látható (19. ábra; Fig. 19), mely azt mutatja, hogy a teljes
koponya és gerincvelői TCT homogénen ellátható az előírt terápiás dózissal, míg az
egyes kritikus szervek (szem, parotis, tüdő, vese, stb.) jóval saját toleranciadózisuk
alatti dózist kaptak.
Figure 19. Dose-volume histogram in case of craniospinal irradiation (Dózis-
volumen hisztorgram craniospinális besugárzás esetén)
A 20. ábra (Fig. 20) a CSI sugárkezelési terv 95 %-os térbeli dóziseloszlását
mutatja.
A mezők és izocenterek beállítási pontosságának ellenőrzése a
tervezőrendszerben generált kV-os, AP és lateralis irányú digitálisan rekonstruált
radiogramok (DRR) és a kezelés megkezdése előtt, EPID-el (Electronic Portal
Imaging Device) elkészített MV-os ellenőrző felvételek összehasonlításával történt.

64
Így az izocentrumokat manuálisan 2 mm-es pontossággal lehetett minden
ortogonális irányban beállítani.
Figure 20. The 95 % volumetric dose distribution of a craniospinal irradiation plan
(A craniospinális sugárkezelési terv 95 %-os térbeli dóziseloszlása)
Az első kezelés előtt alkalmazott ortogonális mező-verifikációs felvételek
többlet-elkészítési idejétől eltekintve az átlagos kezelési idő 10 perc volt, amin felül
még átlagosan 5 perc volt a betegpozícionálás ideje.
A szilárdtest fantomban, filmmel végzett verifikáció az elnyelt terápiás dózis
homogenitását és az illesztések pontosságát igazolta. A betegről filmmel készült
verifikáció hasonlóképpen a leadott terápiás dózis homogenitását és az illesztések
pontosságát igazolta (21. ábra; Fig. 21).
Figure 21. Verification with a film (Filmmel végzett verifikáció)

65
Mindent figyelembe véve módszerünkkel több ponton is jelentősen
csökkentettük az illesztéseknél esetlegesen előforduló összefekvő területek miatt
fellépő túldozírozás, illetve aluldozírozás következtében fellépő frakciódózis-
változás nagyságát.
Kezelt betegeinknél az akut mellékhatásokat tekintve grade 1-es, grade 2-es
sugárdermatitis több esetben előfordult. Grade 3-as hematológiai mellékhatás csak
korábban kemoterápiában részesült betegeknél volt. Késői mellékhatást az eddigi
követési időszak során nem tapasztaltunk.
9.4. DISCUSSION (MEGBESZÉLÉS)
A sugárterápiás besugárzástervezés és kezelés egyik legnagyobb kihívása a
CSI besugárzás pontos kivitelezése. Az irreguláris alakú TCT-ban a homogén
dóziseloszlás elérése komoly feladatot jelent. A hosszú TCT miatt mezőosztás
szükséges. A mezőillesztést a mellékhatások szempontjából legveszélyeztetettebb
szerv a gerincvelő, azon belül is a nyaki gerincvelő szintjében kell elvégezni. Ezt a
kihívást az elmúlt évtizedekben többen is próbálták megoldani, és különböző
technikákat dolgoztak ki, mind a jól reprodukálható napi beállítás (és a minimálisan
szükséges mezőszám), mind a biztonságos mezőillesztés szempontjából.
CSI besugárzás-tervezéssel sokan foglalkoztak az utóbbi években a modern
sugárterápia lehetőségeit is maximálisan kihasználva (96-106). Mi Intézetünkben a
technológiai lehetőségeinket is kihasználva, precíz pozícionálással, az izocenterek
között csak longitudinális eltolással, és az egy frakción belül kivitelezett illesztés-
eltolással kiegészítve biztonságos és reprodukálható módszert alakítottunk ki. A
témával foglalkozó publikációk közül többen alkalmaztak sok szempontból
hasonlóan kivitelezett technikát (97, 99, 102, 104, 105).
Az általunk alkalmazott módszerhez leginkább hasonló CSI technikát
elsőként Christ és munkatársai (97) közöltek 2008-ban. 12 esetet elemeztek, a
betegek a hátukon feküdtek. A tervezésnél és sugárkezelésnél 160 cm-es SSD-t
használtak, valamint az illesztésekhez 1,5 cm-es, frakción belüli eltolást
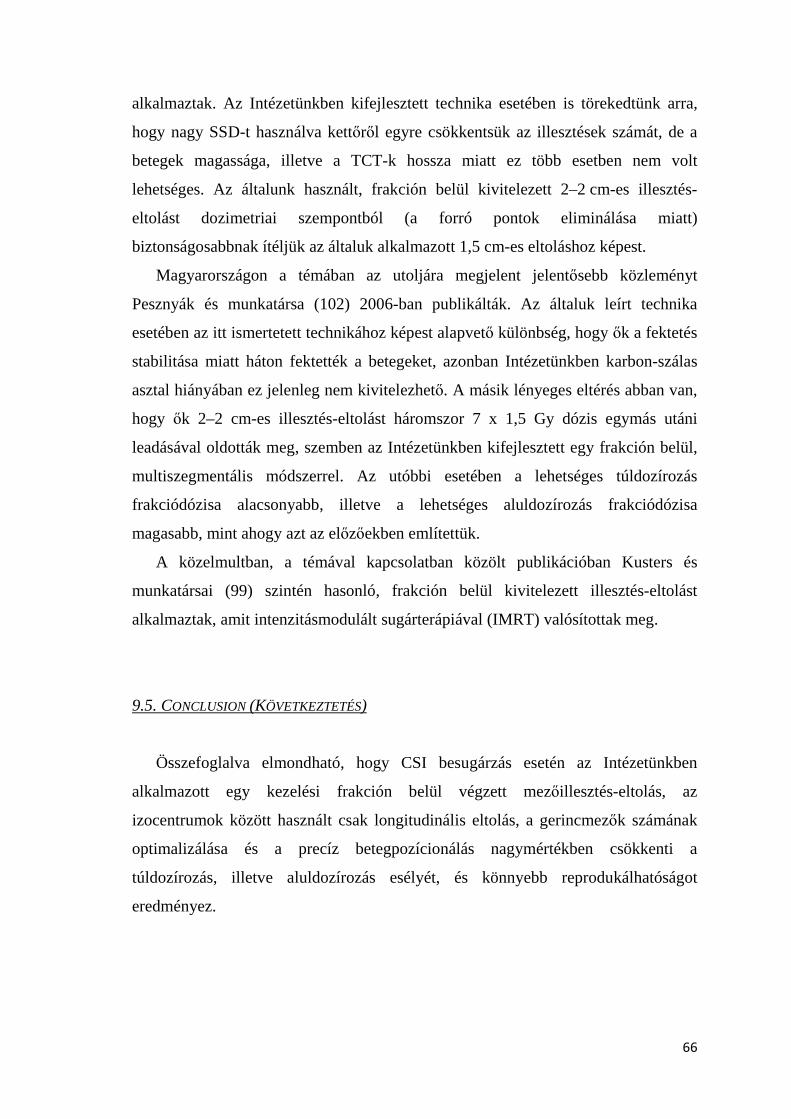
66
alkalmaztak. Az Intézetünkben kifejlesztett technika esetében is törekedtünk arra,
hogy nagy SSD-t használva kettőről egyre csökkentsük az illesztések számát, de a
betegek magassága, illetve a TCT-k hossza miatt ez több esetben nem volt
lehetséges. Az általunk használt, frakción belül kivitelezett 2–2 cm-es illesztés-
eltolást dozimetriai szempontból (a forró pontok eliminálása miatt)
biztonságosabbnak ítéljük az általuk alkalmazott 1,5 cm-es eltoláshoz képest.
Magyarországon a témában az utoljára megjelent jelentősebb közleményt
Pesznyák és munkatársa (102) 2006-ban publikálták. Az általuk leírt technika
esetében az itt ismertetett technikához képest alapvető különbség, hogy ők a fektetés
stabilitása miatt háton fektették a betegeket, azonban Intézetünkben karbon-szálas
asztal hiányában ez jelenleg nem kivitelezhető. A másik lényeges eltérés abban van,
hogy ők 2–2 cm-es illesztés-eltolást háromszor 7 x 1,5 Gy dózis egymás utáni
leadásával oldották meg, szemben az Intézetünkben kifejlesztett egy frakción belül,
multiszegmentális módszerrel. Az utóbbi esetében a lehetséges túldozírozás
frakciódózisa alacsonyabb, illetve a lehetséges aluldozírozás frakciódózisa
magasabb, mint ahogy azt az előzőekben említettük.
A közelmultban, a témával kapcsolatban közölt publikációban Kusters és
munkatársai (99) szintén hasonló, frakción belül kivitelezett illesztés-eltolást
alkalmaztak, amit intenzitásmodulált sugárterápiával (IMRT) valósítottak meg.
9.5. CONCLUSION (KÖVETKEZTETÉS)
Összefoglalva elmondható, hogy CSI besugárzás esetén az Intézetünkben
alkalmazott egy kezelési frakción belül végzett mezőillesztés-eltolás, az
izocentrumok között használt csak longitudinális eltolás, a gerincmezők számának
optimalizálása és a precíz betegpozícionálás nagymértékben csökkenti a
túldozírozás, illetve aluldozírozás esélyét, és könnyebb reprodukálhatóságot
eredményez.
67
10. GENERAL CONCLUSIONS
The CONKISS method is an effective and individualizable treatment
planning method to significantly reduce the dose to kidneys, without any significant
change in the conformity and homogeneity. This OAR sparing could potentially
allow either dose escalation – thus further enhancing the loco regional control – or to
further decrease the possibility of OAR related side effects – thus ensuring the
possibility to apply any further chemotherapy regimens. Using 3D-CRT the
CONKISS method can be a simple, smart alternative to IMRT.
With the CONRES method the mean dose to the rectum and bladder, the
rectum V40, V50 values and the bladder V40 values could be significantly reduced,
meanwhile the conformity of the plans, the PTV homogeneity and the doses to other
OARs have not changed significantly. Using 3-D CRT the CONRES method allows
the possibility of better OAR sparing and further dose escalation. Similarly to the
CONKISS method, it could be a smart alternative to IMRT.
The non-coplanar 3FB beam arrangement can be applied efficiently together
with the help of the WEDDE algorithm that I developed. This method allows in case
of any non-coplanar (and coplanar) beam arrangement the determination of the
required collimator angles for the desired wedge-effect – extending the usability of
wedges.
In case of CSI with the use of multiple intrafraction junction-shifts, and the
one, just longitudinal movement of the isocenter, the optimization of the number of
spinal fields, and the precisional patient immobilization have been considerably
decreased the possibility to have overdosed and underdosed regions mainly due to
patient positioning. So with this method the reproducibility of the plans improved.
The purpose of my dissertation was successfully accomplished by developing
such pancreas (CONKISS), prostate (CONRES) and cerebral 3D-CRT planning
methods that reduced the dose to the OARs meanwhile the conformity of the plans
and the PTV homogeneities have not changed significantly. The WEDDE algorithm
gives possibility to create other new conformal planning techniques in order to
improve OAR sparing without any compromise in the PTV coverage – similarly to
the CONKISS and CONRES methods.
68
11. REFERENCES
1. Egészségbiztosítás, Magyarország, 2010:
http://www.npk.hu/public/kiadvanyaink/2010/magyar_eu.pdf
2. Faiz M. Khan. Treatment Planning in Radiation Oncology. 2nd ed. 2007.
p116.
3. Halperin EC, Perez CA, Brady LW, et. al. Perez and Brady's Principles and
Practice of Radiation Oncology 5th ed. 2007. p219-20.
4. Faiz M. Khan. The Physics of radiation therapy. 3rd ed. 2003. p467-9.
5. ICRU. Prescribing, recording, and reporting photon beam therapy. Report 50.
Bethesda (MD): International Commission on Radiation Units and
Measurements; 1993.
6. ICRU. Prescribing and reporting photon beam therapy. Report 62.
Washington D.C.: International Commission on Radiation Units and
Measurements; 1999.
7. van Herk M, Remeijer P, Rasch C, Lebesque JV. The probability of correct
target dosage: dose-population histograms for deriving treatment margins in
radiotherapy. Int J Radiat Oncol Biol Phys. 2000; 47(4):1121-35.
8. Du MN, Yu CX, Symons M, et al. A multi-leaf collimator prescription
preparation system for conventional radiotherapy. Int J Radiat Oncol Biol
Phys 1995;32:513-20.
9. Podgorsak EB. Radiation oncology physics: a handbook for teachers and
students. International Atomic Energy Agency (IAEA), Vienna, 2005 p.
10. International Electrotechnical Commission (IEC), “Medical electrical
equipment: Particular requirements for the safety of electron accelerators in
the range 1 MeV to 50 MeV”, European Standard EN Document 60601-2-1,
IEC, Geneva, Switzerland (1998).
11. Spherical to Cartesian coordinates:
http://www.equationsheet.com/eqninfo/Equation-0348.html
12. Equation of a plane: http://paulbourke.net/geometry/planeeq/
69
13. Dihedral Angle – the angle between 2 planes:
http://www.mathsisfun.com/geometry/dihedral-angles.html
14. Brade A, Brierley J, Oza A, et al. Concurrent gemcitabine and radiotherapy
with and without neoadjuvant gemcitabine for locally advanced unresectable
or resected pancreatic cancer: a phase I-II study. Int J Radiat Oncol Biol Phys
2007;67:1027–36.
15. Jemal A, Siegel R, Ward E, et al. Cancer statistics, 2008. CA Cancer J Clin
2008;58:71-96.
16. Ko AH, Quivey JM, Venook AP, et al. A phase II study of fixed-dose rate
gemcitabine plus low-dose cisplatin followed by consolidative
chemoradiation for locally advanced pancreatic cancer. Int J Radiat Oncol
Biol Phys 2007;68:809–16.
17. Keene KS, Rich TA, Penberthy DR, et al. Clinical experience with
chronomodulated infusional 5-fluorouracil chemoradiotherapy for pancreatic
adenocarcinoma. Int J Radiat Oncol Biol Phys 2005;62:97–103.
18. Murphy JD, Adusumilli S, Griffith KA, et al. Full-dose gemcitabine and
concurrent radiotherapy for unresectable pancreatic cancer. Int J Radiat
Oncol Biol Phys 2007;68:801–8.
19. Ben-Josef E, Shields AF, Vaishampayan U, et al. Intensity modulated
radiotherapy (IMRT) and concurrent capecitabine for pancreatic cancer. Int J
Radiat Oncol Biol Phys 2004;59:454–9.
20. Spry N, Harvey J, MacLeod C, et al. 3D Radiotherapy Can Be Safely
Combined with Sandwich Systemic Gemcitabine Chemotherapy in the
Management of Pancreatic Cancer: Factors Influencing Outcome. Int J
Radiat Oncol Biol Phys 2008, In Press, Corrected Proof.
21. Dobbs J, Barrett A, Ash D. Practical radiotherapy planning. 3rd ed. Bristol:
Arnold and Oxford University Press; 1999. p. 247-52.
22. Brown MW, Ning H, Arora B, et al. A Dosimetric analysis of dose escalation
using two intensity-modulated radiation therapy techniques in locally
advanced pancreatic carcinoma. Int J Radiat Oncol Biol Phys 2006;65:274–
83.
70
23. Wilkowski R, Thoma M, Weingandt H, Dühmke E, Heinemann V.
Chemoradiation for Ductal Pancreatic Carcinoma: Principles of Combining
Chemotherapy with Radiation, Definition of Target Volume and Radiation
Dose. JOP. 2005;6:216-30. Review.
24. Dawson LA, Ten Haken RK, Lawrence TS. Partial irradiation of the liver
[Abstract]. Semin Radiat Oncol 2001;11:240-6.
25. Sebestyén Zs, Kovács P, Gulybán Á, et. al. ConKiss: Conformal Kidneys
Sparing 3D Noncoplanaar Radiotherapy Treatment for Pancreatic Cancer as an
Alternative to IMRT. Med Dosim. 2011;36:35-40.
26. Wiggenraad R, Mast M, van Santvoort J, et. al. ConPas: a 3D conformal
parotid gland-sparing irradiation technique for bilateral neck treatment as an
alternative to IMRT. Strahlenther. Oncol. 181:673-82; 2005.
27. Gulyban, Á.; Kovács, P.; Sebestyén, Zs.; et al. Multisegmented tangential
breast fields: a rational way to treat breast cancer. Strahlenther. Oncol.
184:262-9; 2008.
28. Van’t Riet A, Mak AC, Moerland MA, et al. A conformation number to
quantify the degree of conformity in brachytherapy and external irradiation:
Application to the prostate. Int J Radiat Oncol Biol Phys 1997;37:731–36.
29. Feuvret L, Noël G, Mazeron JJ, Bey P. Conformity index: a review. Int J
Radiat Oncol Biol Phys 2006;64:333–42.
30. Van Asselen B, Raaijmakers CPJ, Hofman P, Lagendijk JJW. An improved
breast irradiation technique using three-dimensional geometrical information
and intensity modulation. Radiother Oncol. 2001;58:341-7.
31. Menhel J, Levin D, Alezra D, Symon Z, Pfeffer R. Assessing the quality of
conformal treatment planning: a new tool for quantitative comparison. Phys
Med Biol. 2006;51:5363-75.
32. Lomax NJ, Scheib SG. Quantifying the degree of conformity in radiosurgery
treatment planning. Int J Radiat Oncol Biol Phys 2003;55:1409–19.
33. Weber DC, Trofimov AV, Delaney TF, Bortfeld T. A treatment planning
comparison of intensity modulated photon and proton therapy for paraspinal
sarcomas. Int J Radiat Oncol Biol Phys 2004;58:1596–1606.
71
34. Kozak KR, Kachnic LA, Adams J, et al. Dosimetric feasibility of
hypofractionated proton radiotherapy for neoadjuvant pancreatic cancer
treatment. Int J Radiat Oncol Biol Phys 2007;68:1557–66.
35. Hsiung-Stripp DC, McDonough J, Masters HM, et al. Comparative treatment
planning between proton and X-ray therapy in pancreatic cancer. Med Dosim.
2001;26:255-9.
36. Higgins PD, Sohn JW, Fine RM, Schell M. Three-dimensional conformal
pancreas treatment: comparison of four- to six-field techniques [Abstract]. Int
J Radiat Oncol Biol Phys 1995;31:605–9.
37. Osborne C, Bydder SA, Ebert MA, Spry NA. Comparison of non-coplanar
and coplanar techniques to treat cancer of the pancreas. Australas Radiol.
2006;50:463-7.
38. Bussels B, Goethals L, Feron M, et al. Respiration-induced movement of the
upper abdominal organs: a pitfall for the three-dimensional conformal
radiation treatment of pancreatic cancer. Radiother Oncol. 2003;68:69-74.
39. Gierga DP, Chen GTY, Kung JH, et al. Quantification of respiration-induced
abdominal tumor motion and its impact on IMRT dose distributions. Int J
Radiat Oncol Biol Phys 2004;58:1584–95.
40. Kestin L, Vicini F, Ziaja E, et al. Defining biochemical cure for prostate
carcinoma patients treated with external beam radiation therapy. Cancer
1999;86:1557–66.
41. Hanks GE, Leibel SA, Krall JM, et al. Patterns of care studies: dose–
response observations for local control of adenocarcinoma of the prostate. Int
J Radiat Oncol Biol Phys 1985;11:153–7.
42. Hanks GE, Martz KL, Diamond JJ. The effect of dose on local control of
prostate cancer. Int J Radiat Oncol Biol Phys 1988;15:1299–305.
43. Smit WG, Helle PA, van Putten WL, et al. Late radiation damage in prostate
cancer patients treated by high dose external radiotherapy in relation to rectal
dose. Int J Radiat Oncol Biol Phys 1990;18:23–9.
44. Nguyen LN, Pollack A, Zagars GK, et al. Late effects after radiotherapy for
prostate cancer in a randomized-dose– response study: results of a self-
assessment questionnaire. Urology 1998;51:991–7.
72
45. Sandler HM, Perez-Tamayo C, Ten Haken RK, et al. Dose escalation for
stage C (T3) prostate cancer: minimal rectal toxicity observed using
conformal therapy. Radiother Oncol 1992;23:53–4.
46. Hanks GE, Hanlon AL, Schultheiss TE, et al. Dose escalation with 3D
conformal treatment: five year outcomes, treatment optimization, and future
directions. Int J Radiat Oncol Biol Phys 1998;41:501–10.
47. Zelefsky MJ, Leibel SA, Gaudin PB, et al. Dose escalation with three-
dimensional conformal radiation therapy affects the outcome in prostate
cancer. Int J Radiat Oncol Biol Phys 1998;41:491–500.
48. Michalski JM, Purdy JA, Winter K, et al. Preliminary report of toxicity
following 3D radiation therapy for prostate cancer on 3DOG/RTOG 94-06.
Int J Radiat Oncol Biol Phys 2000;46:391–402.
49. Ryu JK, Winter K, Michalski JM, et al. Interim report of toxicity from 3D
conformal radiation therapy (3D-CRT) for prostate cancer on 3DOG/RTOG
9406, level III (79.2 Gy). Int J Radiat Oncol Biol Phys 2002;54:1036–46.
50. Dearnaley DP, Khoo VS, Norman AR, et al. Comparison of radiation side-
effects of conformal and conventional radiotherapy in prostate cancer: a
randomised trial. Lancet 1999;353:267–72.
51. Koper PC, Stroom JC, van Putten WL, et al. Acute morbidity reduction using
3DCRT for prostate carcinoma: a randomized study. Int J Radiat Oncol Biol
Phys 1999;43:727–34.
52. Peeters ST, Heemsbergen WD, van Putten WL, et al. Acute and late
complications after radiotherapy for prostate cancer: results of a multicenter
randomized trial comparing 68 Gy vs 78 Gy. Int J Radiat Oncol Biol Phys
2005;61:1019–34.
53. Pollack A, Zagars GK, Starkschall G, et al. Prostate cancer radiation dose
response: results of the M.D. Anderson phase III randomized trial. Int J
Radiat Oncol Biol Phys 2002;53:1097–105.
54. Peeters STH, Heemsbergen WD, Koper PCM, et al. Dose–response in
radiotherapy for localized prostate cancer: results of the Dutch multicenter
randomized phase III trial comparing 68 Gy of radiotherapy with 78 Gy. J
Clin Oncol 2006;24:1990–6.

73
55. Zietman AL, DeSilvio ML, Slater JD, et al. Comparison of conventional-
dose vs highdose conformal radiation therapy in clinically localized
adenocarcinoma of the prostate: a randomized controlled trial. JAMA
2005;294:1233–9.
56. Burman C, Chui CS, Kutchek G, et al. Planning, delivery and quality
assurance of IMRT using dynamic multileaf collimator: a strategy for large-
scale implementation for the treatment of carcinoma of the prostate. Int J
Radiat Oncol Biol Phys 1997;39:863–73.
57. Teh BS, Woo SY, Butler EB, et al. Intensity modulated radiation therapy
(IMRT): a new promising technology in radiation oncology. Oncologist
1999;4:433–42.
58. De Meerleer GO, Vakaet LA, De Gersem WRT, et al. Radiotherapy of
prostate cancer with or without IMRT: a planning comparison. Int J Radiat
Oncol Biol Phys 2000;47:639–48.
59. Fenoglietto P, Laliberte B, Allaw A, et. al. Persistently better treatment
planning results of intensity-modulated (IMRT) over conformal radiotherapy
(3D-CRT) in prostate cancer patients with siginificant variation of clinical
target volume and/or organs-at-risk. Radiother Oncol. 2008;88:77-87.
60. Zelefsky MJ, Fuks Z, Hunt M, et al. High dose radiation delivered by
intensity modulated conformal radiotherapy improves the outcome of
localized prostate cancer. J Urol 2001;166:876–81.
61. Ailleres N, Azria D, Thezenas S, et al. Pilot study of conformal intensity
modulated radiation therapy for localized prostate cancer. Cancer Radiother
2004;8:59–69.
62. Teh BS, Woo SY, Mai WY, et al. Clinical experience with IMRT for prostate
cancer with the use of a rectal balloon for prostate immobilization. Med
Dosim 2002;27:105–13.
63. De Meerleer GO, Fonteyne VH, Vakaet L, et al. Intensitymodulated radiation
therapy for prostate cancer: late morbidity and results on biochemical control.
Radiother Oncol 2007;82:160–6.
74
64. Zelefsky MJ, Chan H, Hunt M, et al. Long-term outcome of high dose
intensity modulated radiation therapy for patients with clinically localized
prostate cancer. J Urol 2006;176:1415–9.
65. Jani AB, Su A, Correa D, et al. Comparison of late gastrointestinal and
genitourinary toxicity of prostate cancer patients undergoing intensity-
modulated versus conventional radiotherapy using localized fields. Prostate
Cancer Prostatic Dis 2007;10:82–6.
66. Chen MJ, Weltman E, Hanriot RM, et al. Intensity modulated radiotherapy
for localized prostate cancer: rigid compliance to dose-volume constraints as
a warranty of acceptable toxicity? Radiat Oncol 2007;2:6.
67. Emami B, Lyman J, Brown A, et al.et al Tolerance of normal tissue to
therapeutic irradiation. IJROBP., V.21, p. 109-122, 1991.
68. Fiorino C, Fellin G, Rancati T,. et al. Clinical and Dosimetric Predictors of
Late Rectal Syndrome After 3D-CRT for Localized Prostate Cancer:
Preliminary Results of a Multicenter Prospective Study. Int J Radiat Oncol Biol
Phys 2008;70:1130-7.
69. Radiation Therapy Oncology Group (RTOG) 0126. A Phase III Randomized
Study of High Dose 3D-CRT Versus Standard Dose 3D-CRT in Patients
Treated for Localized Prostate Cancer. (10/18/2004)
70. Lawton CAF, Michalski J, El-Naqa I, et al. Variation in the Definition of
Clinical Target Volumes for Pelvic Nodal Conformal Radiation Therapy for
Prostate Cancer. Int J Radiat Oncol Biol Phys 2009;74:377-82.
71. Sasaoka M, Nishikawa A, Futami T, et al. Rectal dose reduction using three-
dimensional conformal radiotherapy for locally advanced prostate cancer: A
combination of conformal dynamic-arc and five-static field technique.
Radiother. Oncol., V.90, p. 318-324, 2009.
72. Dobbs J, Barrett A, Ash D. Practical radiotherapy planning. 3rd ed. Bristol:
Arnold and Oxford University Press; 1999. p. 247-52.
73. Németh György: Sugárterápia, Springer, 2001 p.
74. Wolff D, Stieler F, Welzel G, et. al. Volumetric modulated arc therapy
(VMAT) vs. Serial tomotherapy, step-and-shoot IMRT and 3D-conformal
RT for treatment of prostate cancer. Radiother Oncol. 2009;93:226-33.
75
75. Kovács P, Sebestyén Zs, Farkas R, et. al. A pelvic phantom for modeling
internal organ motions. Med Dosim. 2010 – In Press
76. Sasaoka M, Nishikawa A, Futami T, et. al. Rectal dose reduction using three-
dimensional conformal radiotherapy for locally advanced prostate cancer: A
combination of conformal dynamic-arc and five-static field technique.
Radiother Oncol. 2009;90:318-24.
77. Vaarkamp J, Adams EJ, Warrington AP, et. al. A comparison of forward and
inverse planned conformal, multi segment and intensity modulated
radiotherapy for the treatment of prostate and pelvic nodes. Radiother Oncol.
2004;73:65-72.
78. Oh CE, Antes K, Darby M, et. al. Comparison of 2D conventional, 3D
conformal, and intensity-modulated treatment planning techniques for
patients with prostate cancer with regard to target-dose homogeneity and
dose to critical, uninvolved structures [Abstract]. Med Dosim. 1999;24:255-
63.
79. Kato T, Obata Y, Kadoya N, et. al. A comparison of prone three-dimensional
conformal radiotherapy with supine intensity-modulated radiotherapy for
prostate cancer: which technique is more effective for rectal sparing?
[Abstract] Br J Radiol. 2009;82:654-61.
80. Verhely LJ. Comparison of three-dimensional conformal radiation therapy
and intensity-modulated radiation therapy systems [Abstract]. Semin Radiat
Oncol 1999;9:78-98.
81. Vaarkamp J, Malde R, Dixit S, et. al. A comparison of conformal and
intensity modulated treatment planning techniques for early prostate cancer
[Abstract]. J Med Imaging Radiat Oncol 2009;53:310-7.
82. Guckenberger M, Meyer J, Baier K, et. al. Distinct effects of rectum
delineation methods in 3D-conformal vs. IMRT treatment planning of
prostate cancer [Abstract]. Radiat Oncol 2006;1:34.
83. Koontz BF, Das S, Temple K, et. al. Dosimetric and radiobiologic
comparison of 3D conformal versus intensity modulated planning techniques
for prostate bed radiotherapy [Abstract]. Med Dosim. 2009;34:256-60.

76
84. Deb P, Fielding A. Radiobiological model comparison of 3D conformal
radiotherapy and IMRT plans for the treatment of prostate cancer [Abstract].
Australas Phys Eng Sci Med 2009;32:51-61.
85. Neal AJ, Oldham M, Dearnaley DP. Comparison of treatment techniques for
conformal radiotherapy of the prostate using dose-volume histograms and
normal tissue complication probabilities. Radiother Oncol. 1995;37:29-34.
86. Luxton G, Hancock SL, Boyer AL. Dosimetry and radiobiologic model
comparison of IMRT and 3D conformal radiotherapy in treatment of
carcinoma of the prostate. Int J Radiat Oncol Biol Phys 2004;59:267-84.
87. Weber DC, Wang H, Cozzi L, et. al. Rapidarc, intensity modulated photon
and proton techniques for recurrent prostate cancer after radiotherapy: A
treatment planning comparison study [Abstract]. Proceedings of the 51st
Annual ASTRO Meeting.
88. Wang-Chesebro A, Xia P, Coleman J, et. al. Intensity-modulated
radiotherapy improves lymh node coverage and dose to critical structures
compared with three-dimensional conformal radiation therapy in clinically
localized prostate cancer. Int J Radiat Oncol Biol Phys 2006;66:654-62.
89. Fenoglietto P, Laliberte B, Allaw A, et. al. Persistently better treatment
planning results of intensity-modulated (IMRT) over conformal radiotherapy
(3D-CRT) in prostate cancer patients with siginificant variation of clinical
target volume and/or organs-at-risk. Radiother Oncol. 2008;88:77-87.
90. Palma D, Vollans E, James K, et. al. Volumetric modulated arc therapy for
delivery of prostate radiotherapy: comparison with intensity-modulated
radiotherapy and three-dimensional conformal radiotherapy. Int J Radiat
Oncol Biol Phys 2008;72:996-1001.
91. Wolff D, Stieler F, Welzel G, et. al. Volumetric modulated arc therapy
(VMAT) vs. Serial tomotherapy, step-and-shoot IMRT and 3D-conformal
RT for treatment of prostate cancer. Radiother Oncol. 2009;93:226-33.
92. Palma D, Vollans E, James K, et. al. Volumetric modulated arc therapy for
delivery of prostate radiotherapy: comparison with intensity-modulated
radiotherapy and three-dimensional conformal radiotherapy. Int J Radiat
Oncol Biol Phys 2008;72:996-1001.
77
93. Zhang P, Happersett L, Hunt M, et. al. Volumetric modulated arc therapy:
planning and evaluation for prostate cancer cases. Int J Radiat Oncol Biol
Phys 2010;76:1456-62.
94. Brada M. A központi idegrendszer daganatai. In: A klinikai onkológia
kézikönyve. Szerk. Love RR, Springer Hungarica, Budapest, 1995, pp. 449-
65.
95. Mangel L. A központi idegrendszeri daganatok In: Sugárterápia Szerk.
Németh Gy, Springer Hungarica, Budapest, 2001, pp. 479-97.
96. Chang EL, Wong P-F, Forster KM, et al. Verification techniques and dose
distribution for computed tomographic planned supine craniospinal radiation
therapy. Med Dosim 28:127-31, 2003.
97. Christ G, Denninger D, Dohm OS, et al. Craniospinal Radiotherapy in an
Advanced Technique. Strahlenther Oncol 184:530-5, 2008.
98. Hawkins RB. A simple method of radiation treatment of craniospinal fields
with the patient supine. Int J Radiat Oncol Biol Phys 49:261-4, 2001.
99. Kusters JM, Louwe RJ, van Kollenburg PG, et al. OPTIMAL NORMAL
TISSUE SPARING in Craniospinal Axis Irradiation Using IMRT with Daily
Intrafractionally Modulated Junction(s). Int J Radiat Oncol Biol Phys 2011 In
Press.
100. Michalski JM, Klein EE, Gerber R. Method to plan, administer, and verify
supine craniospinal irradiation. J Appl Clin Med Phys 3:310-6, 2002.
101. Parker WA, Freeman CR. A simple technique for craniospinal radiotherapy
in the supine position. Radiother Oncol 78:217-22, 2006.
102. Pesznyák Cs, Póti Zs. Új besugárzási technika craniospinális céltérfogat
ellátására. Magyar Onkológia 50:341-4, 2006.
103. Rades D, Holtzhauer R, Baumann R, et al. Craniospinal axis irradiation in
children. Treatment in supine position including field verification as a
prerequisite for anesthesia without intubation. Strahlenther Oncol 175:409-
12, 1999.
104. Seppälä J, Kulmala J, Lindholm P, et al. A method to improve target dose
homogeneity of craniospinal irradiation using dynamic split field IMRT.
Radiother Oncol. 96:209-15, 2010.
78
105. South M, Chiu JK, Teh BS, et al. Supine craniospinal irradiation using
intrafractional junction shifts and field-in-field dose shaping: early
experience at Methodist Hospital. Int J Radiat Oncol Biol Phys 71:477-83
2008.
106. Van Dyk J, Jenkin RDT, Leuing PMK, et al. Medulloblastoma: treatment
technique and radiation dosimetry. Int J Radiat Oncol Biol Phys 2:993-1005
1977.
79
12. SUMMARY
12.1. CONKISS: CONFORMAL KIDNEYS SPARING 3D NON-COPLANAR RADIOTHERAPY
TREATMENT FOR PANCREATIC CANCER AS AN ALTERNATIVE TO IMRT
Background and purpose: When treating pancreatic cancer using standard three-
dimensional conformal radiotherapy (3D-CRT) beam arrangements (ST) the kidneys
often receive higher dose than their probable tolerance limit. My aim was to
elaborate a new planning method that – similarly to IMRT –effectively spares the
kidneys without compromising the target coverage.
Material and methods: The conformal kidneys sparing (CONKISS) five-field, non-
coplanar plans were compared with ST plans for consecutive 23 patients
retrospectively. Optimal beam arrangements were used consisting a left and a right
wedged beam-pair and an AP beam inclined in the caudal direction. The wedge
direction determination (WEDDE) algorithm was developed to adjust the adequate
direction of wedges. The aimed OAR mean dose limits were: kidney <12 Gy,
liver <25 Gy, small bowels <30 Gy, and spinal cord maximum <45 Gy. Conformity
and homogeneity indexes with two tailed t-test were used to evaluate and compare
the different planning approaches.
Results: The mean dose to the kidneys decreased significantly (p < 0.05): left kidney
7.7 vs. 10.7 Gy, right kidney 9.1 vs. 11.7 Gy, meanwhile the mean dose to the liver
increased significantly (18.1 vs. 15.0 Gy). The changes in the conformity,
homogeneity, and in the doses to other OARs were not significant.
Conclusions: The CONKISS method balances the load among the OARs and
significantly reduces the dose to the kidneys, without any significant change in the
conformity and homogeneity. Using 3D-CRT the CONKISS method can be a smart
alternative to IMRT in order to enhance the possibility of dose escalation.
80
12.2. CONRES: CONFORMAL RECTUM SPARING 3D NON-COPLANAR RADIOTHERAPY
TREATMENT FOR PROSTATE CANCER AS AN ALTERNATIVE TO IMRT
Background and purpose: When treating prostate cancer using standard three-
dimensional conformal radiotherapy (3D-CRT) beam arrangements (ST) the rectum
(V40, V50) often receive higher dose than its probable tolerance limit. My aim was
to elaborate a new planning method that – similarly to IMRT –effectively spares the
rectum without compromising the target coverage.
Material and methods: The conformal rectum sparing (CONRES) five-field, non-
coplanar plans were compared with ST plans for consecutive 27 patients
retrospectively. Optimal beam arrangements were used consisting a left and a right
wedged beam-pair and an AP beam inclined in the cranial direction. The wedge
direction determination (WEDDE) algorithm was used to adjust the adequate
direction of wedges. The aimed OAR mean dose limits were: rectum <60 Gy,
bladder <65 Gy, femoral heads <52 Gy,and rectum V40 <70 %, V50 <55 %,,
V60 <50 %,, V70 <25 %,, V75 <15 %, and bladder V65 <40 %,, V70 <35 %,,
V75 <25 %,. Conformity and homogeneity indexes with two tailed t-test were used
to evaluate and compare the different planning approaches.
Results: The mean dose to the rectum and bladder, the rectum V40, V50 and the
bladder V40 decreased significantly (p < 0.05): 51.4 vs. 45.2 Gy, 51.6 vs. 44.0 Gy,
87.2 vs. 52.9 %, 56.1 vs. 45.6 %, 69.5 vs. 49.0 %, respectively. The changes in the
conformity, homogeneity and in the doses to other OARs were not significant.
Conclusion: With the CONRES method the mean dose to the rectum and to the
bladder, the rectum V40, V50 and the bladder V40 values could be significantly
reduced, meanwhile the conformity of the plans, the PTV homogeneity and the
doses to other OARs have not changed significantly. Using 3-D CRT the CONRES
method allows the possibility of better OAR sparing and further dose escalation
(e.g., in case of cerebral tumor irradiation with a non-coplanar 3FB).
81
12.3. MODERN 3D CONFORMAL CRANIOSPINAL RADIOTHERAPY PLANNING METHOD
The main problem of cranio-spinal (CSI) radiotherapy is the matching of the
fields. The use of a suitable technique is very important, because matching of the
fields were necessary to use for the optimal cancer irradiation of the long planning
target volume (PTV). Since 2006, 8 patients received CT-based, 3D-planned
conformal CSI irradiation in my Institute. Patient-immobilization was made in prone
position in a vacuum-bed using skull and pelvis masks. Organ-at-risk (OAR)
contours were made by radiographers. The PTV was contoured by radiation
oncologists. The prescribed dose to the PTV was 36 Gy with 1.8 Gy dose per
fraction. In the planning process the following aspects were taken under
consideration: all points of the PTV had to receive at least 95 % of the prescribed
dose (according to ICRU 50, 62); at junction field edges the overlapping parts were
eliminated using a multisegmental technique, where the adjacent segment ends of
the neighbouring fields were shifted two times 2 cm, so that the three equally-
weighted segments used in one field had 2–2 cm distance from each other. In the
CSI planning of irradiation the shape of the patient and so the length of the PTV has
made a big emphasis on determining the number of field matching. Thus in some
cases instead of two, only one field matching was enough – this could be achieved
by increasing the source-to-skin distance (SSD) of the fields. The verification made
with a solid-water phantom justified the precision of the field matching. The offset
used at junction field edges in between one treatment facilitates the verification of
field matching – and so the patient positioning. Thus the possibility of having
overdosed regions could be reduced, which was very important from a radiation-
biological point of view.
82
13. PUBLICATIONS AND CONFERENCE ABSTRACTS CATALOG
13.1. PUBLICATIONS
1. Zsolt Sebestyén, P. Kovács, Á. Gulybán, R. Farkas, Sz. Bellyei, G. Liposits,
A. Szigeti, O. Ésik, K. Dérczy, L. Mangel. CONKISS: Conformal kidneys
sparing 3D noncoplanar radiotherapy treatment for pancreatic cancer as an
alternative to IMRT. Med Dosim. 2011;36:35-40.
2. Sebestyén Zsolt, Kovács P., Gulybán Á., Farkas R., Bellyei Sz., Szigeti A.,
Gallainé Földvári D., Mangel L. Modern 3D konformális craniospinális
besugárzási technika. Magyar Onkológia 2011 – bírálat utáni elfogadás
folyamatban
3. Gallainé földvári Dóra, Kovács P, Bellyei Sz, Farkas R, Gulybán Á, Mangel L,
Sebestyén Zs, Craniospinális besugárzási technika a pécsi Onkoterápiás
Intézteben. Radiográfus, 2010;1.
83
13.2. CONFERENCE ABSTRACTS
1. Sebestyén Zsolt, Kovács P, Farkas R, Bellyei Sz, Szigeti A, Sebestyén K,
Olaszné Halász J, Mangel L: Prosztata tumorok besugárzástervezése CONRES
technikával, Magyar Sugárterápiás Társaság Kongresszusa 2011.
2. Zsolt Sebestyén, P. Kovács,K. Sebestyén, R. Farkas, Sz. Bellyei, A. Szigeti, L
Mangel: ConRes: Conformal Rectum Sparing 3D Non-Coplanar Radiotherapy
Treatment for Prostate Cancer as an Alternative to IMRT, European Society for
Therapeutic Radiology and Oncology 11th Biennial meeting 2011.
3. Sebestyén Zsolt, Kovács P, Farkas R, Bellyei Sz, Szigeti A, Mangel L:
Prosztata tumorok besugárzástervezése CONRES technikával, Magyar
Orvosfizikus Társaság Kongresszusa 2010.
4. Sebestyén Zsolt, Kovács P, Gulybán Á, Farkas R, Bellyei Sz, Szigeti A,
Liposits G, Dérczy K, Mangel L: Pancreas tumorok besugárzástervezése
CONKISS technikával, Magyar Sugárterápiás Társaság Kongresszusa 2009.
5. Sebestyén Zsolt, Kovács P, Gulybán Á, Farkas R, Bellyei Sz, Szigeti A,
Gallainé Földvári D., Mangel L: Modern 3D konformális craniospinális
besugárzási technika, Magyar Sugárterápiás Társaság Kongresszusa 2009.
6. Zsolt Sebestyen, P Kovacs, R Farkas, Sz Bellyei, G Liposits, A Szigeti, K
Dérczy, Á Gulybán, O Ésik, L Mangel: The conformal kindeys sparing planning
method to treat pancreatic cancer, European Society for Therapeutic Radiology
and Oncology 27th meeting 2008.
7. Sebestyén Zsolt, Gulybán Á, Kovács P, Ésik O, Mangel L: Ékirányszámítás a
hárommezős-box tervezési elrendezés non-koplanáris alkalmazásakor, Magyar
Orvosfizikus Társaság Kongresszusa 2007.
8. Sebestyén Zsolt, Gulybán Á, Kovács P, Farkas R, Bellyei Sz, Liposits G,
Dérczy K, Ésik O, Mangel L: Pancreastumorok 3D konformális
besugárzástervezése CONKISS technikával, Magyar Orvosfizikus Társaság
Kongresszusa 2007.
9. Sebestyén Zsolt, Kovács P, Farkas R, Bellyei Sz, Ésik O, Gulybán Á: Pancreas
tumorok besugárzás tervezése a Pécsi Onkoterápiás Intézetben, Fiatal
Onkológusok és Fiatal Sebészek Fóruma 2007.

84
14. ACKNOWLEDGEMENTS
The writing of a dissertation can be a lonely and isolating experience, yet it is
obviously not possible without the personal support of numerous people.
First of all it is a pleasure to thank those people who have helped and inspired
me during my doctoral study.
My thanks go out to all my colleagues, especially for the phenomenal physics
team in the Institute of Oncotherapy at the University of Pécs. Furthermore I am
especially grateful to Péter Kovács for the excellent team-work.
I am thankful to my supervisor, Tibor Csere, and co-supervisor, László Mangel
for all of their help and supervision.
My deepest gratitude goes to my family and my girlfriend for their unflagging
love and support, encouragement and patience over the last few years; this dissertation
would have been simply impossible without them.
Lastly, I offer my regards and blessings to all of those who helped me in any
respect during the completion of my dissertation.