university of lusaka school of business studies · university of lusaka school of business studies...
TRANSCRIPT

1
UNIVERSITY OF LUSAKA
SCHOOL OF BUSINESS STUDIES
AFIN 107: COST AND MANAGEMENT ACCOUNTING
2010
Prepared by Christopher Siakakole, ACMA, FZICA.

2
TABLE OF CONTENTS
OVERVIEW / INTRODUCTION 2
UNIT TOPIC PAGE
1 Introduction to Cost and Management Accounting 3
2 Cost Accumulation for Product Costing (Job and Batch Costing) 9
3 Cost Classification and Cost Behaviour 19
4 Materials: Stock Recording and Inventory Control 27
5 Materials – Purchasing, Reception and Storage 29
6 Inventory Control 39
7 Costing of Materials 45
8 Marginal Costing Versus Absorption Costing 55
9 Cost Behaviour and Cost-Volume-Profit (CVP) Analysis 72
10 CVP Analysis Formula and Break-Even Charts 83
11 Relevant Costing and Decision Making 92
12 Short Term Decisions 101
13 Budgeting and Budgetary Control 112
14 Flexible Budgets 122
15 Alternative Budget System 125
16 Standard Costing and Variance Analysis 131
17 Further Variance Analysis 136
18 Absorption Costing, Activity-Based Costing and Marginal Costing 145
19 Process Costing 162
20 Joint Products and By-products 172
21 Service Costing 178

3
INTRODUCTION / OVERVIEW
This module is meant to give information relating to the course in Cost and Management
Accounting. In order to exhibit adequate information to the students, the module has brought on
board all the relevant topics that are contained in a standard Cost and Management Accounting
paper.
In order to enrich the document, it has topics that relate to computations and more importantly
areas that involve aspects of Decision making.
The module goes further to compare the three (3) aspects of Cost Accounting, Financial
Accounting and Management Accounting.
Key topics such as those relating to Budgeting, Break-even Analysis, Decision Making, Variance
Analysis, Activity Based Costing and many others have also been covered.
At the end of each unit, there are some brief review questions to enable students compute and
attempt some of the questions for their learning to become practical.

4
UNIT 1
INTRODUCTION TO COST AND MANAGEMENT ACCOUNTING
LEARNING OUTCOMES
After studying this lecture, students should be able to:
Define Cost Accounting and Management Accounting;
Understand the rage of information provided by the cost accounting system;
Compare and contrast between Cost Accounting, Management Accounting and Financial
Accounting;
Explain the nature and meaning of responsibility accounting and the use of cost centres,
profit centres, and investment centres.
PURPOSE OF MANAGEMENT INFORMATION
The role of managers
Managers within any organization are decision-makers. The have to make decisions bout what
should be done and then issue instructions based on the decisions they have taken. Decisions can
be categorized as planning decisions and control decisions.
Planning decisions - These are decisions relating to what should be done in order to meet
certain objectives. These can be decisions for the long-term or for the short-term. Many
organizations try to work within the framework of an annual plan or budget, but strategic
planning can be for a longer period ahead and much planning is undertaken on a day-to-
day or weekly basis.
Control decisions - These relate to monitoring what is actually happening and if anything
seems to be going wrong deciding what should be done in order to correct the problem.
Control decisions relate to monitoring the direction of performance as budgeted
information is compared against actual performance.
COST AND MANAGEMENT ACCOUNTING
Managers need detailed information about the working of the business to enable them plan,
control and make the relevant decisions. The Cost and management accounting system
provides financial information regarding the financial aspects of business performance
needed by management
MANAGEMENT ACCOUNTING
Management Accounting is the application of the principles of accounting and financial
management in order to create, protect, preserve and increase value so as to deliver that

5
value to the stakeholders of profit and not for profit organizations both public and private
sector environments.
Management Accounting is a wider concept involving professional knowledge and skill in
the preparation and particularly the presentation of information to all levels of management
in the organization structure. The source of such information is the financial and cost
accounts. The information is intended to assist management in its policy and decision-
making , planning and control activities.
COST ACCOUNTING
Cost accounting is the establishment of budgets, standard costs and actual costs of
operations, processes, activities or products and the analysis of variances profitability or
social use of funds to help determine the direction of cost.
Cost accounting involves the application of a comprehensive set of principles, methods and
techniques to the determination and appropriate analysis of costs to suit the various parts of
the organization structure within a business.
Cost accounting and Management accounting are terms which are used interchangeably.
Cost accounting is part of Management accounting. Cost accounting provides a bank of data
for the management accountant to uses. Cost accounting aims at establishing the following:
(a) The cost of goods produced or services provided;
(b) The cost of a department or work station;
(c) What revenues have been;
(d) The profitability of a product, service or department or the organization in total;
(e) Selling prices;
(f) The value of stocks of goods;
(g) Future costs of goods and services; and
(h) Comparison of actual and budgeted costs.
COST ACCOUNTING SYSTEM
A cost accounting system is a system used by an organization in order to gather, store and also
analyze data relating to costs. The purpose of a cost accounting system is to provide
management information about costs and profits.
Cost accounting involves the application of a comprehensive set of principles, methods and
techniques to the determination and appropriate analysis of costs to suit the various parts of the
organization structure within a business.

6
A cost accounting system is often the basis for a management accounting system. The terms
“Cost accounting” and “Management accounting” are often used to mean the same thing though
there are some basic differences.
Benefits of Cost Accounting
The overriding benefit is the provision of information which can be used specifically to:
(a) Disclose profitable and unprofitable activities;
(b) Identify waste and inefficiency;
(c) Analyze movements in profit;
(d) Estimate and fix selling prices;
(e) Valuation of stock;
(f) Develop Budgets and standards to assist planning and control;
(g) Evaluate the cost effects of policy decisions.
FINANCIAL ACCOUNTING AND COST AND MANAGEMENT ACCOUNTING
Financial accounting is the classification and recording of the monetary transactions of an entity
in accordance with established concepts, principles, accounting standards and legal requirements
and their presentation by means of Profit and Loss accounts, Balance Sheet and Cash Flow
Statements, during and at the end of an accounting period.
The financial accounts record transactions between the business and its customers, suppliers,
employees and owners eg. shareholders. The managers of the business must account for the
way in which funds entrusted to them have been used and, therefore, records of assets and
liabilities are required as well as a statement of any increase in the total wealth of the business.
This is done by presenting a Balance sheet and the Profit and Loss Account at least once a year.
Many businesses have a financial accounting system with a nominal ledger, sales ledger and
purchases ledger and books of prime entry for recording transactions that have occurred during a
given period.

7
FINANCIAL ACCOUNTING MANAGEMENT ACCOUNTING
Limited companies are required * There is no legal requirement to prepare
by law to prepare financial accounts. management accounts.
The law and financial reporting * Management accounting formats are
Standards prescribe formats of entirely at the discretion off manage-
Published financial statements. ment.
Most financial accounting * Management accounts incorporate
information is of a monetary both monetary and non-monetary
nature. measures.
Financial accounts present an * Management accounts are both
essentially historic picture of historical record and future planning
past operations.
Financial information is * Management accounting information
Informative on performance. Is futurative for decision making.
Financial accounting information * Management accounting is for internal
is for external use. use.
INTERNAL REPORTING STRUCTURES
When costs are recorded, analyzed and reported, it is important that they are reported to the
managers or departments responsible for the spending. In other words, the reporting of cost
information should ideally be based on a system of responsibility accounting and responsibility
centres.
Responsibility Accounting
This is a system of providing financial information to management where the structure of the
reporting system is based on identifying individual parts of a business which are a responsibility
of a single manager.
Responsibility Centre
A Responsibility centre is an individual part of a business whose manager has personal
responsibility for its performance.
Many businesses are structured into a hierarchy of responsibility centres. These mighft be cost
centres, revenue centres, profit centres and investment centres.
At the lowest level of the hierarchy is the cost centre and at the highest is the investment centre.

8
Cost Centre
A Cost Centre can be defined as a production or service location, function, activity or item of
equipment whose costs may be accumulated and attributed to cost units.
A Cost Centre is a small part of a business in respect of which costs may be determined and
when related to cost units. Terminology varies from organization to organization, but the small
part of a business could be a whole department or merely a sub-division of a department. A
number of departments together would comprise a function. Thus a cost centre could be a
location, function or item of equipment or a group or combination of any of these.
Revenue Centre
A Revenue centre is part of the organization that earns sales revenue, its manager is responsible
for the revenue earned but not for the cost of the operation.
Profit Centre
A profit Centre is a part of the business for which both the costs and revenues earned are
identified. The Manager is responsible for both costs and revenues.
Investment Centre
An Investment Centre is a profit centre with additional responsibilities for capital employed and
possibly investment decisions. Managers of investment centres are responsible not for decisions
affecting costs and revenues only but also investment decisions.
CATEGORY OF COSTS
Costs are incurred in business on the following:
Direct materials;
Direct labour;
Direct expenses;
Production overheads;
Administrative overheads;
General overheads.
When costs are incurred, they are generally allocated to cost centres. Cost centres are simply
collection points for costs for further analysis.
Cost Units
Once costs have been traced to cost centres, they can further analyzed in order to establish cost
per unit. -`

9
A Cost Unit is a unit of production or unit of activity in relation to which cost is measured. The
cost unit is a basic control unit for costing purposes.
A cost unit is a unit of product or service in relation to which costs are ascertained.
The physical measure of product or service for which costs can be determined, is a cost unit. In
a printing firm for example, the cost unit would be the specific customer order. For a paint
manufacturer, the unit would be a litre of paint, to the milk supplier, it would be a litre of milk
etc.
Cost units are measured for several reasons:
To establish how much it has cost to produce an item or perform an activity;
To measure profit or loss on an item;
To value closing stocks;
To compare costs with budgeted costs.
Cost object
A Cost object is any activity for which a separate measurement of costs is desired.
KEY TERMS
Responsibility Accounting – A system of providing financial information to management, where
the structure of the reporting system is based on identifying individual parts of a business which
are the responsibility of a single manager.
Responsibility Centre – An individual part of a business whose manager has personal
responsibility for its performance.
Cost Centre – A location, function, activity or item of equipment for which costs are
accumulated and attributed to cost units.
Profit Centre – A part of the business or which both the costs incurred and revenues earned are
identified.
Investment Centre – A profit centre which is also responsible for capital investment.
REVIEW QUESTIONS
1 What is the purpose of management information?
2 Explain the term Cost unit;
3 Explain the term Cost centre;
4 Explain the term Profit centre;
5 Explain the term Investment centre;

10
UNIT 2
COST ACCUMULATION FOR PRODUCT COSTING
JOB AND BATCH COSTING
LEARNING OBJECTIVES:
After studying this topic, students should be able to:
Compare and contrast between: Job costing, Batch costing and Contract costing;
Undertake computation and analysis of information relevant to job, batch and contract
costing;
Prepare Ledger accounts for job and batch costing systems;
Prepare Ledger accounts for contract costing systems.
INTRODUCTION
Every organization will normally have its own costing systems with characteristics that are
unique to each particular given system. The costing system would have the same basic
characteristics as those of other comparable organizations in similar activities.
Specific order costing methods are appropriate for organizations which produce cost units which
are separately identifiable from one another. For example, job costing , batch costing and
contract costing are all types of specific order costing that students need to understand.
JOB COSTING
Job costing actually applies in environments where work is undertaken according to specific
orders from customers in order to meet their own special requirements. Normally each order is
for a short duration, probably within one month. For example, a customer may request the
manufacture of a single machine to meet the customer‟s own specification. Other examples, say
from service organizations, might be the need for the repair of a vehicle or the preparation of a
set of accounts for a client.
In this respect, the job costing method can also be applied to help monitor the costs of the
internal work done for the benefit of the internal organization itself. For example, job cost sheets
can actually be used in order to collect the costs of property repairs carried out by the
organization‟s own employees or they may be used in the costing of internal capital expenditure
jobs and other services.
JOB COST SHEETS AND DATABASES
The main feature of a job costing system is the use of a job cost sheet or a job card which is a
detailed record used in order to collect the costs of each job. Normally this would be a file in a

11
computerized system but the essential feature is that each job would be given a specific number
which identifies it from all the other jobs. In this respect, costs would be allocated to this
number as they are being incurred on behalf of that specific job. Since the sales value of each
job can also be separately identified, it is then possible also to determine the profit or loss on
each specific job undertaken.
The job cost sheet would therefore record details of the job as it proceeds. Therefore, the items
recorded would include the following:
Job number;
Description of the job; specifications, etc;
Customer details;
Estimated cost, analyzed by cost element;
Selling price, and also the Estimated profit;
Promised delivery date;
Actual costs incurred to date, analyzed by cost element;
Actual delivery date, once the job is completed;
Sales details; eg. Delivery note number, invoice number etc.
For example, a job cost sheet may be prepared for a plumbing job. This job would have been
carried out on the customer‟s own premises. The job cost sheet has a separate section to record
the details of each cost element. There is also a summary section where the actual costs incurred
are compared with the original estimates. This comparison helps managers to control costs and
also to refine their estimating process.
COLLECTING THE DIRECT COSTS OF EACH JOB
Costs relevant to job costing are in a number of categories including the ones summarized below:
(a) DIRECT LABOUR
The correct analysis of labour costs and their attribution to specific jobs depends upon the
existence of an efficient time recording and analysis system. For example, daily or
weekly time sheets may be used to record how each employee‟s time is spent on the job,
using job numbers where appropriate in order to indicate the time spent on each job. In
this respect, the wages cost can also then be charged to specific job numbers or to
overhead costs, if the employee was actually engaged on indirect tasks.
(b) DIRECT MATERIAL
All documentation used to record movements of material within the organization should
actually indicate the job number to which it relates. For example, a Material Requisition
note, which is a formal request for items to be issued from the stores, should at least have

12
a space to record the number of the job for which the material is being requisitioned. In
case any of this material is returned to the stores, them the Material Returned Note should
indicate the original job number which is to be credited with the cost of the returned
material.
Sometimes items of material might be purchased specifically for an individual job,
without the material first being delivered to the general stores and then requisitioned from
the stores for the appropriate job. In this type of situation, the job number must be
recorded on the supplier‟s invoice or on the relevant cash records. This type of recording
will help ensure that the correct job is charged with the cost of the material purchased.
(c) DIRECT EXPENSES
Although direct expenses are not as common as direct material and direct labour costs, it
is still important to analyze them and ensure that they are charged against the correct job
number.
For example, if a machine is hired to complete a particular job, this is a direct expense of
the job. In this respect, the supplier‟s invoice should be coded in order to ensure that the
expense is charged to the appropriate job. On the other hand, if cash is paid, then the
cash book analysis should show the job number which is to be charged with the
appropriate cost.
ATTRIBUTING OVERHEAD COSTS TO JOBS
Overhead costs related to jobs may be divided into categories of Production overheads and also
Non-production overheads.
(a) PRODUCTION OVERHEADS
The successful attribution of production overhead costs to cost units depends on the
existence of well-defined cost centres and appropriate absorption bases for the overhead
costs of each cost centre.
It may be possible to record accurately the units of the absorption base which are
applicable to each job. For example, if machine hours are to be used as the absorption
base, then the number of machine hours spent on each job must be recorded on the job
cost sheet. The relevant cost centre absorption rate can then be applied in order to
produce a fair overhead charge for that specific job.
For example, if the production overhead section of a given job cost sheet shows that the
absorption rate is at K5 000 per labour hour. The labour analysis shows that 9 hours were

13
worked on this particular job, therefore the amount of production overhead absorbed by
this job will be K45 000.
(b) NON-PRODUCTION OVERHEADS
The level of accuracy achieved in attributing costs such as selling, distribution and
administration overheads to jobs will depend on the level of cost analysis which an
organization applies.
Many organizations simply use a predetermined percentage in order to absorb such costs,
based on estimated levels of activity for the forthcoming period.
EXAMPLE
A company uses a predetermined percentage of production cost to absorb distribution
costs into the total cost of its jobs. Based on historical records and an estimate of activity
and expenditure levels in the forthcoming period, they have produced the following
estimates:
Estimated distribution costs to be incurred K133 000
Estimated production costs to be incurred on all jobs K1 900 000
Therefore, predetermined overhead absorption rate for distribution costs will be:
Estimated distribution costs x 100
Estimated production costs on all jobs
K133 000 x 100 = 7% of production costs
K1 900 000
The plumbing company that has produced the job cost sheet uses a predetermined percentage of
5 % of total production cost to absorb administration overhead into job costs.
The use of predetermined rates will normally lead to the problems of under or over absorption of
overhead costs. In this respect the rates should therefore be carefully monitored throughout the
period to ensure that they do not require adjusting to more accurate levels in order to reflect
recent trends in costs and activity relating to that job.

14
QUESTION
Jere Ltd manufactures precision tools to its customers‟ own specifications. The manufacturing
operations are divided into three cost centres, namely: A, B and C.
An extract from the company‟s budget for the forthcoming period shows the following data:
Cost Centre Budgeted Production Basis of Production overhead
Overhead Absorption
K
A 38 500 22 000 machine hours
B 75 088 19 760 machine hours
C 40 964 41 800 machine hours
Job number 075 was manufactured during the period and its job cost sheet reveals the following
information relating to the job:
Direct material requisitioned K6 780.10
Direct material returned to stores K39.60
Direct labour recorded against job number 075:
Cost centre A: 146 hours at K4.80 per hour
Cost centre B: 39 hours at K5.70 per hour
Cost centre C: 279 hours at K6.10 per hour
Special machine hired for this job: hire cost K59.00
Machine hours recorded against job number 075:
Cost centre A: 411 hours
Cost centre B: 657 hours
Price quoted and charged to customer, including delivery K17 200
Jere Ltd absorbs non-production overhead using the following predetermined overhead
absorption rates:
Administration and general overhead 10% of production cost
Selling and distribution overhead 12% of selling price

15
REQUIRED
You are required:
(a) to present an analysis of the total cost and
(b) To prepare a cost and profit analysis attributable to job number 075.
PREPARING LEDGER ACCOUNTS FOR JOB COSTING SYSTEMS
In job costing systems, a separate work in progress account is maintained for each job, as well as
a summary work in progress control account for all jobs worked on in a given period.
QUESTION 1
Jasoni Ltd operates a job costing system. All jobs are carried out on Jasoni‟s own premises and
then delivered to customers as soon as they are completed.
Direct employees are paid K10 per hour and production overhead is absorbed into job costs
using a predetermined absorption rate of K24 per hour. General overhead is charged to the
income statement on completed jobs using a rate of 12 per cent of total production cost.
Details of work done during the latest period are as follows:
Work in progress at the beginning of the period:
Job number 308 was in progress at the beginning of the period.
Job number 308:
Cost incurred up to beginning of the period:
K
Direct material 1 790
Direct labour 960
Production overhead absorbed 2 304
Production cost incurred up to beginning of period 5 054
Activity during the period:
Job numbers 309 and 310 were commenced during the period. The following details are
available concerning all work done this period.
Job number: 308 309 310
Direct materials issued from stores K169 K2 153 K452
Excess materials returned to stores - K23 -
Direct labour hours worked 82 53 28
Status of job at end of period Completed Completed In progress
Invoice value K9 900 K6 870 -

16
Cost of material transferred from job 309 to job 310 K43
Production overhead cost incurred on credit K4 590
General overhead cost incurred on credit K1 312
REQUIRED
(a) Prepare the ledger account for the period for each job, showing the production cost of
sales transferred on completed jobs.
(b) Prepare the following accounts for the period:
(i) Work in progress control;
(ii) Production overhead control;
(iii) General overhead control;
(iv) Overhead under or over absorbed control; and
(v) Income statement.
(c) Calculate the profit on each of the completed jobs.
QUESTION 2
The data below relates to a single accounting period in a jobbing engineering works by China
Ltd.
Extracts from Job Cost Cards
Opening Charged during Closing
WIP Period WIP
K k k
Materials 10 620 32 840 12 630
Labour 15 250 53 260 16 170
Production overheads 10 830 33 520 9 260
The financial accountant supplied the following information relating to the same period:
K
Materials purchased 39 150
Selling & Administration overheads 12 780
Production overheads 30 620
Sales 146 330
The opening stock of material was K9 200. All completed jobs are invoiced immediately to
customers and you are advised that the Cost Department recover selling and administrative
overheads at the rate of 10% of the cost of completed jobs.

17
REQUIRED
Using the above information, you are required:
(a) To write up all the Cost ledger accounts; and
(b) To prepare a Costing Profit and Loss Account for the period,
assuming that the firm operates an interlocking system with separate financial and cost
accounts.
BATCH COSTING
This is a form of costing which applies where a quantity of identical articles are manufactured as
a batch. The most common forms of batch are:
(a) Where a customer orders a quantity of identical items, or
(b) Where an internal manufacturing order is raised for a batch of identical parts, sub-
assemblies or products to replenish stocks.
In general however, the procedures for costing batches are similar to costing jobs. In this case
the batch would be treated as a job during manufacture and the costs collected for that job. On
completion of the batch, the cost per unit can be calculated by dividing the total batch cost by the
number of good units produced.
Batch costing is common in the engineering component industry, footwear and also clothing
manufacture and other similar industries.
The following question shows a typical cost build-up for a batch of similar parts and it actually
illustrates typical job costing procedures and the subsequent calculation of the unit cost and the
appropriate profit.
QUESTION
A company, Moono Ltd manufactures small assemblies to order and has the following budgeted
overheads for the year, based on normal activity levels.
Department Budgeted Overheads Overhead Absorption Base
K
Blanking 18 000 1 500 labour hours
Machining 43 000 2 500 machine hours
Welding 20 000 1 800 labour hours

18
Assembly 15 000 1 000 labour hours
Selling and Administration overheads are 20% of factory cost.
An order for 250 assemblies type X 128, made as Batch 5931, incurred the following costs:
Materials: K3 107
Labour: 128 hours Blanking shop at K10 per hour
452 hours Machining shop at K11 per hour
90 hours Welding shop at K10 per hour
175 hours Assembly shop at K9 per hour.
K525 was paid for the hire of a special X-ray equipment for testing the welds. The time booking
in the machine shop was 643 machine hours.
REQUIRED
Calculate the total cost of the batch, the unit cost and also the profit per assembly if the selling
price was K150 per assembly.
USING ACTIVITY BASED COSTING FOR JOB/BATCH COSTING
Overheads can be charged to jobs or batches by using either traditional labour or machine hour
absorption rates or by using various cost drivers in the Activity Based Costing systems. If all
jobs or batches were much the same and placed similar loads on support activities, there would
be little difference in the costs calculated by either method. Such uniformity is unlikely and jobs
and batches do vary in the loads they place on production facilities and support activities.
As a consequence of this, costs calculated by traditional methods and ABC system are actually
likely to be different. The general effect is that more complex/diverse/small quantity production
will tend to be costed higher using the ABC as compared to traditionally calculated costs.
QUESTION
The following details have been recorded for four (4) batches made in a given period.
Batch A B C D
Output in units 250 60 200 120
Cost per batch K K K K
Direct Material 1 650 750 2 100 900
Direct Labour 9 200 1 520 6 880 2 400
Labour hours per batch 1 150 190 860 300
The total production overhead for the period has been analyzed as follows:

19
K
Machine related costs 14 600
Materials handling & dispatch 6 800
Stores 8 250
Inspection/Quality control 5 850
Set- up 6 200
Engineering support 8 300
50 000
Cost drivers have been identified for the cost pools as follows:
Cost pool Cost driver
Machine costs Machine hours
Materials handling Materials movements
Stores Requisitions raised
Inspection Number of inspections
Set-up No. of set-ups
Engineering support Engineering hours
The following cost driver volumes were recorded for the batches:
Batch A B C D Total
Machine hours per batch 520 255 610 325 1 710
Material movements 180 70 205 40 495
Requisitions 40 21 43 26 130
Inspections 18 8 13 8 47
Set-ups 12 7 16 8 43
Engineering hours 65 38 52 35 190
REQUIRED
From the above details, prepare the following:
(a) The batch and unit costs using the traditional costing based on a labour hour overhead
absorption rate.
(b) The batch and unit costs using the Activity Based Costing (ABC).
(c) Compare the costs in (a) and those in (b).
(d) Comment on the likely position if the firm uses the Cost-plus pricing.
20
SUMMARY POINTS
(a) Job costing is employed where work is done to customer‟s requirements, eg. In a factory
or workshop;
(b) For job costing to be effective, there must be a good system of production control, works
documentation, material and labour booking;
(c) All costs incurred must be charged to the job, usually on to a job cost card.
(d) The job cost cards in total form the firm‟s work-in-progress.
(e) The detail entries to the job cards would be debited in total to the work-in-progress
account.
(f) Prime costs are gathered from labour and material bookings on the shop floor and, in the
case of expenses, from invoice or cash book analysis. Overheads can be charged to jobs
either by the traditional methods using labour or machine hour absorption rates or by
various cost driver rates using the ABC method. At present, overhead attribution by
labour or machine hour rates is more common but this may change in the future if the use
of ABC becomes more widespread.
(g) Batch costing is very similar to job costing and is used where a batch of identical units
are manufactured. Costs are gathered as for job costing and when the batch is completed,
the total cost is divided by the number of good units made in order to establish the unit
cost.

21
UNIT 3
COST CLASSIFICATION AND COST BEHAVIOUR
Cost Accounting
Financial, cost and management accounting
The financial accounts records transactions between the business and its customers,
suppliers employees and owners. The managers of the business must account for the way
in which funds entrusted to them have been utilized and therefore, the records of assets
and liabilities are required as well as a statement of any increase in the total wealth of the
business. This is done by presenting a balance sheet and a profit and loss account
annually.
Cost accounting
Cost accounting involves the application of a comprehensive set of principles, methods
and techniques to the determination and appropriate analysis of costs to suit the various
parts of the organization structure within a business.
Management accounting
Management accounting is a wider concept involving professional knowledge and skill in
the preparation and particularly the presentation of information to all levels of
management in the organization structure. The source of such information is the
financial accounts and cost accounts. The information is intended to assist management
in its policy and decision-making, planning and control activities.
Cost ascertainment
Cost accounting systems are primarily designed to ascertain costs: costs of operating
identifiable sections of the business and the cost of output products of units or service.
The system thus represents a data bank which can be referred to and adapted to suit the
needs of people throughout the organization.
In developing a system, guidelines should be recognized so that the basic objective is not
ignored:
(a) Utility of information – procedures involved in cost accounting should be
examined to confirm that the information provided is of specific, ie. it is
uneconomic to carry out analysis and presentation on the basis that „it may be
useful to someone at some time‟.
22
(b) Accuracy and experience – the cost of obtaining a high degree of accuracy must
be measured against the purpose of the exercise.
(c) Actual cost – The concept is entirely theoretical, since in ascertaining the cost of a
cost centre or cost unit, many estimates will be made based upon experienced
judgement.
(d) Normality – Costs will be used for a variety of purposes et. Settling selling prices
or choosing between alternative production methods. Unless a distinction is made
between normal and abnormal costs, the information may be misleading.
Benefits of cost accounting
(a) Disclose profitable and unprofitable activities;
(b) Identify waste and inefficiency;
(c) Analyse movements in profit;
(d) Estimate and fix selling prices;
(e) Value stocks
(f) Develop budgets and standards to assist planning and control;
(g) Evaluate the cost effects of policy decisions.
Analysis of Costs
Cost units
A cost unit is a unit of product or service in relation to which costs are ascertained. Such
a unit could be measured in form of a litre, metre, kg, tonne etc.
The ascertainment of the cost per cost unit is important for the following reasons:
(a) Making decisions about pricing, acceptance of orders and so on‟
(b) Measuring changes in costs and relative levels of efficiency;
(c) Inventory valuation for financial reporting;
(d) Planning future costs (budgeting and standard costs).
In this respect the process of ascertaining unit costs involves analysis, classification and
grouping of costs.
Cost classification
Classification is a means of analyzing costs into logical groups so that they may be
summarized into meaningful information for management.

23
Elements of cost
The initial classification of costs is according to the elements upon which expenditure is
incurred:
(a) Materials
(b) Labour
(c) Services
Within cost elements, costs can be further classified according to the nature of
expenditure. This is the usual analysis in a financial accounting system eg. raw materials,
consumable stores, wages, salaries, rent, rates and depreciation etc.
Direct and Indirect costs
Direct cost – A direct cost is expenditure which can be economically identified with a
specific saleable cost unit.
Prime cost – Prime cost is the aggregate of direct materials, direct labour and direct
expenses.
Indirect costs – Indirect costs or overheads are expenditure on labour, materials or
services which cannot be economically identified with a specific saleable cost unit.
Direct materials }
Direct labour } Prime cost
Direct expenses } }
} Total cost
Indirect materials } }
Indirect labour } Overhead
Indirect expenses }
In order to ascertain the total cost of a cost unit, indirect costs are allocated to cost centres
and cost centre costs are shared over (absorbed by) cost units.
Functional analysis of cost
Overheads are usually categorized into the principal activity groups:
(a) Manufacturing
(b) Administration
(c) Selling
(d) Distribution
(e) Research

24
In this respect prime costs are usually regarded as being solely related to manufacturing
and so are not classified.
Manufacturing and service industries
Whereas manufacturing industries are concerned with converting raw materials into a
product, service industries do not have a manufactured output, their output consists of
services to a customer.
Cost centres
A cost centre is a production or service location, function, activity or item of equipment
whose costs may be attributed to cost units.
A cost centre is a small part of a business in respect of which costs may be determined
and then related to cost units. A number of departments together would comprise a
function. Thus “a cost centre could be a location, function or item of equipment or a
group or combination of any of these”
COST BEHAVIOUR
Total cost
It has been noted that production cost comprises three elements, namely: materials,
labour and expenses. It can also be noted that production cost includes both fixed costs
and variable costs. It is important to consider the way costs behave in response to
changes in production volume.
Cost behaviour is the way in which costs of output are affected by fluctuations in the
level of activity.
Example
Production
500 units 1 000 units
K K
Sales at K3 per unit 1 500 3 000
Total costs 1 000 1 500
Profit 500 1 500
Average cost per unit K2.00 K1.50
Average unit profit K1.00 K1.50
Total costs have increase by only 50% although production has doubled. This is because
some costs will not rise in relation to the increase in the volume.

25
Example
Suppose the product is widgets and the only costs are as follows:
(a) Rental of a fully equipped factory, at K500 000 per annum;
(b) Raw materials at K1.00 per widget.
Show the manner in which these costs can be shown.
Solution
The way these two types of costs react to producing varying numbers of widgets is as
follows:
(a) Factory rental – a fixed cost
Although production rises, the same rent is payable.
(diagram 1) Showing relationship between total fixed cost and output
Fixed costs, within certain output and turnover limits tend to be unaffected by
fluctuations in the levels of activity.
(diagram 2) Average fixed cost per unit graph
As output increases, unit fixed costs decline.
(b) Raw materials – a variable cost
Every widget has a raw material cost of K1.00, therefore, the cost varies directly
with the level of production.
Variable costs – Variable costs are the costs which tend to vary with the level of
activity.
(diagram 3) Graph showing relationship between total variable cost and output
In the case of variable costs unit cost remains constant irrespective of the level of
output (provided that there are no discounts for bulk purchase).

26
Contribution
If the two types of cost are segregated, the operating statement can be presented in
a different way, as shown below.
Production of widgets
1 unit 500 units 1 000 units
K K K
Sales 3 1 500 3 000
Less: Variable costs (rm) 1 500 1 000
Contribution 2 1 000 2 000
Fixed costs – factory rent 500 500 500
Profit/(loss) (498) 500 1 5 00
The revised presentation is based on the concept that each unit sold contributes a
selling price less the variable cost per unit. Total contribution provides a fund to
cover fixed costs and net profit.
Contribution
Contribution is the sales value less variable cost of sales.
Thus: Sales – variable cost = Contribution
Contribution – Fixed costs = Net profit
As output increases, total unit costs gravitate towards the unit variable cost:
Semi-fixed or step costs
Some costs rise in a series of steps. Large steps (renting a second factory) or
small steps (renting a typewriter) may occur.
(a) If the steps are large, the concept of the relevant range of activity usually
applies ie. only occasionally is a new factory considered and therefore one can
assume the cost to be fixed for the relevant range.
(b) If the steps are small, they may be ignored ie. the cost may be treated as a
variable cost.

27
Semi-variable costs (also referred to as semi-fixed costs)
Semi-variable costs
Semi-variable costs are costs which exhibit the characteristics of both variable
and fixed costs, in that while they increase with output they never fall to zero,
even at zero output
28
UNIT 4
MATERIALS: STOCK RECORDING AND INVENTORY CONTROL
Objective
After studying this module, students will:
Understand the objectives and principles of stock recording;
Have been introduced to Inventory Control;
Distinguish between Perpetual inventory and periodic inventory;
Acquire concepts relating to inventory control and management.
STOCK RECORDING
The Inventory or Stock Control system is in the firm, a basic prerequisite that stock movements
(issues and receipts) are accurately recorded. In addition, the stock record typically shows
various control levels which relate to the Inventory Control system.
The most frequently encountered records of stocks in manual systems are the Bin Cards and
Stock Record Cards.
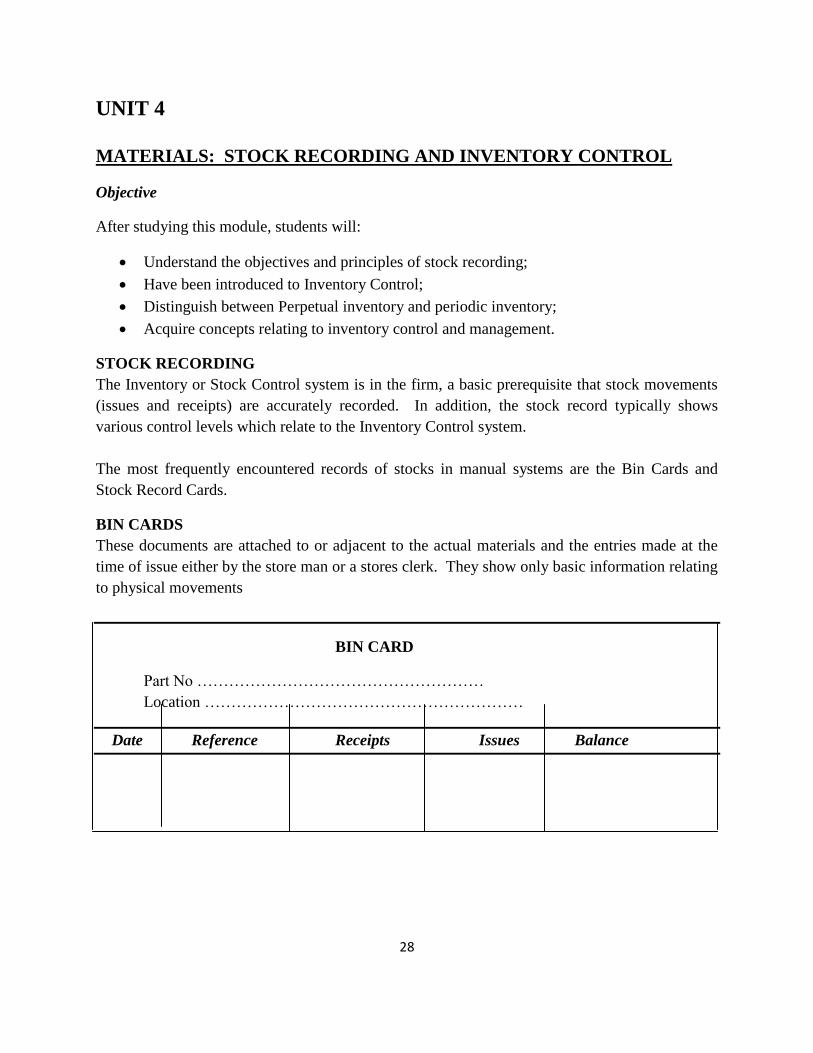
BIN CARDS
These documents are attached to or adjacent to the actual materials and the entries made at the
time of issue either by the store man or a stores clerk. They show only basic information relating
to physical movements
BIN CARD
Part No ………………………………………………
Location ……………………………………………………
Date Reference Receipts Issues Balance

29
Notes:
(a) The reference column would be used for inserting the GRN or Material Requisition
number;
(b) The use of Bin cards is declining partly because of the difficulty of keeping them up to
date and partly because of the increasing integration of stock recording and inventory
control procedures, frequently using computers.
PERPETUAL INVENTORY SYSTEM
This system simply means that each issue of receipt the balance is calculated. The total of the
balances represent the stock on hand and the system avoids the necessity for wholesale, periodic
stocktaking. Instead, a continuous stocktaking system must be operated to ensure that the
records accurately reflect actual stocks.
If the records are to be relied upon at all times, stock discrepancies must be investigated
immediately and appropriate corrections made either to the system or to the record or both.
Typical causes of discrepancies between actual stocks and recorded stocks are the following:
(a) Errors caused by incorrect recording and calculation;
(b) Incorrect coding causing the wrong part to be issued and/or wrong card to be altered;
(c) Under or over issues not noted;
(d) Parts and materials returned to the stores and not documented;
(e) Shrinkage, pilferage, evaporation, losses due to breaking bulk, etc;
(f) Loss or non-use of GRNs, material requisitions and other appropriate documentation.
Review questions:
1 Explain the term perpetual inventory
2 What is the use of the document Bin card?
3 Explain the difference between the terms: „stealing‟ and „pilfering‟ in as far as stock
management and control is concerned.
4 Distinguish between an Internal Requisition and an Order form.

30
UNIT 5
MATERIALS – PURCHASING, RECEPTION AND STORAGE
Objectives
After studying this unit, students should be able to:
Understand the principles of materials control;
Be able to describe the main purchasing procedures;
Know the elements of storekeeping and stocktaking;
Understand the advantages and disadvantages of centralized stores; and
Be able to describe the main features of JIT purchasing and JIT production.
THE ESSENTIALS OF MATERIALS CONTROL
The essentials of materials control prior to actual use in production can be summarized as
follows:
(a) Materials of the appropriate quality and specification should be purchased only when
required and appropriately authorized;
(b) The suppliers of materials chosen should represent an appropriate balance between
quality, price and delivery;
(c) Materials should be properly received and inspected;
(d) Appropriate storage facilities should be provided and stock levels physically checked on
a regular basis;
(e) Direct materials used in production should be charged to production on an appropriate
and consistent pricing basis;
(f) Indirect materials used in production and non production departments should be
appropriately charged to the correct cost centre and included in the overheads of the cost
centre;
(g) The documentation, accounting systems and controls at each stage should be well
designed and effective;
(h) Stocktaking must be well organized to ensure that stock quantities on hand are available
when required.
PURCHASING
Due to the large proportion of a firm‟s costs are represented by bought in materials and services,
the purchasing function is of great importance and has become highly specialized.
The responsibility of the purchasing function includes price, quality and delivery all of which are
crucial factors. Late or non-delivery, poor and substandard materials, incorrect specifications,
etc are all likely to have at least as great an impact on profitability as paying an unnecessary high
price.

31
The avoidance of production delays, excessive scrap caused by incorrect materials and the
avoidance of excessive stocks are among the aims of an efficient purchasing function.
Frequently the purchasing function of a group or of a firm with numerous branches is
centralized.
This has many advantages including: larger quantity discounts, uniform standards, possibility of
more continuous supplies in difficult times, etc but there may be disadvantages such as longer
response times; some lack of flexibility in catering for specialized needs and general remoteness
from the scene of operations.
Diagram on: Purchase Requisition Form
PURCHASE REQUISITION
Dept/Job no. Reg No…………………..
Suggested supplier:
Requested by:
Latest Date Required:
Quantity Code No. Description Estimated costs
Units K
Authorized Signature:
PURCHASING PROCEDURES
The purchasing procedure follows the following sequence of steps:
Search for possible and suitable suppliers by using the various sources of information;
Request for tenders from the possible suppliers;

32
Receive the various quotations from the suppliers;
Select the suitable supplier and
Submit the Purchase Order from the chosen supplier.
Diagram on: Purchase Order Form
PURCHASE ORDER
Purchase Order Ref:
To: Address of please deliver to the above address
supplier Ordered by………………..
Passed + checked by………………..
Total order value K…………………..
Qty Description Code Unit price Total
K K
Total cost
Signature ……………..
RECEPTION AND INSPECTION PROCEDURES
The procedure for receiving the ordered goods is as follows:
Receipt of goods in the Materials Reception;
Quantities received are checked and the Goods Received Note is raised by the receiving
firm;
Details of the Goods Received Note are checked against the Purchase Order to ensure
that they are in agreement in as far as quality, quantity and size are concerned;
On satisfaction of the above, the goods are taken into the Stores and the GRN and or
Inspection Note is then signed for approval

33
Diagram on Goods Received Note (GRN)
GOODS RECEIVED NOTE
Date:………………… Time:………………….
Our order No……………..
Supplier and supplier’s advice note No………….
Qty Code No. Description
Condition Goods Received…………………………………………
Name of Receiver……………………………………………………
Signature…………………………………………………..
STORE KEEPING
Storekeeping is an important function and can make a substantial contribution to efficient
operations. Storekeeping includes the following activities:
(a) Efficient and speedy issue of required materials, tools etc;
(b) Receipt of parts and materials from the Goods Reception (ie. External items) and from
Production (ie, internal items);
(c) Organizing storage in logical sequences, thus ensuring items can be found speedily, that
all items can be precisely identified and storage space is used effectively;
(d) Organizing Stock Checks either on a continuous or a periodic basis so as to be able to
provide accurate stock figures when required;
(e) Protecting items in the Stores from damage and deterioration;
(f) Securing the stores from theft, fire and pilfering.
34
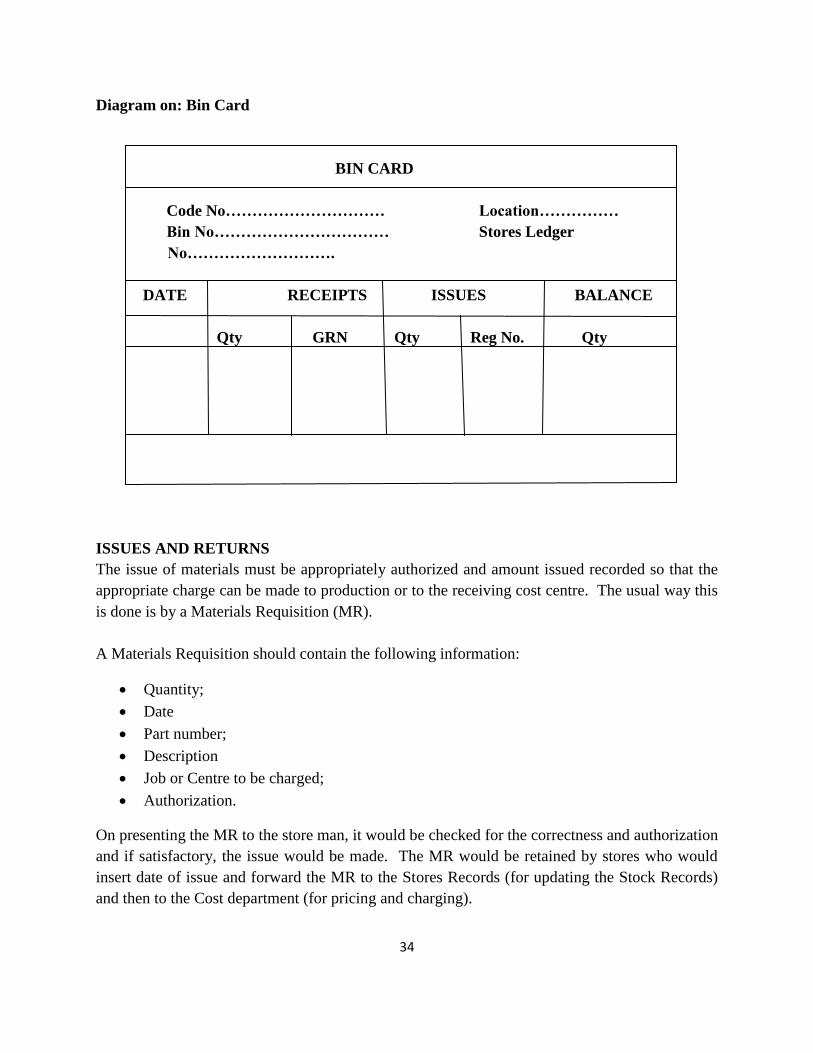
Diagram on: Bin Card
BIN CARD
Code No………………………… Location……………
Bin No…………………………… Stores Ledger
No……………………….
DATE RECEIPTS ISSUES BALANCE
Qty GRN Qty Reg No. Qty
ISSUES AND RETURNS
The issue of materials must be appropriately authorized and amount issued recorded so that the
appropriate charge can be made to production or to the receiving cost centre. The usual way this
is done is by a Materials Requisition (MR).
A Materials Requisition should contain the following information:
Quantity;
Date
Part number;
Description
Job or Centre to be charged;
Authorization.
On presenting the MR to the store man, it would be checked for the correctness and authorization
and if satisfactory, the issue would be made. The MR would be retained by stores who would
insert date of issue and forward the MR to the Stores Records (for updating the Stock Records)
and then to the Cost department (for pricing and charging).

35
The store man must ensure that the MR is amended when the issue cannot be made exactly as the
original request, eg. where only a part issue is made or an alternative material is acceptable when
that originally requested is unavailable.
The procedure for goods returned to store is similar to that outlined above except that the
document involved is termed a Material Return Note, and of course, the goods are taken into the
stores rather then issued.
STORAGE – STOCKTAKING
There are two approaches stocktaking: namely, Periodic stocktaking and also Continuous
stocktaking.
Periodic stocktaking
The objective of periodic stocktaking is to find out the physical quantities of materials of all
types (raw materials, finished goods, WIP etc) at a given date.
This is a substantial task even in a modest organization and becomes a difficult if not impossible
task in a large firm. The following factors need to be considered in as far as stock taking is
concerned:
(a) Adequate numbers of staff should be available who should receive clear and precise
instructions on the procedures;
(b) Ideally the stock take should be done at a weekend or overnight so as not to interfere with
production;
(c) The stock take should be organized into clearly defined physical areas and the checkers
should count or estimate all materials in the area;
(d) Adequate technical assistance should be available to identify materials, part numbers etc.
Far greater errors are possible because of wrong classification than wrong counting;
(e) Greater care should be taken to ensure that only valid stock items are included and that all
valid items are checked;
(f) The completed stock sheets should have random, independent checks to verify their
correctness;
(g) The quantities of each type of material should be checked against the stock record to
expose any gross errors which may be due to stock taking errors or faults or errors in the
recording system. Small discrepancies are inevitable;
(h) The pricing and extension of the Stock Sheets, where done manually, should be closely
controlled. Frequently the pricing and value calculations are done by computer, the only
action necessary being to input quantities and stock and part numbers.

36
Diagram on: Stores Ledger Card
STORES LEDGER CARD
Materials………………………………… Maximum Qty………………
Code……………………………… Minimum Qty……………….
DATE RECEIPTS ISSUES BALANCE
Qty Unit price AmountQty Unit price Amount Qty Amount
K K K K K
Continuous Stocktaking
In order to avoid some of the disruptions caused by periodic stocktaking and to be able to use
better trained staff, many organizations operate a system whereby a proportion of stock is
checked daily so that over the year all stock is checked at least once and many items, particularly
the major value or fast moving items, would be checked several times. Where continuous
stocktaking is adopted, it is invariably carried out by staff independent from the storekeepers.
Note:
Continuous stocktaking is absolutely essential when an organization uses what is known as the
Perpetual Inventory System. This is a stock recording system whereby the stock balance is
shown on the record after every stock movement, either issue or receipt. With this system, the
balances on the stock record represent the stock on hand and balances would be used in monthly
and annual accounts as the closing stock. Continuous stocktaking is necessary to ensure that the
perpetual inventory system is functioning correctly and that minor stock discrepancies are
corrected.
STORAGE – CENTRALIZATION Vs DECENTRALIZATION
There is no conclusive answer as to whether there should be a centralized stores or several stores
situated in branches or departments. Each system has its advantages and disadvantages as
indicated below.

37
Advantages of Centralization
(a) Lower stock on average;
(b) Less risk of duplication;
(c) Higher quality staff may be usefully employed to specialize in various aspects of
storekeeping;
(d) Closer control is possible on a central site;
(e) Possibly more security from pilferage;
(f) Some aspects of paperwork may be reduced, eg. purchase requisitions;
(g) Stocktaking is facilitated;
(h) Likelihood that more advanced equipment will be viable, eg. materials handling, visual
displays.
Disadvantages of Centralization
(a) Less convenient for outlying branches/departments;
(b) Possible loss of local knowledge;
(c) Longer delays possible in obtaining materials;
(d) Greater internal/external transport costs in fetching and carrying materials.
JUST-IN-TIME (JIT) SYSTEMS
JIT systems were developed in Japan, and are considered as one of the main contributions to
some manufacturing successes.
The aim of JIT systems is to produce the required items, of high quality, exactly at the time when
such items are required. JIT systems are characterized by the pursuit of excellence at all stages
with a climate of continuous improvement.
A Just In Time environment is characterized by the following features:
A move towards zero inventory;
Elimination of non-value added activities;
An emphasis on perfect quality, ie zero defects;
Short set-ups;
A mover towards a batch size of on;
100% on-time deliveries;
A constant drive for improvement;
Demand-pull manufacture.
It is this latter characteristic which gives rise to the name of Just-in-Time. Production only takes
place when there is actual customer demand for the product so JIT works on a pull-through basis
which means that products are not made to go into stock. Contrast this with the traditional

38
manufacturing approach of production-push where products are made in large batches and move
into stores for stock keeping.
Definition
Just-In-Time (JIT) – System whose objective is to produce or to procure products or components
as they are required by a customer or for use, rather than for stock. JIT pull system which
responds to demand, in contrast to a push system in which stock act as buffers between the
different elements of the system such as purchasing, production and sales.
JIT PURCHASING
This seeks to match the usage of materials with the delivery of materials from external suppliers.
This means that material stocks can be kept at near zero levels.
For JIT purchasing to work requires the following:
Confidence that suppliers will deliver exactly on time;
That suppliers will deliver materials of 100% quality so that there will be no rejects,
returns and consequent production delays.
The reliability of suppliers of suppliers is all-important and JIT purchasing means that the
company must build up close working relationships with their suppliers. This is usually
achieved by doing more business with fewer suppliers and placing long term purchasing orders
in order that the supplier has assured sales and can plan to meet the demand.
JIT PRODUCTION
JIT production works on a demand-pull basis and seeks to eliminate all waste and activities
which does not add value to the product being produced. As an example, consider the lead times
associated with making and selling a product. These include the following:
Inspection time;
Transport time;
Queuing time;
Storage time;
Processing time
Of these, only processing time adds value to the product whereas all the others add cost, but not
value. The ideal for JIT systems is to convert materials to finished products with a lead time
equal to processing time so eliminating all activities which do not add value. A way of
emphasizing the importance of reducing throughput time if to express the above lead times as
follows:
THROUGHPUT TIME = VALUE ADDED TIME + NON VALUE ADDED TIME

39
BENEFITS AND PROBLEMS FROM USING JIT
Successful users of JIT systems are making substantial savings. These arise from numerous
areas including the following:
(a) Lower investment required in all forms of inventory;
(b) Space savings from the reduction in inventory and improved layouts;
(c) Greater customer satisfaction resulting from higher quality better deliveries and greater
product variety;
(d) The buffers provided by traditional inventories masked other areas of waste and
inefficiency. Examples include co-ordination and work flow problems, bottlenecks,
supplier unreliability and so on. Elimination of these problems improves performance
drastically;
(e) The flexibility of JIT and the ability to supply small batches enables companies to
respond more quickly to market changes and to be able to satisfy market niches.
As would be expected, there are often problems in implementing JIT systems. JIT does not
necessarily reduce inventories in total. One firm may reduce their inventory but this is often at
the expense of others in the supply chain. Component and material suppliers need to keep stocks
in case of rush orders because there are usually penalty clauses in the event of later delivery.
REVIEW QUESTIONS
1 Invariably goods, services and the supply of materials are obtained by the use of a
Purchase Order. Design the layout of a Purchase Order, showing what essential
information the order should contain.
2 Give six (6) advantages of continuous stocktaking.
3 Give five (5) reasons why stocktaking errors occur.
4 Give five (5) differences between JIT Purchasing and the conventional purchasing.
5 Distinguish between centralized storages system and the departmental storage system.

40
UNIT 6
INVENTORY CONTROL
Learning objectives
After covering this module, students should be able to:
Define the Economic order quantity model;
Define Reorder Level
Define Lead time
Compute and explain the meaning of Economic Order Quantity (EOQ).
Identify the different types of stock related costs and control such costs.
Inventory control can be defined as the system used in a firm to control the firm‟s investment in
stock. This includes; the recording and monitoring of stock levels, forecasting future demands
and deciding when and how many to order.
The overall objective of inventory control is to minimize, in total, the costs associated with stock.
These costs can be categorized into three groups, namely:
Carrying costs
(a) Interest on capital invested in stocks;
(b) Storage charges (rent, lighting, heating, refrigeration and air conditioning);
(c) Stores staffing, equipment, maintenance and running costs;
(d) Material handling costs;
(e) Audit, stocktaking, stock recording costs;
(f) Insurance and security;
(g) Deterioration and obsolescence;
(h) Pilferage, evaporation and vermin damage.
Costs of obtaining Stock (Ordering costs)
(a) Clerical and administrative costs of Purchasing, Accounting and Goods Reception;
(b) Transport costs;
(c) Where goods are manufactured internally, the set-up and tooling costs associated with
each production run plus the planning, production control costs associated with the
internal order.
Stock out Costs (Costs of being without Stock)
(a) Lost contribution through the lost sale caused by stock out;
(b) Loss of future sales because customers may go elsewhere;
(c) Costs of production stoppages caused by stock outs of WIP and raw materials;
41
(d) Extra costs associated with urgent, often small quantity, replenishment orders.
Some of the above items may be difficult to quantify, particularly stock out costs, but
nevertheless may be of considerable importance. The avoidance of stock out costs is the basic
reason why stocks are held in the first place.
INVENTORY (STOCK) CONTROL TERMINOLOGY
Some common inventory control items are defined below as follows:
(a) Lead or procurement time – The period of time between ordering (externally or
internally) and replenishment, ie when the goods are available for use.
(b) Economic Order Quantity (EOQ) or Economic Batch Quantity (EBQ) – this is a
calculated reorder quantity which minimizes the balance of cost between carrying costs
and ordering costs.
(c) Buffer Stock or Minimum Stock or Safety Stock – A stock allowance to cover errors in
forecasting the lead time or the demand during the lead time.
(d) Maximum Stock Level – A stock level calculated as the maximum desirable which is
used as an indicator to management to show when stocks have risen too high.
(e) Reorder Level – The level of stock (usually free stock) at which a further replenishment
order should be placed. The reorder level is dependent on the lead time and the rate of
demand during the lead time.
(f) Reorder Quantity – The quantity of the replenishment order – frequently, but not always,
the EOQ.

42
CALCULATING CONTROL LEVELS
The common methods of calculating the major control levels include the following:
Reorder Level;
Minimum Level;
Maximum Level
Number of Orders = D/EOQ
Average inventory = EOQ/2
Total Carrying Cost = Average inventory *Carrying cost
Total Ordering Cost = Number of Orders *Ordering Cost
Total Inventory Cost = Total carrying Cost + Total Ordering Cost
QUESTION
The following information was collected from the books of Chalo Ltd who maintain storage
facilities for storage control purchases:
Average usage 100 units per day
Minimum usage 60 units per day
Maximum usage 130 units per day
Lead time 20 – 26 days
EOQ (previously calculated) 4 000 units
REQUIRED
From the above details, calculate the following:
(a) Reorder level;
(b) Minimum stock level;
(c) Maximum stock level
Notes:
(a) These are the normal control levels encountered in basic inventory control systems.
Each time an entry is made, a comparison would be made between actual stock and the
control level;
(b) Reorder level is a definite action level; maximum and minimum levels are levels at which
management would be warned that a potential danger may occur.
(c) The minimum level is set so that management are warned when usage is above average
and buffer stock is being used. There may be no danger, but the situation needs
watching.
(d) The maximum level is set so that management will be warned when demand is the
minimum anticipated and consequently stock may rise above maximum intended.

43
(e) The calculation of control levels is done relatively infrequently in manual systems, but in
a computer based system calculations would take place automatically to reflect current
and forecast future conditions.
THE ECONOMIC ORDER QUANTITY (EOQ) MODEL
The EOQ is a calculated order quantity which minimizes the balance of cost between ordering
and carrying costs.
In order to calculate a basic EOQ, certain assumptions are necessary and these include the
following:
(a) That there is a known, constant stock holding cost;
(b) That there is a known, constant ordering cost;
(c) That rates of demand are known;
(d) That there is a known, constant price per unit;
(e) That replenishment is made instantaneously, ie the whole batch is delivered at once.
The above assumptions are wide ranging and it is unlikely that all could be made in practice.
Nevertheless, the EOQ calculation is a useful starting point in establishing an appropriate reorder
quantity.
The EOQ formula is given below and its derivation given in Quantitative techniques.
EOQ =
Where: Co = Ordering cost per order
D = Demand per annum
Cc = Carrying cost per item per annum
QUESTION
The following information was collected from a manufacturing organization. The forecasted
demand is 1 000 units per month, the ordering cost is at K350 per order. The units cost at K8
each and it is estimated that the carrying costs are 15% per annum.
REQUIRED
From the above details, calculate the Economic Order Quantity for this manufacturing
organization.
Notes:

44
(a) It will be seen that it is necessary to bring the factors involved to the correct time scale;
(b) The EOQ formula give above is for replenishment in one batch. Where replenishment
takes place gradually, for example where the items are manufactured internally and
placed into stock as they are made, the formula changes slightly as follows:
EOQ (with gradual replenishment) =
Where: R = Replenishment rate per annum
SUMMARY
(a) The two most common stock records found in traditional systems are the Bin card and
the Stock Record Card (or its computer equivalent);
(b) The Bin card, where used, shows Issues, Receipts and Physical Balance;
(c) As well as physical information the Stock Record Card shows the Free Stock balance and
the major control levels; Reorder level Maximum level, and Minimum stock level;
(d) The perpetual inventory system means that after each stock movement, the balance on
hand is calculated. To ensure that the records keep in line with actual stocks, continuous
stocktaking is carried out;
(e) Inventory control is the system used in a firm to control the investment in stocks and has
the overall objective of minimizing in total the three costs associated with stocks:
carrying costs, ordering costs and stock out costs;
(f) Reorder level is an action point, maximum and minimum stock levels are management
indicators;
(g) The EOQ is a calculated order quantity to help minimize the balance of ordering and
carrying costs.
POINTS TO NOTE
(a) Keeping stock records aligned with actual stocks is a major practical problem which is
rarely solved completely successfully;
(b) The inventory control system described above is the Reorder Level System, sometimes
known as the Two Bin System;
(c) An alternative control system is known as the Periodic Review System where all stock
levels are reviewed at fixed intervals and replenishment orders issued. These orders
would be based on estimated usage, lead time etc and would not be the EOQ used in the
Reorder Level System;

45
(d) The newer approaches to production, such as the JIT, challenge the philosophy behind
the traditional EOQ model. JIT systems seek to eliminate stocks entirely and where
possible, move towards a batch size of one.
This applies especially to Work in Progress stocks. In effect the JIT philosophy does not
accept that ordering cost and holding costs are fixed. JIT systems continually seek to
reduce both costs. In particular because of the close links with suppliers, ordering costs
reduce dramatically and thus the EOQ and total annual costs are reduced.
When ordering costs are low and holding costs are high the resulting EOQ drives firms to
consider adopting the JIT systems.
REVIEW QUESTIONS
1 An investigation into stores procedures and record keeping showed that for Part
No. Y292 the physical stock differed from the Bin Card and also from the Record
Card kept in the works office which did not agree with the Bin Card.
Give reasons for the differences.
2 What is the relationship between Perpetual Inventory Systems and Continuous
Stocktaking?
3 Calculate the Economic Order Quantity when demand is 25 per working day,
ordering costs are K150.00 per order, the items do cost K3.00 each and carrying
costs are at 12% per year. There are 250 working days in a year.

46
UNIT 7
COSTING OF MATERIALS
Learning Outcomes:
After covering this lecture, students should be able to:
Explain the distinction between direct and indirect material costs;
Describe the documentation used for recording material costs;
Calculate the cost of materials used and the value of closing stocks using the FIFO, LIFO
and the Weighted Average Cost methods of stock pricing;
Account for materials costs in the stores account in the cost ledger; and
Calculate material input requirements and control measures where wastage occurs.
DIRECT AND INDIRECT MATERIALS
In cost accounting, materials are commonly classified as either direct materials or indirect
materials.
Direct materials – These are the materials that can be directly attributed to a unit of production,
or a specific job, or a service provided directly to a customer.
In a manufacturing business, direct materials are therefore the raw materials and components that
are directly input into the products that the organization makes . For example, the various
components that make up an aeroplane are the direct materials of the aeroplane.
Indirect materials - These are the other materials that cannot be directly attributed to a unit of
production.
An example of indirect materials might be the oil used for the lubrication of production
machinery. This is a material that is used in the production process but it cannot be directly
attributed to each unit of finished product.
In a manufacturing business, the cost of direct materials can be charged directly to the production
department that uses the materials. In a jobbing business or a contracting business, direct
materials costs are charged directly to the job or contract for which they are used.
The costs of indirect materials are charged to the cost centre that requisitions them from the
stores department and then uses them.

47
PROCEDURES AND DOCUMENTATION FOR MATERIALS
The stores department is responsible for the receipt, storage and issue of materials and
components to the using units/departments.
Receipts of materials into the store – When materials are received from suppliers, they
are normally delivered to the stores department. The stores personnel must then check
that the goods delivered are the ones that have been ordered, in the correct quantity, of
the correct quality and in good condition.
Storage - Once the materials have been received, they must be stored until required by
the user departments.
Issue of materials from store – When cost centres require materials, they submit a
requisition for the materials to the stores department.
Recording Receipts and Issues - Receipts of materials into store and issues of materials
must be controlled and recorded. Generally the responsibility for recording receipts and
issues of materials is divided between the stores department and also the costing
department.
Each of these departments could maintain its own separate stock records, although there
should ideally be one integrated stock control system. The store department should
monitor the quantities of materials received and also issued and ensure the safety and
security of the physical stocks. The costing department is responsible for recording the
cost of materials received into stores and for putting a value to the cost of direct and
indirect materials issued from stores.
PROCEDURES AND DOCUMENTATION FOR RECEIPTS OF MATERIALS
It is useful to have an overview of the departments that are involved in the purchasing and stores
procedures:
Stores Department – Notifies the purchasing department of the need to buy materials, using a
Purchase Requisition or Stock Order form.
Purchasing Department – Orders goods for external supplier using the Purchase Order.
External Supplier – Delivers goods to the stores department. The goods are accompanied by a
Delivery Note. The external supplier also sends a Purchase Invoice to the accounts department,
asking for payment for the goods supplied.

48
Stores Department – Raises the Goods Received Note (GRN) from the Delivery Note details.
The Goods Received Note is used to update the stock records with the quantities of goods
received.
Costing Department – The Costing Department records the cost of the materials received, using
the Delivery Note and the Purchase Invoice details.
PROCEDURES AND DOCUMENTATION FOR THE ISSUE OF MATERIALS
Requests for materials to be issued from the Stores to a Production Department or other
Department are initiated and then authori9sed by a Materials Requisition Note. This document
performs two functions, namely: it authorizes the storekeeper to release the goods and acts as a
source record for updating the stores records.
STORES RECORDS
In any stock control system, there should be a continual record of the current quantities of each
stock item held in store. Receipts into store and issues from store must be recorded, so that the
current balance in stock can be kept up to date.
When the stores control system is a paper-based system, there could be two separate stock
records:
Bin Card system, in which a stores record (a Bin card) is kept for each item of stock.
The Bit Card is held in the Stores Department and is used to record the quantities only of
stocks received, stocks issued and the current stock balance.
Stock Ledger system, in which a record is kept for the cost ledger for each item of stock.
In a paper-based system, there is a Stores Ledger Card for each stock item. This is kept
up to date by the Costing Department and records both the quantity and value of items
received into stock, issued from stores and the current balance in stock.
Note:
The purchase cost of materials excludes any Value Added Tax. It includes any costs associated
with buying the materials that the business is required to pay, notably the costs of freight and
delivery (carriage inwards costs).
When a stock control system is computerized, there will be just one stores ledger record system.
For each item of stock, there is a computer record similar to a Stores Ledger Card, showing both
the quantities and the value of items received and issued and the current stock balance.

49
PRICING ISSUES OF MATERIALS
When materials are purchased, the process of giving them a value if fairly straightforward. The
purchase cost of the items is the price charged by the supplier (excluding any Value Added Tax)
plus any carriage inwards costs. The cost should be net of any trade discount given.
When materials are issued from the stores, a cost or price has to be attached to them.
When a quantity of materials is purchased in its entirety for a specific job, the purchase
cost can be charged directly to the job.
More commonly however, materials are purchased in fairly large quantities (but at
different prices each time) and later issued to cost centres in smaller quantities.
It would be administratively extremely difficult, if not impossible, to identify specific
units of materials that have been purchased with units issued to the cost centres.
Consequently, when issues of materials from stores are being valued/priced, we do not
identify what the specific units actually did cost. Instead, materials from stores are
valued/priced on the basis of a
valuation method.
A business might use any of several valuation methods for pricing stores issued. The
three (3) common such methods are:
(a) The First In First Out (FIFO) method;
(b) The Last In First Out (LIFO) method and
(c) The Weighted Average Cost (AVCO) method.
QUESTION
In November 1 000 tonnes of stock item 1234 were purchased in three lots as indicated below:
3 November 400 tonnes at K60 per tonne;
11 November 300 tonnes at K70 per tonne;
21 November 300 tonnes at K80 per tonne
During the same period four materials requisitions were completed for 200 tonnes each, on 5th
,
14th
, 22nd
and 27th
November.

50
REQUIRED
Compute the Stores Ledger Cards to determine the closing stock values using each of the
following methods:
(a) First In First Out (FIFO) Method;
(b) Last In First Out (LIFO) Method and
(c) Weighted Average Method.
QUESTION
You are given the following information about one line of stock held by Thabo Plc.
Details Date Units Cost Sales price
K K
Opening stock 1 January 50 7
Purchase 1 February 60 8
Sale 1 March 40 10
Purchase 1 April 70 9
Sale 1 May 60 12
REQUIRED
Assuming that there are no further transactions in the month of May:
(a) Calculate the value of the issues made on 1 March and also 1 May;
(b) Compute the stock valuation using:
(i) The FIFO valuation method;
(ii) The LIFO valuation method and
(iii) The AVCO method.
COMPARISON OF VALUATION METHODS – THE EFFECT ON PROFIT OF THE
STOCK VALUATION SELECTED
A business can choose whichever method of stock valuation it wants to use. FIFO and Weighted
Average costs are both acceptable for financial reporting, whereas LIFO in not accepted.
However, in cost accounting, the rules of financial reporting do not apply and businesses can use
LIFO should they wish.
If the purchase price of materials stayed the same indefinitely, every stock valuation method
would produce the same values for stores issues and closing stock. Differences between the
valuation methods is usually only significant during a period of price inflation, because the
choice of valuation method can have a significant effect on the value of materials consumed (and
so on the cost of sales and profits) and on closing stock values.

51
The relative advantages and disadvantages of FIFO, LIFO and AVCO are therefore summarized
below, particularly in relation to inflationary situations.
METHOD ADVANTAGES DISADVANTAGES
FIFO - Produces current values - Produces out of date production
for closing stock. costs and therefore potentially
overstates profits.
- Complicates stock records as
Stock must be analyzed by
delivery.
______________________________________________________________________________
______
LIFO - Produces realistic production - Produces unrealistic low
costs and therefore more values.
realistic/prudent profit figures. - Complicates stock records
as stock must be analyzed
by delivery.
AVCO - Simple to operate and - Produces both stock values
calculations within the and production costs which
stock records are are likely to differ from
Minimized. current values.
Whichever method is adopted, it should be applied consistently from period to period.
ACCOUNTING FOR MATERIALS COSTS
Within the stock control system, there is a stock ledger account for each store‟s item.
This Stock Ledger Account records details of all receipts of the material as well as all issues of
the material to production.
The information in a Stores Ledger Account can be presented in the form of a T account, for
double-entry accounting purposes and an example is given below:

52
STOCK LEDGER ACCOUNT – ITEM 2246
K k
Opening balance b/f xxxxx Issues xxxxx
Receipts xxxx Closing balance c/d xxxxx
xxxxx xxxxx
Balance b/d xxxx
There is an account for each stock item in the stock control system, but in the cost ledger
accounting system, there is a Stock Control Account for all stock items in total. In other words,
the Materials Cost Ledger Account shows in total all of the entries that have taken place in the
individual Stock Ledger Accounts. The Materials Cost Ledger Account therefore records the
total materials purchases for the organization and the total value of materials issued to production
as direct materials or to cost centres as indirect materials.
PURCHASE OF MATERIALS
When materials are purchased and the purchases are recorded in the cost accounts, the credit side
of the entry will be to either cash (cash purchases) or creditors (credit purchases). The debit
entry is in the Stores Account, recording the purchase cost of the materials.
QUESTION
Omello Ltd is a small company that was set up at the beginning of May 20x9 by the issue of
K20 000 of shares for cash. Omello Ltd purchases three types of material: A, B and C.
During the month of May 20x9, the purchases of each type of material were as follows:
Material A
3 May K2 000
24 May K9 000
Material B
6 May K5 000
10 May K3 000
21 May K7 000
Material C
1 May K4 000
7 May K4 000
28 May K4 000
Purchases of materials A and B are for cash and material C is on credit for 45 days.

53
REQUIRED
Record these transactions in the individual Stock Ledger Accounts as well as the Cash and
Creditor accounts.
ISSUES OF MATERIALS
Materials issued from stores are recorded as a credit entry in the Stores Account. The value or
cost of the materials issued is determined by whichever valuation method is used (FIFO, LIFO,
Weighted Average cost etc).
The corresponding double entry is to:
A Work in Progress Account, for direct materials;
An Overhead Account for indirect materials. (This can be a production overhead,
administration overhead or selling and distribution overhead, according to the function of
the cost centre that obtains the materials).
Question
Continuing from the above question, now suppose that Omello Ltd made the following issues of
materials in the month of June:
Material A Direct material to production K7 000
Indirect material to production K1 000
Material B To selling & distribution K3 000
To administration K4 000
Material C Indirect material to production K3 000
Required
Record the above transactions in the appropriate ledger accounts for the month of June.
STOCK LOSSES AND WASTE
Material Input Requirements
In some manufacturing processes, there is wastage or loss of stock. When wastage is expected
during processing, the department using the materials should allow for the losses when it orders
materials.
Waste is usually measured as a percentage of the quantities of materials input.
Input – Wastage = Output

54
For example, if wastage is 3% of input, output will be 97% of input. In formula terms it will be
as follows:
Input = Output X 100%
------------------------------------------------
(100% - wastage rate percentage)
So if the required output is 500 units, the input material requirements are:
Input = 500 units X 100
----------------
(100 – 3)
= 515.5 units or say 516 units
QUESTION
In a production process, there is usually a wastage rate of 5% of input. Materials cost K8 per
kilogram. The required output is 1 520 kilogrammes.
REQUIRED
Calculate the quantity of input materials that is required and the amount that quantity will cost.
CONTROL MEASURES
If wastage is a normal part of the production process control, measures should be calculated and
actual wastage rates compared to the control measures to check that the wastage rates are as
expected. If wastage is greater or less than expected, the reasons why this has happened must be
investigated and action taken as necessary.
Wastage may be greater than expected:
If labour is less experienced then expected and make more mistakes when using the
material;
If a machine is old or poorly maintained and there are more breakdowns and errors than
expected;
If the production process has changed;
If the estimate of the control rate for wastage was too low.
QUESTION
A business expects wastage to be 5% of material input. In a period, actual material input was
250 kg and 230 kgs of finished output was produced.

55
REQUIRED
Compare the actual wastage rate with the expected wastage rate.
CONCLUSION
This module has explained the procedures concerned with ordering, receiving, storing and
issuing materials. It has also illustrated the accounting techniques used to value materials. It is
important to have a working knowledge of the stock valuation methods, particularly FIFO, LIFO
and AVCO.
KEY TERMS
Direct material – Materials that cannot be directly attributed to a unit of production or a specific
job or a service provided directly to a customer.
Indirect material – Materials that cannot be directly attributed to a unit of production.
FIFO – First In First Out method of stock pricing;
LIFO – Last In First Out method of stock pricing;
AVCO – Weighted Average method of stock pricing.
REVIEW QUESTIONS
1 Explain the stock procurement procedure;
2 Explain the stock receiving procedure;
3 Explain the stock storage procedure;
4 Explain the stock issuance procedure;
5 List and Explain the advantages and disadvantages of the FIFO method;
6 List and Explain the advantages and disadvantages of the LIFO method; and
7 List and Explain the advantages and disadvantages of the AVCO method.

56
UNIT 8
MARGINAL COSTING VERSUS ABSORPTION COSTING
LEARNING OBJECTIVES:
After studying this topic, students should be able to:
Know that is meant by marginal (variable) costing and Contribution;
Understand the differences between Variable costing and Absorption Costing;
Be able to calculate stock valuations using Variable Costing or Absorption Costing;
Know how to prepare multi-period variable costing statements and absorption costing
statements.
Variable (Marginal ) Costing – Definition
Variable costing, traditionally known as marginal costing, distinguishes between fixed costs and
variable costs as conventionally calculated. For normal cost accounting purposes, variable cost
is taken to be: direct labour, direct materials, direct expenses and the variable portion of
overheads.
On the basis of the above, Variable or marginal costing is defined as:
“A cost accounting method which assigns only variable costs to cost units while fixed costs are
written off as period costs”.
MARGINAL COST AND MARGINAL COSTING
Marginal cost is the part of the cost of one unit of product or service which would be avoided if
the units were not produced, or which would increase if one extra unit is produced.
The marginal production cost per unit of an item usually consists of the following:
Direct materials;
Direct labour;
Variable production overheads
Marginal costing
Marginal costing is the accounting system in which variable costs are charged to cost units and
fixed costs of the period is written off in full against the total contribution.

57
Marginal cost of sales
Marginal cost of sales usually include marginal cost of production adjusted for stock movement
plus variable selling costs, which would include items such as sales commission and possibly
some variable distributions costs.
Principles of marginal costing
The principles of marginal costing are that:
Fixed costs are the same for any volume of activity;
By producing and selling an extra unit or service only the variable cost increases;
By producing and selling the additional unit, the total profit increase by the amount of
contribution from that unit.
Based on the above points, marginal costing argues that:
The valuation of stock should be at variable production costs (direct materials, direct
labour and direct expenses);
Profit measurement should be based on contribution analysis.
Absorption Costing
Under absorption costing both variable costs and fixed costs are absorbed into cost units. The
fundamental difference between marginal costing and absorption costing is one of timing. In
marginal costing fixed costs are written off in the period incurred. In absorption costing fixed
production costs are absorbed into units and then written off in the period in which they are sold.
Marginal costing Absorption Costing
Closing stocks are valued at * Closing stocks are valued at full production
cost
Fixed costs are treated as period * Fixed costs are treated as part of product
costs
Costs are written off in full to the
Profit and Loss account.
Cost of sales does not include a * Cost of sales does not include a share of
fixed
Share of fixed overheads. Overheads.
Product cost under marginal costing and absorption costing

58
QUESTION
A company, Lengwe Ltd produces a single product and has the following budget:
K
Selling price 10 000
Direct materials 3 000
Direct wages 2 000
Variable overheads 1 000
Fixed production overhead is K10 million per month; production volume is 5 000 units per
month.
REQUIRED
Calculate the cost per unit to be used for stock valuation under the following methods:
(a) Absorption costing; and
(b) Marginal costing.
An important feature of variable costing is the calculation of what is termed as “Contribution”.
Contributions is simply the difference between sales revenue and the variable cost of sales.
Therefore:
Variable cost = Direct Labour
+
Direct Materials
+
Direct Expenses
+
Variable Overheads
Contribution = Sales – Variable Costs
The term variable cost sometimes refers to the variable cost per unit and sometimes to the total
costs of a department or batch or operation.
Note:
Alternative names for variable costing are the contribution approach, direct costing and marginal
costing.

59
VARIABLE COST AND MARGINAL COST
To the economist, the additional cost incurred by the production of one extra unit is termed the
“marginal cost”. On the other hand, to the accountant, the additional cost is generally taken to
be the average variable cost which is conventionally assumed to act in a linear fashion, ie the
variable cost per unit is assumed to be constant in the short run, over the activity range being
considered.
The economic model is an explanation of the cost behavior of firms in general, whereas the
accounting model is an attempt to provide a pragmatic basis for decision-making in a particular
firm. However, it is likely that differences between the two viewpoints are more apparent than
real.
A number of investigations have shown that variable costs are virtually constant per unit over the
range of activity changes. Accordingly for short-run decision making purposes, the variable cost
per unit was K5 per unit, the total variable cost for:
100 units would be K500
150 units would be K750
200 units would be K1 000 and so on.
Notes:
1 The assumption of linearity should only be made in appropriate conditions. Where the
question or facts of the situation indicate that variable costs behave in some other
way, eg. non-linearity or in a stepped fashion, then the actual behavior pattern should
be used.
2 Students should be aware that, colloquially, accountants frequently refer to the average
variable cost or the marginal cost.
USES OF MARGINAL COSTING
There are two main uses for variable costing, namely:
1 As a basis for providing information to management for planning and decision-making.
It is particularly appropriate for short run decisions involving changes in volume or
activity and the resulting cost changes.
2 It can also be used in the routine cost accounting system for the calculation of costs and
the valuation of stocks. Used in this fashion, it is an alternative to total absorption
costing.

60
VARIABLE COSTING AND ABSORPTION COSTING
Absorption costing, sometimes known as total absorption costing, is the basis of all financial
accounting statements and was the basis used for the first part of cost ascertainment. Using
absorption costing, all costs are absorbed into production and thus operating statements do not
distinguish between fixed costs and variable costs. Consequently, the valuation of stocks and
work-in-progress contains both fixed cost elements and also variable cost elements.
On the other hand, using variable costing, fixed costs are not absorbed into the cost of
production. They are instead treated as period costs and written off each period in the Costing
Profit and Loss Account. The effect of this is that finished goods and work-in-progress are
valued at variable cost only, ie the variable elements of cost, usually prime cost plus variable
overhead. At the end of the period, the variable cost of sales is deducted from sales revenue in
order to show the contribution, from which fixed costs are deducted to show net profit.
QUESTION
In a period, 20 000 units of product zubi were produced and sold. Costs and revenues of the
product were as follows:
K000
Sales 100 000
Production costs:
Variable 35 000
Fixed 15 000
Administrative & Selling overheads:
Fixed 25 000
REQUIRED
Prepare operating statements based on the following methods of costing:
(a) Absorption costing and
(b) Marginal (Variable costing
CONTRIBUTION CONCEPT
Contribution is the difference between sales value and the marginal cost of sales. The term
contribution is really short for contribution towards covering fixed overheads and then making a
profit.
Why Contribution is Significant
Contribution is an important concept in marginal costing. Changes in the volume of sales, in in
sales price, or in variable costs will all affect profit by altering the total contribution. Marginal
costing techniques can be used to help management to assess the likely effect on profits of higher

61
or lower sales volume, or the likely consequences of reducing the sales price of a product in
order to increase demand and so on. The approach to any such analysis should be to calculate
the effect on total contribution.
EXPLANATION OF THE DIFFERENCE IN PROFIT
The difference in profits reported under the two costing systems is due to the different stock
valuation methods used.
In stock levels increase between the beginning and end of a period, absorption costing will report
the higher profit. This is because some of the fixed production overhead costs incurred during
the period will be carried forward in closing stock (which reduces the cost of sales) to be set
against sales revenue in the following period instead of being written off in full against profit in
the period concerned. On the other hand, marginal costing will report a lower profit if the stock
increases.
If stock levels decrease, absorption costing will report the lower profit because as well as the
fixed overhead incurred, fixed production overhead which had been carried forward in the
opening stock is released and is also included in the cost of sales figure. In this case, marginal
costing will report higher profit as compared to absorption costing.
QUESTION
Xama Ltd commenced business on 1 January making one product only, with the following costs:
K000
Direct labour 5
Direct material 8
Variable production overhead 2
Fixed production overhead 5
Total cost 20
The fixed production overheads figure has been calculated on the basis of a budgeted normal
output of 36 000 units per annum.
You are to assume that there is no expenditure or efficiency variance and that all budgeted
expenditure is incurred evenly over the year.

62
Selling, distribution and administration expenses are:
Fixed K120 million;
Variable 15% of the sales value
The selling price per unit is K35 000 and the number of units produced and sold were:
March April
Units Units
Production 2 000 3 200
Sales 1 500 3 000
REQUIRED
Prepare the Profit Statement for each of the months of March and April using:
(a) Marginal costing and
(b) Absorption costing principles.
ADVANTAGES OF ABSORPTION COSTING
1 It is fair to share fixed production costs to units of production as such costs are incurred
in production;
2 Closing stocks are valued in accordance with the IFRS 9;
3 It is easier to determine product profitability where a company produces more than one
product;
4 Where stock building is necessary, fixed costs should be included as product costs in
order to avoid fluctuations in reported results.
ADVANTAGES OF MARGINAL COSTING
1 Absorption costing encourages management to produce goods in order to absorb
allocated overheads instead of meeting market demands;
2 No apportionment of fixed assets;
3 Fixed costs are period costs that do not change with output;
4 Marginal costing is useful in decision making;
5 Under/over absorption of overheads is avoided;
6 Simple to apply and operate.
Lecture summary
Marginal cost is the variable cost of one unit of product or service;
Contribution is an important measure in marginal costing and it is calculated as the
difference between sales value and marginal or variable costs;

63
In marginal costing, fixed production costs are treated as period costs and are written off
as they are incurred;
In absorption costing, fixed production costs are absorbed into cost units and are carried
forward in stock to be charged against sales for the next period. Stock values using
absorption costing are therefore greater than those calculated using marginal costing; and
IFRS 9 recommends the use of absorption costing for the valuation of stock s in financial
statements.
MARGINAL AND ABSORPTION COSTING
FULL COSTING AND MARGINAL COSTING
In Absorption costing fixed manufacturing overheads are absorbed into cost units. Thus, stock is
valued at absorption cost and fixed manufacturing overheads are charged in the Profit and Loss
Account of the period in which the units are sold.
In Marginal costing, fixed manufacturing overheads are not absorbed into cost units. In this case
stock is valued at marginal (or variable) cost. In this case, all fixed overheads, including fixed
manufacturing overheads, are treated as period costs and are charged in the Profit and Loss
Account of the period in which the overheads are incurred.
QUESTION 1
A company Chabi Ltd, produces a single product and has the following budget:
Budget Per Unit
K
Selling price 10 000
Direct materials 3 000
Direct wages 2 000
Variable overhead 1 000
Fixed production overhead is K10 000 000 per month; production volume is 5 000 units per
month.
REQUIRED
Calculate the cost per unit to be used for stock valuation under each of the following methods:
(a) Absorption costing; and
(b) Marginal costing.

64
The stock valuation will normally be different for marginal costing and absorption costing.
Under the Absorption costing, stock will include variable and fixed production overheads
whereas under Marginal costing, stock will only include variable production overheads.
CONTRIBUTION
Contribution is an important concept in marginal costing. It is the difference between sales and
the variable cost of sales and can be calculated as follows:
Contribution = Sales – Variable cost of sales
Contribution is short for „contribution to fixed costs and profits‟. The idea is that after deducting
the variable costs from sales, the figure remaining is the amount that contributes to meeting fixed
costs and once fixed costs are totally covered, then profit is generated.
CONTRIBUTION AND PROFIT
Marginal costing values goods at variable cost of production (or marginal cost) and contribution
can be shows in the following statement:
Marginal costing statement
K
Sales X
Less: Variable costs (X)
Contribution X
Less: Fixed costs (X)
Profit X
WHY IS CONTRIBUTION SIGNIFICANT?
Contribution is an important concept in Marginal costing. Changes in the volume of sales, or in
sales prices, or in variable costs will all affect profit by altering the total contribution.
Marginal costing techniques can be used to help management to assess the likely effect on profits
of higher or lower sales volume, or the likely consequences of reducing the sales price of a
product in order to increase demand and so on. The approach to any such analysis should be to
calculate the effect on total contribution.
QUESTION 2
Sililo Ltd sells a single product for K9. Its variable cost is K4 and Fixed costs are currently at
K70 000 per annum and annual sales are at 20 000 units. There is a proposal to make a change
to the product design that would increase the variable cost to K4.50, but it would also be possible

65
to increase the selling price to K10 for the re-designed model. It is expected that annual sales at
this higher price would be 19 000 units.
REQUIRED
Calculate information relating to the way the re-design of the product would affect the annual
profit.
PROFIT STATEMENTS UNDER ABSORPTION COSTING AND MARGINAL
COSTING
Absorption costing must be used to provide stock valuations for statutory financial statements.
On the other hand, either Marginal or Absorption costing can be useful for internal management
reporting purposes. The choice is made will affect:
The way in which the profit information is presented and
The level of reported profit, but only if sales volumes do not exactly equal production
volumes (so that there is a difference between opening stock values and closing stock
values)
QUESTION 3
Company Amusa Ltd produces a single produce and has the following budget:
Company Amusa Budget per unit
K
Selling price 10
Direct materials 3
Direct wages 2
Variable overhead 1
The fixed production overhead is K10 000 per month. The sales per month are 4 800 units while
production is at 5 000 units.
REQUIRED
Show Profit Statements for the month using each of the following methods:
(a) Total Absorption costing and
(b) Marginal costing.

66
CAUSES OF DIFFERENCES IN PROFITS FROM THE TWO APPROACHES
The difference in profit between the two costing methods is due to the difference in stock levels
between the beginning and the end of the period. In the question above, there was an increase
from 0 to 200 units over the month. Under the Absorption costing method, closing stock has
been valued at K1 600 (ie. K8 per unit which includes K2 of absorbed fixed overheads).
Under Marginal costing, closing stock is valued at K1 200 (ie. At K6 per unit) and all fixed
overheads are charged to the Profit and Loss Account as period costs.
If stock is rising or falling, Absorption costing will give a different profit figure from Marginal
costing. But if Sales equal production, the fixed overheads absorbed into cost of sales under the
Absorption costing will be the same as the period costs charged under the Marginal costing and
thus the profit figure will be the same.
The two profit figures can therefore be reconciled as follows:
K
Absorption costing profit 9 600
Less: Fixed costs included in the increases in stock (200 X K2) (400)
Marginal costing profit 9 200
The basic rule is:
If stock levels are rising, the Absorption costing profit will be greater than the Marginal
costing profit;
If stock levels are falling then Absorption profit will be less than the Marginal cost profit.
(With Absorption costing, fixed costs in the opening stock brought forward are charged
against profit in this period); and
If Opening and closing stock levels are the same, then Absorption Cost profit will be
equal to the Marginal cost profit.
UNDER – AND OVER-ABSORPTION OF FIXED OVERHEADS
Under-and over-absorption of fixed overheads arises if the actual expenditure and production
level are not as estimated in the predetermined absorption rate. Such differences between
budgeted expenditure and actual expenditure and production, cause the under- or over-absorption
of overheads but have no effect on the different profit figures reported under Absorption and
Marginal costing, which is due to the different stock valuations.
QUESTION 4
A manufacturer, Kaluwe Ltd makes and sells widgets. It has 2 000 units in stock at the start of
the year. Budgeted production and sales for the year are 20 000 units. The variable production

67
cost per unit is K6.00 and budgeted fixed costs are K80 000. The sales price per unit is at
K15.00.
During the year, actual production and sales totaled 16 000 units. Unit variable costs and selling
prices were as budgeted and fixed costs were K77 000.
REQUIRED
From the above details, compare the reported profit for the year with Absorption costing and
Marginal costing.
PROFORMA PROFIT AND LOSS ACCOUNTS
It is important that as students, you should be able to prepare an Income Statement with either
Absorption costing or Marginal costing method or both.
The following profoma samples help in building up the Profits and Loss Statements using either
the Absorption costing or Marginal costing approaches. It is important to remember though,
that unless there are differences between opening stocks and closing stocks, there is no need to
bother about the opening and closing stocks when producing a Profit Statement.
INCOME STATEMENT – USING THE ABSORPTION COSTING METHOD
K K K
Sales XXXX
Production Cost of Sales:
Opening stock (full production cost) XXX
Production costs:
Direct materials XX
Direct labour XX
Production costs absorbed XX
(XX)
XXX
Less: Closing stock (full production cost) (XX)
(XX)
Production overhead absorbed XX
Production overhead incurred XX
Over-absorbed/(under-absorbed) overheads X or (X)
X
Administration overheads incurred XX
Selling and distribution costs incurred XX
(XX)
Profit XXX

68
INCOME STATEMENT – USING THE MARGINAL COSTING METHOD
K K K
Sales XXX
Less: Variable cost of sales:
Opening stock (marginal production cost) XX
Variable production cost incurred:
Direct materials XX
Direct labour XX
Variable production overheads XX
XX
XX
Less: Closing stock (marginal production cost) (XXX)
Variable production cost of sales XX
Variable selling and distribution costs XX
Total variable cost of sales (XXX)
Contribution XXX
Fixed c osts (period costs):
Fixed production costs XX
Fixed administration costs XX
Fixed selling and distribution costs XX
Total fixed costs (XXX)
Profit XXX
ADVANTAGES OF MARGINAL COSTING
Preparation of the normal Operating Statements using Absorption costing is considered less
informative for the following reasons:
(a) Marginal costing emphasizes variable costs per unit and treats fixed costs in total as
period costs, whereas Absorption costing includes all production costs in unit costs,
including a share of fixed production costs. Marginal costing therefore, reflects the
behavior of costs in relation to activity.
Since most decision-making problems involve changes to activity, Marginal costing
information is therefore more relevant and appropriate for short-run decision-making than
Absorption costing.
(b) Profit per unit with Absorption costing can be a misleading figure. This is because
profitability might be distorted by increases or reductions in stock levels in the period
which has no relevance for sales.

69
(c) Comparison between products using Absorption costing can be misleading because of the
effect of arbitrary apportionment of the fixed costs. Where two or more products are
manufactured in a factory and share all production facilities, the fixed overhead can only
be apportioned on an arbitrary basis.
The Question below illustrates the misleading effect on profit which Absorption costing can
have.
QUESTION 5
A company Jonah Ltd sells a product for K10.00 and incurs an amount of K4.00 of variable costs
in its manufacture. The fixed costs are K900 per year and are absorbed on the basis of the
normal production volume of 250 units per year.
The results for the last four years were as follows:
1st 2
nd 3
rd 4th Total
Year Year Year Year
Units units units units
Opening stock - 200 300 300 -
Production 300 250 200 200 950
300 450 500 500 950
Less: Closing stock 200 300 300 200 200
Sales 100 150 200 300 750
REQUIRED
Prepare Profit Statements using each of the following methods:
(a) Absorption costing; and
(b) Marginal costing.
The next two Questions illustrate the importance of Marginal costing in the decision-making
process for management.
QUESTION 6
A factory manufactures three (3) components namely: X, Y and Z and the budgeted production
for the year is 1 000 units, 1 500 units and 2 000 units respectively. Fixed overhead amounts to
K6 750 and has been apportioned on the basis of budgeted units: K1 500 to X, K2 250 to Y and
K3 000 to Z.

70
Sales and variable costs are as follows:
Component X Component Y Component Z
Selling price K4.00 K6.00 K5.00
Variable cost K1.00 K4.00 K4.00
REQUIRED
From the above details, prepare a Budgeted Profit and Loss Statement for each of the three
components.
QUESTION 7
A company, Mooto Ltd, manufactures one product has calculated its cost on a quarterly
production budget of 10 000 units. The selling price was K5.00 per unit. Sales in the four
successive quarters of the last year were as follows:
Quarter 1 10 000 units
Quarter 2 9 000 units
Quarter 3 7 000 units
Quarter 4 5 500 units
The level of stock at the beginning of the year was 1 000 units and the company maintained its
stock of finished products ant the same level at the end of each of the four quarters.
Based on its quarterly production budget, the cost per unit was as follows:
Cost per unit
K
Prime cost 3.50
Production overhead 0.75
Total 4.25
Selling and distribution overheads were K3 000 each quarter.
Fixed production overhead, which has been taken into account in calculating the above figures,
was K5 000 per quarter. Selling and administration overhead was treated as fixed, and was
charged against sales in the period in which it was incurred.
REQURED
You are required to present a tabular Statement to bring out the effect on net profit of the
declining volume of sales over the four quarters given, assuming in respect of fixed production
overhead that the company:

71
(a) Absorbs it at the budgeted rate per unit;
(b) Does not absorb it into the product cost, but charges it against sales in each quarter (ie.
The company uses Marginal costing approach).
ADVANTAGES OF ABSORPTION COSTING
Inspite of its weaknesses as a system for providing information to management, Absorption
costing is widely used.
The only difference between using Absorption costing and Marginal costing as the basis of
stock valuation is the treatment of fixed production costs.
The arguments used in favour of Absorption costing are as follows:
Fixed costs are incurred within the production function and without those facilities,
production would not be possible. Consequently, such costs can be related to production
and should be included in stock valuation.
Absorption costing follows the matching concept by carrying forward a proportion of the
production cost in the stock valuation to be matched against the sales value when the
items are sold.
It is necessary to include fixed overhead in stock values for financial statements; routine
cost accounting using Absorption costing produces stock values which include a share of
fixed overhead.
Overhead allotment is the only practicable way of obtaining job costs for estimating
prices and profit analysis.
Analysis of under-/over-absorbed overhead is useful to identify inefficient utilization of
production resources.
It is quite common to price jobs or contracts by adding a profit margin to the estimated
fully-absorbed cost of the work to be undertaken.
The main weaknesses of Absorption costing as indicated above, include the fact that
Absorption costing can provide misleading information to management whenever a decision
has to be made.
Marginal costing is consistent with the concept of relevant costs for management decision-
making. It is also useful for forward planning, for example, in forecasting and budgeting.
72
KEY TERMS
Absorption costing – A costing technique that values production and stock at full production
cost.
Marginal costing – A costing technique that values production and stock at variable
production cost. All variable costs are deducted from sales in to arrive at the revenue and
fixed costs are treated as period costs in arriving at the profit figure.
Contribution – Sales revenue less variable costs.
SUMMARY REVISION QUESTIONS
1 Explain the term Marginal costing.
2 Explain the term Marginal cost.
3 Explain the difference between Marginal costing and Absorption costing.
4 Explain the term Contribution.
5 Explain the reason for the difference in operating profit between Marginal costing and
Absorption costing.
6 List and explain the advantages and disadvantages of Marginal costing.
7 List and explain the advantages and disadvantages of Absorption costing.

73
UNIT 9
COST BEHAVIOUR AND COST-VOLUME-PROFIT (CVP) ANALYSIS
AND BREAK EVEN POINT (BEP) ANALYSIS
INTRODUCTION TO COST BEHAVIOUR
Some costs change when activity levels change, while other costs do not change in spite of the
levels of performance. This distinction may be used to provide an alternative method of stock
valuation and also profit reporting. This approach used in the provision of information to
management.
Analysis of Costs
Total Cost – Total cost is the cost relating to fixed cost combined with variable cost.
Fixed Cost – Fixed cost is a cost which is unaffected by the level of activity in other words, in
spite of the level of performance fixed costs will remain the same. Examples of fixed costs
include: Depreciation costs, Rent and Rates etc.
Variable Cost – A Variable cost is a cost which varies with the level of activity. Examples of
such costs include costs such as fuel costs, cost of raw materials, cost of labour rates targeted on
hourly basis etc.
DIAGRAM SHOWING FIXED COSTS
Factory
Rent
In K‟000
500 Fixed cost
0 500 1000 output (units)

74
DIAGRAM SHOWING VARIABLE COSTS
Variable cost
Material cost 1000
In K 0
Contribution
(Output)
If the two types of cost are segregated, the operating statement can be presented in a different
way as is shown below:
Production of widgets
1 unit 500 units 1000 units
K000 K000 K000
Sales 3 1 500 3 000
Less: Variable costs (raw materials) 1 500 1 000
---------- --------- --------
Contribution 2 1 000 2 000
Less: Fixed costs (Rent) 500 500 500
---------- --------- ----------
Profit/(Loss) (498) 500 1 500
====== ====== ======
The presentation above is based on the concept that each unit sold contributes a selling price less
the variable cost per unit. Total contribution provides a fund to cover fixed costs and net profit.
Contribution is calculated as Sales minus variable costs ie.
Contribution = Sales – variable costs or
Contribution per unit = Selling price per unit – variable cost per unit
Contribution – Fixed costs = Net profit
The analysis of cost behaviour into fixed and variable is only appropriate when considering a
limited range of activity.

75
Variable costs are unlikely to be constant per unit. For example, when buying materials, it is
normal to obtain discounts for larger orders. Thus, the more tyres are ordered, the lower the
price paid for each tyre due to discounts (quantity discounts) that may be received.
Step costs
Some costs do rise in a series of steps. For example, large steps (renting a second factory) or
small steps (renting a computer) may occur at different levels of fixed costs.
Semi-variable costs (or semi-fixed costs)
These are the costs which exhibit the characteristics of both variable costs and also fixed costs in
that while they increase with output they never fall to zero, even if the output itself is zero.
An example is maintenance costs: even at zero output standby maintenance costs are incurred.
In this case, as output rises, so do the maintenance costs.
COST-VOLUME PROFIT ANALYSIS
Cost-volume-profit (CVP) analysis is a technique for analyzing how costs and profits change
with the volume of production and sales. It is also called the Break-even analysis.
CVP analysis assumes that selling prices and variable costs are constant per unit at all volumes
of sales and that fixed costs remain fixed at all levels of activity.
Unit costs and volume
As a business produces and sells more output during a period, its profits will increase. This is
partly because sales revenue rises and sales volume goes up. It is also partly because unit costs
fall. As the volume of production and sales go up, the fixed cost per unit falls since the same
amount of fixed costs are shared between a larger number of units.
Example – Unit Costs and Volume
A business makes and sells a single product. Its variable cost is K6.00 per unit and it sells for
K11.00 per unit. Fixed costs are K40 000 each month.
It is possible to measure the unit cost and the unit profit at different volumes of output and sales.
The table below shows total costs, revenue and profit and also unit costs, revenue and profit at
several levels of sales:

76
10 000 units 15 000 units 20 000 units
K K K
Variable costs 60 000 90 000 120 000
Fixed costs 40 000 40 000 40 000
Total costs 100 000 130 000 160 000
Sales revenue 110 000 165 000 220 000
Profit 10 000 35 000 60 000
10 000 units 15 000 units 20 000 units
K per unit K Per unit K Per unit
Variable costs 6.00 6.00 6.00
Fixed costs 4.00 2.67 2.00
Total costs 10.00 8.67 8.00
Sales revenue 11.00 11.00 11.00
Profit 1.00 2.33 3.00
It can be noticed that as the sales volume goes up, the cost per unit falls and the profit per unit
rises. This is because the fixed cost per unit falls as volume increases. In contrast to unit
variable costs and the selling price per unit which are constant at all volumes of sales.
In order to analyze how profits and costs will change as the volume of sales changes, it is better
to adopt the marginal costing approach. This is to calculate the total Contribution at each
volume of sales, then deduct fixed costs in order to obtain the profit figure.
The Marginal costing is shows below:
10 000 units 15 000 units 20 000 units
K Kper unit K Kper unit K Kper unit
Sales revenue 110 000 11.0 165 000 11.0 220 000 11.0
Variable costs 60 000 6.0 90 000 6.0 120 000 6.0
Contribution 50 000 5.0 75 000 5.0 100 000 5.0
Fixed costs 40 000 40 000 40 000
Profit 10 000 35 000 60 000
THE IMPORTANCE OF CONTRIBUTION IN CVP ANALYSIS
Contribution is a key concept in CVP analysis, because if we assume a constant variable cost per
unit and the same selling price at all volumes of output, the contribution per unit is a constant
value (and the contribution per K1 of sales is also a constant value).

77
Definition Unit contribution = selling price per unit – variable cost per unit
Definition Total contribution
= Volume of sales in units x (unit contribution); or
= Total sales revenue – total variable cost; or
= Total sales revenue x contribution/sales ratio
Definition Contribution/Sales ratio or CS ratio
= Contribution per unit/Sales price per unit or
= Total contribution/Total sales revenue
Major Assumptions behind Cost Volume Profit Analysis
The following assumptions lie behind the concept of Cost Volume Profit Analysis:
All costs can be resolved into fixed and variable elements;
Fixed costs will remain constant and also variable costs vary proportionately with the
level of activity;
Over the activity range being considered costs and revenues behave in linear fashion;
The only factor affecting costs and revenue is the volume of activity;
Technology, production methods and efficiency remain unchanged;
There are no stock level changes.
Uses of CVP Analysis
CVP Analysis is used widely in preparing financial reports for management. It is a simple
technique that can be used to help estimate profits and then make decisions about the best course
of action which should be taken by the organization. The application of CVP Analysis includes
the following:
Estimating future profits;
Calculating the break-even point for sales
Analyzing the margin of safety in the budget;
Calculating the volume of sales required inorder to achieve a target profit;
Deciding on a selling price for a given product.
The Break-even point
Breakeven is the volume of sales at which the business makes neither a profit nor a loss. At
breakeven point, total revenue equals total costs, in other words, there is no profit and there is no
loss incurred.

78
In other words, breakeven shows the minimum operating levels below which an organization
should not go in order to avoid incurring a loss.
ESTIMATING FUTURE PROFITS
CVP analysis can be used to estimate future profits.
Example
ZACI Ltd makes and sells a single product. Its budgeted sales for the next year are
40 000 units.
The product sells for K18.00 per unit.
Variable costs of production and sales are as follows:
K
Direct materials 2.40
Direct labour 5.00
Variable production overhead 0.50
Variable selling overhead 1.25
Fixed expenses are estimated for the year as follows:
K
Fixed production overhead 80 000
Administration costs 60 000
Fixed selling costs 90 000
230 000
Required
Calculate the expected profit for the year.
BREAK-EVEN ANALYSIS
Break-even is the volume of sales at which the business just „breaks even‟, so that it makes
neither a profit nor a loss. At break-even point, total costs equal total revenue.
Calculating the break-even point can be useful for management because it shows what the
minimum volume of sales must be to a void making a loss in the period.
At break-even point, total contribution is just large enough to cover fixed costs. In other words,
at break-even point:
Total contribution = Fixed costs
79
The break-even point in units of sale can therefore be calculated as:
Break-even pint (in units of sale) = Fixed costs
Contribution per unit
Question
A business makes and sells a single product, which sells for K15.00 per unit and which has a unit
variable cost of K7.00.
Fixed costs are expected to be K500 000 for the next year.
Required
1 What is the break-even point in units?
2 What is the break-even point in sales revenue?
3 What would be the break-even point if fixed costs went up to K540 000?
4 What would be the break-even pint if fixed costs were K500 000 but unit variable costs
went up to K9.00 per unit?
Computation of Breakeven point
Breakeven point can be computed using three (3) approaches which are:
Contribution per unit
Contribution sales ratio
Graph method
The Contribution per unit method
Breakeven point (in units) = Fixed Costs
-------------------------------
Contribution per Unit
= No. of units
Contribution Sales ratio
Breakeven point (in sales revenue) = Fixed Costs
----------------------------
Contribution sales ratio

80
Example
The following details relate to a shop that currently sells 25 000 pairs of shoes annually.
Selling price per pair K320 000
Purchase cost per pair K200 000
Total annual fixed costs K
Salaries 800 000 000
Advertising 320 000 000
Other fixed expenses 800 000 000
Required
From the above details, calculate the breakeven point using:
(a) Contribution per unit;
(b) Contribution sales ratio;
MARGIN OF SAFETY
Actual sales volume will not be the same as budgeted sales volume. Actual sales will probably
either fall short of budget or exceed budget. A useful analysis of business risk is to look at what
might happen to profit if actual sales volume is less than budgeted.
The difference between budgeted sales volume and the break-even sales volume is known as the
margin of safety. It is simply a measurement of how far sales can fall short of budget before the
business makes a loss. In this respect, a large margin of safety indicates a low risk of making a
loss, whereas a small margin of safety might indicate a fairly high risk of a loss. It therefore
indicates the vulnerability of a business to a fall in demand.
The margin of safety is usually expressed as a percentage of budgeted sales.
The difference between budgeted sales volume and the breakeven sales is known as the Margin
of Safety. The Margin of safety is a measurement of how far sales can fall short of the budget
before the business makes a loss.
In this respect a large margin of safety indicates a low risk of making a loss where as a small
margin of safety might actually indicate a fairly high risk of incurring a loss.
Margin of safety = Budgeted sales – Sales at breakeven point

81
Example
Budgeted sales 80 000 units
Selling price per unit K8.00
Variable cost per unit K4.00
Fixed costs K200 000
Required
From the above details, calculate the following:
(a) Margin of safety in units
(b) Margin of safety percentage.
Question
Budgeted sales 25 000
Breakeven sales 16 000
From the above, compute the margin of safety in units and also the margin of safety %.
TARGET PROFIT
The CVPA can be used to calculate the volume of sales that would be required to achieve a
target level of profit. In order to achieve a target profit, the business will have to earn enough
contribution to cover all fixed costs and then make the required amount of profit.
Volume to make target profit (TP) is given by the formula:
Fixed costs + Target profit
---------------------------------------
Contribution per unit
Example
Zimba Ltd has capital employed amounting to K100 million, its target profit on capital employed
is 20% per annum. Zimba Ltd manufactures a standard product called sigma, with the following
details:
Selling price per unit K60 000
Variable cost per unit K20 000
Annual fixed costs K100 million

82
Required
Calculate the volume of sales which is required in order to achieve the target profit.
DECIDING ON A SELLING PRICE
CVP can be useful in helping management to compare different courses of action and select the
option that will earn the biggest profit. For example, management might be considering two or
more different selling prices for a product and want to select the profit-maximizing price.
The profit-maximizing price is the contribution-maximizing price.
Example
A company has developed a new product which has a variable cost of K12.00. Fixed costs
relating to this product are K48 000 each month. Management are trying to decide what the
selling price for the product should be.
A market research report has suggested that monthly sales demand for the product will depend
on the selling price chosen, as follows:
Selling price per unit K16.00 K17.00 K18.00
Expected monthly sales demand 17 000 units 14 500 units 11 500 units
Required
Identify the selling price at which the expected profit will be maximized.
Question
Your company is about to launch a new product called Zek, which has a unit variable cost of
K8.00. Management are trying to decide whether to sell the product at K11.00 per unit or at
K12.00 per unit.
At a price of K11.00, annual sales demand is expected to be 200 000 units. At a price of K12.00,
annual sales demand is expected to be 160 000 units.
Annual fixed costs relating to the product will be K550 000.
Required
Determine which of the two prices will maximized expected profits.

83
LIMITATIONS OF BREAKEVEN ANALYSIS
Though breakeven analysis is a useful technique for managers, the technique has a number of
limitations including the following:
It can only apply to a single product or a single mix of a group of products;
A breakeven chart may be time consuming to prepare;
It assumes that fixed costs are constant at all levels of output;
It assumes that variable costs are the same per unit at all levels of output;
It assumes that sales prices are constant at all levels of output;
It assumes that production and sales are always the same;
It ignores the uncertainty in the estimates of fixed costs and variable cost per unit.

84
UNIT 10
CVP ANALYSIS FORMULA AND BREAK-EVEN CHARTS
CVP analysis can be undertaken by graphical means or by formulae which are listed below and
have already been illustrated by examples.
The break-even formulae are summarized below:
(a) Break-even point (units) = Fixed costs
Unit Contribution
(b) Contribution per unit = Selling price – variable cost per unit
(c) Total contribution = Total sales – Total variable costs
(d) Contribution/Sales ratio = Contribution per unit x 100
Sales price per unit
(e) Total contribution/Sales ratio = Total contribution x 100
Sales revenue
(f) Break-even point (K sales) = Fixed costs x Selling price per unit
Unit contribution
(g) Break-even point (K sales) = Fixed Costs
C/S Ratio
(h) Level of sales to result in target profit (in units) = Fixed costs + Target Profit
Contribution per unit
(i) Level of sales to result in target profit after tax (in units) = FC + Target profit
1 – Tax rate
Unit Contribution
(j) Level of sales to result in target profit (K sales)
= (Fixed cost + Target profit) x Sales price/unit
Contribution per unit
Note: The above formulae relate to a single product firm or one with an unvarying mix
of sales. With a multi product firm it is possible to calculate the break-even point can be
calculated differently.

85
BREAK-EVEN CHARTS
A break-even chart may be preferred under the following circumstances:
(a) Where a simple overview is sufficient.
(b) Where there is a need to avoid a detailed, numerical approach when, for example, the
recipients of the information have no accounting background.
The basic chart is known as a Break-even chart which can be drawn in two ways. The
first is known as the traditional approach and the second as the contribution approach.
Whatever approach is adopted, all costs must be capable of separation into fixed and
variable elements, ie. Semi-fixed or semi-variable costs must be analyzed into their
components.
THE TRADITIONAL BREAK-EVEN CHART
Assuming that fixed and variable costs have been resolved, the chart is drawn by using
the following approach:
(a) Draw the axes
Horizontal: showing levels of activity expressed as units of output or as
percentages of total capacity.
Vertical: showing values in Kwacha or K000s as appropriate for costs and
revenues.
(b) Draw the cost lines
Fixed cost – This will be a straight line parallel to the horizontal axis at the level
of the fixed costs.
Total cost – This will start where the fixed cost line intersects the vertical axis and
will be a straight line sloping upward at an angle depending on the proportion of
variable cost in total costs.
(c) Draw the revenue line
This will be a straight line from the point of origin sloping upwards at an angle
determined by the selling price.
Question
A company makes a single product with a total capacity of 400 000 litres per annum.
Cost and sales data are as follows:
Selling price K1.00 per litre
Marginal cost K0.50 per litre
Fixed costs K100 000

86
Required
From the above details, draw a traditional break-even chart showing the likely profit at
the expected production level of 300 000 litres.
Solution (chart 1) Traditional break-even charts.
From the chart below, it will be seen that breakeven point is at an output level of 200
000litres and that the width of the profit wedge indicates the profit at a production level
of 300 000litres. The profit is at K50 000.
c
profit
(000 ) cost revenue Sales line d
400
Total cost line
300 breakeven point
b
Margin of variable total cost
200 safety cost
loss
100 a e
Fixed cost
0 f
50 100 150 200 250 300 350 400 output
(000 litres)
NOTES

87
The margin of safety indicated on the chart is the term given to the difference between
the activity level selected and breakeven point. In this case margin of safety is 100 000
litres.
THE CONTRIBUTION BREAK-EVEN CHART
This chart uses the same axes and data as the traditional chart. The only difference being
that variable costs are drawn on the chart before the fixed costs, resulting in the
contribution being shown as a wedge.
Question
Using the information in the chart above, you are required to draw up a break-even chart
using the Contribution method.
Solution
Break-even chart 2 (Contribution structure)
Repeat of the above chart except that a contribution Break-even chart should be shown.

88
Contribution Break-even chart. c
sales profit
(000 ) Cost/ Revenue d
400
Total cost line
Fixed cost
300 breakeven point contribution e
b
Total
cost
200
loss
100 a variable cost
0 f
50 100 150 200 250 300 350 400 output
(000 litres)
NOTES
a) The area c, o, e represents the contribution earned. There is no direct equivalent
on the traditional chart
b) The area of d a o f represents total cost and is the same as the traditional chart.
c) It will be seen from the chart that the reversal of fixed costs and variable costs
enables the contribution wedge to be drawn this providing additional information.
An alternative farm of the contribution break-even chart is where the net difference
between sales and variable cost, i.e. total contribution, is plotted against fixed costs. This
is shown in the diagram below.

89
The alternative form of the contribution break-even chart is where the net difference
between sales and variable cost, ie. Total contribution, is plotted against fixed costs.
Question
Using the same question above, calculate the break-even chart using the alternative form
of the contribution break-even chart.
Solution
Solution (chart 3): Alternative form of contribution break-even chart
Cost revenue (K000)
400
Alternative form of contribution Break-even chart
300
200
Break-even point
profit
100
Loss Contribution fixed cost
0 50 100 150 200 250 300 350 400
(output – 000litres)
Notes on the alternative contribution chart:
(a) Sales and variable costs are not shown directly.
(b) Both forms of contribution chart, show clearly that contribution is first used to meet
fixed costs and when these costs are met the contribution becomes profit.
PROFIT CHART
This is another form of presentation with the emphasis on the effect on profit of varying
levels of activity. It is a simpler form of chart to those illustrated above because only a
contribution line is drawn.

90
The horizontal axis is identical to the previous charts, but the vertical axis is continued
below the point of origin to show potential losses. A contribution line is drawn from the
loss at zero activity, which is equivalent to the fixed costs, through the break-even point.
The contribution line is drawn by plotting the amount of contribution at various sales
levels which is readily calculated using the CS ratio; 50% in the above question. By
commencing the line at the amount of the fixed costs, „loss‟ and „profit‟ wedges are
shown which are identical to those in the earlier charts.
This type of chart (the profit chart) is illustrated in the diagram below, using once again,
the data in the question above.
Solution: Profit chart (4)
Note: Lines for variable and fixed costs and sales do not appear, merely the one summary
profit line is shown.
K000 PROFIT CHART
200
Contribution line
Profits
100
Break-even point profit p
0 50 100 150 200 250 300 350 400
Loss
Output (000litres)
100
Losses
200
MULTI-PRODUCT CHART
Al l of the charts illustrated so far have assumed a single product. Equally they could
have illustrated a given sales mix resulting in an average contribution rate equivalent to a
single product. An alternative method is to plot the individual products each with their
individual C/S characteristics and then show the resulting overall profit line. This is
shown below:

91
Question
A firm has fixed costs of K50 000 per annum and has three products, the sales and
contribution of which are shown below:
Product Sales Contribution C/S Ratio
K K %
X 150 000 30 000 20
Y 40 000 20 000 50
Z 60 000 25 000 42
Required
Using the above details, plot the products on a profit chart and show the break-even sales.
Solution (Chart 5) and other details
The axes on the profit chart are drawn in the usual way and the contribution from the
products in the sequence of there CS ratio i.e. Y, Z, X drawn on the chart.
(000)
Multi-product profit chart
X c/s 20%
50 100 150 200 250
0 Z c/s 42% sales (000)
25 Y c/s 50% Break-even point
Resulting profit line
50
LIMITATIONS OF BREAK-EVEN CHARTS
The various charts relating to break-even depicted above, show cost, volume and profit
relationship in a simplified and approximate manner. They can be useful aids, but
whenever they are used the following limitations should not be forgotten.
The short-comings of break-even charts include the following:

92
(a) The charts may be reasonable pointers to performance within normal activity ranges,
say 70% - 120% of average production. Outside this relevant range the relationship
depicted almost certainly will not be correct.
(b) Fixed costs are likely to change at different activity level. A stepped fixed cost line is
probably the most accurate representation.
(c) Variable costs and sales are unlikely to be linear. Extra discounts, overtime
payments, the effect of the learning curve, special price contracts and other similar
matters make it likely that the variable cost and revenue lines are some form of curve
rather than a straight line.
(d) The charts depict relationships which are essentially short term. This makes them
inappropriate where the time scale spans several years.
(e) CVP analysis, like marginal costing, makes the assumptions that changes in the level
of output are the sole determinant of cost and revenue changes. This is likely to be a
gross over-simplification in practice although volume changes, of course, do have a
significant effect on costs and revenues.
(f) It is assumed that there is a single product or a constant mix of products or a constant
rate of mark-up on marginal cost.
(g) Risk and uncertainty are ignored and perfect knowledge of cost and revenue functions
is assumed.
(h) It is assumed that the firm is a price taker, ie. a perfect market is deemed to exist.
(i) It is assumed that revenues and all forms of variable cost (materials, labour and all the
components of variable overheads) vary in accordance with the same activity
indicator. This is an oversimplification in most realistic situations.

93
UNIT 11
RELEVANT COSTING AND DECISION MAKING
After studying this topic, you should be able to:
Outline the decision making process
Describe the concept of relevant costing
Distinguish between relevant costs and irrelevant costs
State the rule for identifying relevant costs for materials, labour and equipment.
THE DECISION MAKING PROCESS
In general the decision making process can be described in six (6) major steps, namely:
Step 1: Identifying objectives
The organization‟s goals or objectives must be defined in order to ensure that managers are able
to assess which of the courses of action available is the most appropriate for the organization.
The objectives of many profit-making organizations include the maximization of profit and so
the decision option chosen needs to reflect this goal.
Non-profit making organizations such as charities are likely to have an objective based on
providing the most effective services with the resources available and so on.
Step 2: Search for alternative courses of action
There is need to find a number of possible courses of action that will enable the objectives to be
achieved. A profit-making organization might need to consider one of the following options:
Developing new products to sell in the existing markets
Developing new products to sell in new markets
Developing new markets in which to sell existing products
Step 3: Collect data about the alternative courses of action
The type of data that needs collecting will depend on the type of decision. If the decision is
concerned with the long-term future of the organization, the management accountant will need to
collect data about the environment in which the organization operates and about the
organization‟s capabilities.
If the decision is more concerned with the short- term future of the organization (such as
deciding on the selling price for a product), data on the selling price of competitors‟ products
will have to be collected.
Step 4: Select the appropriate course of action
The course of action which best satisfies the organization‟s objectives should be selected.

94
Step 5: Implement the decision
The decision chosen should be implemented. Suppose an organization has decided that it should
raise the price of product M by K4 000 from K45 000 per unit to K49 000 per unit. The price
will be raised and the sales budget will then be prepared on the basis of a selling price of
K49 000.
Step 6: Compare actual and planned outcomes and take any necessary corrective action if the
planned results have not been achieved
The final stage in the process involves comparing actual results with planned and taking control
action required.
RELEVANT AND NON-RELEVANT COSTS
The costs which should be used for decision making are often referred to as relevant costs.
Relevant costs – These are costs appropriate to a specific management decision. These are
represented by future cash flows whose magnitude will vary depending upon the outcome of the
management decision made.
A relevant cost is a future, incremental cash flow.
(a) Relevant costs are future costs.
A decision is about the future, it cannot alter what has been done already. In this case a
cost that has already been incurred in the past is totally irrelevant to any decision that is
being made now. Such costs are past costs or sunk costs.
Costs that have already been incurred include not only costs that have already been paid
but also costs that are the subject of legally binding contracts, even if payments due under
the contract have not yet been made. These are known as „Committed costs‟.
(b) Relevant costs are Cash flows. This means that costs or charges such as the following,
which do not reflect additional cash spending, should be ignored for the purpose of
decision making.
Depreciation, as a fixed overhead incurred.
Notional rent or interest, as a fixed overhead incurred.
All overheads absorbed. Fixed overhead absorption is always irrelevant since it is
overheads to be incurred which affect decisions.
(c) Relevant costs are incremental costs.

95
DIFFERENTIAL COSTS, AVOIDABLE COSTS AND OPPORTUNITY COSTS
Other terms are used to describe relevant costs:
(a) Differential costs – Differential costs or Incremental costs are defined as “the difference
in total cost between alternatives; calculated to assist decision-making”.
Differential costs are relevant costs which are simply the additional costs incurred as a
consequence of a decision.
(b) Avoidable costs – Avoidable costs are defined as “the specific costs of an activity or
sector of a business which would be avoided if that activity or sector did not exist”.
Avoidable costs is a term usually associated with shutdown or disinvestment decisions,
but it can also be applied to control decisions.
(c) Opportunity cost – “This is the value of a benefit sacrificed when one course of action is
chosen, in preference to an alternative. The opportunity cost is represented by the
forgone potential benefit from the best rejected course of action”.
Opportunity cost is a useful concept when there are a number of possible uses for a scarce
resource.
Question: Relevant costs
An information technology consultancy firm has been asked to do an urgent job by a client, for
which a price of K2 500 00 has been offered. The job would require the following:
(a) 30 hours of work from one member of staff who is paid on an hourly basis, at a rate of
K20 per hour, but who would normally be employed on work for clients where the
charge-out rate is K45 per hour. No other member of staff is able to do the member of
staff in question‟s work.
(b) The use of 5 hours of mainframe computer time, which the firm normally charges out to
external users at a rate of K50 per hour. Mainframe computer time is currently used 24
hours a day, 7 days a week.
(c) Supplies and incidental expenses of K200 000.
Required
From the above details, Calculate the relevant cost or opportunity cost of the job.
Non Relevant costs
A number of terms are used to describe costs that are irrelevant for decision making because they
are either not future cash flows or they are costs which will be incurred anyway, regardless of the
decision that is taken.

96
Sunk costs
A sunk cost is “a past cost not directly relevant in decision-making”.
Committed costs
A committed cost is a future cash outflow that will be incurred anyway, whatever decision is
taken now about alternative opportunities. Committed costs may exist because of contracts
already entered into by the organization, which it cannot now avoid.
Notional costs
A notional cost is a cost used in product evaluation, decision-making and performance
measurement to represent the cost of using resources which have no conventional „actual cost‟.
Examples of notional costs in cost accounting systems:
(a) Notional rent, such as that charged to a subsidiary, cost centre or profit centre of an
organization for the use of accommodation which the organization owns.
(b) Notional interest charges on capital employed, sometimes made against profit centre or
cost centre.
Historical costs
Although historical costs are irrelevant for decision making, historical cost data will often
provide the best available basis for predicting future costs.
Fixed costs and Variable costs
Unless you are given an indication to the contrary, one should assume the following:
Variable costs will be relevant costs
Fixed costs are irrelevant to a decision
This need not be the fixed assumption, however, and one should analyze variable costs and fixed
costs data carefully. Do not forget that fixed costs may only be fixed in the short term.
Attributable fixed costs
It is important to note that there might be occasions when a fixed cost is a relevant cost and one
must be aware of the distinction between „specific‟ or „directly attributable‟ fixed costs and
general overheads.
(a) Directly attributable fixed costs are those costs which, although fixed within a relevant
range of activity level are relevant to a decision for either of the following reasons:
(i) They would increase if certain extra activities were undertaken. For example, it
may be necessary to employ an extra supervisor if a particular order is accepted.
The extra salary would be an attributable fixed cost.

97
(ii) They would decrease or be eliminated entirely if a decision were taken either to
reduce the scale of operations or shut down entirely.
(b) General fixed overheads are those fixed overheads which will be unaffected by decisions
to increase or decrease the scale of operations, perhaps because they are an apportioned
share of the fixed costs of items which would be completely unaffected by the decisions.
An apportioned share of head office charges is an example of general fixed overheads for
a local office or department. General fixed overheads are not relevant in decision
making.
Fixed costs are assumed to be irrelevant in decision making (unless giving an indication
to the contrary).
RULES FOR IDENTIFYIN RELEVANT COSTS
General principles for identifying relevant costs of the following cost elements will now
be dealt with and these are:
The relevant costs of materials
Relevant costs of labour
Relevant cost of machines
RELEVANT COSTS OF MATERIALS
The relevant cost of raw materials is generally their current replacement costs, unless the
materials have already been purchased and would not be replaced once used. In this case the
relevant cost of using the materials is the higher of:
The current resale value; and
The value they would obtain if they were put to alternative use.
If the materials have no resale value and no alternative use, the relevant cost of using the material
for the opportunity under consideration is nil.
Example: Material costs
A new contract requires the use of 50 kg of material XY. This metal is used regularly on the
firm‟s projects. There are 100 kgs in stock at the moment which were bought for K20 000 per
kg. The current purchase price is K21 000 per keg and the material could be scrapped off for net
scrap proceeds of K15 000 per keg.
Assess the relevant cost of materials for each of the cases below:
Case 1:
Based on the details given above, what would be the relevant cost of the material?

98
Solution
As the company would have to replace the 50 kgs of material XY, the relevant cost is the
replacement cost for the materials, which is:
50 kgs x K21 000 = K1 050 000.
Case 2:
Suppose material XY that is in stock has no other use, what is the relevant cost for the material?
Solution
The relevant cost is the opportunity cost of selling the material which is:
50 kg x K15 000 per kg = K750 000.
Case 3:
Suppose there is no alternative use for material XY and that only 25kgs of the material is in
stock, Calculate the amount of relevant cost.
Solution
The amount of relevant cost would be calculated as follows:
K000
Materials in stock
(25kgs x K15 000) Disposal value 375
Materials to be bought
(25 kgs x K21 000) 525
Relevant costs for materials 900
Case 4:
Suppose material XY is in stock but it has no alternative use and has no disposal value, what
would be the relevant costs in this case?
Solution
The relevant cost would be nil in this case.
THE RELEVANT COSTS OF LABOUR
In determining the relevant costs of labour, there is need to determine whether spare capacity
exists. In this respect, the following guidelines can be applied:
If there is spare capacity, and employment terms are such that labour is a fixed cost, the
relevant cost will be nil.
If there is no spare capacity, therefore, two possibilities exist which are as follows:
(i) If extra labour comes from hired labour, then the hire charge becomes the
relevant cost

99
(ii) If the extra labour is taken from another activity that earns a contribution for the
company, then the relevant cost becomes the paid labour cost and the lost
contribution from that other activity.
Example: Labour costs
Zibu Ltd is currently deciding whether to undertake a new contract that will require 15 hours of
labour time. The standard cost per each product is as follows:
K000
Direct materials (10 kg @ K2 000) 20
Direct labour (5 Hours @ K6 000) 30
Other Variable costs 50
Total variable costs 100
Less: Selling prince 122
Contribution 22
Required
Assess the relevant costs in each of the following scenarios.
Case 1:
The company has no spare capacity and therefore decides to hire labour from outside. Calculate
the relevant cost for this option.
Solution
The relevant cost for the new product will be:
15 labour hours @ K6 000 per hour = K90 000.
Case 2:
Assuming the company has 5 hours spare capacity, calculate the amount of relevant costs.
Solution
The amount of relevant costs will be as follows:
K000
Direct labour (10 hours @ K6 000) 60
Opportunity cost (5 hours @ 0 per hour) 00
Relevant costs for labour 60
Case 3:
Assuming that Zibu Ltd withdraws the required labour hours from a current activity which earns
a standard contribution. Calculate the relevant cost for labour.

100
Solution
The relevant cost of labour would be:
K000
Direct labour (15 hours @ K6 000) 90
Opportunity cost (K22/5 x 15 Hours) 66
Relevant costs of labour 156
RELEVANT COSTS OF MACHINERY
Only the following incremental costs of using machines should be considered:
Repair costs arising from use of machinery
Hire charges for machines
Any fall in the resale value of owned assets which results from their use
Depreciation is not a relevant cost.
Example: Relevant costs of machinery
A machine which originally cost K12 million with an estimated economic life of ten years
and is depreciated at a rate of K1.2 million per year. It has been unused for sometime and
there are no production orders.
A special order has now been received which would require the use of the machinery for two
months.
The current net realizable value of the machine is K8 million. If the machine is used for the
job, its value is expected to fall to K7.5 million. The net book value of the machine is K8.4
million.
Routine maintenance of the machine currently cost K400 000 per month. With use, the cost
of maintenance and repairs would increase to K600 000.
Required
Calculate the relevant cost of using the machine for the order.
Solution
The relevant cost of using the machine for the order will be as follows:
K000
Fall in value of machine
(K8 million – K7.5 million) 500
Maintenance costs
(K600 000 – K400 000) x 2 400
Relevant cost of using machine 900

101
REVIEW QUESTIONS
1 Mention and briefly explain the six (6) steps involved in the Decision making process.
2 Give and explain the main characteristics of relevant costs.
3 Give example of irrelevant costs.
4 Under what circumstances are labour costs and material costs irrelevant though they may
be variable?
5 Under what circumstances are fixed costs relevant in decision making?

102
UNIT 12
SHORT TERM DECISIONS
Learning Outcomes
After studying this lecture, students should be able to:
Identify the optimal production solution when there is a limiting factor;
Solve the Make or Buy decisions when there is one limiting factor;
Apply the concept of Relevant Costing to business decisions;
Use relevant costing concepts to solve Special Order Pricing problems;
Use the Relevant Costing concepts to decide upon closure of business segment (unit).
LIMITING FACTOR PROBLEMS
Although sales demand is a factor that often stops a company from increasing its profits, there
are other factors in which some resources could be in short supply making it impossible for a
company to increase its profits.
A scarce resource is an item in short supply. In the context of decision making in business, it is a
resource in short supply and as a consequence of which the organization is limited in its ability to
provide and sell more products or services. Such scarce resources are also called limiting
factors.
Examples of scarce resources include the following:
Shortage of demand for goods and services being supplied;
A limit on the availability of a key item of raw materials or a key component;
A limit on the availability of a key type of labour such as skilled labour;
A limit on the availability of machine time and so on.
Decision approach
When a business has a limiting factor, a decision must be taken about how the available
resources should be handled and more importantly, how the unavailable resource should be
handled.
Approach to dealing with scarce resources/limiting factors
In an effort to deal with problems of limiting factors, the following approach should be followed:
Identify the scarce resources;
Calculate contribution per unit of the scarce resource;
Calculate the units of the scarce resources used by each product;
Rank the products according to the contribution per unit of the limiting factor;

103
Then allocate resources according to the ranking.
Question
Zaza Ltd makes two products which use the same type of materials and grades of labour but in
different quantities as shown below:
Product M Product N
Labour Hours per unit 2 4
Materials – Kgs per unit 5 2
Demand (sales demand – units) 500 250
Sales price per unit K30 000 K36 000
During each week the maximum number of labour hours available is 1 800 and the quantity of
materials available is limited to 3 000 kgs. The labour rate is at K5 000 per hour and materials
cost K2 000 per kg.
Required
From the above details, advise Zaza Ltd on a recommended profit maximization plan.
MAKE OR BUY DECISIONS
This type of decision involves a decision by an organization about whether it should make a
product or whether it should pay for the same product being made by another organization.
Examples of make or buy decisions are as follows:
(a) Whether a company should manufacture its own components or buy components from
another outside supplier.
(b) Whether a company should have its own service department such as a cleaning
department or whether it should subcontract the activity to an external cleaning company.
Normally there are two situations in which the make or buy decisions may arise and these are:
A business currently manufactures its own products or components and an external
supplier offers to make them instead. The choice is simply whether to make the item in
house or whether to buy them externally.
Alternatively, a company may be faced with a short fall in its own in-house capabilities
leading to a need to sub contract some work to make up for the shortfall. In such a
situation, the business might have to decide not only whether it should buy some units
externally but which items should be purchased as well in order to maximize profit.

104
Question
Muleta Ltd manufactures three (3) components used in its finished product. The component
workshop is currently unable to meet the demand for components and the possibility of sub-
contracting part of the requirement is being investigated on the basis of the following
information:
Component Component Component
A B C
K000 K000 K000
Variable production costs 3.00 4.00 7.00
Purchase price 2.50 6.00 13.00
Excess of cost per unit (0.50) 2.00 6.00
Machine hours per unit 1 0.50 2
Labour hours per unit 2 2 4
Required
You are required:
(a) To decide which component should be bought out if the company is operating at full
capacity;
(b) To decide which component should be bought out if production is limited to 4 000
machine hours per week;
(c) To decide which component should be bought out if production is limited to 4 000 labour
hours per week.
OTHER CONSIDERATIONS AFFECTING THE DECISION
Management would need to consider other factors before reaching a make or buy decisions.
Some would be quantifiable and others would not be:
Continuity and control of supply
Can the outside company be relied upon to meet requirements in terms of quantity,
quality, delivery dates and price stability?
Alternative use of resources
Can the resources used to make this article be transferred to another activity which will
save costs or increase revenue?
Social and legal aspects
Will the decision affect contractual or ethical obligations to employees or business
connections?

105
Make or Buy with Limiting Factor
In cases where a company cannot meet orders because it has exhausted all available capacity, it
may have to subcontract some of the work in order to meet the shortfall in the short term. The
short term decision faced by the company is to decide on which work should be subcontracted
and which one should be done in house.
In the long term, management may need to look to such alternatives as capital expenditure.
Decision rule
The decision would be made after ranking the products according to extra purchasing costs per
unit of the limiting factor.
In this respect, products with higher extra costs of buying should be made in house.
Question
James Ltd manufactures three components namely: X, Y and Z used in its finished product. The
component workshop is operating at full capacity and is not able to meet the current demand for
the component. An external supplier has offered to supply the components at a unit price of K2
500, K6 000 and K13 000 respectively. The variable costs per product and machine
requirements are as follows:
Component X Component Y Component Z
Variable costs K3 000 K4 000 K7 000
Machine hours 2 2 4
Required
From the above details, compute to determine the order in which products should be bought from
the external supplier.
CLOSURE OF BUSINESS SEGMENT/UNIT
Where part of a business seems to be performing in an unprofitable manner, a company is faced
with a decision as to whether to allow such a segment to continue in business operations or to
shut it down and concentrate on profitable entities. Such a segment may be a product, a
department, or channel of distribution.
In evaluating the closure, the accountant should evaluate the following factors:
Loss of contribution from the segment;
Savings in specific fixed costs;
Penalties such as redundancy, compensation to customers;

106
Alternative uses of resources released.
Question
Kaira Ltd comprises three departments namely: kitchenware, garden tools and plumbing
equipment. The company is concerned about the poor performance and is considering whether
or not to close down the plumbing tools section.
Estimated results for the store are as follows:
Kitchenware Garden tools Plumbing tools Total
Kmillion Kmillion Kmillion Kmillion
Sales 400 600 200 1 200
Direct cost of sales 200 360 150 710
Departmental costs 50 100 30 180
Apportioned store costs 50 50 50 150
Total costs 300 510 230 1 040
Profit/(Loss) 100 90 (30) 160
Required
Assuming that the company cannot raise prices, advise whether the section on plumbing tools
should be closed and comment on any other factors which should be considered in making this
decision.
ONE-OFF CONTRACT
This is a decision making situation where a company which is operating at below full capacity is
approached by a customer who is offering a price lower than the normal price.
The relevant costs to consider in this case are the variable manufacturing costs and if the price
being offered covers the variable costs, the company should accept the contract.
Question
Delano Ltd makes a single product which sells for K20 000, it has a full cost of K15 000 which
is made up as follows:
K000
Direct material 4
Direct labour (2 hours) 6
Variable overhead 2
General overhead 3
Total costs 15

107
The labour force is currently working at 90% of capacity and so there is capacity for 2 500 units.
A customer has approached the company with a request for the manufacture of a special order of
2 000 units for which he is willing to pay K26 million.
Required
From the above details, assess whether the order should be accepted or not.
PRICING DECISIONS
After studying this unit, students should be able to:
Explain other factors affecting the price of a product or service;
Calculate prices using full cost and marginal cost methods;
Discuss the advantages and disadvantages of the different pricing methods;
Discuss and analyze suitable pricing strategies for specific business situations.
Factors influencing the price of a product/service
Effective pricing decisions should be based on a careful consideration of the following factors:
Organizational goals-like any other decision making process, consideration of the
organization objective is the first step in setting suitable prices. For example an
organization whose objective is to maximize cash generation should set prices that reflect
this goal.
Product mix-an organization which produces and sells a range of products should set the
prices for each product within the mix in a manner that maximizes cash flow generated
from the whole mix.
Price\demand relationship- for most products, at higher prices the demand for the
product is low and as the price is reduced the quantity demanded increases. It is thus
important that a price setter should have the knowledge of price\demand relationship for
his product.
A knowledge of the price elasticity of demand-price elasticity of demand refers to the
responsiveness of changes in demand to changes in prices. The concept of price elasticity
is important when an organization tends to adjust the current price. They should know
what the likely impact would be on demand.
Competitors and market-when setting selling prices it is always important to consider
the possible reaction from competitors.
Product life cycle-each product goes through a life cycle which includes introduction,
growth, maturity, saturation and decline phases. The price must be set with reference to
the stage the product has reached in the cycle.
Marketing strategy- selling prices should be set with reference to the overall marketing
strategy. For example, a company whose marketing strategy emphasizes heavy
advertising can afford to charge higher prices.

108
Costs-in the long run, all operating costs must be fully covered by the sale revenue.
Factors affecting demand in the market as a whole include:
The price of the good
The price of other goods
The size and distribution of household income
Expectation
Obsolescence
Quality of the product
Tastes and fashions
FULL COST-PLUS PRICING
This is a method of determining the sales price by calculating the full cost of the product and
then adding a percentage mark-up for profit. The full cost may be fully absorbed production cost
only or it may include some absorbed administration, selling and distribution overheads.
The pricing method is common in industries that carry out contract or jobbing work for which
quotations are regularly prepared for individual jobs or contracts. The percentage profit is
predetermined by the organization. However, the profit markup should not be rigid and fixed.
In other words, it should be varied in order to suit different business environmental
circumstances.
Question
Luka Ltd has begun to produce a new product called the widget for which the following cost
estimates have been determined:
K000
Direct materials 27
Direct labour (5 hours @ K6 000) 30
Variable production overheads (5 hours @ K2 500) 25
Total variable cost 82
Production fixed overheads are budgeted at K30 million per month and budgeted direct labour
hours are 25 000 per month. The absorption rate will be based on labour hours. The company
wishes to make a profit of 20% on full production cost from product widget.
Required
From the above details, determine the full cost-plus based price for product widget.

109
Advantages of full cost-plus pricing
It is a quick, simple and cheap method of pricing;
It gives a price which ensures that all costs are covered;
It is the normal method of pricing for most organizations to cover cost.
Disadvantages of full cost-plus pricing
It causes problems of finding a suitable overhead absorption basis;
Budgeted output volume needs to be established as it is a key factor in the deriving of
overhead absorption rate;
It does not consider market and demand condition;
It ignores the existence of a profit maximizing price.
MARGINAL COST-PLUS PRICING
Marginal cost-plus pricing is a method of determining the sales price by adding a profit margin
on to either marginal cost of production or marginal cost of sales.
Question
A product has the following costs and details:
K000
Direct materials 5
Direct labour 3
Variable production overhead 7
Total variable cost 15
Fixed overheads are K10 million per month. Budgeted sales are 400 units to allow the product to
break even.
Required
Determine the profit margin which needs to be added to marginal costs in order to allow the
product to break even.
Advantages of marginal cost-plus pricing
It is a simple and easy method to use;
It draws management attention to contribution, a concept which is important to decision
making.
Disadvantages of marginal cost-plus pricing
It does not pay sufficient attention to demand conditions, competitors prices and profit
maximization;
It ignores fixed overheads in the pricing decisions, but pricing decisions must be
sufficiently high to ensure that a profit is made after covering fixed costs;
110
The method fails to cover all costs of producing a product or providing a service.
OTHER PRICING POLICIES
Special orders
A special order is a one-off revenue earning opportunity. The basic approach in such a situation
is to determine the price at which the company breaks even or the minimum price it would
charge. This is the price at which the company covers the incremental costs of producing and
selling the product and the opportunity costs of the resources consumed.
Market penetration pricing
Market penetration pricing is a policy of low prices when the product is first launched in order to
obtain sufficient penetration into the market. Penetration prices aim to secure a substantial total
market.
Circumstances in which the penetration policy may be appropriate include the following:
Where a firm wishes to discourage new entrants into the market;
Where there are significant economies of scale to be achieved from high volume of
output;
Where demand is highly elastic and so would respond well to low prices;
Where there is much competitiveness.
Market skimming pricing
Market pricing involves charging high prices when a product is first launched and spending
heavily on advertising and sales promotion in order to obtain expected levels of sales.
The aim of market skimming is to gain high unit profits early in the product‟s life. High unit
prices make it more likely that competitors will enter the market than if lower prices were
charged.
Circumstances in which market skimming policy may be appropriate include the following:
Where the product is new and different, so that customers are prepared to pay high prices;
Where the strength of demand and the sensitivity of demand is unknown;
Where the product has a shorter life cycle and so there is need to recover the development
costs and make profit in a quick and timely manner.

111
FURTHER PROCESSING COST DECISIONS
Dealing with Common costs: Sales value minus further processing costs
Joint products may have no known market value at the point of separation, because they need
further separate processing to make them ready for sale. The allocation of common product
costs should be accomplished as follows:
(a) Ideally, by determining a relative sales value at the split of point for each product.
(b) If a relative sales value cannot be found, a residual sales value at the split off point can be
determined.
Take the final sales value of each joint product
Deduct the further processing costs for each product
This residual sales value is sometimes referred to as the notional or proxy sales value of a
joint product.
Question: Sales value minus further processing costs
Jairo Ltd has factory where four products are originated in a common process.
During period 4, the costs of the common process were K16 000. Output was as follows:
Sales value
Units made Units sold per unit
Product P1 600
Product Q1 400
Product R 500 400 K7
Product S 600 450 K10
Products P1 and Q1 are further processed, separately, to make end-products P2 and Q2.
Cost of
Units further Sales value
Processed Units sold processing per unit
Product P1/P2 600 600 K1 000 K10 (P2)
Product Q1/Q2 400 300 K2 500 K20 (Q2)
Required
Calculate the costs of each joint product and the profit from each of them in period 4. There
were no opening stocks.
Dealing with common costs: Weighted Average method
The weighted average method of common cost apportionment is a development of the units
method of apportionment. Since units of joint products may not be comparable in physical

112
resemblance of physical weight (they may be gases, liquids or solids) units of each joint product
may be multiplied by a weighting factor and weighted units would provide a basis for
apportioning the common costs.
Question
Monje Ltd manufactures four products which emerge from a joint processing operation. In
April, the costs of the joint production process were as follows:
K
Direct materials 24 000
Direct labour 2 000
26 000
Production overheads are added using an absorption rate of 400% of direct labour costs. Output
from the process during April was as follows:
Joint product Output
D 600 litres
W 400 litres
F 400 kgs
G 500 kgs
Units of output of D, W, F, and G and to be given weightings of 3, 5, 8 and 3 respectively for
apportioning common costs.
Required
From the above details, apportion the joint costs.
The further processing decision
A different type of decision making problem with joint products occurs when there is a choice
between selling part-finished output or processing it further. This decision problem is best
explained through some computations.
Question
Alice Ltd manufactures two joint products, namely A and B. The costs of common processing re
K15 000 per batch and output per batch is 100 units of A and 150 units of B. The sales value of
A at split-off point is K90 per unit and the sales value of B is K60 per unit.

113
An opportunity exists to process products A further, at an extra cost of K2 000 per batch, to
produce product C. One unit of joint product A is sufficient to make one unit of C which has a
sales value of K120 per unit.
Required
Should the company, Alice Ltd sell product A, or should it process A and sell product C?

114
UNIT 13
BUDGETING AND BUDGETARY CONTROL
WHY PLAN FOR THE FUTURE?
Given the increasing complexity of business and the ever changing environment faced by the
various firms (social, economical, technological and political) it is doubtful whether any firm can
survive by simply continuing to do what is has always done in the past.
On the basis of the above, if a firm wishes to earn satisfactory levels of profit in the future, that
firm must plan its course of action.
Corporate planning- Corporate planning is essentially a long run activity which seek to
determine the direction in which the firm should be moving in the future.
The firm must ask the question: where do we see ourselves in ten years time?
In this way the firm must consider the following issues:
a) What it wants to achieve (the objectives)
b) How it intends to get there (the strategy)
c) What resources will be required (operations plans)
d) How well it is doing in comparison to the plan (control)
Objectives are simply statements of what the firm wishes to achieve.
Traditionally it was assumed that all firms were only interested in the maximization of profit (or
the wealth of their shareholders). Nowadays it is recognized that for many firms profit is but one
of the many objectives pursued. Some of the objectives include:
a) Maximization of sales (whilst earning a moderate level of profit)
b) Growth (in sales, assets value, number of employees etc)
c) Survival
d) Research and development leadership
e) Quality of service
f) Contented workforce
g) Respect for the environment
Strategy – strategy is the overall approach that the company will adopt in order to meet its
objectives.
Operating plans – while strategic plans are essentially long term, operating plans are the short
term tactics of the organization.

115
Control – it is not enough to merely make plans and implement them. Control is the comparison
of the results of the plans and the stated objectives in order to asses the firm‟s performance, and
the taking of action to remedy any negative differences in performance.
OVERVIEW OF THE PLANNING PROCESS
The overall planning process has the following seven (7) stages:
a) Identify objectives
b) Search for possible courses of action
c) Gathering data about alternatives and measuring pay offs
d) Select course of action
e) Implementation of long term plans
f) Monitor actual outcomes and
g) Respond to divergences from plans
OBJECTIVES OF BUDGETING
A budget may be repaired for the business as whole, for departments, for functions such as sales
and production or for financial and resource items such as cash, capital, expenditure, manpower
and purchases.
The key objectives of a budgeting process are:
i. Communication
ii. Control
iii. Coordination
iv. Planning
v. Motivation
vi. Performance evaluation
vii. Resource allocation.

116
OBJECTIVES COMMENT
Planning Annual budgeting gives management an opportunity to prepare detailed
plans which are required to implement the corporate strategic plans.
Coordination the budget serves as a vehicle through which actions of the different
parts of an organization are brought together and reconciled into a
common plan. Without a budget managers may be making conflicting
decisions.
Communication through the budget, management communicates its expectations to
other staff so that all members of the organization may understand these
expectations. Additionally it is not just the budget itself that facilitates
communication; there is a lot of exchange of vital information during
the planning process itself.
Motivation the interest and commitment of employees can be retained via a system
of feedback of actual results which lets them know how well or badly
they are performing.
Control a budget is a yardstick against which actual performance is measured
and assed. Control is provided by comparing the actual with the budget
after corrective actions are taken to eliminate the variances.
Performance evaluations A manager‟s performance is often evaluated by measuring his/her
success in meeting the budget. The budget provides a useful means of
informing managers of how well they are performing in meeting targets
that they previously helped in setting.
Resources Allocation Budgets are used to allocate resources to various sections of an
organization.
HOW BUDGETS ARE PREPARED
Budget centre
A budget centre is a clearly defined part of an organization for which a bidget is prepared for
budgetary control purposes.
Budget period

117
The budget period is the period for which a budget is prepared and used, which may be
subdivided into shorter control periods.
Budget committee
A budget committee comprises of the Chief Executive, the management accountant who is a
budget officer and functional heads. The functions of the committee include the following:
a) Coordinate budget preparations
b) Issue timetables for budget preparation
c) Allocate responsibilities for the preparation of functional budgets
d) Provide information for the preparations of budgets
e) Suggest amendments to the budgets
f) Approve budgets after amendments
g) Assess the budgeting and planning.
Budget Manual
The budget manual is a collection of instructions governing the responsibilities of persons and
the procedures, forms and records relating to the preparation and use of budgetary data.
BUDGET PREPARATION PROCESS
The budget preparation process is as follows:
a) Communicating details of the budget policy and budget guidelines
b) Determining the factor that restricts output;
c) Preparation of the sales budgets;
d) Preparation of functional budgets;
e) Negotiations of budgets with superiors (Board of Directors);
f) Coordination and review of budgets;
g) Final acceptance of budgets and
h) Budget review.
PREPARATION OF FUNCTIONAL BUDGETS
Based on the sales budget, the following functional budgets can be prepared:
- Finished goods stock budget;
- Production budget;
- Material utilization budget;
- Machine utilization budget;
- Labour budget;
- Raw material purchases budget;
- Overhead cost budget.

118
PREPARATION OF FUNCTIONAL AND CASH BUDGETS
The principal advantages of budgeting include:
a) Planning and coordination
b) Authorizing and Delegating
c) Evaluation performance
d) Discerning trends
e) Communication and motivating
f) Control.
THE CONCEPT OF BUDGETING
A Budget is defined as plan quantified in monetary terms, prepared and approved prior to a
defined period of time, usually showing planned income to be generated and/or expenditure to be
incurred during that period and the capital to be employed to attain a given objective.
Budgeting may be regarded as predictive accounting. A budget may stand on its own, but is more
useful if it is part of a control system. A control system is designed to control an operation so as
to achieve desired objectives.
Budgetary control – A budgetary control system is defined as the establishments of budgets
relating the responsibilities of executives to the requirements of policy, and continuous
comparison of actual with budgeted results, either to secure by individual action the objectives of
that policy or to provide a basis for its revision.
STAGES IN THE BUDGETARY PROCESS
Stages in the budgetary process include the following:
a) Communicating policy guidelines to preparers of budgets – the long term plan forms
the framework within which the budget is prepared. It is therefore necessary to
communicate the implications of that plan to the persons who actually prepare the budget.
b) Determining the factor which restricts output – generally there will be one factor
which restricts performance for a given period. Usually this will be sales, but it could be
production capacity, or some special labour skills factor. This is called the principal
budget factor.
c) Preparation of the sales budget – on the assumption that sales is the principal budget
factor, the next stage is to prepare the sales budget. This budget is very much dependant
on forecast sales revenue. Various forecasting techniques may be used in this process e.g.
market research, sales personnel estimates, statistical, etc.
d) Initial preparation of budgets – ideally budgets should be prepared by managers
responsible for achieving the targets contained therein – participative budgeting. The role

119
of the finance specialists should be to assist in turning physical budget forecasts into
financial budgets.
e) Co-ordination and review of budgets – at this stage the various departmental budgets
are integrated into the complete budget system. Any anomalies between the budgets must
be resolved and the complete budget package subject to review. At this stage the budget
profit and loss account and cash flow must be prepared to ensure that the package
produces an acceptable result.
f) Final acceptance of budgets – all of the budgets are summarized into a master budget,
which is presented to top management for final acceptance.
g) Budget review – the budget process involves regular comparison of budget with actual
performance, and identifying causes of the variances. This may involve modify the
budget as the period progresses – planning changes.
PREPARATION OF FUNCTIONAL BUDGETS
The following information will be used in the illustration of functional budgets.
QUESTION
Mataka enterprise manufactures two products known as Alpha and Sigma. Alpha is
manufactured in department 1 while Sigma is manufactured in department 2. The following
information is available for the year 20x7:
Mataka Enterprise
Balance sheet As at 31 December 20x7
Fixed Assets K000 K000
Land 85 000
Building and Equipment 646 000
Less: Depreciation (127 500)
518 500
603 500
Current Assets
Stock – Finished goods 49 538
Stock – Raw materials 94 600
Debtors 144 500
Cash 17 000
305 638
Current Liabilities
Creditors (124 400)

120
Net current assets 181 238
784 738
Capital and Reserves
Ordinary shares of K1000 each 600 000
Reserves 184 738
784 738
Standard cost per unit – product Alpha
K
Material X: 10kg @ K180 per kg 1 800
Y: 5kg @ K400 per kg 2 000
Labour 10 Hrs @ K300 per hr 3 000
Variable production overhead:
Dept 1: 10 hrs @ K80 per hr 800
7 600
Standard cost per unit – product stigma
K
Material X: 8kg @ K180 per kg 1 440
Y: 9 kg @ K400 per kg 3 600
Labour 15hrs @ K300 per hr 4 500
Variable production overhead:
Dept 2: 15hrs @ K70 per hr 1 050
10 590
Other relevant information for the year 2008
Dept 1 Dept 2
Budgeted fixed overhead K14 280 000 K7 160 000
Finished Goods
Alpha Stigma
Forecast sales (units) 8 500 1 600
Selling price (per unit) K10 000 K14 000
Closing stocks (units) 1 870 90
Opening stocks (units) 170 85
Raw materials
Material X Material Y
Closing stocks (kg) 8 500 8 000
Opening stocks (kg) 10 200 1 700
Other fixed costs K13 800 000
121
REQUIRED
From the above details, you are required to prepare the following budgets:
a) Sales budget
b) Production budget
c) Raw materials budget
d) Labour budget
e) Overhead budget.
CASH BUDGET
A Cash Budget is a statement which helps management evaluate ahead of time, the sources of
cash and the areas where cash expenditures will be incurred. A Cash Budget therefore is a
decision tool to enable management have a vision of the cash inflows and the cash outflows in a
given future period of time.
Once management is afforded such information, they will be able to make relevant decision in as
far as management of cash resources is concerned. In as far as cash is concerned, there are four
(4) potential positions of the cash follows in an organization and these include the following:
Short term surplus cash;
Short term deficit of cash;
Long term surplus of cash and
Long term deficit of cash.
Management should foresee any potential outcome in cash flows in as far as budgeting is
concerned. On the basis of the above, management should evaluate the sources of cash and
evaluate the areas of cash out flows.
A standard cash budget will therefore capture the information in the following areas:
Sources of cash (Cash inflows) including the total of such cash resources;
Areas of cash outflows, including the total amounts of such outflows;
The difference between the Cash inflows and the cash out flows (which will normally be
either surplus or deficit)
The budget should also bring on board the opening cash balance from the immediate
previous period and this balance should be combined with the amount in the first
month/quarter or period to lead to the computation of the closing cash balance;
The closing cash balance of the previous period is the opening cash balance of the new
period and when combined also lead to the closing balance for the new (current) period.

122
On the basis of the above, the Cash budget shows the cash inflows and the cash outflows in a
given period for an organization.
QUESTION
James Zulu has worked for some years as a Sales Representative, but has recently been made
redundant by the company. He now intends to start up in business on his own account, using the
amount of K15 000 000 which he currently has invested with the Zambia National Building
Society. James Zulu maintains a bank account showing a small credit balance and he plans to
approach his bank for the necessary additional finance.
James provides you with the following additional information:
(a) Arrangements have been made to purchase fixed assets costing K8 000 000. These assets
will be paid for at the end of the month of September and are expected to have a five (5)
year life, at the end of which they will possess a nil residual value.
(b) Stocks costing K5 000 000 will also be acquired on 28 September and subsequent
monthly purchases will be at a level sufficient to replace forecast sales for the month.
(c) Forecast monthly sales are K3 000 000 for the month of October, K6 000 000 for the
month of November and December and K10 500 000 from January 20X11 onwards.
(d) Selling price is fixed at the cost of stock plus 50%.
(e) Two months‟ credit period will be allowed to customers (debtors) but only one month‟s
credit will be received from suppliers of stock.
(f) Running Expenses, including rent but excluding depreciation of fixed assets are estimated
at K1 600 000 per month.
(g) Mr Zulu intends to make monthly drawings amounting to K1 000 000.
REQUIRED
(a) From the above details, prepare a Cash Budget for the six (6) months to 31 March 20X11.
(b) Prepare an Income Statement for the six (6) months period to 31 March 20X11.
(c) Prepare a Statement of Financial position (Balance Sheet) for the six (6) months period to
31 March 20X11.

123
Potential sources of cash resources
Cash sales;
Collections of cash from debtors;
Disposal of fixed assets (once off);
Receiving interests from investments;
Receiving dividends from investments;
Cash from bank overdrafts;
Cash from bank loans;
Cash from issue of shares and debentures;
Cash from provision of other services etc.
Potential areas of cash outflows
Cash purchases of goods/services;
Cash payments to creditors;
Purchase of fixed assets;
Cash payments to Tax authorities (ZRA);
Cash payments for salaries and wages;
Cash payments for other operational overheads;
Cash repayments for bank overdrafts;
Cash repayments for bank loans;
Cash repayments for the redemption of shares and debentures;
Cash payments for leasing facilities etc.
REVIEW QUESTIONS
1 Define the term „Budget‟;
2 List and explain the stages in the budget preparation process;
3 Explain the term „budgetary control‟;
4 List and explain the functions of a Budget committee;
5 List and explain the key objectives of a budgetary process.
6 What are the main contents in a Cash budget?
7 Identify the main uses of a Cash budget to management.

124
UNIT 14
FLEXIBLE BUDGETS
A Flexible Budget is one which, by recognizing the distinction between fixed and variable cost,
is designed to change in response to changes in output or;
A Flexible Budget is a budget which by recognizing different cost behavior patterns, is designed
to change as volume of output changes.
A Fixed Budget is a budget which is designed to remain unchanged regardless of the volume of
output or sales achieved.
Flexible budgets may be used in one of the two ways:
(a) At the Planning stage – For example, suppose that a company expects to sell 10 000
units of output during next year. A master budget (the fixed budget) would be prepared
on the basis of these expected volumes. However, if the company thinks that output and
sales might be as low as 8 000 units or as high as 12 000 units, it may prepare
contingency flexible budgets, at volumes of say 8 000, 9 000, 11 000 and 12 000 units
and then assess the possible outcomes.
(b) Retrospectively – At the end of each month (control period) or year, the results that
should have been achieved given the actual circumstances (the flexible budget) can be
compared with the actual results. Flexible budgets are an essential factor in budgetary
control.
The concept of responsibility accounting requires the use of flexible budgets for control
purposes. Many of the costs under a manager‟s control are variable and will therefore change if
the level of activity is different from that in the budget. It would be unreasonable to criticize a
manager for incurring higher costs if these were a result of a higher than planned volume of
activity. Conversely, if the level of activity is low, costs can be expected to fall and the original
budget must be amended to reflect this.
A variable report based on a flexible budget therefore compares actual costs with the costs
budgeted for the level of activity actually achieved. It does not explain any change in budgeted
volume, which should be reported on separately.
Flexible Budgeting
The key points to note in relation to this type of budget include the following:
(a) A fixed budget is set at the beginning of the period, based on estimated production and
output. This is the original budget system.
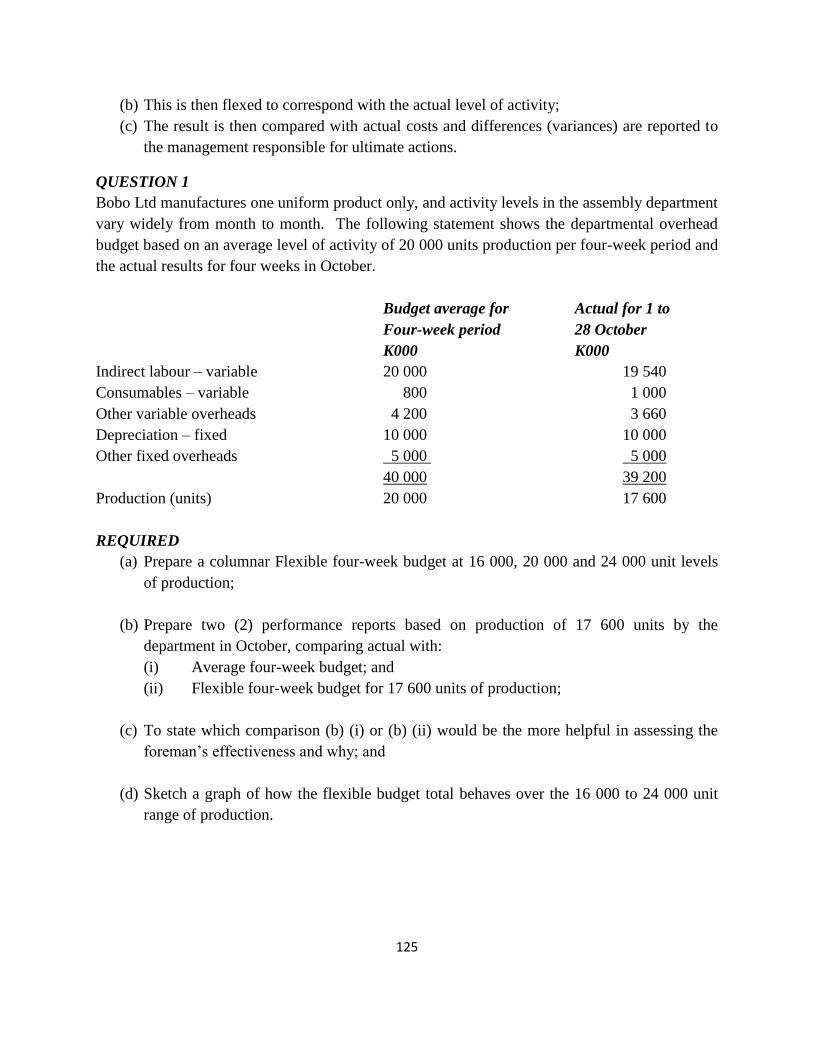
125
(b) This is then flexed to correspond with the actual level of activity;
(c) The result is then compared with actual costs and differences (variances) are reported to
the management responsible for ultimate actions.
QUESTION 1
Bobo Ltd manufactures one uniform product only, and activity levels in the assembly department
vary widely from month to month. The following statement shows the departmental overhead
budget based on an average level of activity of 20 000 units production per four-week period and
the actual results for four weeks in October.
Budget average for Actual for 1 to
Four-week period 28 October
K000 K000
Indirect labour – variable 20 000 19 540
Consumables – variable 800 1 000
Other variable overheads 4 200 3 660
Depreciation – fixed 10 000 10 000
Other fixed overheads 5 000 5 000
40 000 39 200
Production (units) 20 000 17 600
REQUIRED
(a) Prepare a columnar Flexible four-week budget at 16 000, 20 000 and 24 000 unit levels
of production;
(b) Prepare two (2) performance reports based on production of 17 600 units by the
department in October, comparing actual with:
(i) Average four-week budget; and
(ii) Flexible four-week budget for 17 600 units of production;
(c) To state which comparison (b) (i) or (b) (ii) would be the more helpful in assessing the
foreman‟s effectiveness and why; and
(d) Sketch a graph of how the flexible budget total behaves over the 16 000 to 24 000 unit
range of production.

126
QUESTION 2
(a) Prepare a Budget for the year 20X11 for the direct labour costs and overhead expenses of
a production department at the activity levels of 80%, 90% and 100%, using the
information listed below and ignoring inflation.
(i) The direct labour hourly rate is expected to be K3.75;
(ii) 100% activity represents 60 000 direct labour hours;
(iii) Variable indirect labour cost K0.75 per direct labour hour;
Variable consumable supplies cost K0.375 per direct labour hour;
Variable canteen cost 6% of direct and indirect labour costs
(iv) Semi-variable costs are expected to relate to the direct labour hours in the same
manner as for the last five (5) years. The consist of a fixed element of K8 000
and a variable element of K0.20 per hour.
(v) Fixed costs
K
Depreciation 18 000
Maintenance 10 000
Insurance 4 000
Rates 15 000
Management salaries 25 000
(b) Calculate the Budget cost allowance (ie. expected expenditure) or flexed budget for the
year 20X11 assuming that 57 000 direct labour hours are worked.
127
UNIT 15
ALTERNATIVE BUDGET SYSTEMS
There are a number of other budgeting systems and these include the following:-
(a) Incremental budgeting
(b) Zero based budgeting
(c) Continuous Budgets and
(d) Activity Based Budgeting
(e) Fixed Budget
(f) Flexible Budget
INCREMENTAL BUDGETING
Incremental budgeting is the traditional approach to budgeting and it involves basing next
year‟s budget on the current year‟s results plus an extra amount for estimated growth or
inflation next year.
The weakness of this budget is that the following year‟s figures are normally just estimates
without much reliable basis for such figures.
The Incremental budgeting is so called because it is concerned mainly with the increments in
costs and revenues which will occur in the coming period.
Incremental budgeting is a reasonable procedure is current operations are as effective,
efficient and economical as they can be. It is also appropriate for budgeting for costs such as
staff salaries, which may be estimated on the basis of current salaries plus an increment for
inflation and are therefore administratively easy to prepare.
Disadvantages of Incremental Budgeting
It is an inefficient form of budgeting
It encourages slack
It also encourages wasteful spending to creep into budgets
Past inefficiencies are perpetuated because cost levels are rarely to close analytical
scrutiny
The budget expenditure is not closely related to the anticipated performance levels
Discussion Question
Can Incremental budgeting be used to budget for rent? What about for advertising
expenditure?

128
ZERO BASED BUDGETING
Zero based budgeting (ZBB) involves preparing a budget for each cost centre from a zero
base. Every item of expenditure has then to be justified in its entirety in order to be included
in the next year‟s budget.
The principles of ZBB
ZBB rejects the assumption inherent in incremental budgeting that this year‟s activities will
continue at the same level or volume next year and that next year‟s budget can be based on
this year‟s costs plus an extra amount, perhaps for expansion and inflation.
Implementing Zero based Budgeting
The implementation of ZBB involves a number of steps but of greater importance is the
development of a questioning and analytical attitude by all individuals involved in the budget
preparation process.
In this respect, existing practices and expenditure must be challenged and searching questions
must be asked, which include the following:-
Does the activity need to be carried out?
What then would be the consequences if the activity was not undertaken?
Is the current level of provision current enough?
Are there alternative ways of providing the same function?
How much should the activity cost?
Is the expenditure worth the benefits to be achieved?
Steps to Zero based budgeting
Step 1: Define decision packages, comprehensive descriptions of specific organizational
activities which management can use to evaluate the activities and rank them in order of
priority against other activities. There are two types:
(a) Mutually exclusive packages contain alternative methods of getting the same job
done. In this respect, the best option among the packages must be selected by
comparing costs and benefits and the other packages are then discarded.
(b) Incremental packages divide one aspect of an activity into different levels of effort.
The base package will describe the minimum amount of work that must be done to
carry out the activity and the other package describe what additional work could be
done, at what cost and for what efforts.
Step 2: Evaluate and rank each activity (decision package) on the basis of its benefit to the
organization. This can be a lengthy process. Minimum work requirements (those that are

129
essential to get a job done) will be given high priority and so too will work which meets legal
obligations. In the accounting department these would be minimum requirements to operate
the payroll, purchase ledger and sales ledger systems and to maintain and publish a set of
accounts.
Step 3: Allocate resources in the budget according to the funds available and the evaluation
and ranking of the competing packages.
The Advantages of Zero based budgeting
It is possible to identify and remove inefficient or obsolete operations;
It forces employees to avoid wasteful expenditure;
It can increase motivation;
It responds to changes in the business environment;
ZBB documentation provides an in-depth appraisal of an organization‟s operations;
It challenges the status quo;
ZBB should result in a more efficient allocation of resources.
Disadvantages of Zero based budgeting
It demands for a large volume of paperwork;
Short-term benefits might be emphasized to the detriment of long term benefits;
It might give an impression that all decisions have to be made in the budget;
It may call for management skills both in constructing decision packages and in the
ranking process which the organization does not possess. Managers may have to be
trained in ZBB techniques;
The organization‟s information systems may not be capable of providing suitable
information;
The ranking process can be difficult.
Areas suitable for application of Zero based budgeting
It is applied to support expenses, that is expenditure incurred in departments
which exist to support the essential production function;
It is suitable for activities that are less quantifiable by conventional methods and
are more discretionary in nature;
ZBB can also be successfully applied to service industries and non-profit making
organizations such as Local Authorities and Government Ministries, Education,
Health etc.

130
CONTINUOUS OR ROLLING BUDGETS
A Continuous or Rolling budget is a budget which is continuously updated by adding a
further accounting period (a month, or quarter) when the earlier accounting period has or is
about to expire.
Dynamic conditions
Actual conditions may differ from those anticipated when the budget was drawn up for a
number of reasons:
(a) Organizational changes may occur.
(i) A change in structure, from a functional basis, say to a process based one;
(ii) New agreements with the workforce about flexible working or safety
procedures;
(iii) The re-allocation of responsibilities following say, the removal of tiers of
middle management and the empowerment of workers further down the line;
(b) Action may be needed to combat an initiative by a competitor;
(c) New technology may be introduced to help improve productivity, reduce labour
requirements and enhance quality;
(d) Environmental conditions may change: there may be a general boom or a recession, an
event affecting supply or demand, or a change in Government or Government policy;
(e) The level of inflation may be higher or lower than that anticipated;
(f) The level of activities may be different from the levels planned.
Any of these factors may make the original budget quite inappropriate, either in terms of the
numbers expected, or the way in which responsibility for achieving the is divided or both.
In this respect if management needs the chance to revise their plans, they may then decide to
introduce a system of Continuous budgets also called Rolling budgets.
Advantages of Continuous/Rolling Budgets
(a) They reduce the element of uncertainty in budgeting because they concentrate detailed
planning and control on short-term prospects where the degree of uncertainty is much
smaller;
(b) They force managers to reassess the budget regularly and to produce budgets which are
up to date in the light of current events and expectations;
(c) Planning and control will be based on a recent plan which is likely to be far more realistic
than a fixed annual budget prepared many months ago;
(d) Realistic budgets are likely to have a better motivational influence on managers;
(e) There is always a budget which extends for several months ahead.

131
Disadvantages of Continuous/Rolling Budgets
(a) They involve more time, effort and money in budget preparation;
(b) Frequent budgeting might have an off-putting effect on managers who doubt the value of
preparing one budget after another at regular intervals;
(c) Revision to the budget might involve revisions to standard costs too, which in turn would
involve revisions to stock valuations. This could replace a large administrative effort
from the accounts department every time a rolling budget is prepared.
ACTIVITY BASED BUDGETING (ABB)
Activity based budgeting is merely the use of costs determined using ABC as a basis for
preparing budgets.
ABB involves defining the activities what underlie the financial figures in each function and
using the level of activity to decide how much resource should be allocated, how well it is
being managed and to explain variances from budget.
Implementing ABC actually leads to the realization that the business as a whole needs to be
managed with far more reference to the behaviour of activities and cost drivers identified.
Results of using ABB
(a) Different activity levels will provide a foundation for the base package and incremental
packages of ZBB;
(b) The organisation‟s overall strategy and any actual or likely changes in that strategy will
be taken into account because ABB attempts to manage the business as the sum of its
interrelated parts;
(c) Critical success factors (an activity in which a business must perform well if it is to
succeed) will be identified and performance measures devised to monitor progress
towards them;
(d) The focus is on the whole of an entity, not just its separate parts and so there is more
likelihood of getting it right first time. For example, what is the use of being able to
produce goods in time for their dispatch date if the budget provides insufficient resources
for the distribution manager who had to deliver them.
THE FUTURE OF BUDGETING
Criticisms of traditional budgeting
Time consuming and costly
Major barrier to responsiveness, flexibility and change;
Adds little value given the amount of management time required;
Rarely strategically focused;
Makes people feel undervalued;
Reinforces departmental barriers rather than encouraging knowledge sharing;
132
Based on unsupported assumptions and guesswork as opposed to sound, well-constructed
performance data;
Developed and updated infrequently.
Ways in which companies are adapting planning and budgeting processes
Use of rolling forecasts;
Separation of the forecasting process from the budget to increase speed and accuracy
and reduce management time;
Focus on the future rather than past performance;
Use of the balanced scorecard.
FIXED AND FLEXIBLE BUDGET
A Fixed budget is a budget which is designed to remain unchanged regardless of the volume
of output or sales achieved.
A Flexible budget is a budget which, by recognizing different cost behaviour patterns, is
designed to change as volumes of output change.
133
UNIT 16
STANDARD COSTING AND VARIANCE ANALYSIS
Learning Outcomes
After completion of this module, students should be able to:
Explain the meaning of Standard costing;
Explain why planned standard costs, prices and volumes are useful in setting a
benchmark for comparison;
Calculate standard costs for the material, labour and variable overheads elements of cost
of a product or service;
Calculate variances for materials, labour, variable overhead, sales prices and sales
volumes.
INTRODUCTION
This lecture will consider the aspects of standard costs, how they are set and how they are used
as the basis of variance analysis in order to help monitor and control an organization‟s
performance.
Standard costing – This is a control technique that reports variances by comparing actual costs
against pre-set standards helping to facilitate action through management by exception.
The pre-set standards require managers to plan in advance the amount and price of each resource
that will be used in providing a service or manufacturing a product. These pre-set standards, for
selling prices and sales volumes as well as for costs, do provide a basis for planning, a target for
achievement and a benchmark against which the actual costs and revenues can be computed and
compared.
The actual costs and revenues recorded after the event are then compared with the pre-set
standards and the differences are recorded as variances. If resource price or usage is above
standard, or if sales volume or the selling price is below standard, an advance variance will be
recorded. If the resource price or usage is below standard, or if sales volume or selling price is
above the set standard, then a favourable variance will result.
Variances lead to management taking corrective action. If certain variances are large or
significant, then managers can concentrate their attention on these activities where any corrective
action is likely to be most worthwhile. On the other hand, if other variances are small or not
significant, then managers can ignore these activities, knowing that they appear to be conforming
to the expectations of management.

134
MEANING OF STANDARD COSTING
A Standard cost is a carefully predetermined unit cost which is prepared for each cost unit. It
contains details of the standard amount and price of each resource that will be utilized in
providing the service or manufacturing the appropriate product.
In order to apply standard costing, it must be possible to identify a measurable cost unit. This
can be a unit of product or a unit of service but it must be capable of standardizing, for example,
standardized tasks must be involved in its creation. The cost units themselves do not necessarily
have to be identical. For example, standard costing can be applied in situations such as costing
plumbing jobs for customers where every cost unit is unique. However, the plumbing jobs must
include standardized tasks for which a standard time and cost can be determined for monitoring
purposes.
The standard cost may be stored on a standard cost card but nowadays it is more likely to be
stored on a computer. Alternatively, it may be stored as part of a spreadsheet so that it can be
used in the calculation of variances.
A standard cost card showing the variable elements of production cost might take the following
format:
Standard cost card: Product 271
K per unit
Direct materials
(30 kg @ K4.30 each) 129.00
Direct wages
(12 hours @ K11.80 each) 141.60
Prime cost 270.60
Variable production overhead:
(12 hours @ K0.75) 9.00
Variable production cost 279.60
For every variable cost the standard amount of resource to be used is stated, as well as the
standard price of the resource. This standard data provides the information for a detailed
variance analysis, as long as the actual data is collected in the same level of detail.
Standard costs and standard prices provide the basic unit information which is needed for valuing
budgets and for determining total expenditures and revenues.

135
QUESTION
The following information was collected from the books of Kawana Ltd, a manufacturing
company.
The data is given for the standard details for one unit of product MX:
Direct materials: 40 square metres at K6.48 per square metre
Direct wages:
Bonding department – 48 hours at K12.50 per hour
Finishing department – 30 hours at K11.90 per hour
Budgeted costs and labour
Hours per annum: K Hours
Variable production overhead:
Bonding department 375 000 500 000
Finishing department 150 000 300 000
REQUIRED
From the above information, prepare a standard cost card extract for one unit and enter on the
standard cost card the costs to show subtotals for:
(a) Prime cost;
(b) Variable production cost.
PERFORMANCE LEVELS
Standard is defined as a “benchmark measurement of resource usage or revenue or profit
generation, set in defined conditions”.
The definition goes on to describe a number of bases which can be used in order to set the
standard. These bases include the following:
A prior period level of performance by the same organization;
The level of performance achieved by comparable organizations;
The level of performance required to meet organizational objectives.
Use of the first basis indicates that management feels that performance levels in a prior period
have been acceptable. They will then use this performance level as a target and control level for
the forthcoming period.
When using the second basis, management is being more outward looking, perhaps attempting to
monitor their organization‟s performance against the best of the rest.
136
The third basis sets a performance level which will be sufficient to achieve the objectives which
the organization has set for itself.
TYPES OF STANDARDS
There are three (3) commonly used standards and these are as follows:
(a) Ideal standard;
(b) Attainable standard and
(c) Current standard
Ideal standard
Standards may be set at ideal levels; which make no allowance for inefficiencies such as losses,
waste and machine downtime. This type of ideal standard is achievable only under the most
favourable conditions and can be used if managers wish to highlight and monitor the full cost of
factors such as waste, etc.
However, this type of standard will almost always result in adverse variances since a certain
amount of waste, etc. is usually unavoidable. This can be very de-motivating for individuals
who feel that an adverse variance suggests that they have performed badly.
Attainable standard
Standards may also be set at attainable levels which assume efficient levels of operation, but
which include allowances for factors such as losses, waste and machine downtime. This type of
standard does not have the negative motivational impact that can arise with an ideal standard
because it makes some allowance for unavoidable inefficiencies. Adverse variances will reveal
whether inefficiencies have exceeded this unavoidable amount.
Current standard
Standards based on current performance levels (current wastage, current inefficiencies) are
known as current standards. Their disadvantage is that they do not encourage any attempt to
improve on current levels of efficiency.
SETTING STANDARD COSTS
Some of the standards set will include the following:
Standard material price;
Standard material usage;
Standard labour rate;
Standard labour time;
Variable production overhead costs.

137
UPDATING STANDARDS
The main purpose of standard costs is to provide a yardstick or benchmark against which actual
performance can be monitored. If the comparison between actual and standard cost is to be
meaningful, then the standard must be valid and relevant.
It therefore follows that the standard cost should be kept as up to date as possible. This may
necessitate frequent updating of standards in to ensure that they fairly represent the latest
methods and operations and the latest prices which must be paid for the resources being used.
The standards may not be updated for every small change: however, any significant changes
should be adjusted as soon as possible.
STANDARD COSTING IN THE MODERN BUSINESS ENVIRONMENT
There has recently been some criticism of the appropriateness of standard costing in the modern
business environment. The main criticisms include the following:
(a) Standard costing was developed when the business environment was more stable and
operating conditions were less prone to change. But in the present dynamic environment,
such stable conditions cannot be assumed. If conditions are not stable, then it is difficult
to set a standard cost which can be used to control costs over a period of time.
(b) Performance to standard used to be judged as satisfactory, but in today‟s climate constant
improvement must be aimed for in order to remain competitive.
(c) The emphasis on labour variances is no longer appropriate with the increasing use of
automated production methods.
Standard costing may still be useful even where the final product or service is not standardized.
It may be possible to identify a number of standard components and activities for which
standards may be set and used effectively for planning and control purposes. In addition, the use
of demanding performance levels in standard costs may also help to encourage continuous
improvement.

138
UNIT 17
FURTHER VARIANCE ANALYSIS
What is Variance Analysis?
A variance is the difference between the expected standard cost and the actual cost incurred. A
unit standard cost contains details concerning both the usage of resources and the price to be paid
for the resources.
Variance Analysis involves breaking down the total variance to explain how much of it is caused
by the usage of resources being different from the standard and how much of it is caused by the
price of resources being different from the standard. These variances can be combined to
reconcile the total cost difference revealed by the comparison of the actual and standard cost.
The following brief questions will expose students to the calculations of basic variances:
QUESTION
A company, Mooya Ltd manufacture a single product for which the standard variable cost is:
K per unit
Direct material
(81 kg x K7 per kg) 567
Direct labour
(97 hours x K8 per hour) 776
Variable overhead
(97 hours x K3 per hour) 291
1 634
During the month of January, 530 units were produced and the costs incurred were as follows:
Direct material 42 845 kg purchased and used; cost K308 484
Direct labour 51 380 hours worked; cost K400 764
Variable overhead Cost K156 709
REQUIRED
Calculate the following variances:
(a) Direct material total variance;
(b) Direct material price variance; and
(c) Direct material usage variance;
(d) Direct labour total variance;
(e) Direct labour rate variance;
(f) Direct labour efficiency variance;
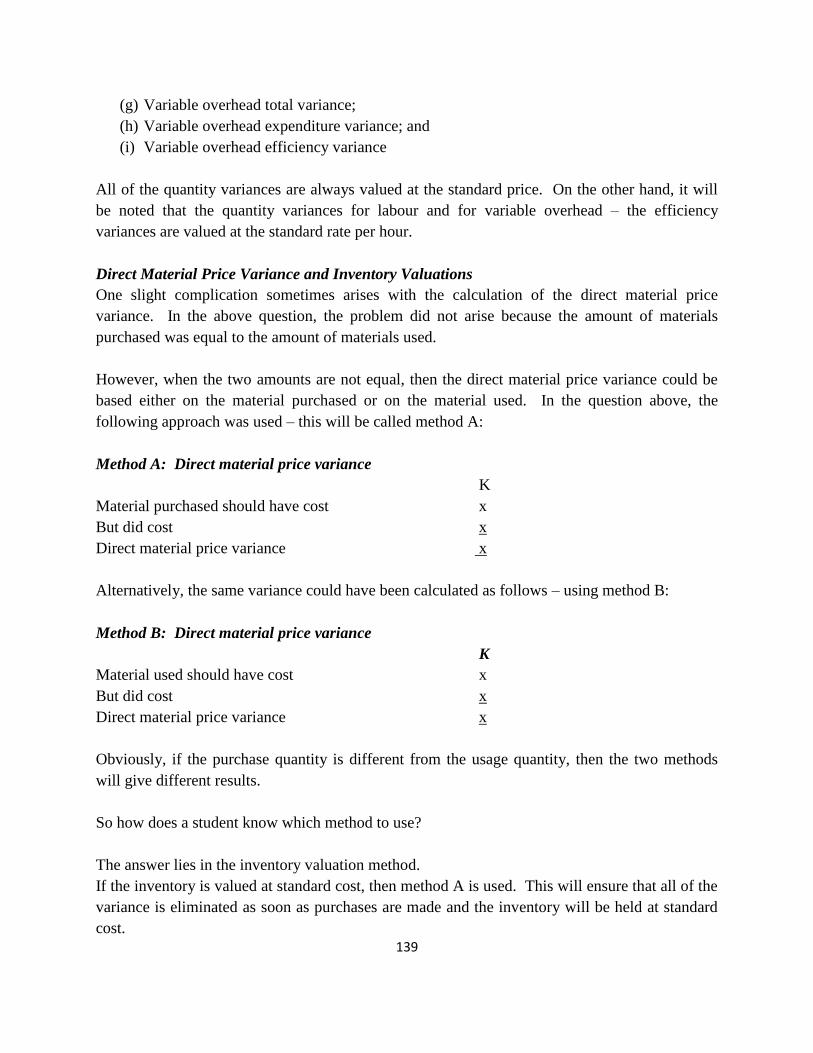
139
(g) Variable overhead total variance;
(h) Variable overhead expenditure variance; and
(i) Variable overhead efficiency variance
All of the quantity variances are always valued at the standard price. On the other hand, it will
be noted that the quantity variances for labour and for variable overhead – the efficiency
variances are valued at the standard rate per hour.
Direct Material Price Variance and Inventory Valuations
One slight complication sometimes arises with the calculation of the direct material price
variance. In the above question, the problem did not arise because the amount of materials
purchased was equal to the amount of materials used.
However, when the two amounts are not equal, then the direct material price variance could be
based either on the material purchased or on the material used. In the question above, the
following approach was used – this will be called method A:
Method A: Direct material price variance
K
Material purchased should have cost x
But did cost x
Direct material price variance x
Alternatively, the same variance could have been calculated as follows – using method B:
Method B: Direct material price variance
K
Material used should have cost x
But did cost x
Direct material price variance x
Obviously, if the purchase quantity is different from the usage quantity, then the two methods
will give different results.
So how does a student know which method to use?
The answer lies in the inventory valuation method.
If the inventory is valued at standard cost, then method A is used. This will ensure that all of the
variance is eliminated as soon as purchases are made and the inventory will be held at standard
cost.

140
On the other hand, if the inventory is valued at actual cost, then method B is used. This means
that the variance is calculated and eliminated on each bit of inventory as it is used up. The
remainder of the inventory will then be held at actual price, with its price variance still attached,
until it is used and the price variance is calculated.
SALES VARIANCES
After covering the material and labour variances, now the sales variances can also be considered.
Among the sales variances, the sales price variance and the sales volume contribution variance
will be considered.
QUESTION
The following information was collected from the records of Pande Ltd:
Budget Sales and production volume 81 600 units
Standard selling price K59 per unit
Standard variable cost K24 per unit
Actual results Sales and production volume 82 400 units
Actual selling price K57 per unit
Actual variable cost K23 per unit
REQUIRED
From the above details, calculate the following variances:
(a) Sales price variance;
(b) Sales volume variance.
UNIT SUMMARY
The points that need to be noted are as follows:
1 A standard cost is a carefully predetermined unit cost. It is established in advance to
provide a basis for planning, a target for achievement and a benchmark against which
the actual costs and revenues can be compared.
2 The difference between the standard cost and the actual result is called a variance.
3 The analysis of variances facilitates action through management by exception, whereby
managers concentrate on those areas of the business that are performing below or
above expectations and ignore those that appear to be conforming to expectations.

141
4 A number of different performance levels can be used in setting standards. The most
common are Ideal standards, Attainable standards and Current standards.
5 The direct material total variance can be analyzed between the direct material price
variance and the direct material usage variance.
6 If inventories are valued at standard cost, then the material price should be based on the
quantity purchased. But if inventories are valued at actual cost, then the material
price variance should be based on the quantity of materials used during the period.
7 The direct labour total variance can be analyzed between the direct labour rate variance
and the direct labour efficiency variance.
8 The variable overhead total variance can be analyzed between the variable overhead
expenditure variance and the variable overhead efficiency variance.
9 The sales price variance reveals the difference in total revenue caused by charging a
different selling price from the standard one.
10 The sales volume contribution variance reveals the contribution difference which is
caused by selling a different quantity from the budgeted quantity. The calculation of
the variance is based on the standard contribution and not on the actual contribution.
LABOUR VARIANCES WITH IDLE TIME
The idle time variance is the number of hours that labour were idle valued at the standard rate per
hour.
Idle time may be caused by machine breakdowns or not having worked to give to employees,
perhaps because of bottlenecks in production or a shortage of orders from customers. When it
occurs the labour force is still paid wages for time at work, but not actual work is done. Such
time is unproductive and therefore inefficient. In variance analysis, idle time is an adverse
efficiency variance.
The idle time variance is shown as a separate part of the total labour efficiency variance. The
remaining efficiency variance will then relate only to the productivity of the labour force during
the hours spent actively working.

142
QUESTION
During period 5, a total of 1 500 units of product X were made and the cost of grade Z labour
was K17 500 for 3 080 hours. During the period, however, there as a shortage of customer
orders and 100 hours were recorded as idle time.
REQUIRED
Calculate the following variances:
(a) The labour total variance;
(b) The labour rate variance;
(c) The idle time variance;
(d) The labour efficiency variance.
VARIABLE PRODUCTION OVERHEAD VARIANCES
The variable production overhead total variance can be subdivided into the variable production
overhead expenditure variance and the variable production overhead efficiency variance (based
on active hours).
QUESTION
Suppose that the variable production overhead cost of product X is 2 hours at K1.50 (=K3 per
unit). During period 6, a total of 400 units of product X were made. The labour force worked
820 hours, of which 60 hours were recorded as idle time. The variable overhead cost was K1
230.
REQUIRED
Calculate the following variances:
(a) The variable production overhead total variance;
(b) The variable production overhead expenditure variance;
(c) The variable production overhead efficiency variance.
FIXED PRODUCTION OVERHEAD VARIANCES
The fixed production overhead total variance can be subdivided into an expenditure variance and
a volume variance. The volume variance can be subdivided into an efficiency variance and a
capacity variance.
It may be noticed that the method of calculating cost variances for variable cost items is
essentially the same for labour, materials and variable overheads. Fixed production overhead
variances are very different. In an absorption costing system, they are simply an attempt to
explain the under or over absorption of fixed overheads.
The fixed production overhead total variance may be broken down into two parts as usual:

143
(a) An expenditure variance;
(b) A volume variance – which in turn may be split into two parts:
(i) A volume efficiency variance; and
(ii) A volume capacity variance.
The fixed production overhead volume variance sometimes causes confusion and may need more
explanation. The most important point is that the volume variance applies to fixed production
overhead costs only and not to variable production overheads.
(a) Variable production overheads incurred change with the volume of activity. If the master
budget is to work for 300 hours and variable production overheads are incurred and
absorbed at a rate of K6 per hour, the variable production overhead absorbed will be K1
200, but the expected expenditure will also be K1 200, so that there will be no under- or
over- absorption of production overhead because of volume changes.
(b) Fixed production overheads are different because the level of expenditure does not
change as the number of hours worked varies. If the master budget is to work for 300
hours and fixed production overheads are budgeted to be K2 400, the fixed production
overhead absorption rate will be K8 per hour. If actual hours worked are only 200 hours,
the fixed production overhead absorbed will be K1 600, whereas expected expenditure
will be unchanged at K2 400. There is an under-absorption of K800 because of the
volume variance of 100 hours shortfall multiplied by the absorption rate of K8 per hour.
It is easier to calculate and understand that fixed production overhead variance if one keeps in
mind the whole time the fact that they are trying to explain the reasons for any under-or over
absorbed production overhead. It is important to remember that the absorption rate is calculated
as (budgeted fixed production overhead /budgeted level of activity).
Generally the level of activity used in the overhead absorption rate will be units of production or
hours of activity. More often than not, if just one product is being produced, the level of activity
is in terms of units produced. If however, more than one product is produced, units of output are
converted to standard hours.
It is important to remember that if either the budgeted overhead or the budgeted activity level or
both are incorrect, then there will be under- or over absorbed fixed production overhead.
(a) The fixed production overhead expenditure variance measures the under- or over
absorption caused by the actual production overhead expenditure being different from the
budgeted.

144
(b) There are two reasons why the actual production or hours of activity may be different
from the budgeted production or budgeted number of hours used in calculating the
absorption rate.
(i) The work force may have been working at as more or less efficient rate than
standard to produce a given output. This is measured by the fixed production
overhead volume efficiency variance, which is similar to the variable production
overhead efficiency variance.
(ii) Regardless of the level of efficiency, the total number of hours worked could have
been less or more than was originally budgeted (employees may have worked a
lot of overtime or there may have been a strike). Other things being equal, this
could lead to under- or over-absorbed fixed overhead and the effect is measured
by the fixed production overhead volume capacity variance.
HOW TO CALCULATE THE VARIANCES
Fixed production overhead total variance is the difference between fixed production
overhead incurred and the fixed production overhead absorbed. In other words, it is the
under- or over absorbed fixed production overhead.
Fixed production overhead expenditure variance is the difference between the budgeted
fixed production overhead expenditure and the actual fixed production overhead
expenditure.
Fixed production overhead volume variance is the difference between actual and
budgeted production/volume multiplied by the standard absorption rate per unit.
Fixed production overhead volume efficiency variance is the difference between the
number of hours that actual production should have taken and the number of hours
actually taken (that is, worked) multiplied by the standard absorption rate per hour.
Fixed production overhead volume capacity variance is the difference between budgeted
hours of work and the actual hours worked, multiplied by the standard absorption rate
per hour.

145
QUESTION
A company, Moote Ltd budgets to produce 1 000 units of product E during the month of August.
The expected time to produce a unit of E is five (5) hours and the budgeted fixed production
overhead is K20 000. The standard fixed production overhead cost per unit of product E will
therefore be 5 hours at K4 per hour (= K20 per unit).
Actual fixed production overhead expenditure in August turns out to be K20 450. The labour
force manages to produce 1 100 units of product E in 5 400 hours of work.
REQUIRED
Calculate the following variances:
(a) The fixed production overhead total variance;
(b) The fixed production overhead expenditure variance;
(c) The fixed production overhead volume variance;
(d) The fixed production overhead volume efficiency variance;
(e) The fixed production overhead volume capacity variance.
WORKING BACKWARDS APPROACH
Examination questions often provide you with data about expected and actual results and you
have to calculate variances. One way in which your understanding of the concept can be tested,
however, is if you are provided with information about variances from which you have to work
backwards in order to determine the expected and actual results.
QUESTION
The standard direct material cost of Product X is K96 (16 kgs X K6 per kg) and the standard
direct labour cost is K72 (6 hours X K12 per hour). The following variances were among
those reported in control period 10 in relation to Product X.
Direct material price: K18 840 favourable
Direct labour rate: K10 598 adverse
Direct material usage: K480 adverse
Direct labour efficiency: K8 478 favourable
Actual direct wages cost K171 320 and K5.50 was paid for each kg of direct material. There was
no opening or closing stocks of the material.

146
EQUIRED
Calculate the following:
(a) Actual output (number of units)
(b) Actual hours worked;
(c) Average actual wage rate per hour;
(d) Actual number of kilograms purchased and used

147
UNIT 18
ABSORPTION COSTING, ACTIVITY-BASED COSTING AND
MARGINAL COSTING
OVERVIEW
This topic will deal and demonstrate the alternative cost accounting techniques which include
Absorption costing, Activity-based costing and also marginal costing. The lecture will then
recognize the alternative uses of cost accounting information and the appropriateness of each
technique to the various users of such information.
ABSORPTION COSTING
After selecting the suitable cost centres for a given organization, the first stage in the analysis of
overheads is to determine the overhead cost for each cost centre. This is achieved through the
process of allocation and apportionment.
Cost allocation is possible when an organization can identify a cost as specifically attributable to
a particular cost centre. For example, the salary of the manager of the packing department can
be allocated to the packing department cost centre. It is not necessary to share the salary cost
over several different cost centres.
Cost apportionment is necessary when it is not possible to allocate a cost to a specific cost centre.
In t his case the cost is then shared out over two or more cost centres according to the estimated
benefit received by each cost centre. As far as possible, the basis of apportionment is selected in
order to reflect this benefit received. For example, the cost of rent for a factory and rates might
be apportioned according to the floor space occupied by each cost centre.
The process of allocation and apportionment therefore establishes an estimated overhead cost for
each cost centre. It is now possible therefore to calculate overhead absorption rates so that the
overheads can be applied to the individual cost units.
OVERHEAD ABSORPTION
There are several different methods which can be used to absorb overheads. A brief example
relating to the overhead absorption rates is given below:
Exercise 1
Details for cost centre 2 year 7:
Total cost centre overhead K62 100
Production output 13 800 units
Direct labour hours 27 000 hours
Machine hours 34 500 hours

148
Direct wages cost K17 250
Direct materials cost K49 680
Required
From the above details, calculate the six (6) possible overhead absorption rates for cost centre 2.
APPLYING THE OVERHEAD ABSORPTION RATE
The example above demonstrates the six most common methods of calculating overhead
absorption rates but only one of them would be selected for each cost centre. As advanced
students you should already be familiar from your earlier studies how to apply the overhead
absorption rates in order to calculate the overhead cost to be absorbed by each cost unit.
As a reminder and to give you some revision practice, the following data can be applied to
determine the total production cost of a job.
Exercise 2
Job 123 was manufactured solely in one cost centre. A direct labour hour rate is to be used to
absorb this cost centre‟s overhead costs. Data relating to job 123 is as follows:
Direct material cost K367 000
Direct labour cost 405 000
Direct labour hours 90
Cost centre overheads are budgeted to be K2 300 000 with budgeted labour hours of 1 000.
Required
From the above details, calculate the total production cost of job 123.
SELECTING THE MOST APPROPRIATE ABSORPTION RATE
A major factor in selecting the absorption rate to be used is a consideration of the practical
applicability of such a rate. This will depend on how easy it is to collect the data required.
It is generally accepted that a time-based method should be used wherever possible, ie. the
machine hour rate or the labour hour rate need to be considered for selection. This is because
many overhead costs do increase with time, for example, indirect wages, rent and rates.
Therefore, it makes sense to attempt to absorb overheads according to how long a cost unit takes
to produce. The longer it takes, the more overhead will have been incurred in the cost centre
during that time.

149
In addition to these general considerations, each absorption method has its own advantages and
disadvantages as indicated below:
(a) Rate per unit – This is the easiest method to apply but it is only suitable when all cost
units produced in the period are identical. Since this does not often happen in practice,
then this method is rarely used or applied in practice.
(b) Direct labour hour rate – This is one of the favoured method because it is time-based. It
is most appropriate in labour-intensive cost centres, which are becoming rarer nowadays
and so the method is less widely used than it has been in the past.
(c) Machine hour rate – This in fact one of the favoured method because it is time-based. It
is most appropriate in cost centres where machine activity predominates and is therefore
more widely used than the direct labour hour rate. As well as absorbing the time-based
overheads mentioned above, it is actually more appropriate for absorbing the overheads
related to machine activity, such as power, maintenance, repairs and also depreciation.
(d) Direct wages cost percentage – This method may be acceptable because it is to some
extent also time-based. A higher direct wages cost may indicate a longer time taken and
therefore a greater incidence of overheads during this time. However, the method will
not product equitable overhead charges if different wage rates are paid to individual
employees in the cost centre. If this is the case, then there may not be a direct
relationship between wages paid and the time taken to complete a cost unit.
(e) Direct materials cost percentage – This is not a very logical method for absorption rates
because there is not reason why a higher material cost should lead to a cost unit
apparently incurring more production overhead cost. The method can be used if it would
be too costly and inconvenient to use a more suitable method.
(f) Prime cost percentage - This method is not recommended because it combines methods
(d) and (e) and therefore suffers from the combined disadvantages of both.
PREDETERMINED OVERHEAD ABSORPTION RATES
Overhead absorption rates are usually predetermined, that is, they are calculated in advance
of the period over which they will be used.

150
The main reason for this is that overhead costs are not incurred evenly throughout the period.
In some months the actual expenditure may be very high while in others it may be relatively
low. The actual overhead rate per hour or per unit will therefore be subject to wide
fluctuations. If the actual rate was used in product costing, then product costs would also
fluctuate highly. Such product costs would be very difficult to use for planning and control
purposes.
Fluctuations in the actual level of production would also cause the same problem of
fluctuating product costs.
In order to overcome this problem, the absorption rate is determined in advance of the period,
using estimated or budget figures for overhead to be incurred over the whole period and for
the number of units of the absorption base (labour hours or machine hours, etc).
A further advantage of using predetermined rates is that managers have an overhead rate
permanently available which they can use in product costing, price quotations and so on.
The actual overhead costs and activity levels are not known until the end of the period. It
would not be desirable for managers to have to wait until after the end of the period before
they had a rate of overhead that they could use on a day-to-day basis.
Under or Over-Absorption of overhead
The problem with using predetermined overhead absorption rates is that the actual figures for
overhead and for the absorption base are likely to be different from the estimates used in
calculating the absorption rate.
When this happens, the overhead will be either under- or over-absorbed. If the actual
overhead incurred is higher than the overhead absorbed, then the overhead is under-absorbed.
On the other hand, if the actual overhead incurred is less than the overhead absorbed, then the
overhead is overhead is over-absorbed. This pattern is demonstrated in the computations
below:

151
Exercise 3
Information for the latest period in two of the cost centres of Zaza Ltd are as follows:
Machining Finishing
Department Department
Estimated/budget data:
Production overhead K340 000 K120 000
Machine hours 170 000 4 200
Direct labour hours 16 500 40 000
Actual results:
Production overhead incurred K360 000 K129 400
Machine hours 150 000 3 900
Direct labour hours 18 290 44 100
A machine hour rate is used to absorb overhead in the machining department. The finishing
department is more labour intensive therefore a labour hour rate is used.
Required
From the above, calculate the following:
(a) Overhead absorption rates;
(b) The Overhead absorbed and
(c) The Over- and Under absorbed overheads.
The reasons for under- or over-absorption
The under- or over-absorption has arisen because the actual overhead incurred per hour was
different from the predetermined rate per hour. There are two possible causes of this, which are:
(a) The actual number of hours (machine or direct labour) was different from the number
contained in the budget data. If this happens, then we would expect the variable element
of the overhead to vary in direct proportion to the change in hours, so this part of the
absorption rate would still be accurate. However, the fixed overhead would not alter with
the hours worked and this means that the actual overhead per hour would be different
from the predetermined rate.
(b) The actual production overhead incurred may be different from the estimate contained in
the predetermined rate. Apart from the expected change in variable overhead referred to
in (a) this would also cause an under- or over-absorption of overhead.

152
Accounting for Under- or Over-absorbed Overheads
If overheads are under-absorbed, this effectively means that product costs have been understated.
It is not usually considered necessary to adjust individual unit costs and therefore stock values
are not altered. However, the cost of units sold will have been understated and therefore the
under-absorption is charged to the Profit and Loss Account for the period.
The reverse is true for any over-absorption, which is credited to the Profit and Loss account for
the period. Some organizations do not charge or credit the under- or over-absorption to the
Profit and loss account every period. Instead, the amount for each period is transferred to a
suspense account. At the end of the year, the net balance on this account is transferred to the
Profit and loss account. This procedure is particularly appropriate when activity fluctuations
cause under- or over-absorptions which tend to cancel each other out over the course of the year.
The Problems caused by Under- or Over-Absorption of Overheads
If overheads are under-absorbed then managers have been working with unit rates for overheads
which are too low. Prices may have been set too low and other similar decisions may have been
taken based on inaccurate information. If the amount of under-absorption is significant, then this
can have a dramatic effect on reported profit.
Do not make the common mistake of thinking that over-absorption is not such a bad thing
because it leads to a boost in profits at the end of the period. If overhead rates have been
unnecessarily high then managers may have set selling prices unnecessarily high, thus leading to
lost sales. Other decisions would also have been based on inaccurate information.
Although it is almost impossible to avoid under- and over-absorption altogether, it is possible to
minimize the amount of adjustment necessary at the year end. This is achieved by conducting
regular reviews of the actual expenditure and activity levels which are arising. The overhead
absorption rate can thus be reviewed to check that it is still appropriate. If necessary, the
overhead absorption rate can be adjusted to reflect more recent estimates of activity and
expenditure levels.

153
Exercise 4
The information given below relates to the forthcoming period or a manufacturer‟s operation,
Beeba Ltd. There are four cost centres of which two are involved in production and two are
service cost centres.
Production departments Service departments
Total A B Canteen Stores
K K K K K
Allocated costs 70 022 21 328 29 928 8 437 10 329
Other costs:
Rent and rates 4 641
Buildings insurance 3 713
Electricity and gas 6 800
Plant depreciation 28 390
Plant insurance 8 517
122 083
Area occupied (square metres) 7 735 6 188 1 547 3 094
Plant at cost (K000) 1 845 852 - 142
Number of employees 600 300 30 70
Machine hours 27 200 800 - -
Direct labour hours 6 800 18 000 - -
Number of stores requisitions 27 400 3 400 - -
Required
Use this information to calculate the following:
(a) The production overhead absorption rates for Department A and Department B.
(b) The over- or under-absorption amounts relating to Department A and Department B.
Recent Developments in Absorption Costing Methods
The criticisms of the Traditional Approach
Historically, the most common method of absorbing production overhead has been based on
direct labour hours. This is because production tended to be labour intensive in the past and the
mechanisms existed to record the labour hours attributable to particular cost units.
However, modern production methods tend to be more mechanized. This has two main effects:
(a) The nature of production overhead is changing. Costs such as power, machine
maintenance and depreciation are becoming larger and more prevalent.

154
(b) The number of labour hours is reducing. This leads to very high figures for hourly
absorption rates based on direct labour.
The use of machine hours as an absorption base can help to overcome this problem, since
machine hours are more likely to reflect the incidence of machine-based overheads.
However, both these rates assume that products that take longer to make generate more
overheads. Yet the majority of overheads do not vary directly with the number of hours.
Furthermore, traditional absorption costing systems are limited in the information they provide.
Modern management accounting systems which use absorption costing have gone further than
this and a technique called Activity-Based Costing has been developed.
ACTIVITY BASED COSTING (ABC)
In order to understand how Activity Based Costing (ABC) operates it is necessary to understand
the meaning of some terms:
Cost object – A Cost object is any item for which cost measurement is required, for example, a
product or a customer.
Cost driver – A Cost driver is any factor that causes a change in the cost of an activity.
There are two categories of cost driver:
1 Resource cost driver – A Resource cost driver is a measure of the quantity of resources
consumed by an activity. It is used to assign the cost of a resource to an activity or
cost pool.
2 Activity cost driver – An Activity cost driver is a measure of the frequency and intensity
of demand placed on activities by cost objects. It is used to assign activity costs to
cost objects.
In the traditional absorption costing, overheads are first related to cost centres (usually functional
departments) whilst in the ABC, overheads are first related to activities (such as procurement).
Activities tend to run across functions; for instance, procurement of materials often includes
raising a Requisition Note in a manufacturing department or stores.
It is not raised in the Purchasing department where most procurement costs are incurred.
Activity costs tend to behave in a similar way to each other, that is, they have the same cost
driver. ABC gives a more realistic picture of the way in which costs behave.

155
The different stage in ABC calculations are listed below:
1 Identify the different activities within the organization. Usually the number of cost
centres that a traditional overhead system uses is quite small, say up to 15. In ABC
the number of activities will be much more, say 200; the number will of course
depend on how the management subdivides the organization‟s activities. It is
possible to break the organization down into many very small activities. But if ABC
is to be an acceptable and practical system it is necessary to use large groupings, so
that, say 40 activities may be used in practice. The additional number of activities
over cost centres means that ABC should be more accurate than the traditional
method.
2 Reduce the overheads to the activities both support and primary; that caused them. This
creates “cost pools” or “cost buckets”. This will be done using resource cost drivers
that reflect causality.
3 Support activities are them spread across the primary activities on some suitable base,
which reflects the use of the support activity. The base is the cost driver that is the
measure of how the support activities are used.
4 Determine the activity cost drivers that till be used to relate the overheads collected in the
cost pools to the cost objects/products. This is based on the factor that drives the
consumption of the activity. The question to ask is – what causes the activity to incur
costs? In production scheduling, for example, the driver will probably be the number
of batches ordered.
5 Calculate activity cost driver rates for each activity, just as an overhead absorption rate
would be calculated in the traditional system:
Activity cost driver rate = Total cost of activity
Activity driver
The activity driver rate can be used to cost products, as in traditional absorption costing,
but it can also cost other cost objects such as customers/customer segments and
distribution channels. The possibility of costing objects other than products is part of the
benefit of ABC. The activity cost driver rates will be multiplied by the different amounts
of each activity that each product/other cost object consumes.
Activities fall into four different categories, known as the manufacturing cost hierarchy. The
categories help to determine the type of activity cost driver required. The categories are:

156
(a) Unit level activities – The costs of some activities (mainly primary activities) are strongly
correlated to the number of units produced. For example, the use of indirect
materials/consumables tends to increase in proportion to the number of units produced.
Another example of a unit level activity is the inspection or testing of every item
produced, if this was deemed necessary or, perhaps more likely, every 100th
item
produced.
(b) Batch level activities – The costs of some activities (mainly manufacturing support
activities) are driven by the number of batches of units produced. Examples of this are:-
Material ordering – where an order is placed for every batch of production.
Machine set-up costs – where machines need resetting between each different
batch of production.
Inspection of products – where the first item in every batch is inspected rather
than every 100th
item quoted above.
(c) Product level activities – The costs of some activities (often once only activities) are
driven by the creation of a new product line and its maintenance, for example, designing
the product, producing parts specifications and keeping technical drawings of products up
to date. Advertising costs fall into this category if individual products are advertised
rather than the company‟s name.
(d) Facility level activities – Some costs cannot be related to a particular product line, instead
they are related to maintaining the buildings and facilities. Examples are the maintenance
of buildings, plant security; business rates, etc. Also included in this category are
salaries, such as the production manager‟s. Advertising campaigns that promote the
organization would also be included.
The first and last categories above are the same as those in traditional absorption costing and so
if an organization‟s costs are mainly made up of these two categories ABC will not improve the
overhead analysis greatly. But if the organization‟s costs fall mainly in the second and third
categories, an ABC analysis will provide a different and more accurate analysis.
Although non-manufacturing costs have been included in the examples above, some
organizations only use ABC for production costs. This is because traditional overhead
absorption dealt with production costs only for stock valuation purposes in the financial
accounts. As a consequence of this, the organization may not have split up administration and
marketing costs and related them to products in the past and they may continue with this policy.
However, if the best is to be obtained from ABC, all costs need to be split into activities.
The best way to see how ABC operates is to work through the following question.

157
Exercise 5
Information relating to the four products made and sold by a company, Jeremiah Ltd for one
period is as follows:
Product Product Product Product
A B C D
Output (units) 120 100 80 120
K per unit K per unit K per unit K per unit
Direct material 40 50 30 60
Direct labour 28 21 14 21
Machine hrs
per unit 4 3 2 3
The four products are similar and are usually produced in production runs of 20 units and sold in
batches of 10 units.
The total of the production overhead for the period has been analyzed as follows:
K
Machine department costs (rent, business rates, depreciation
and supervision) 10 430
Set-up costs 5 250
Stores receiving 3 600
Inspection/quality control 2 100
Materials handling and dispatch 4 620
Total 26 000
You have ascertained that the cost drivers to be used in an ABC exercise are as listed below for
the overhead costs shows:
Cost pools Cost driver
Set-up cost Number of production runs
Stores receiving Requisitions raised
Inspection/quality control Number of production runs
Materials handling and dispatch Orders executed
The number of requisitions raised on the stores was 20 for each product and the number of orders
executed was 42, each order being for a batch of 10 of a product.

158
Required
From the above details, calculate the production costs per unit, using the Activity Based Costing
(ABC).
THE DIFFERENCE BETWEEN MARGINAL COSTING AND ABSORPTION
COSTING
The analysis given so far relate to the framework of a total costing system. With absorption
costing, all stock items are valued at their full production cost. This includes fixed production
overhead which has been absorbed using one of the bases which have been covered earlier.
In contrast, marginal costing values all stock items at their variable or marginal costs only. Fixed
costs are treated as period costs and are then written off in full against the contribution for t he
period.
Since the two systems value stocks differently, it follows that each system will report a different
profit figure for the period if the stock levels alter.
Marginal Costing and Contribution
The terms marginal cost and variable cost tend to be used interchangeably. In marginal costing
the variable costs are matched against the sales value for the period to highlight an important
performance measure; the contribution.
Contribution – Sales value – variable costs
It is called contribution because it literally does contribute towards fixed costs and profit. Once
the contribution has been calculated for the period, fixed costs are then deducted in order to
determine the profit for the period.
QUESTION 1
A company, Aroni Ltd produces and sells one product only which sells for K50.00 per unit.
There were no stocks at the end of May and other information is as follows:
K
Standard cost per unit:
Direct material 18.00
Direct wages 4.00
Variable production overhead 3.00
Budgeted and actual costs per month:
Fixed production overhead 99 000
Fixed selling expenses 14 000
Fixed administration expenses 26 000
Variable selling expenses 10% of sales value

159
Normal capacity is 11 000 units per month.
The number of units produced and sold was:
June July
Units units
Sales 12 800 11 000
Production 14 000 10 200
REQUIRED
Using the information above, prepare Profit Statements for the months of June and July using the
following methods:
(a) Marginal costing and
(b) Absorption costing.
Should Marginal Costing or Absorption Costing be used?
There is no absolutely correct answer as to when marginal costing or absorption costing is
preferable. However, it is generally accepted that marginal costing statements provide the best
information for the purposes of management decision-making.
Supporters of absorption costing argue that fixed production overheads are a necessary cost of
production and they should therefore be included in the unit cost used for stock valuation.
External financial reporting requires the use of absorption costing.
If stocks are built up for sale in a future period, for example in distilling, then absorption costing
smooths out profits by carrying forward the fixed production overheads to be matched against
the sales as they are made.
On the other hand, supporters of marginal costing argue that management attention is
concentrated on the more controllable measure of contribution. They say that the apportionment
of fixed production overhead to individual units is carried out on a purely arbitrary basis, is of
little use for decision-making and can be misleading.
QUESTION 2
This question builds on the simpler details and presents a more detailed and requires realistic
calculations. Section I illustrates the calculation of the traditional method. Section II illustrates
the calculation using ABC and Section III deals with the problem of genuine fixed costs, that is
facility level costs.

160
QUESTION DETAILS: SECTION 1 – TRADITIONAL ANALYSIS
A company, Moote Ltd manufactures three products – X, Y and Z, whose direct costs are given
in Table 1:
Table 1: Direct costs of products X, Y and Z
X Y Z
K K K
Direct material 67.92 63.27 56.79
Direct labour @ K3 per hr:
Machining 13.08 14.73 17.01
Assembly 24.00 27.00 31.20
105.00 105.00 105.00
The data in Table 2 was used in calculating the direct labour costs above, and will be used to
determine the production overhead charged to each product under the „traditional‟ costing
method.
Table 2: Resource Usage for Products X, Y and Z
X Y X Total
Machine time (hrs) 10.00 9.00 8.00
Direct labour (hrs):
Machining 4.36 4.91 5.67
Assembly 8.00 9.00 10.40
Production (units) 50 000 30 000 16 250
Total machine hours 500 000 270 000 130 000 900 000
Total labour hours:
Machining 218 000 147 300 92 137 457 437
Assembly 400 000 270 000 169 000 839 000
1 296 437
Table 3: Contains information on the company’s overheads.
Table 3: Company overhead information:
Total
Production overhead: K000 K000
Indirect labour:
Machining 900
Assembly 600
Purchasing/order processing 600
Factory management 100 2 200

161
Power:
Machining 400
Assembly 100
500
Indirect materials:
Machining 200
Assembly 200
Purchasing 100
Factory management 100
600
Depreciation:
Machining 600
Assembly 300
Purchasing 200
Building 400
1 500
Security 100
Grounds maintenance 100
Total production overhead 5 000
REQUIRED
Prepare a traditional overhead analysis and then calculate product costs for the three (3)
products, X, Y and Z.
Assume that the machining department uses a machine hour absorption rate and the assembly
department uses a labour hour rate.
SECTION II – ABC ANALYSIS, ALLOCATING ALL COSTS TO PRODUCTS
The information and data in Tables 4, 5 and 6 will be used to determine Cost drivers and
calculate overheads.
Table 4: Production information
Product information
Product X Product Y Product Z
High volume Medium volume Low volume
Large batches Medium batches Small batches
Few purchase orders placed Medium purchase orders placed Many purchase orders
placed
Few customer orders placed Medium customer orders placed Many customer orders
Placed

162
Table 5: Activity information
Product information
Product Product Product Total
X Y Z
Typical batch size 2 000 600 325
No. of production runs 25 50 50 125
No. of inspections 25 50 50 125
Purchase orders placed 25 100 200 325
Customer orders received 10 100 200 310
Table 6: Analysis of Indirect Labour
Analysis of Indirect Labour
Total
K000 K000
Machining:
Supervision 100
Set up 400
Quality control 400
900
Assembly:
Supervision 200
Quality control 400
600
Purchasing/order processing:
Resource procurement 300
Customer liaison/expediting 300
600
Factory management:
General administration 100
2200
REQUIRED
Prepare an Activity Based Costing (ABC) Analysis and also calculate the product costs.

163
UNIT 19
PROCESS COSTING
Learning Objectives
After completing this unit, students should be able to:
Explain the characteristics of process costing and situations where the use of process
costing is appropriate;
Apply the treatment of normal losses;
Apply the treatment of abnormal losses and abnormal gains;
Acquire skills on how to calculate the cost of output units from a process where losses
occur;
Acquire skills on how to prepare process accounts where losses occur;
Acquire knowledge of how to account for any scrap value of losses;
Know the concept of equivalent units for the valuation of work in progress;
Develop the capacity on how to prepare process accounts where there is closing work in
progress.
FEATURES OF PROCESS COSTING
Some manufacturing businesses do produce their output in a process operation, or a series of
process operations. Process manufacturing has certain distinguishing features. One of these
features is the loss of materials during processing, for example, due to evaporation or chemical
reaction. Another feature of process costing is that once material has been input to a process, it
becomes indistinguishable and there is no easy way of distinguishing between completed output
and materials still in process. Special techniques have been developed for costing output from
process operations.
Process costing is a method of costing used in industries including brewing, food processing,
quarrying, paints, chemicals and textiles.
The cost per unit of finished output is calculated by dividing the expected process costs by the
expected number of units of output. Process costs consist of direct materials, direct labour and
production overheads. When processing goes through several successive processes, the output
from one processing becomes an input direct material cost to the next process. Total costs
therefore build up as the output goes through each successive processing stage.

164
EXAMPLE
Input to a process is 100kg of materials. The cost of the direct materials is K200, and the costs of
converting these into finished output consists of K100 of direct labour and K250 of production
overheads. Output from the process was 100kg of finished product.
The total costs of processing are K550 and the cost per kilogram of output is K5.50
(K550/100kg).
PROCESS INDUSTRY MANUFACTURING
Process production has certain features that make it different from other types of manufacturing.
In some process industries, output is manufactured in batches of small value but high
quantity e.g. matches, paper clips. In continuous processing , however, manufacturing
operations never stop. Materials are continually being added to the process and output is
continually produced e.g. brewing, painting.
Usually there are two or more consecutive processes, with output from one process being
input to the next process, and finished output only being produced from the final process.
For example, suppose there are three consecutive processes, A, B, and C. raw materials
might be added to Process A to produce output that is then input to process B. further raw
materials might be added in Process B, and mixed in with the output from process A. the
output from process from process B might then be input to process C. Output from
process C is the finished product that is sold to customers.
When processing is continuous, there will be opening stock in process at the start of any
period and closing stock in process at the end of the period. A problem is to decide and
closing stock in process at the end of the period. A problem is to decide what value to put
to part-finished stock in process. Usually, it is necessary to make an estimate of the
degree of completion of the closing stock (which is then part-finished opening stock at
the start of the next period). For example, it might be estimated or measured that closing
stock in a process consists of 100 units of product, which is 100% complete for direct
materials but only 50% complete for conversion costs. A value (cost) will then be
calculated for the stock.
There could be losses in process. By this we mean that if 100kg of direct materials are
input to a process, the output quantity could be less than 100kg. loss could be a natural
part of the production process, occurring because of evaporation or chemical change or
natural wastage.

165
There could be more than one product produced from a common input. For example, an
oil refinery may produce petrol, diesel, tar, etc. these products may be significant in their
own right or a by-product of the process.
The main problems with process costing are therefore:
How to treat losses
How to value stock and finished output when there are opening and closing stocks of
work n process. At this stage of your studies, you are only required to know how to
value finished output and closing work in process when there is no opening work in
process at the start of the accounting period.
How to cost joint and by-products.
PROCESS INPUT COSTS
The typical costs of a process are direct materials, direct labour and production overheads
absorbed into the cost of the process. In process costing the total of the labour costs and the
overhead costs tend to be known as costs of conversion.
Definition:
costs of conversion are the labour costs of the process plus the overheads of the process.
If you come across the term „conversion costs‟, try not to get confused – simply means direct
labour cost plus production overhead cost.
LOSSES
In many processes, some losses in processing are inevitable. When losses occur, the problem
arises as to how they should be accounted for.
Suppose that 100 units of materials are input to a process and the processing costs are K720.
Losses in the process are 10 units and so 90 units are the output. In this case, what is the cost of
the output and how should the loss be accounted for?
One approach would be to say that the cost for each unit is K7.20 ie (K720/100 units).
The cost of the finished goods would therefore be K648 ie (90 X K7.20) and the cost of
the loss would be K72 ie (10 X K7.20). The loss would be written off as an expense in
the Profit and Loss Account.

166
Another approach is to say that if losses are a regular and expected aspect of the
processing, it is unsatisfactory to make a charge to the Profit and Loss Account for losses
every time, knowing that the losses are unavoidable. A more sensible approach is
therefore to calculate a cost per unit based on the expected output from the process. In
this example, if the expected loss from the process is 90 units, then the cost of the
finished units would be K8 ie. (K720/90 units). The cost of production would therefore
be K720 ie (90 X K8) and the expected loss, or „normal loss‟ has no cost.
This second approach is taken in process costing. The cost per unit of output is calculated after
allowing for „normal loss‟. However, a distinction is made between normal loss and unexpected
loss or „abnormal loss‟. Abnormal loss is given a cost, which is charged as an expense to the
Profit and Loss Account.
Definitions:
Normal Loss – This is the expected amount of loss in a process. It is the level of loss or waste
that management would expect to incur under normal operating conditions.
Abnormal Loss – This is the amount by which actual loss exceeds the expected or normal loss in
a process. It can also be defined as the amount by which actual production is less than normal
production. Normal production is calculated as the quantity of input units of materials less
normal loss.
NORMA LOSS
Normal loss is not given a cost.
If units of normal loss have no scrap value, their value or cost is nil.
If units of normal loss have a scrap value, the value of this loss is its scrap value, which is
set off against the cost of the process. In other words, the cost of finished output is
reduced by the scrap value of the normal loss.
QUESTION 1: NORMAL LOSS WITH NO SCRAP VALUE
Input to a process in June consisted of 1 000 units of direct materials costing K4 300. Direct
labour costs were K500 and absorbed production overheads were K1 500. Normal loss is 10%
of input. Output from the process in the month was 900 units
REQUIRED
Calculate the cost per unit of output and show how this would be shown in the work-in-process
account in the cost ledger.
Normal Loss with a Scrap Value
When normal loss has a scrap value, the value of this loss is set against the costs of production.
In the cost accounts, this is done by means of:

167
Debit Normal loss (or scrap) account
Credit process account
With the scrap value of the normal loss.
Then
Debit Bank (or Debtors)
Credit Normal loss (or scrap) account
With the scrap proceeds received.
QUESTION 2
Input to a process in June consisted of 1 000 units of direct materials costing K4 300. Direct
labour costs were K500 and absorbed production overheads were K1 500. Normal loss is 10%
of input. Loss has a scrap value of K0.90 per unit. Output from the process in the month was
900 units.
REQUIRED
Calculate the cost per unit of output and show how this would be shown in the process account in
the cost ledger.
ABNORMAL LOSS
Unlike the normal loss, abnormal loss is given a cost. The cost of a unit of abnormal loss is the
same as a cost of one unit of good output from the process. The cost of abnormal loss is treated
as a charge against profit in the period it occurs.
The cost per unit of good output and abnormal loss is the cost of production divided by the
expected quantity of output.
In the cost accounts, abnormal loss is accounted for in an abnormal loss account. The double
entry transactions are:
Debit Abnormal loss account
Credit Process account
With the cost of the abnormal loss
Then:
Debit Profit and Loss Account
Credit Abnormal Loss Account

168
QUESTION 3
Input to a process in November was 2 000 units. Normal loss is 5% of input. Costs of
production were:
K
Direct materials 3 700
Direct labour 1 300
Production overhead 2 600
Actual output during the month of November was 1 780 units.
REQUIRED
(a) Calculate the cost per unit of output;
(b) Record these transactions in the cost accounts.
QUESTION 4
Deene produces a product in process A.
The following information relates to the product for week ended 7 January 20X4.
Input 1 900 tonnes, cost K28 804.
Direct labour K1 050
Process overhead K1 800
Normal loss is 2% of input.
Output to finished stock was 1 842 tonnes.
REQUIRED
Prepare the Process A Account together with any other relevant accounts.
Abnormal Loss with a Scrap value
When loss has a scrap value, normal loss is accounted for in the way already indicated above.
With abnormal loss, the cost per unit of loss is calculated and recorded in the way also as
described above. The scrap value of the loss, however, is se off against the amount to be written
off to the Profit and Loss Account.
This is done by means of:
Credit Abnormal loss account;
Debit Normal loss (scrap) account
With the scrap value of the abnormal loss units.

169
The balance on the Abnormal loss account is then written off to the Profit and Loss Account.
QUESTION 5
Input to a process in March was 1 000 units. Normal loss is 3% of input. Costs of production
were:
Direct materials K3 705
Direct labour K300
Production overhead K3 000
Actual output during November was 950 units. Items lost in process have a scrap value of K1
per unit.
REQUIRED
(a) Calculate the cost per unit of output;
(b) Record these transactions in the process account and the abnormal loss account
ABNORMAL GAIN
When actual losses are less than expected losses, there is an abnormal gain.
Definition
Abnormal gain – This is the amount by which actual output from a process exceeds the expected
output. It is the amount by which actual loss is lower than the expected loss.
Abnormal gain can therefore be thought of as the opposite of abnormal loss.
Abnormal gain is given a value. The value per unit of abnormal gain is calculated in the
same way as a cost per unit of abnormal loss would be calculated. It is the cost of
production divided by the expected units of output.
Abnormal gain is recorded in an abnormal gain account;
The gain is then taken to the Profit and Loss Account as an item of profit for the period;
If loss has any scrap value, the profit should be reduced by the amount of income that
would have been earned from the sales of scrap had the loss been normal.

170
In the cost accounts, abnormal gain is recorded as:
Debt Process account;
Credit Abnormal gain account
With the value of abnormal gain
If loss has a scrap value:
Debit Abnormal gain account;
Credit Normal loss account
With the scrap value of the abnormal gain. This is income that has not been earned because loss
was less than normal.
Then:
Debit Abnormal gain account
Credit Profit and Loss account
With the balance on the abnormal gain account.
QUESTION 6
Shem Chemical Ltd manufacture a range of industrial and agricultural chemicals. One such
product is 3X, which passes through a single process.
The following information relates to the process for week ended 30 January 20X5.
Input 5 000 litres of material of K12 per litre;
Normal losses are agreed as 4% of input;
Direct labour K950, process overhead K1 450.
Output is 4 820 litres. Waste units have a scrap value of K1 per litre.
REQUIRED
Prepare the process account for the period together with other relevant accounts
QUESTION 7
Input to Process X in June was 100 000 kgs of direct materials, costing K1 per kg. Conversion
costs for the month were K135 000. Normal loss is 6% and loss has scrap value of K1 per unit.
Actual output in June was 96 000 kgs.
REQUIRED
(a) Calculate the cost per unit of output in the month;
(b) Write up the process account, the normal loss (scrap) account and the abnormal loss or
abnormal gain account for the month.

171
WORK IN PROGRESS (WIP)
At the end of a period, there could be unfinished production in process. Unfinished work-in-
progress (or work-in-process) needs to be valued so that interim and periodic Profit and Loss
accounts can be prepared.
Unfinished production is valued using the concept of “equivalent units”. Closing stocks of work
in progress are converted to „equivalent units‟. An equivalent unit, as the name might suggest,
means the equivalent of one finished unit of output. If closing stock of 100 units is 50%
complete, they will be valued as 50 equivalent units.
In many processes, the direct materials are all input at the start of the process. If so, closing
work in progress has all of its direct materials and the units are unfinished only because the
processing work has not yet been completed.
In these situations, the valuation of output and closing stock is separated into a valuation per unit
for direct materials and a valuation per unit of conversion costs (direct labour and production
overhead), each based on a different calculation of equivalent units.
Units of finished output count as one equivalent unit each.
QUESTION 8
The input to Process A was 4 000 litres of material. Output was 3 800 litres and at the end of the
period 200 litres were still in progress. There is no loss in process.
Costs are K16 000 for direct materials, K7 920 for direct labour and K11 880 for absorbed
production overhead.
An estimate has been made of the degree of completion of the closing stock.
Estimate of degree of completion:
Materials 100% complete
Labour 80% complete
Overhead 80% complete
REQUIRED
Calculate the cost per equivalent unit and write up the process account for the period.
QUESTION 9
Input to process Y in June was 5 000 units of direct materials from process X, costing K27 500
and added materials costing K2 080. Direct labour costs in process Y were K4 000 and
production overhead was
K8 000. Output from the process was 4 000 units.

172
There were 1 000 units of closing stock, 100% complete for materials from process X and 40%
complete for added materials and conversion costs (labour and overhead). There is no loss in
process.
Added materials are of insignificant volume and are not measured in units.
REQUIRED
Calculate a cost per equivalent unit for the month and then draw up the Process Y account.
CONCLUSION
Process costing is a form of absorption costing used in processing industries. One key feature of
process costing is that any expected losses are not given any cost or value, except for any scrap
value they might have and costs per unit are calculate on the basis of expected output. If actual
output differs from expected output, there is abnormal loss or abnormal gain, which are given a
cost or value.
A second feature of process costing is that process costs have to be apportioned between finished
output and closing stock. The apportionment of costs is on the basis of equivalent units of work
done.
REVIEW DEFINITIONS
Normal loss – This is the expected amounts of loss in a production process. It is the level of loss
or waste that management would expect to incur under normal operating conditions.
Abnormal loss – This is the amount by which actual loss exceeds the expected or normal loss in
a process. It can also be defined as the amount by which actual production is less than normal
production. Normal production is calculated as the quantity of input units of materials less
normal loss.
Abnormal gain – This is the amount by which actual output from a process exceeds the expected
output. It is the amount by which actual loss is lower than expected loss.
Equivalent units – used to value units of incomplete stock, the equivalent of one complete unit.

173
UNIT 20
PROCESS COSTING: JOINT PRODUCTS AND BY-PRODUCTS
Learning Outcomes:
After studying this unit, students should be able to:
Distinguish between joint products and by-products;
Explain the treatment of joint products and by-products at the point of separation;
Apportion joint process costs using net realizable values and weigh/volume of output
respectively;
Discuss the usefulness of the cost and profit data for joint products; and
Evaluate the benefit of further processing.
THE NATURE OF JOINT PRODUCTS AND BY-PRODUCTS
A single process might produce a number of different products. For example, a chemical process
might involve a number of chemical inputs which given two different chemical liquids as output
and gas.
Quite often, different products produced by a single process might be given further separate
processing before they are ready for sale.
Example
A company might produce four items from a process, A B C and D. A, B and D are liquids and
C is a gas. Produce A is then put through a further process in order to make Product AA and
Product B is put through a different process to make Product BB.
Product C is sold in its current form without further processing. Product D has very little value
and is also sold without further processing.
Products A, B C and D are examples of joint products and a by-products from a single process.
Definitions
Separation point or Split-off point – In a process manufacturing operation is the point during
manufacture where two or more products are produced from a common process. Items produced
at the separation point are either sold in their current form or put through further processing
before sale.
Up to the separation point, the processing costs are common to all the products that are
subsequently produced. A task in process costing is to share the common process costs up to
separation point between the different products.

174
Definition
Joint products – These are separate products that emerge from a single process. Each of these
products has a significant sales value to the organization.
The key point to note about joint products is that they are all relatively significant to the
organization in terms of sales value.
By-products – A by-product is a product that is produced from a process, together with other
products, that is of insignificant sales value.
In this respect, a by-product is therefore similar to a joint product in that it is one of a number of
products output from a process. However, whereas joint products are all saleable products with
significant sales value, a by-product will usually have such a small selling price or be produced
in such small quantities that its overall sales value to the organization is insignificant.
On the basis of the above, joint products and by-products are both one of a number of products
produced by a process. The distinguishing feature between the two is whether or not they have a
significant sales value. If the sales value of the product is significant, it will be a joint product, if
not it will be a by-product.
Joint products and by-products are treated differently in cost accounting.
COSTING WITH JOINT PRODUCTS
Joint costs – Joint costs or common process costs are the costs incurred in a process that must be
split or apportioned amongst the products produced by the process.
When two or more joint products are produced in a common process, a method is needed for
sharing the common costs between the different products. For example, if a process costs K100
000 and produces three joint products X, Y and Z, how should the common costs of K100 000 be
shared out between the three products?
The answer is that a suitable basis has to be found for apportioning the joint costs.
METHODS OF APPORTIONING JOINT COSTS TO JOINT PRODUCTS:
There are two main methods of apportioning pre-separation (joint) costs between joint products:
Split the joint costs in proportion to the physical quantity, volume or weight of each
product;
Split the joint costs in proportion to their relative sales values.

175
QUESTION 1
A process produces the following joint products:
Product Quantity in kgs Selling price per kg
X 100 000 K1
Y 20 000 K10
Z 80 000 K2.25
The costs incurred in the process prior to the separation point of these three products were K240
000.
REQUIRED
Show how the joint costs would be apportioned to each product on the basis of:
(a) Physical quantity; and
(b) Relative sales value at the point of separation.
METHODS OF APPORTIONING JOINT COSTS TO JOINT PRODUCTS:
Net Realizable Value method
Definition
Net Realizable value – The net realizable value of a joint product is its sale value minus its
further processing costs after the point of separation.
QUESTION 2
Three joint products are produced from a common process:
Product X: 20 000 kgs
Product Y: 5 000 litres
Product Z: 10 000 litres
The joint costs of processing up to the point of separation are K166 000.
Product Z can be sold immediately after separation for K15 per litre. Product X needs further
processing, at a cost of K8 per kg, before it is sold for K20 per kg. Product Y also needs further
processing at a cost of K2 per litre, before it is sold for K7 per litre.

176
REQUIRED
(a) Calculate the cost per unit of each joint product up to the point of separation, if common
costs are apportioned between the products on the basis of net realizable value.
(b) Calculate the profit or loss per unit of each joint product.
QUESTION 3
A process produces two joint products X and Y. During the month of August, the process costs
attributed to completed output amounted to K122 500. Output of X and Y for the period were as
follows:
X 3 tonnes
Y 4 tonnes
REQUIRED
Calculate the cost attributed to each joint product using the weight basis of apportionment.
COSTING WITH BY-PRODUCTS
The costing treatment of by-products is different from the costing treatment of joint products.
Since by-products have very little sales value, it is pointless to try working out a cost and a profit
for units of by-product. By-products are incidental output, not main products.
Either of two accounting treatments is therefore used for a by-product and the methods are as
follows:
(a) Method 1 – Treat the income from the by-product as incidental income and therefore add
it to sales in the Profit and Loss Account;
(b) Method 2 – Instead of adding the income from by-product sales to total sales income in
the Profit and Loss Account, deduct the sales value of the by-product from the common
processing costs. The pre-separation costs for apportioning between joint products is
therefore the actual pre-separation costs minus the sales value of the by-product.
THE VALUE OF COST DATA AND PROFIT DATA WITH JOINT PRODUCTS
A cost per unit of joint product and a profit per unit can only be calculated by apportioning
pre-separation costs between the products. Pre-separation costs can be a very high
proportion (as much as 100%) of the total production cost of a joint product.
It is actually questionable whether the cost and profit information in such cases has much
value as management information.

177
Example
If a joint product appears to be making a loss, management cannot decide to stop
making the product. In order to carry on making the other joint products that are
making a profit, the loss-making joint product will have to be made as well.
Apportioning joint costs is arbitrary. The apportionment basis should be fair, but
entirely different costs and profits can be calculated for joint products, depending on
whether the physical quantity or the net realizable value method of apportionment is
used.
Since cost data and profit data are of questionable meaning and value, it can be
argued that where joint products are produced, management should monitor total
costs and total profits for all of the joint products together, instead of trying to analyse
costs and profitability for each produce separately.
EVALUATING THE BENEFIT OF FURTHER PROCESSING
A completely different costing problem arises when management consider what to do with joint
products after the point of separation. A joint product might be in a condition to sell at the point
of separation, but can also be processed further in order to sell for a higher price. In such cases,
management have to decide whether to sell the product immediately after the point of separation,
or whether to process the product further before selling it.
Evaluating the further processing decision for joint products introduces a different concept in
cost and management accounting.
It is assumed that further processing of products after the point of separation is independent ie. a
decision to process one joint product in no way affects the decision to process further the other
joint products.
The pre-separation costs of the common processing of the joint products are irrelevant to the
further processing decision. The joint costs are not affected by whether individual products are
further processed and are therefore not relevant to the decision under consideration.
In order to evaluate processing of the individual products, it is necessary to identify the
incremental costs and incremental revenues relating to that further processing, ie. the additional
costs and revenue brought about directly as a result of that further processing process.

178
QUESTION 4
The following data relates to products A and B produced from a joint process:
Quantity Sales price Further processing Sales price
Produced at split-off costs after further
Point processing
Kg K per kg K per kg
Product A 100 5 K280 plus K2 per kg 8.40
Product B 200 2 K160 plus K1.40 per kg 4.50
Common costs prior to the split-off point are K750.
REQUIRED
Determine as to whether each product should be sold at the split-off point, or whether it should
be processed further before sale.
CONCLUSION
The joint product further processing decision has introduced a new aspect of cost and
management accounting, namely the use of relevant cost and revenue information to help
management arrive at good appropriate decisions. Accounting for decision-making is based on
the use of relevant costing and also marginal costing.
Review Definitions
Joint product – This is a separate product produced from a joint process which has a significant
sales value.
By-product - This is a separate product that is produced incidentally from a joint process and
which has an insignificant sales value.
Split-off or Separation point – Before this point, joint products cannot be distinguished. Costs
at this point are therefore common and must be apportioned on some appropriate basis.
Net Realizable value – This is sales value less any further processing costs.

179
REVIEW QUESTIONS
1 Explain the difference between a joint product and a by-product.
2 Name and explain the three (3) methods of apportioning pre-separation process costs
between joint products.
3 With which of these three (3) methods is the percentage gross profit margin per unit the
same for all of the joint products?
Name and explain the two (2) methods normally used to account for by-products
180
UNIT 21
SERVICE COSTING
Learning Outcomes
After completing this unit, students should be able to:
Describe the characteristics of service costing;
Explain the practical problems that can arise with costing for services;
Identify situations where the use of service costing is appropriate;
Illustrate appropriate cost units that might be suitable for particular services and
Calculate the cost of service units.
WHEN TO USE SERVICE COSTING
Service costing is used when there is no physical product, to obtain a cost for each unit of service
provided. Note that stocks of services cannot be held.
When the service can be measured in standard units, costs can be charged to activities and
averaged over the units in order to obtain a cost per cost unit of service. Costing services in this
way is appropriate when the service can be expressed in a standardized unit of measurement.
For example, an accountant in practice would provide and individual service to each client, but
the service could be measured in man-hour units.
Services can be:
External services to a customer, for which a price is charged. Examples are the provision
of telephone and electricity services, consultancy, auditing services by a firm of
accountants, hotel services, travel services and so on.
Internal services within an organization can be any activity performed by one department
for another, such as machine repairs, services of an IT department, payroll activities and
so on.
SERVICE COSTS AND COST UNITS
Identification of Cost Units
A major problem in service industries is the selection of a suitable unit for measuring the service,
ie. In deciding what service is actually being provided and what measures of performance are
most appropriate to the control of costs. Some cost units used in different activities are given
below:

181
Type of Service Cost Unit
Electricity generation Kilowatt hours
Canteens and restaurants Meals served
Carriers Kilometers travelled: ton-kilometers carried
Hospitals Patient days
Passenger transport Passenger kilometers, seat kilometers
Accountancy Accountant-hour (man hour)
Where cost units are in two or more parts such as patient-days or passenger kilometers these are
known as composite cost units.
A service undertaking may use several different units to measure the various kinds of service
provided eg. A hotel with a restaurant and function rooms might use a different cost unit for each
different service:
Service Cost unit
Restaurant Meals served
Hotel services Guest days
Function facilities Hours rented
When appropriate cost units have been determined for a particular service, provision will need to
be made for the collection of the appropriate statistical data. In a transport organization this may
involve the recording of mileages day-by-day for each vehicle in the fleet. For this each driver
would be required to complete a log sheet. Fuel usage per vehicle and loads or weight carried
may be appropriate for the business.
COLLECTION, CLASSIFICATION AND ASCERTAINMENT OF COSTS
Costs will be classified under appropriate headings for the particular service. This will involve
the issue of suitable cost codes to be used in the recording and, therefore, the collection of costs.
Example
For a transport undertaking the main cost classification may be based on the following activities:
Operating and running the fleet
Repairs and maintenance
Fixed charges
Administration
Within each of these there would need to be a sub-classification of costs, each with its own code,
so that under „fixed charges‟, there might appear the following breakdown:

182
Road fund licences
Insurances
Depreciation
Vehicle testing fees
Others
In service costing, it is often important to classify costs into their fixed and variable elements.
Many service applications involve high fixed costs and the higher the number of cost units
produced, the lower the fixed costs per unit. The variable cost per unit will indicate to
management, the additional cost involved in the provision of one extra unit of service. In the
context of a transport undertaking, fixed and variable costs are often referred to as standing and
running costs respectively.
COST SHEETS
Definition
Cost Sheets - These are recorded costs for each service provided.
At appropriate intervals (usually weekly or monthly) cost sheets will be prepared by the costing
department in order to provide information about the appropriate service to management. A
typical cost sheet for a service would incorporate the following for the current period and the
cumulative year to date:
(a) Cost information over the appropriate expense or activity headings;
(b) Cost units statistics;
(c) Cost per unit calculations using the data in (a) and dividing by the data in (b). Different
cost units may be used for different elements of costs and the same cost or group of costs
may be related to different cost unit bases to provide additional control information to
management. In the transport organization, for example, the operating and running costs
may be expressed in per kilometer, per vehicle and per day terms.
(d) Analyses based on the actual cost units.
In service industries, as in industries with physical output, management accountants can
provide useful information by calculating the cost required to produce a cost unit.
SERVICE COST ANALYSIS IN SERVICE INDUSTRIES
Cost reports are derived from the cost sheets and other data collected. Usually costs are
presented as totals for the period, classified often into fixed and variable costs. It is impossible

183
to illustrate costing for every type of service, because each service has its own different
characteristics and different cost units.
QUESTION 1: POWER SUPPLY INDUSTRY
The following figures relate to two electricity supply companies:
Meter reading, billing and collection costs
Company A Company B
K000 K000
Salaries and wages of meter readers 150 240
Salaries & wages of Billing & collection staff 300 480
Transport and travelling 30 40
Collection agency charges - 20
Bad debts 10 10
General charges 100 200
Miscellaneous 10 10
600 1 000
Units sold (millions) 2 880 9 600
Number of consumers (thousands) 800 1 600
Sales of electricity (millions) K18 K50
Size of area (square kilometers) 4 000 4 000
REQUIRED
Prepare a comparative cost statement using suitable units of cost. Brief notes should be added,
commenting on likely causes for major differences in unit costs so disclosed.
QUESTION 2: TRANSPORT OPERATIONS
Ronny Plc makes ready-mixed cement and operates a small fleet of vehicles which deliver the
product to customers within its delivery area.
General data
Maintenance records for the previous five years reveal the following data:
Year Mileage of vehicles Maintenance cost
K
1 170 000 13 500
2 180 000 14 000
3 165 000 13 250
4 160 000 13 000
5 175 000 13 750

184
Transport statistics reveal the following data:
Vehicle No. of journey Average tonnage Average distance to
each day carried to customers customers (kilometers)
(tones)
1 6 4 10
2 4 4 20
3 2 5 40
4 2 6 30
5 1 6 60
There are five vehicles operating a five-day week, for 50 weeks a year.
Inflation can be ignored.
Standard cost data include the following:
Drivers‟ wages K150 each per week
Supervisor/relief driver‟s wage K200 per week
Depreciation is on a straight-line basis with no residual value
Loading equipment Cost K100 000, life 5 years
Vehicles Cost K30 000 each, life 5 years
Petrol/oil costs 20 ngwee per kilometer
Repairs cost 7.5 ngwee per kilometer
Vehicle licence cost K400 pa for each vehicle
Insurance costs K600 pa for each vehicle
Tyres cost K3 000 pa in total
Miscellaneous costs K2 250 pa in total
REQUIRED
You are required to calculate a standard rate per tone/kilometer of operating the vehicles.
SERVICE COSTING FOR INTERNAL SERVICES
Internal services may be set up as profit centres rather than cost centres in order to encourage
managers to be efficient and to enable comparison with external suppliers. For example, the IT
department, legal services and building repairs could all be operated as profit centres charging
internal departments for their services and calculating the notional profit made on their activities.

185
Costs of internal services can be determined in the same way as for service organizations and
may be used to measure the efficiency of departments or compare their costs with using sub-
contractors.
REVIEW TERMS
Service costing – costing approach used when there is no physical product.
Composite cost units – When cost units are in two or more parts, such as patient-days.
REVIEW QUESTIONS
1 Give some examples of cost units appropriate to service industries;
2 What is the function of a cost sheet?
3 What do you understand by the term service costing?

186
REVIEW QUESTIONS
1 Distinguish between Incremental budget and Zero based budget;
2 Distinguish between Fixed budget and Flexible budget;
3 Explain the Activity Budgeting and the means for its application in commerce and
industry;
4 List and explain the five (5) advantages of Continuous or Rolling budgets.
5 List and explain the five (5) disadvantages of Incremental budget.
BIBLIOGRAPHY/REFERENCES:
1 C Drury – Management and Cost Accounting, 7th
Edition;
2 T Lucey – Costing , 7th
Edition
3 Kaplan – Accounting for Costs
4 R Jenkins – Cost Accounting, 2nd
Edition
5 Horngren – Cost Accounting, A Managerial Emphasis; 11th
Edition
6 T Lucey – Management Accounting, 5th
Edition
7 C Drury – Management and Cost Accounting, 2nd
Edition.
---------END OF COST ACCOUNTING MODULE--------