chapter vi case studies in costing -...
TRANSCRIPT

Chapter VI
Case Studies in Costing
This chapter contains case studies of three applications of cost analysis to local governmentproblems. One is based closely on the actual records of a municipality, while the other twostudies were actually performed by the governments indicated. Each focuses on differentcost concepts and addresses different management problems.
The case study from Phoenix, Arizona focuses on avoidable costs — the most difficult ofthe cost concepts to apply in practice because of the risk of unintended side effects.Avoidable cost is difficult to calculate, but as this case study shows, the benefits thatknowledge of avoidable cost can yield — both financial and programmatic — can be verygreat.
The Fayetteville study describes how a small jurisdiction developed an hourly rate (insteadof a fixed, average rate) for a service it provided, by calculating first the total cost of theservice. This approach was appropriate because the service was used in different amountsby various persons. The hourly charge was therefore more equitable than a single chargelevied on all users.
The Dayton, Ohio case study, regarding the costs of instituting a new police service in thedowntown area, focuses on marginal cost. By isolating those costs that would be increasedor created by the decision to initiate the new service, the proper focus is provided formanagement decisions.
A Note On Report WritingIt is an unfortunate fact of life that many good ideas have been ignored because they wereexpressed poorly. Since the written word is the form of communication that reaches thelargest number of people in an average government, the ability to communicate effectivelyby an analyst or manager is directly related to his or her ability to write an effective report.
A well-written report should have the following characteristics:
• clarity,• completeness,• effective layout, and• intellectual honesty.
The report reader should never wonder what the writer is saying. Clarity of expression andcontent is essential. One approach to clarity of content is directness of writing style. Avoidthe passive voice; it is indirect and weak as a form of expression. Use the simplest wordsthat express the idea to be communicated. Be plain and lucid, never fancy.
For completeness, a report should be more than a ragbag of facts; the reader should be ableto determine that all appropriate elements are present. In addition, a report should be self-explanatory and immediately understandable; no background knowledge should be

assumed. (Thus, for instance, titles should be used rather than the names of the peoplecurrently holding the positions.)
When appropriate, a report should offer options. If consideration is being given to eitherthe establishment of a new service or the expansion of an old one, options should alwaysbe offered. When a new service is first considered, the “quantity” of the service isproblematic; offering degrees of service can help decision makers (the administration, thecouncil, and the public) to reach a consensus on the level of service needed to resolve theproblem satisfactorily.
An effective report is well laid out. The presentation should reflect the relative importanceand appropriate subordination of material. Details should be presented, but should berelegated to an appendix.
Effective reports generally begin with a brief summary, then provide backgroundinformation before they proceed to the body of the report. Most effective reports concludewith clear and unambiguous recommendations.
A report must be intellectually honest. Sources should always be cited. The degree towhich the report presents more than the writer's opinions should be clear to the reader. Allimportant limitations should be appropriately noted.
In a well written report, craftsmanship speaks from every line.

City of Phoenix, Arizona: A Case Study in Avoidable CostThe effective analysis of alternatives to the existing mode of delivery for a particular servicerequires the calculation of the changes in cost that will result from new ways of doingthings. The cost concept that applies to this situation is avoidable cost.
It is important to emphasize that, as a cost analysis concept, avoidable cost is the net resultof proposed changes. If a change results in an increase in one cost element such asequipment and a decrease in another such as personnel time, the avoidable cost is the net ofthe amount of the savings in wages and fringe benefits minus the expense of theequipment.
Determination of the actual avoidable cost in a given situation perhaps is the most difficultto perform of all the types of cost analyses that have been discussed. This is so because therange of considerations that must be included in this type of cost analysis is much greaterthan in the calculation of total cost. Every opportunity to save money should be examined;every requirement to spend money must be factored into the analysis. The latter aspect canbe particularly difficult, since governments are complicated organisms whose parts arefrequently interrelated in little-understood ways. Thus, the risk of costly, unintended sideeffects is always present when changes are made.
There are some principles that can be used to help avoid such undesirable surprises:
• Always be thorough in preparing an analysis (an incomplete analysis is wrong);• Always use conservative estimates (low on savings, high on costs); and• Have any important analysis reviewed by an informed but uninvolved party.
If these guidelines are followed, the risk of incorrect or incomplete analyses will bereduced.
Application of Avoidable Cost to Reduce Overtime CostsWhat follows is the report on an actual cost analysis conducted by the City of Phoenix,Arizona presenting the results of a six-month pilot test of a police/ court standby program.The goal was to reduce unnecessary court appearances for police officers and the attendantovertime costs.
Analysis of Police Court Standby ProgramCourtesy of City of Phoenix, Patrick Manion, Management and Budget Director.The six-month pilot test of the police court standby program has concluded and a decisionis needed on the extent to which the standby program should be implemented in the court's14 divisions.
This report presents an analysis of the police court standby program based on six monthsof experience. Police standby was tested in six divisions of the Phoenix Municipal Courton jury trial days from January 1980 to July 1980. The table below summarizes the resultsof the test program, and also projects its full-year impact for all 14 divisions.
During the six-month period, 1,326 trials were scheduled for the six court divisions, and2,087 police officers were subpoenaed. The number of trials held was 221, or 16 percentof those scheduled. Of those officers subpoenaed, 1,473, or 71 percent, were off duty atthe time of the trial. Off-duty officers on standby received a $15 fee which wassupplemented by an average minimum of $41 in overtime if the officer was summoned tocourt.

The court standby program produced cost savings of $26,000 for the test period. Of thistotal, $18,000 is attributable to jury trials and $8,000 to nonjury trials. The net annual costsavings projected if all 14 divisions used the standby program is $109,000.
SavingsDuring
TestPeriod
AnnualSavings
for All 14Divisions
Jury Trials $ 17 867 $ 83 328
Non-jury Trials 8 213 38 304
Total Savings 26 080 121 632
Less Cost of Court Clerkfor Police Court Liaison (13 000)
Net Cost Savings $ 108 632
BackgroundThe police court standby program was implemented to reduce unnecessary courtappearances for police officers and the overtime costs thereby incurred. Standbyprocedures involve verification of police availability and placement on standby status (oncall) prior to the trial date, and subsequent notification of release from standby or the needto appear in court on the trial date after proceeding to trial is assured.
Off-duty police officers earn a minimum of three hours of overtime pay for courtappearances. Off-duty officers placed on standby are eligible for a $15 standby fee,effective July 7, 1980. On-duty police officers called to court receive no additional earningsand are not replaced in the field.
Data for the above table were derived from Police Court Services records. These recordsinclude a list of the cases scheduled for each day, the offense, and the officers involved inthe case. From notations on these records it was possible to determine whether the casewas tried and the status of the officers involved. The data in the table reflect the informationderived from these records for the period January 2, 1980, through July 3, 1980.
DiscussionFor the purposes of this analysis, the $15 current standby fee was used to calculate costsavings rather than the $5 fee in effect during the pilot test. The rationale for thissubstitution is that the current standby fee is necessary for assessment of the present andfuture cost effectiveness of the program. Overtime costs were computed at $41 per courtappearance, a median police salary figure.
The data in the table reflect those cases scheduled for trial in the six test divisions. Thesecases include all jury-eligible cases and nonjury cases which, because of the practice andthe nature of the case, are scheduled for jury days. The distinction between jury andnonjury was made through references provided by the prosecutor's office. The jurycategory includes all jury-eligible cases.
Some of these may have involved the waiver of a jury trial for a trial before a judge. Suchcases could not be distinguished in the source documents.

The cost savings achieved through the standby program were computed by comparingactual standby costs and overtime costs, where applicable, to the overtime costs whichwould be incurred in the absence of a standby program.
Projected Full Year Cost SavingsProjection of the cost savings to all 14 divisions of the court for a 12-month periodindicated a potential net cost savings of $109,000. The current $15 standby fee was used inthe computation of potential cost savings. Projection of cost savings is based on theassumption that all officers entitled to the standby fee would claim it (in many instancesduring the pilot program police officers who were eligible for standby fees did not claimthem). Extension of the police standby program will require an additional Clerk II, toreplace the clerk trainee used during the six-month study, at a full-year cost of $13,000. Ifextension of the standby program is made only to jury cases, as proposed, the net full-yearcost savings for all 14 divisions would be about $7O,000.
Why Standby WorksOf the 1,326 trials scheduled, 221 or 16 percent were held. The difference between trialsscheduled and trials held is those cases which are rescheduled or dismissed, those forwhich warrants are issued, bonds forfeited, etc. The rela tionship between trials scheduledand trials held is fundamental to the achievement of cost savings through the standbyprogram. Under the standby program, an off-duty officer on standby assigned to a casewhich does not go to trial receives $15, resulting in a $26 savings over the standardovertime amount of$41; however, if the same case goes to trial, the cost is $56 ($15 plus$41) or $15 above the standard overtime amount. In order for the standby program to becost-effective, the number of off-duty officers not called to court must exceed the numbercalled.
Productivity Impact on PoliceOn-duty police officers subpoenaed for court appearances incur no additional costs inearnings or replacements. However, police productivity in the field is reduced through theabsence of these officers. On-duty police officers on standby, whose appearance in court isnot required, avoid this productivity reduction. The percentage of on-duty police officerswhich reflects this productivity impact is shown in the table below. Productivity gainswould equate to approximately $42,000 annually.
On-Duty Officers Subpoenaed
Subpoenaed Appeared Did NotAppear
Total 614 (100%) 133 (22%) 481 (78%)
Jury 314 (51%) 40 (30%) 274 (57%)
Nonjury 300 (49%) 93 (70%) 207 (43%)
Productivity Impact on CourtsCourt estimates indicate some reduction in court productivity because of delays inproceedings while awaiting the arrival of police officers on standby. These delays involvecourt staff time including judges, prosecutors, bailiffs, jurors, and witnesses. The delayattributable to the standby program and the cost in reduced court productivity have not beendocumented.
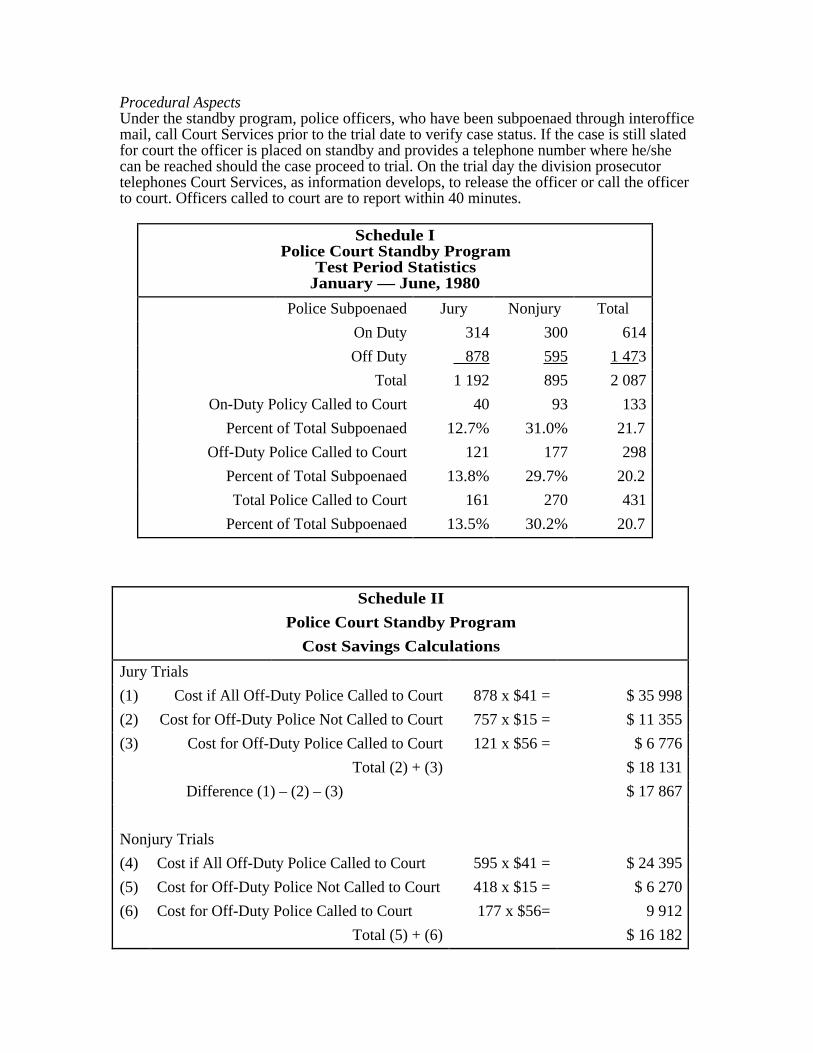
Procedural AspectsUnder the standby program, police officers, who have been subpoenaed through interofficemail, call Court Services prior to the trial date to verify case status. If the case is still slatedfor court the officer is placed on standby and provides a telephone number where he/shecan be reached should the case proceed to trial. On the trial day the division prosecutortelephones Court Services, as information develops, to release the officer or call the officerto court. Officers called to court are to report within 40 minutes.
Schedule IPolice Court Standby Program
Test Period StatisticsJanuary — June, 1980
Police Subpoenaed Jury Nonjury Total
On Duty 314 300 614
Off Duty 878 595 1 47 3
Total 1 192 895 2 087
On-Duty Policy Called to Court 40 93 133
Percent of Total Subpoenaed 12.7% 31.0% 21.7
Off-Duty Police Called to Court 121 177 298
Percent of Total Subpoenaed 13.8% 29.7% 20.2
Total Police Called to Court 161 270 431
Percent of Total Subpoenaed 13.5% 30.2% 20.7
Schedule II
Police Court Standby Program
Cost Savings Calculations
Jury Trials
(1) Cost if All Off-Duty Police Called to Court 878 x $41 = $ 35 998
(2) Cost for Off-Duty Police Not Called to Court 757 x $15 = $ 11 355
(3) Cost for Off-Duty Police Called to Court 121 x $56 = $ 6 776
Total (2) + (3) $ 18 131
Difference (1) – (2) – (3) $ 17 867
Nonjury Trials
(4) Cost if All Off-Duty Police Called to Court 595 x $41 = $ 24 395
(5) Cost for Off-Duty Police Not Called to Court 418 x $15 = $ 6 270
(6) Cost for Off-Duty Police Called to Court 177 x $56= 9 912
Total (5) + (6) $ 16 182

Difference (4) – (5) – (6) $ 8 213
Projected Full-Year Savings for 14 Divisions:
Jury Trials
Test Period Savings for Jury Trials: $17,867
$ 17,867 / 6 divisions / 6 months = $496/division/month
$496 x 14 divisions x 12 months = $ 83,328
Nonjury Trials
Test Period Savings for Nonjury Trials: $8,213
$8,213 . 6 divisions . 6 months = $228/division/month
$228 x 14 divisions x 12 months = $ 38,304
Annual savings for Jury Trials = $ 83,328
Annual savings for Nonjury Trials = $ 38,304
$121 632
Less Additional Costs for a Clerk 11 in Police Court Services Detail (13,000)
Net Annual Savings $108 000
In practice, officers are often unable to report within the allotted time because of thecommuting time required or other tactical problems. Additionally, officers indicate that theyare sometimes not promptly notified of release from standby. And prosecutors, at times,are unable, because of the press of court business, to notify Court Services of casedispositions as they occur.
The standby program requires the full support and the active cooperation of all participantsin order to function properly. Periodic communication between police, prosecutors, and thecourt would assist in the identification of problems and the development of solutions in atimely fashion. In addition, the following suggestions may strengthen procedures:
Prompt commencement of court proceedings and early decisions on case action couldincrease overall program efficiency.Those officers who do not live within a 40-minute radius of court should be granted moretime or not placed on standby.Additional phone lines may be needed in Court Services to efficiently respond to the peakvolume of calls. Court Services may also need to implement additional steps to ensure thatall officers receive prompt notification of case disposition.
RecommendationsStaff recommends that the chief presiding judge, under the authority of Chapter 11, Article111, Section 2-83, City Code, implement the court proposal to extend the police courtstandby program to all divisions of the court for jury trials and reduce standby programcoverage for nonjury cases at an adequate level to determine if the proceduralrecommendations will alleviate the delays now encountered in some trials. Staff further

recommends that the procedural suggestions outlined above be implemented by the courtand the police department respectively. Police Court Services should continue to collectdata elements necessary for analysis of standby program results. Such an analysis shouldbe conducted after six months of experience with the extended program to assure costsavings warrant continuation.

Fayetteville: A Case Study in Pricing a ServiceMany local governments face the problem of determining an equitable service charge: acharge that is as fair to the recipient of the service as it is to the taxpayers who mustsubsidize the difference between the charge and what it actually costs to provide theservice. Unfortunately, local government accounting practices which focus on guaranteeingcompliance with applicable local, state, and federal charters and laws generally do so at theexpense of developing methodologies for using accounting data for management purposes.As a result, many governments set fees arbitrarily, without an effective estimate of theactual cost of providing the service.
Since a number of states now require that the charge for a service be based on the cost ofproviding the service, it is increasingly important that local officials develop the ability toprice services in a fashion that reflects all the costs of providing the service and yet is notunduly burdensome.
Recently, a small municipal government undertook a study designed to cost and price amajor activity of its planning function. While the name of the city has been changed, thiscase study is closely modeled on the actual process used to determine an appropriate fee forthat planning service. Many of the data that are presented come directly from citydocuments, and the discussions of city activities reflect the views of the city officialsinvolved.
BackgroundThe City of Fayetteville is located 25 miles from a large metropolitan center. Its 21,000residents are served by several bus lines and by a rapid transit station located in thedowntown section of the city. Incorporated in the late 1960s, Fayetteville's 13 square milearea is spread over a number of sometimes steep hills.
As a matter of policy, the city contracts out nearly all services, including police, fire, andpublic works. Thus, although the budget is nearly $3.5 million, the city has only 17employees, of which nine are full-time positions.
The single most significant factor in the decision to incorporate was a desire for greaterlocal control over land use due to dissatisfaction with the county's handling of thisfunction. Since incorporation, the city has maintained an active in-house planning functionwhich devotes considerable attention to overseeing land use.
Pricing the Processing of Land Use EntitlementApplicationsDue to the fiscal constraints brought on by declining local revenues and reduced state aid,the city decided to establish a service charge for processing land use entitlementapplications, a major activity of the planning function. Local officials decided that, since theamount of time devoted to processing these applications varied considerably, an equitableservice charge should be based on the number of hours spent processing a givenapplication. City officials felt, however, that the rate per hour should include more than justthe direct labor charge.
Since the planning activity paid rent, mileage expenses, utilities, and so forth, each ofwhich supported all planning functions, it was appropriate that a portion of these costs beborne by those who submitted land use applications. Further, the planning function itselfwas supported by other municipal activities which were financed by other city departments.

It was decided that the city should recover a reasonable share of its overhead costs, as wellas the direct costs of providing the service.
The city used the process outlined below to determine the fee to be charged.
I Determine the Governmental Overhead
• Determine overhead activities• Establish if it is necessary to directly allocate a part of an overhead activity to the
planning function• Determine the bases for each allocation of overhead
II Determine the Departmental Overhead
• Establish the service functions of the department• Determine if any part of departmental expenditures should be “transferred” to
governmental overhead• Determine the bases for allocating departmental overhead to service functions• Determine how the individual service functions benefit from overhead activities
III Set A Total Cost Rate
• Determine the number of hours to be directly charged• Determine total overhead to be recovered• Determine the service's cost• Calculate the average hourly direct wage• Calculate the average hourly overhead cost• Total the direct and overhead rates
Exhibit 17City of Fayetteville Annual General
Fund Expenditure Summary
Department AnnualExpenditure
City Council $ 3 900
General Administration 483 480
City Attorney 50 000
Planning 198 925
Organization Support 1 200
Parks and Recreation 446 700
Open Space 1 500
Traffic 34 350
School Crossing Guards 11 200
Senior Citizens 41 675

Meals for the Elderly 8 000
Community Development 207 000
Community Promotion 13 000
Elections 3 000
Insurance 39 200
Police 795 200
Parking Enforcement 19 650
Crime Prevention 4 700
Engineering 82 600
Public Works 844 150
Walkways 100 000
Parking 39 030
Total 3 428 460
The basic approach consisted of three steps: 1) estimating the amount of organizationaloverhead to be recovered by the service charge; 2) estimating the amount of departmentaloverhead to be recovered by the service charge; and 3) estimating the number of hoursdevoted to the service. Dividing the number of hours devoted to processing land useentitlement applications into the total of organizational and departmental overhead to berecovered by the service charge gives the hourly overhead rate which, when added to thedirect hourly charge for time devoted to the applications, gives the hourly charge forprocessing applications.
The first step in estimating organizational overhead was to examine the total city budget(Exhibit 17). The budget presented is a gross budget in the sense that all municipalactivities are presented in the general fund budget. The few additional funds that the citymaintains to fulfill legal requirements are for accounting purposes only and thus reflectactivity already presented in the general fund. In addition, the city maintains no enterpriseactivities.
The examination of the total city budget suggested several possibilities for furtheridentification of overhead activities as seen below. Before any of these activities wereactually included in the estimate of organizational overhead, each was reviewed todetermine whether the activities being financed were actually of a general benefit to theorganization as a whole, rather than of particular benefit to one or a few municipalfunctions.
Governmental Overhead Activities(First Estimate)
City Council $ 3 900
General Administration 483 480
City Attorney 50 000
Organizational Support 1 200
Elections 3 000

Insurance 39 200
City officials who were knowledgeable about the budget quickly pointed out that both thegeneral administration function and the city attorney function contained elements thatperhaps were inappropriate for inclusion in general organizational overhead because theywere principally of benefit to specific functions; their inclusion in these budgets had beenprimarily for the sake of convenience.
The budget for the city attorney consisted of two components: a flat retainer ($16,000) foropinions rendered to the city during the year, and an estimate of the cost of the time thatwould be devoted to the city's litigation. City officials pointed out that since most of thelitigation was related to planning activities, a major fraction of this $34,000 expense shouldnot be considered general overhead at all but rather should be included in planningoverhead. The city attorney provided an estimate that 70 percent of litigation expenses wereplanning related, so it was decided to transfer $23 800 ($34 000 x .7) to planningoverhead.
City officials indicated that the budget for general administration (Exhibit 18) containedseven items that were of significant and measurable benefit to the planning function:telephone, postage, office supplies, rent, small tools and equipment, equipmentmaintenance, and equipment rental. It was decided to allocate a portion of each of thesecosts to the planning function based on estimates of the benefits received. Telephoneexpenses were allocated based on the number of handsets (planning had six of a total of10); rent was allocated based on space used (planning used 45 percent of the space). Theremaining items were lumped together and allocated based on the number of employees inplanning (five of a total of 17), since they were perceived to be a function of the activity ofindividuals working for the city. The results are shown below. Total expenditures of$17 860 are indicated as applicable to the planning function.
City of FayettevilleAdjustments to General Administration Expenses
Expense Item AllocationBase
AllocationFraction
TransferredAmount
Telephone # of handsets 6/10 $3 000
Rent area 9/20 $6 210
Postage # of employees 5/17 $ 1 500
Office Supplies # of employees 5/17 $4 400
Tools/Equipment # of employees 5/17 $150
EquipmentMaintenance
# of employees 5/17 $650
Equipment Rental # of employees 5/17 $1 950
Total $17 860
EXHIBIT 18City of Fayetteville
General Administration Expenditures

Permanent Employees $135 430
Temporary Employees 500
Overtime 500
Fringe Benefits 28 000
Telephone 5 000
Old Age Survivors Insurance 7 700
Publications 750
Postage 7 000
Office Supplies 13 000
Conferences and Meetings 3 000
Auto Mileage 3 500
Rent 13 800
Membership Dues 5 000
Small Tools and Equipment 400
Contractual Services 8 000
Equipment Maintenance 2 200
Equipment Rental 8 000
Miscellaneous 1 500
Legal Advertising 1 500
Employee Training 200
Commissions Day 3 500
City Office Relocation 200 000
Micro-Computer/Word Processor 20 000
City ManagerRecruitment/Employment 15 000
Total $483 480
The general administration budget also contained a sum of $200,000 for the purchase of anew city hall. Since the benefit that would accrue from this expenditure would be receivedover a long period of time and should be recovered in the future as depreciation, it wasdecided to remove this item from general organizational overhead. (Also, since this is acapital expenditure and not an operating expenditure, it should be removed from the budgetas well.) The resulting organizational overhead — shown below — is $341,820.
Governmental Overhead Determination
(Second Estimate)
City Council $ 3 900
General Administration 483 480

City Attorney 50 000
Organizational Support 1 200
Elections 3 000
Insurance 39 200
Total $580 780
Less Reductions
from General Administration 217 860
from City Attorney 23 800
Plus Additions
General Plan Amendments 2 700
Net General Overhead Activities$ 341 820
The next step in the costing process was to determine the overhead portion of the planningbudget that should be recaptured with the proposed service charge. After examining theplanning budget, three items were deemed inappropriate for full inclusion in planningoverhead for the applications processing function: permanent employees, contractualservices, and general plan amendments.
Planning Department ExpendituresWith Items Included
Permanent Employees $ 122 500
Overtime 2 000
Fringe Benefits 18 400
Electricity 400
OASDI 7 650
Publications 125
Conferences and Meetings 1 000
Auto Mileage 1 350
Rent 1 300
Membership Dues 300
Contractual Services 40 000
Miscellaneous 350
Legal Advertising 350
Employee Training 500
General Plan Amendments 2 700
Total $ 198 925
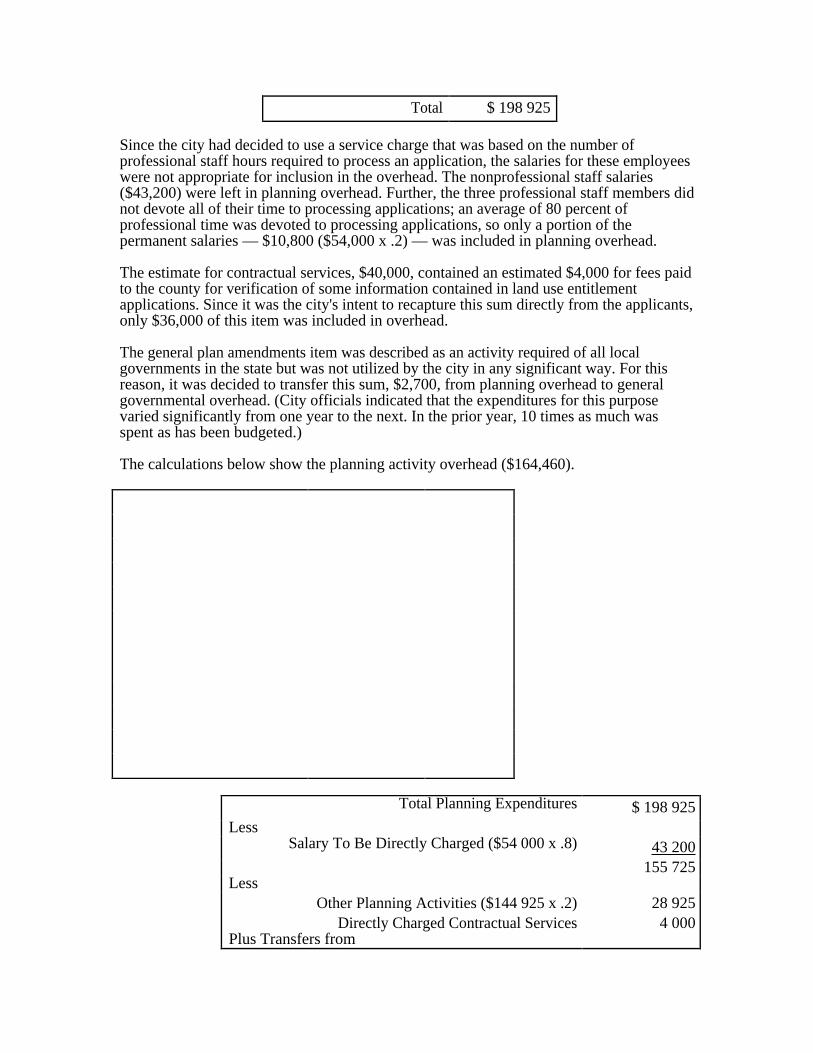
Since the city had decided to use a service charge that was based on the number ofprofessional staff hours required to process an application, the salaries for these employeeswere not appropriate for inclusion in the overhead. The nonprofessional staff salaries($43,200) were left in planning overhead. Further, the three professional staff members didnot devote all of their time to processing applications; an average of 80 percent ofprofessional time was devoted to processing applications, so only a portion of thepermanent salaries — $10,800 ($54,000 x .2) — was included in planning overhead.
The estimate for contractual services, $40,000, contained an estimated $4,000 for fees paidto the county for verification of some information contained in land use entitlementapplications. Since it was the city's intent to recapture this sum directly from the applicants,only $36,000 of this item was included in overhead.
The general plan amendments item was described as an activity required of all localgovernments in the state but was not utilized by the city in any significant way. For thisreason, it was decided to transfer this sum, $2,700, from planning overhead to generalgovernmental overhead. (City officials indicated that the expenditures for this purposevaried significantly from one year to the next. In the prior year, 10 times as much wasspent as has been budgeted.)
The calculations below show the planning activity overhead ($164,460).
Total Planning Expenditures $ 198 925Less
Salary To Be Directly Charged ($54 000 x .8) 43 200155 725
LessOther Planning Activities ($144 925 x .2) 28 925
Directly Charged Contractual Services 4 000Plus Transfers from

General Administration 17 860City Attorney 23 800
Total $164 460
The total overhead allocated to the planning function is the sum of the planning activity'sshare of the organizational overhead and the actual planning overhead ($164,460). It wasdecided that a reasonable basis for allocating general governmental overhead would be theproportion of total expenditures for the planning function in relation to total cityexpenditures net of overhead and net of capital expenditures (for the new city hall). Theresulting base for the allocation is $3,428,460 minus $341,820 minus $20O,000, or$2,886,640.
The total expenditures for the planning function amount to $237,885, so the ratio ofplanning expenditures to total expenditures is 8.24 percent, which becomes the overheadallocation rate for the planning function. The actual dollar amount of general governmentoverhead allocated to the planning function (Exhibit 19) is $28,166 (8.24 percent x$341,820).
The sum of general government overhead and planning overhead is $192,626 ($28,166plus $ 164,460). Note that not all of this sum should be recovered from the service chargefor processing land use entitlement applications, because a portion of planning activities isdevoted to unrelated matters. Planning officials estimated that only 20 percent of personneltime was not devoted to processing the applications, so it was decided to recover 80 percentof the overhead figure, or $154,101 ($192,626 x .8).
The final step in actually setting an hourly rate for the service charge was to determine thetotal hours that would be billed, 4,992 (2,080 x .8 x 3), and to establish the average directlabor cost per hour, $8.65 ($43,200 / 4,992). The fee was set to recover $154,101 inoverhead; therefore, each hour of service was billed at the sum of the direct plus overheadrate per hour. Since the hourly overhead rate was $30.87 ($154,101 / 4,992), the correcttotal per hour charged was $39.52 ($8.65 + $30.87).
EXHIBIT 19Allocation of General Government Overhead
Planning Expenditures $198,925
Less
General Plan Amendments 2,700
Plus Expenses from
General Administration 17,860
City Attorney 23,800
Planning Expenditures Total $237,885

Allocation Percentage:
€
$ 237 885
($3 428 460 - $341 820 - $200 000) ×100= 8.24%
Allocation Amount:
$341,820 x 8.24% = $28,166
Analyzing The ProcessThe Fayetteville case study contains several features that are worthy of further comment.The principal resources used in conducting the cost analysis were the annual budget and theknowledge of officials involved in the function. Most cost analyses will tend to rely onthese resources — as well as on any additional sources of information that may be availablein the particular circumstances.
Since a budget is only a collection of estimates, what should be done if, at the end of theyear, the estimates used to set the rate are found to differ significantly from actualexpenditures? If the service is offered in future years, it is possible to calculate the amountof over- or undercharge and roll it into the rate for the next year. Thus, if the estimatedexpenditures turned out to be too high, the same item in the next year's budget would bereduced to reflect this change.
Alternatively, this year's rate might be based on last year's actual financial results instead ofon budget estimates. When this approach is used, however, major increases inexpenditures that should be recovered by the service charge will not be reflected in theservice charge until a year has elapsed.
One other concern is the potential effect of the imposition of a $39.52 per hour charge on aservice that had been free. Since providing the service is a major activity in the planningoffice, a sharp swing in demand could have many repercussions.
City officials had regarded some percentage of this activity as unnecessary, becauselandowners were in the habit of filing frivolous contests of applications made by theirneighbors. These contests required repeated rehearings, re-examinations, and publichearings, and they delayed the application approval process considerably. (For example,one contest of the calculation of the slope of a plot of land resulted in nine months ofhearings and deliberations.) It was hoped by city officials that the imposition of a fee wouldreduce the number of such contests.
City officials planned to reevaluate the service charge after three and six months to assessits impact. If major changes developed in the demand for the service, the causes of thesechanges and their effects on the planning office would be assessed at that time.

The City of Dayton, Ohio: A Case Study In Costing NewServices — Marginal Cost AnalysisWhile the most effective cost concept for examining the prices of existing municipalservices is total cost, the cost concept that is most useful in examining new or expandedservices is marginal cost. Marginal cost concentrates attention on the additionalexpenditures required to deliver a new service or to expand an existing one. In particular, ifoverhead costs are relatively fixed, the marginal cost is the total additional cost fordelivering a new or expanded service.
A report by Paul Mamerow, a management analyst for the City of Dayton, Ohio, follows.It discusses cost and feasibility data for the possible implementation of a mounted horsepatrol in downtown Dayton. Interestingly, while the report is a marginal cost analysis, theterm marginal cost never appears in it.
September 17, 1974
Marginal Cost Analysis
TO: Paul R. Woodie, AdministratorOffice of Management and Budget
FROM: Paul W. MamerowSUBJECT: Mounted Horse Patrol
Recently, the city manager requested OMB to provide cost and feasibility data for amounted horse patrol in the downtown area. The following report supplies relevant costdata and briefly outlines two alternatives for implementation.
In preparing this report, OMB contacted both the International City Manager's Associationand the International Chiefs of Police Association for assistance. OMB further made contactwith the Cleveland, Philadelphia, Lakewood, Colorado, and Washington Park PoliceDepartment (all of which have mounted police) and with several local stabling concerns.
Part I of this report suggests possible objectives for a mounted patrol in Dayton. Part IIbriefly outlines two alternatives for implementation of the mounted patrol program. Part IIIpresents cost information for each implementation alternative. Cost detail is supplied in theAppendix.
I. ObjectivesThe following represent those objectives which apply to a mounted patrol program inDayton. These objectives were arrived at through review of several mounted patrolprograms operating in cities as large as, or larger than Dayton, and through consultationwith Mr. Cur ran as to his expectations.
The objectives are stated as follows:
• To increase police visibility in the downtown area, and/or in City Parks and theriver corridor when necessary.
• To enhance the innovative image of downtown Dayton.• To provide effective traffic control to congested downtown areas, or to areas of
special assignment (e.g., sporting events).

• To provide effective crowd management for parades and other social functionsdowntown, and in areas of special assignment.
It should be noted that the Parking Control Aid Program was implemented to partiallyaccomplish the first objective of increasing police visibility. Furthermore, the ParkingControl Aids also provide enforcement of parking restrictions in the downtown area, thuscontributing partially to the accomplishment of the third objective. It should also be notedthat because the major function of the mounted patrol is to increase on-the-street policevisibility, the mounted patrol, like the present walking patrol, will not answer radiodispatches, especially to in-building locations.
II. ImplementationImplementations of either of the two mounted patrol alternatives outlined below willinvolve certain programmatic costs pertaining to the purchase, outfitting, and maintenanceof horses, the training of horses and riders, the purchase of uniforms, and street cleaning.Total costs for each alternative are outlined in Part III of this report.
Not included in program cost is the cost of hiring new police personnel, since bothalternatives assume the utilization of personnel already working the downtown area.Mounted patrolmen would remain under the supervision of present sergeants.
Alternative A: Daytime-Weekday PatrolThis alternative would provide two mounted patrolmen during the day, Monday throughFriday. Such a program would require two police officers, and the purchase of threehorses. The mounted officer would patrol primarily an area bounded by Mounted Avenueand Fifth Street to the North and South, and Jefferson and Ludlow Streets to the East andWest.
This alternative would accomplish during the daytime the objectives of increasing policevisibility downtown, enhancing Dayton's innovative image, and providing traffic controland crowd management when needed.
The total cost of this program alternative is $20,650. This program alternative does notrequire expanded street cleaning operations since the patrol will be operative on weekdaysonly and this coincides with existing clean-up schedules.
Alternative B: Six-day, Day and Night PatrolThis alternative would provide four mounted patrolmen, Monday through Saturday, twoworking during the day and two working in the evening. Such a program would requirefive police officers and at least six horses.
Mounted officers would patrol primarily the downtown district as outlined above.However, those mounted patrolmen scheduled for evening patrol could be assigned toprovide support for Dayton Hydroglobe (Eastwood Lake) Parks, or to areas congested byheavy traffic or crowds when necessary, or to ceremonial functions.
This program alternative would accomplish, during the daytime and night, and onSaturdays, the objectives of increasing police visibility downtown, of enhancing Dayton'sinnovative image, and of providing traffic control and crowd management to the downtownarea, as well as to areas of special assignment. This alternative represents a total programcost of $38,225.
III. Cost

The following represents annual costs for the two implementation alternatives outlined inSection II.
Purchase & Fitting ofHorse
Alternative A Alternative B
Purchase of horses $1 200 $2 400
Riding gear 560 1 400
Maintenance
Feed 2 190 4 380
Bedding 36 72
Farrier (blacksmith) fees 600 1 200
Veterinarian fees 125 250
Stable rental 900 1 800
Stable cleaning & grooming 4 000 -10 465 4 000 - 10 465
Training
Training of horses 600 1 200
Training of riders 1 850 1 850
Miscellaneous
Trailer 950 950
Uniforms 1 140 2 850
Street Cleaning Costs - 9 405
Total Program Cost $14 151 - $20 616 $31 757 - $38 222
Should you have any questions concerning this matter, please advise.
APPENDIX I: Cost Detail
HorsesCost is computed at $400 per horse. This estimate is derived from quotes by local stableowners and several police departments currently employing mounted patrol.
Riding gearfor fiveriders:
for two riders:
saddle with fittings $ 885 $ 354
bridles with bits 265 106
pads 80 32

brushes and curries 35 14
breast collars 135 54
Total $ 1 400 $ 560
FeedCost is computed at approximately $2 per horse per day. This estimate is a roughcomposite figure derived by several estimates advanced by local stabling concerns andseveral police departments employing mounted patrol. Estimate given here is somewhathigher than those received by OMB, in order to account for rising grain costs.
BeddingDaily cleaning of stalls for six horses requires approximately two loads of sawdust permonth at approximately $3 per load.
Farrier (blacksmith) feesHorses working pavement require new shoes approximately once every six weeks. One setof four borium shoes is prices at approximately $25.
Veterinarian feesfor six horses: for three horses:
Tetanus toxoid (1) $ 36 $ 18Flu and strangles (1) 60 30
Worming (2) 84 42Floating of teeth (1) 42 21Min. diagnostic fees _ I
Total $ 250 $ 125
Stable RentalCommissioner Curran has indicated that the Montgomery County Fairground hascommitted their stables to the City for use in this program. Cost is computed at $25 per stallper month.
Stable Cleaning & GroomingThe fairground does not provide feeding, bedding or grooming services. The upperestimate is arrived at by computing cost of hiring a stable hand (Grade 112) to do the work.The lower figure is the estimated cost of letting the work out on a contractual basis tofairground personnel.
Training of horsesCost is estimated at $40 per month for a five-month period. (Estimate supplied by Mrs.Tressler of Montgomery County Fairground).
Training of ridersCost for group-rate training is computed as follows: (Estimate supplied by Mrs. Tressler ofMontgomery County Fairground)
10 hours classroom training at $5/hr. $ 50.00120 hours riding training at $15/hr. 1 800.00
Total $ 1 850.00
Trailer

Used, two horse trailer - $950
Uniform CostCost per patrolman supplied by the Lakewood Department of Public Safety, Lakewood,Colorado.
Summer Uniform Cost for One MountedPatrolman
Boots at $50 x 2 = $ 100
Spurs at $15 x 1 = 15
Pads at $65x 3 = 195
Gun, Belt, Holster, etc. at $60x 1= 60
Lightweight Jacket at $45x 1 = 45
Total $ 415
Winter Uniform Cost for One MountedPatrolman
Felt Hat at $25 x 1 = $ 25
Down Coat at $100 x 1 = 100
Rain Slicker at $30 x 1 = 30
Total $ 155
Total Summer and Winter Uniform Expense$570
Street Cleaning OperationPresent street cleaning operations span a five-night, Sunday-to-Thursday-night work week.To accommodate a horse patrol active six days a week, street cleaning operations should beshifted to encompass a Monday-to-Friday night work week, and an additional four-hourSaturday night work shift should be added. Cost figures below represent additional time-and-a-half wage cost, including fringes, for a 48-hour work week.
Equipment Operator (2) $ 2 005
Laborer (Grade 112) 1 733
Equipment Operator (3) (Sweeper) 2 173
1/2 Equipment Operator (3) (Flusher-six months a year) 1 086
Supervisor (Grade 24) 2 408
Total $ 9 405
A Case Study In Evaluating Contracting OutThis case study uses the techniques that have been examined in the preceding chapters todevelop procedures to evaluate the relative merit of performing a service in-house orcontracting it out to the private sector. In addition, a case study reviews the evaluation ofthree bids for building-cleaning services. It demonstrates that fluctuation in work volumecan affect the desirability of a unit cost bid.
The county1 receives a proposal to contract out its building cleaning services for $3.25 persquare foot for any of three possible units:
• for a single county building;• for all county-owned structures in one quarter of the county; or• for all county-owned structures in the county.
In the first case, the building in question is an animal shelter with 10,000 square feet ofarea to be cleaned which currently uses the services of two fulltime custodians. The presenttotal (direct plus indirect) cost to the county for cleaning this facility is $4.67 per squarefoot.
In the second case, the contractor offers the same per square foot charge for cleaning the809,800 square feet of county space in the northern section of the county.
In the third case, the contractor offers to clean the entire countywide space of 1,691,500square feet for the same $3.25-per-square-foot charge.
The desirability of accepting any one of the proposals depends on the amount of money thecounty will save, and which option will be less than the current total cost to the county,since not all of the total cost will be avoidable. Thus, in deciding which, if any, of the bidsthe county should accept, it is vital to determine first how much of the current cost can beeliminated by contracting out. To do this, the county’s total cost for cleaning must beanalyzed. Then it must be determined how much of this cost will be avoidable if:
• Only a single structure is contracted out;• A section of the county is contracted out; or• The entire county is contracted out.
Avoidable Cost: One Building (Case One)The total in-house cost for cleaning one 10,000-square-foot building is $4.67 for eachsquare foot — considerably more than the $3.25 per square foot the vendor proposes tocharge. From the county’s perspective however, the key question is: if the cleaning of thissingle structure is contracted out, how much of the $4.67 per square foot cost will thecounty be able to avoid? If the county could avoid $4.00 per square foot of this cost, then itwill save $.75 per square foot — the difference between the new county cost of $3.92($3.25 + $.67) and the current county cost of $4.67. If the county could only avoid $2.00per square foot of its current cost, however, the county would actually lose money bycontracting out because the new cost per square foot would be the UNavoidable cost
1 What follows is excerpted from a case study of the financial aspects of a make or buy decision that wasprepared by the Audit Division of the Auditor-Controller’s Office of the County of Los Angeles, California.The author is indebted to them for permission to use this material.

($2.67 per square foot) plus the contract cost ($3.25 per square foot), or $5.92 per squarefoot.
In order to determine the avoidable cost, information is needed on the direct and indirectcosts of the service and on how they are calculated. Case One below shows a breakdownof the county costs associated with the animal shelter. As indicated, all of the direct costcould be saved by contracting out, but none of the indirect cost could be saved, since noneof the overhead activities would be significantly altered by contracting out one building andeliminating two custodial positions.
The County’s Indirect CostsFour levels of county overhead are shown in the following table: division, branch,department, and countywide. Each division is responsible for cleaning specific countystructures, with all four divisions reporting to one branch — building cleaning. TheDepartment of Building Services itself has two other branches.
A multileveled county organization would typically use a step-down allocation processsimilar to the one discussed in Chapter 4. In this case, it was decided to use an allocationprocess based on salaries and wages instead of one based on a percentage of the budget (afairly common choice). Thus, the overhead entries in the full cost column are all based onthe $20,000 of direct salaries and wages for cleaning the structure; for example, the $1,683of branch overhead is calculated by multiplying the branch overhead rate of 8.413 percenttimes the $20,000 of direct salaries.
Case One: 10,000 square feet
Type of Costs FullCost
AvoidableCost
Direct Costs:Salaries and Wages $20,000 $20,000
Employee Benefits (@21.25%) 4,250 4,250Services and Supplies 2,000 2,000
Direct Cost Subtotal $26,250 $26,250Indirect Cost:
Division Overhead (@57.508%) $11,502 $0Branch Overhead (@8.413%) 1,683 0
Department Overhead (@22.259%) 4,452 0
Countywide Overhead(@13.958%)
2,792 0
Indirect Cost Subtotal $20,429 $0Total Cost $46,697 $26,250
Cost Per Square Foot $4.67 $2.63
Make Or Buy?Under the circumstances it would not be in the financial interest of the county to contractout the cleaning of the two buildings in question since it would incur a new cost (for thecontract) of $3.25/sq. ft. and would only save $2.63/sq. ft. ($26,250 in avoidable cost

divided by 10,000 sq. ft.). Under these conditions the county would be best advised tocontinue providing the service with in-house personnel.
On The Other Hand...To only look at numbers is to ignore a number of issues that can be fully as important asthe dollars and cents. Without attempting to suggest the answers, a few questions forconsideration, are:
To look only at numbers, however, is to ignore several issues that can be as important asthe dollars and cents. Without attempting to suggest the answers, a few questions thatmight be raised are:
• Will the county be required to provide a significant cash payment for fixed assets inthe near future if it continues to provide the service in-house?
• Are labor saving devices available?
• Are the necessary number of employees already hired? If not, contracting outprovides one method for the county to maintain a reduced work force, which, in thelong run, may be more economical.
• Is this full cost comparison between county services and private sector services($4.67 per square foot versus $3.25 per square foot) an indication that managementat Building Services needs to review supervisor/staff ratios, productivity, etc., or isthe price offered by the private sector unrealistic (a “low ball” bid to gain access tothe market)? Does the comparison indicate that certain costs on a countywide basisneed to be reduced through management actions?
Avoidable Cost: The Northern Section (Case Two)In the second case, the vendor proposes to clean the northern section of the county(equivalent to two divisions) for the same rate of $3.25/sq. ft. What are the avoidable costsin this situation?
In the second case, the vendor proposes to clean buildings in the northern section of thecounty (two divisions) for the same rate of $3.25 per square foot. What are the avoidablecosts in this situation?
Note that:
• direct costs are much larger because of the greater area proposed to be contractedout (809,800 square feet compared to 10,000 square feet);
• division overhead is presented as salaries, wages, and benefits for divisionpersonnel rather than as a rate since it can be considered as a direct cost of cleaningthe two divisions;
• although branch, department, and countywide overhead rates are unchanged, thelarger actual dollar amounts reflect the larger size of the program underconsideration; and

• avoidable costs are now possible at division, branch, department, and countywidelevels.
The savings of $544,181 in salaries and wages and $115,638 in employee benefits (for atotal savings of $659,819) is now possible because, if the entire workload of two divisionsis contracted out, the contractor will be providing his own support and the county will nothave to.
The savings of $544,181 in salaries and wages and of $115,638 in employee benefits —
for a total savings of $659,819 — is possible because, if the entire work load of the twodivisions is contracted out, the county will not have to provide support services for thesedivisions.
With such a large portion of the work of the branch being considered for contracting out, itis natural to inquire if all of the support staff still would be needed. The county determinedthat positions for two training coordinators and one secretary would no longer be
Case Two: 809 800 square feet
Types of Costs FullCost
AvoidableCost
Direct Costs:
Service Provision
Salaries and Wages $1 147 353 $ 1 147 353
Employee benefits (@21.250%) 243 813 243 813
Services and Supplies 400 000 400 000
Subtotal $ 1 791 166 $ 1 791 166
Division Costs
Salaries and Wages $ 544 181 $ 544 181
Employee benefits 115 638 115 638
Services and Supplies 0 0
Subtotal $ 659 819 $ 659 819
Direct Cost Subtotal $ 2 450 985 $ 2 450 985
Indirect Cost:
Branch Overhead (@8.413%) $ 142 309 $ 61 000
Department Overhead (@22.259%) 376 519 35 000
Countywide Overhead (@13.958%) 236 104 100 000
Indirect Cost Subtotal $ 754 932 $ 196 000
Total Cost $ 3 205 917 $ 2 646 985
Cost Per Square Foot $ 3.96 $ 3.27

necessary. The savings from this proposed action — $61,000 — are listed in the branchline of the avoidable cost column.
The $35,000 savings at the departmental level arise from the fact that one accountantposition and one payroll clerk position at this level would be unnecessary. The eliminationof the work of two divisions would also result in a savings of $100,000 in space costs thatwere included in the countywide overhead.
Make or Buy?
The total avoidable cost is now $2,646,985 or $3.27 per square foot ($2,646,985 .809,800 square feet). Thus, if the county contracts out the cleaning function in the tworegions, it will save $.02 per square foot, or $16,196 ($.02 times 809,800 square feet).
Given the problems inherent in a massive contracting out effort, the savings indicated seemtoo small to justify the effort — unless a multi-year contract were under consideration and itcould be shown that the savings in future years would be significantly greater. Since ourcase study contains no such indication, the most likely result of this analysis — all otherthings being equal — would be to continue to provide the service in-house.
On the Other Hand...
The consideration listed at the end of the preceding case apply to this case as well. Inaddition:
• What would the county do with the direct labor force to be eliminated? Layoffs mayresult in higher unemployment benefits costs or severance costs. Absorption mayincrease net county cost unless the positions had to be filled in any circumstance.
• What additional costs for monitoring vendor compliance with contractualobligations will be incurred by the county? Will these additional costs offset anypotential savings?
• Can the contractor provide the quality of service required? The vendor earned aprofit cleaning animal shelters at $3.25 per square foot. However, the northernsection of the county includes several hospitals. The cost for cleaning a square footof a hospital is significantly higher than that for an animal shelter. Did the contractorconsider this in the estimate? If not, will the contractor be able to continue inbusiness for the duration of the contract while providing the required level ofservice?
• What will the county do with its fixed assets previously utilized in the northernsection?
• Could adoption of a contract for the northern section of the county stimulate theremaining in-house cleaning force to be more productive and stimulate competitionbetween the vendor and the county employees, or would the adoption bedetrimental to the work force morale?
Avoidable Cost: The Entire County (Case Three)

In the third case, contracting out the cleaning of all county structures (1,691,500 squarefeet), it is possible to gain greater savings since it becomes possible to eliminate even moreoverhead support costs.
In this case, the dollar figures for direct cost, division overhead, branch overhead,department overhead, and countywide overhead are all higher than the previous cases dueto the increased scope of the work proposed. More importantly, all avoidable costs increasebecause the county will not be obliged to provide as much support to the cleaning effort. Inparticular, branch overhead is now completely avoidable because the contractor is assumingthat responsibility as part of the contract. However, the avoidable costs for departmentoverhead and countywide overhead are less than the respective full costs because both thedepartment and the county have fixed obligations such as leases, which will not beeliminated because of the contract.
Case Three: 1,691,500 square feet
Types of Costs Full Cost Avoidable Cost
Direct Cost:
Service Provision
Salaries and Wages $ 2 145 817 $ 2 145 817
Employee benefits (@21.250%) 455 986 455 986
Services and Supplies 950 000 950 000
Subtotal $ 3 551 803 $ 3 551 803
Division Costs
Salaries and Wages $ 1 017 745 $ 1 017 745
Employee benefits 216 271 216 271
Services and Supplies 0 0
Subtotal $ 1 234 016 $1 234 016
Branch Cost
Salaries and Wages $ 219 506 $ 219 506
Employee benefits 46 645 46 645
Services and Supplies 0 0
Subtotal $ 266 151 $ 266 645
Direct Cost Subtotal $ 5 051 970 $ 5 051 970
Indirect Cost:
Department Overhead (@22.259%) $ 753 057 $ 600 000
Countywide Overhead (@ 13.958%) 472 209 350 000
Indirect Cost Subtotal $ 1 225 266 $ 950 000
Total Cost $ 6 277 236 $ 6 001 970
Cost Per Square Foot $ 3.71 $ 3.55

Make or Buy?The avoidable cost in this case is $6,001,970, or $3.55 per square foot ($6,001,960 /1,691,500 square feet). This figure for savings compares favorably to the cost ofcontracting out the service ($3.25 per square foot) and leads to an assumed savings of$507,450 ($0.30 per square foot savings times 1,691,500 square feet). This savings isconsiderably larger than the savings calculated in the previous case, mostly because of theincreased per-square-foot savings (from $0.02 per square foot to $0.30 per square foot)and partly because of the increased number of square feet involved (from 809,800 to1,691,500). Under the circumstances, contracting out would appear to merit furtherinvestigation.
On the Other Hand...Additional considerations to be factored into the final decision include the considerationsfrom the preceding cases and the following questions:
• If the vendor fails to fulfill the contractual obligations, is the county prepared toassume the function again?
• What is the total cost of the service over the life of the contract versus in-house costif the proposed contract exceeds one year?
• What is the vendor’s track record for delivery of quality service, financialcondition, etc.?
In the final analysis, contracting out a service is a complicated management problem thathas a significant financial component and several other major components, such aspersonnel and quality of service, that cannot be ignored. Only when all relevant factors areincluded in the decision process is the resulting decision likely to be the best one possible.