university of kansas • spring 2014 • eecs811 green...
TRANSCRIPT

G R E E N C O M P U T I N G R E S E A R C H P R O J E C TU N I V E R S I T Y O F K A N S A S • S P R I N G 2 0 1 4 • E E C S 8 1 1
T E A M : G R E E N S C R E E N
A L E X O Y L E R B H A R AT H PA D M A N A B H A N R O B H A N E Y R YA N K I E F E R

O B J E C T I V E
Research possible applications of green computing:
• Data center and overall energy efficiency
• Disposal of electronic waste and recycling
• Telecommuting
• Virtualization of server resources
• Thin client solutions
• Use of open source software
Development of new software to address green computing for internal use and potential sale to other organizations.
The budget for the project is $500,000, and the goal is to provide an extensive report, including detailed financial analysis and recommendations for which green computing technologies to implement.
2

P R O J E C T I N T E G R AT I O N M A N A G E M E N T

4
P R O J E C T M A N A G E R E VA L U AT I O N

5
F I N A N C I A L A N A LY S I S

6
P R O J E C T C H A R T E R

P R O J E C T S C O P E M A N A G E M E N T

R E Q U I R E M E N T S
• 20 potential project ideas
• Aggregated research for 20 potential projects
• Final project proposals 1-4
• Project presentation
• Weighted decision matrix
• Reference material collection
• Business case
• Chart data
• Financial analysis
• Project request form generation
• Use formatting standards
8

9
S C O P E S TAT E M E N T
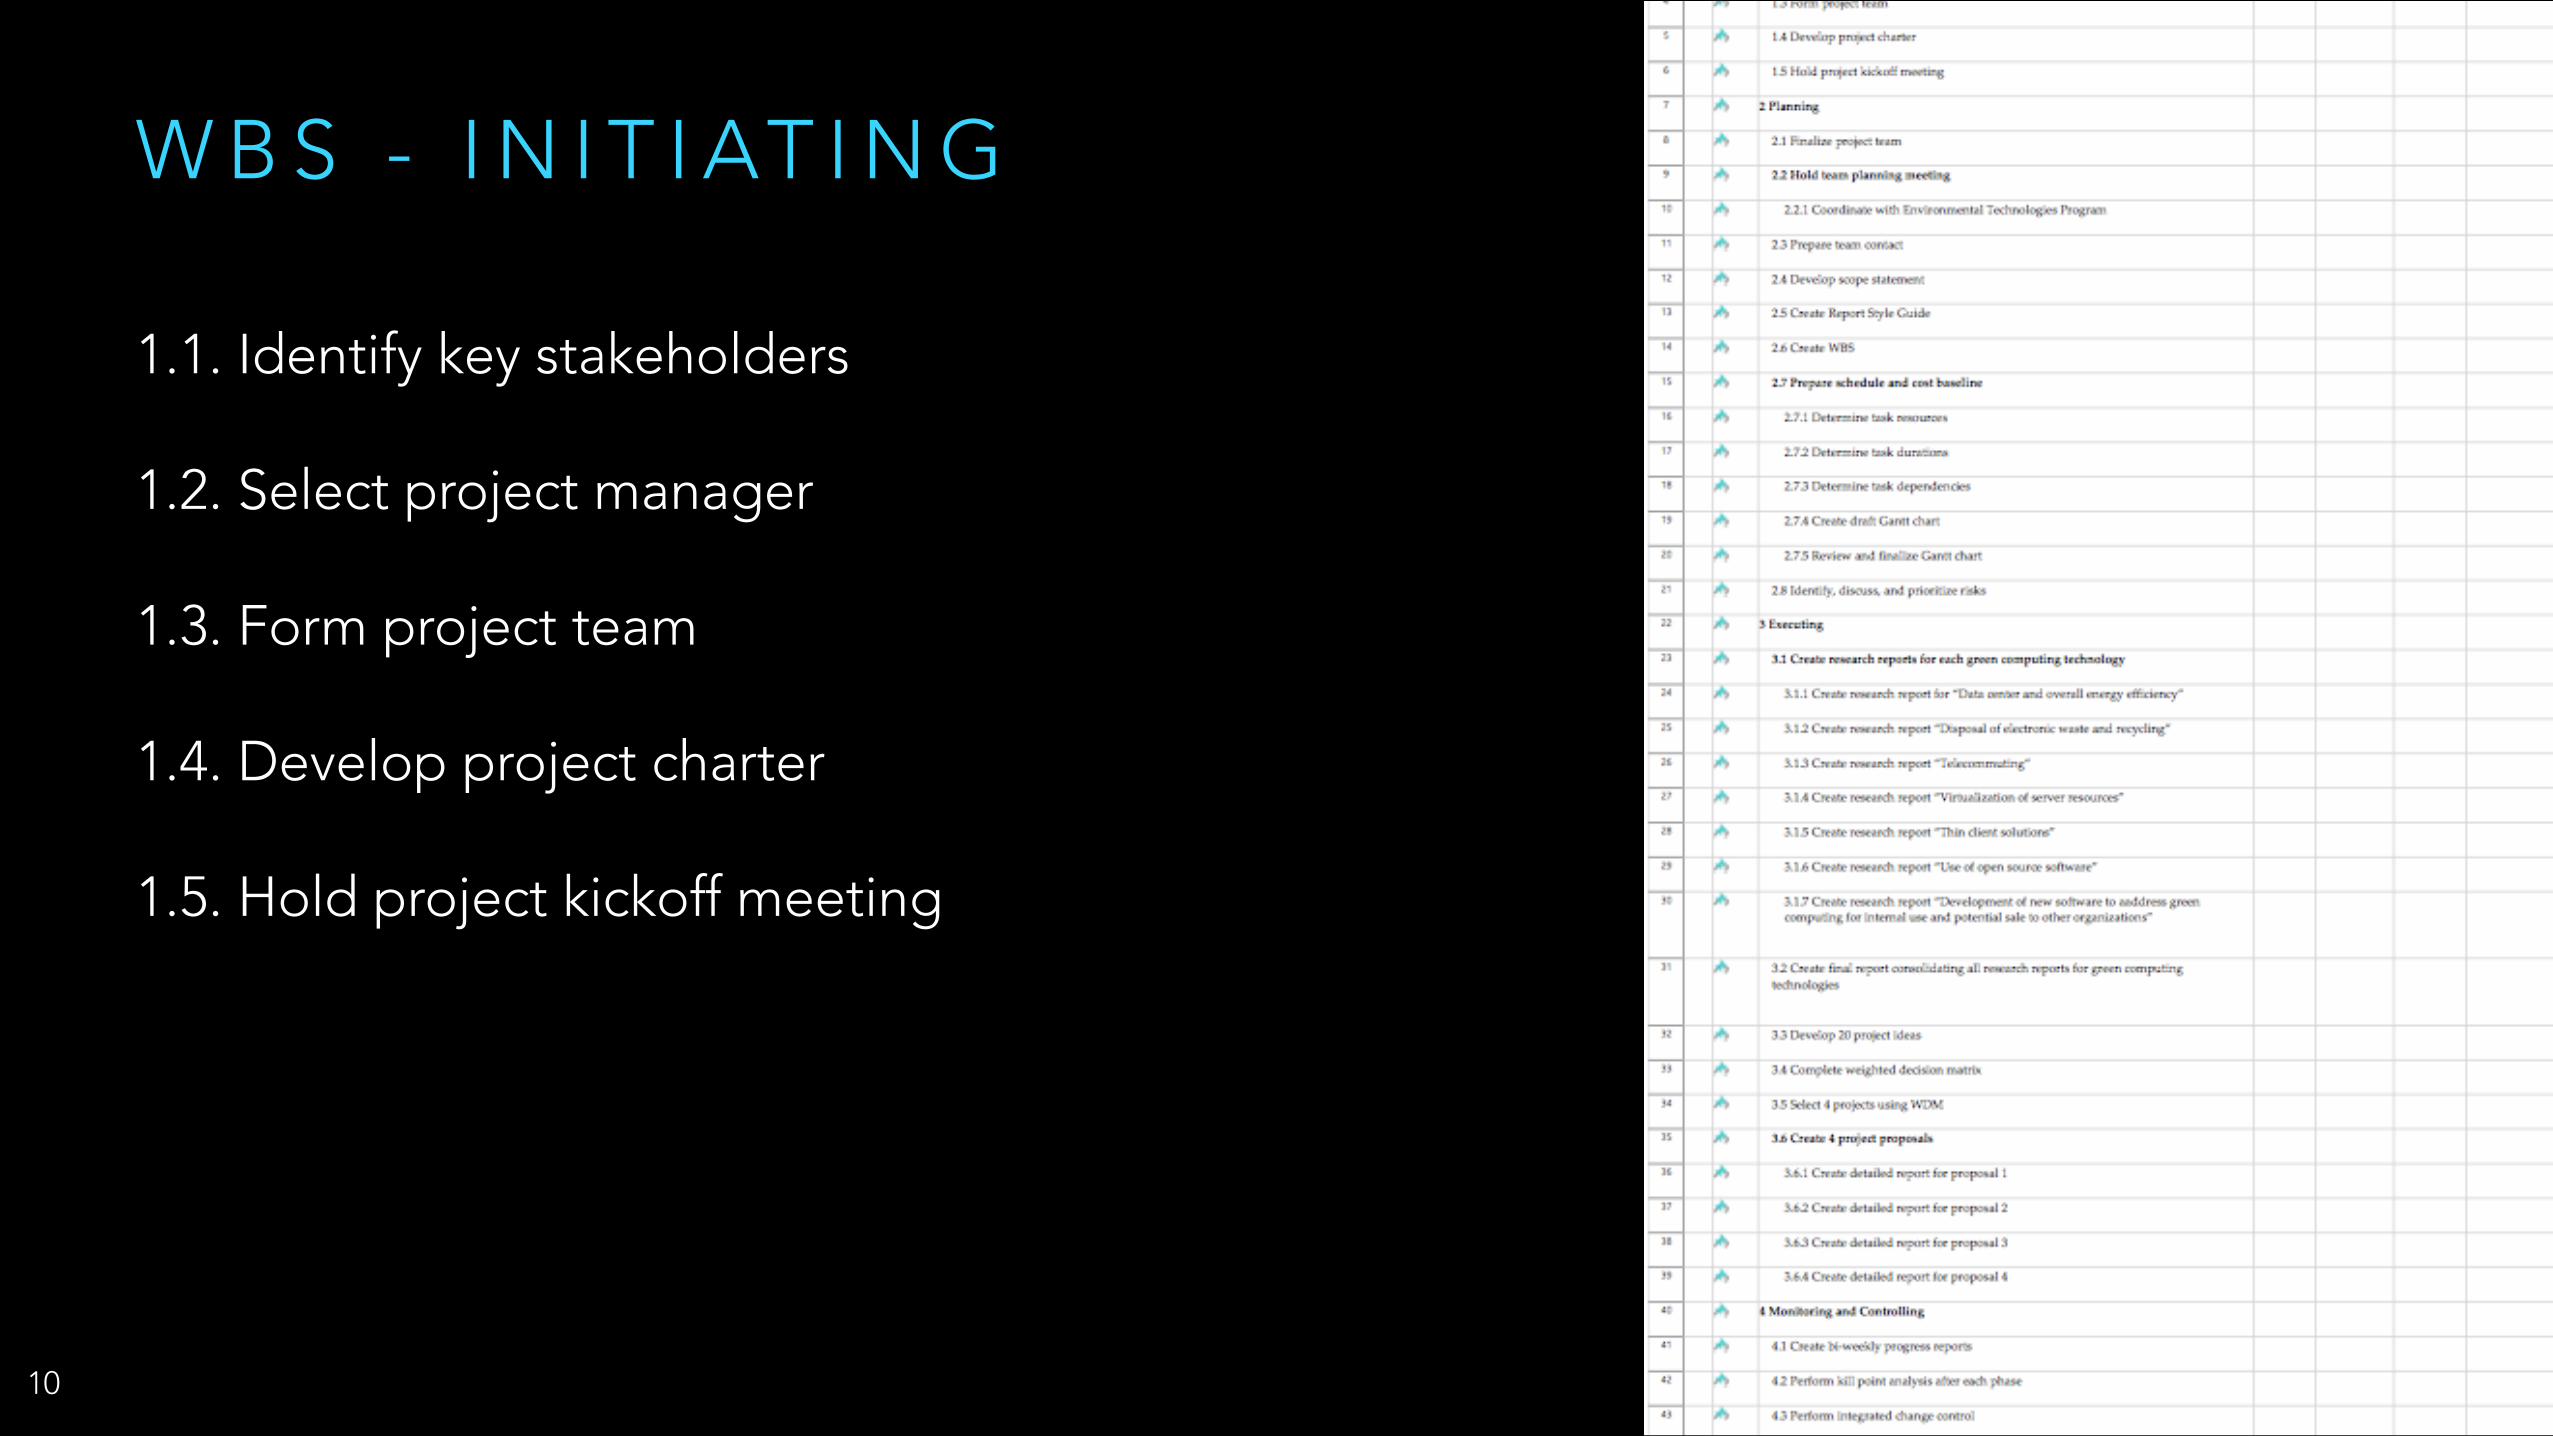
W B S - I N I T I AT I N G
1.1. Identify key stakeholders
1.2. Select project manager
1.3. Form project team
1.4. Develop project charter
1.5. Hold project kickoff meeting
10

W B S - P L A N N I N G
2.1. Hold team planning meeting
2.2. Prepare team contact
2.3. Develop scope statement
2.4. Create WBS
2.5. Prepare schedule and cost baseline
2.6. Determine task resources
2.7. Determine task durations
2.8. Determine task dependencies
2.9. Create draft Gantt chart
2.10. Review and finalize Gantt chart
2.11. Identify, discuss, and prioritize risks
11

W B S - E X E C U T I N G
3.1. Create research reports for each green computing technology
3.2. Create final report consolidating all research reports for green computing technologies
3.3. Develop 20 project ideas
3.4. Complete weighted decision matrix
3.5. Select 4 projects using WDM
3.6. Create 4 project proposals
12

W B S - M O N I T O R I N G & C O N T R O L L I N G!
4.1. Create bi-weekly progress reports
4.2. Perform kill point analysis after each phase
4.3. Perform integrated change control
13

W B S - C L O S I N G
5.1. Prepare final project report
5.2. Prepare final project presentation
5.3. Lessons learned
14

P R O J E C T T I M E M A N A G E M E N T

16
P R O J E C T M I L E S T O N E S
1. Finalizing the project team, completion of the project schedule
2. Identification of 20 potential projects
3. Selection of the four final projects
4. Completion of the final proposal

• Crashing
• Fast Tracking
• Contingency Reserve
• Budget Increase
• Schedule Increase
17
C O N T I N G E N C Y S T R AT E G I E S

P R O J E C T C O S T M A N A G E M E N T

19
C O S T E S T I M AT E S
Assumptions:
A burdened labor rate of $100/hour for Project Manager, $90/hour for Teresa, James, and Le, and $80/hour for Matt. Also, $200/hour for outsourced labor.

20
C O S T B A S E L I N E
Month 1: $ 27,260 Month 2: $ 27,120 Month 3: $ 40,780 Month 4: $ 68,506 Month 5: $ 90,451 Month 6: $ 85,835 Month 7: $ 21,100 TOTAL : $361,052

21
P R O J E C T S TAT U S
PV: $160,000
EV: $150,000
AC: $180,000
!
CV = EV – AC = -$30,000
SV = EV – PV = -$10,000
CPI = EV/AC = 83%
SPI = EV/PV = 94%
EAC = BAC/CPI = $602,409

P R O J E C T Q U A L I T Y M A N A G E M E N T

2 3
Q U A L I T Y S TA N D A R D S
• Financial analysis will be performed using models programmed in MS Excel to ensure consistency, thoroughness, and accuracy
• Data for financial analysis will be explicit and traceable to source material
• All research will be based on material from peer-reviewed, professional sources
• The project report decision matrix will be programmed in MS Excel to ensure accuracy
• Sensitivity (“what-if”) analysis performed in MS Excel for a usable portrait of potential financial risk and rewards
• Monthly report delivered to Ben and Ito 3 business days before the monthly face-to-face meeting

2 4
Q U A L I T Y T O O L - F L O W C H A R T
C R E AT I N G B I - W E E K LY P R O G R E S S R E P O R T S A N D U P D AT I N G P R O J E C T S C H E D U L E

P R O J E C T H U M A N R E S O U R C E M A N A G E M E N T

M Y E R S - B R I G G S T Y P E I N D I C AT O R
2 6

M Y E R S - B R I G G S T Y P E I N D I C AT O R
2 7

M Y E R S - B R I G G S T Y P E I N D I C AT O R
2 8

M Y E R S - B R I G G S T Y P E I N D I C AT O R
2 9

M B T I S U I TA B I L I T Y F O R R E S E A R C H P R O J E C T S
3 0

3 1
R E S P O N S I B I L I T Y A S S I G N M E N T M AT R I X

P R O J E C T C O M M U N I C AT I O N S M A N A G E M E N T

• Team Collaboration
• Individual Strengths
• Project Milestones
33
C O M M U N I C AT I O N C H A L L E N G E S

P R O J E C T R I S K M A N A G E M E N T

3 5
R I S K R E G I S T E R

3 6
R I S K R E G I S T E R

3 7
P R O B A B I L I T Y I M PA C T M AT R I X
R I S K 6
R I S K 5
R I S K 4
R I S K 2 R I S K 3
R I S K 1
Low: 1-3Medium: 4-6High: 7-10
Scale:
1. Technology not identified 2. Inaccurate final report 3. Internal support reduced 4. Too many solutions 5. Selling of product 6. Team conflicts
Risks:

3 8
P O S I T I V E R I S K R E S P O N S E S T R AT E G Y
Positive Risk: The project team identifies more than four technologies to formalize
Response Strategy: Re-evaluate the weighted decision matrix and add additional weighting metrics in order to better identify the most valuable technologies to implement
Time Estimate: One week with 80 hours of effort
Cost Estimate: 40 hours for PM at $100/hr plus 40 hours for team member at $90/hr = $7,600

3 9
N E G AT I V E R I S K R E S P O N S E S T R AT E G Y
Negative Risk: Internal support for the project is reduced from key executive stakeholders
Response Strategy: Project manager will begin holding regular meetings with the lead team to ensure that the project’s successes are articulated and quantified
Time Estimate: 2 hours prep and 1 hour presentation per week for project manager for remainder of project duration
Cost Estimate: 3 hours per week at $100/hr = $300/wk for project duration. For 6 months, 15 weeks = $4,500

P R O J E C T P R O C U R E M E N T M A N A G E M E N T

41

42
P R O J E C T S TA K E H O L D E R M A N A G E M E N T

4 4
P O W E R / I N T E R E S T G R I D

T H A N K Y O U !
T E A M : G R E E N S C R E E N
A L E X O Y L E R B H A R AT H PA D M A N A B H A N R O B H A N E Y R YA N K I E F E R