university of groningen quality management in the ... · pdf file8 farming practices of...
TRANSCRIPT

University of Groningen
Quality management in the Pangasius export supply chain in VietnamKhoi, Le Nguyen Doan
IMPORTANT NOTE: You are advised to consult the publisher's version (publisher's PDF) if you wish to cite fromit. Please check the document version below.
Document VersionPublisher's PDF, also known as Version of record
Publication date:2011
Link to publication in University of Groningen/UMCG research database
Citation for published version (APA):Khoi, L. N. D. (2011). Quality management in the Pangasius export supply chain in Vietnam: the case ofsmall-scale Pangasius farming in the Mekong River Delta Groningen: University of Groningen, SOMresearch school
CopyrightOther than for strictly personal use, it is not permitted to download or to forward/distribute the text or part of it without the consent of theauthor(s) and/or copyright holder(s), unless the work is under an open content license (like Creative Commons).
Take-down policyIf you believe that this document breaches copyright please contact us providing details, and we will remove access to the work immediatelyand investigate your claim.
Downloaded from the University of Groningen/UMCG research database (Pure): http://www.rug.nl/research/portal. For technical reasons thenumber of authors shown on this cover page is limited to 10 maximum.
Download date: 18-05-2018
8 Farming Practices of Pangasius Pond Aquaculture in Vietnam
8.1 Introduction
The objective of this chapter is to analyze the farming practices of Pangasius production. As discussed in sections 4.3.2 and 4.3.3, we conducted multiple-case studies31 and a survey to assess the primary processes at the small-scale farm level. The survey results aim at obtaining the statistics and comparison between farming practices. The case study results aim reaching an explanation for differences among cases. This chapter is limited to the pond farming system in Pangasius aquaculture (see section 2.3 for an illustration and description of this system).
8.2 Personal characteristics of Pangasius farmers
As mentioned in chapter 2, major Pangasius production areas in the MRD are An Giang, Dong Thap, and Can Tho provinces (Son et al. 2002; Sinh et al. 2006; Khoi, 2007). The interviewees in the case study and survey are Pangasius farmers living and working in one of these provinces as described in chapter 4. They are divided into three groups: (1) independent farmers, (2) fishery association (FA) members, and (3) APPU members (see section 4.3.3). In the MRD, approximately 15,000 households are involved in Pangasius production (VASEP, 2006), of which are roughly 1,000 members of the fishery association and 32 members of APPU. Table 8.1 provides the personal characteristics of the Pangasius farmers among these three groups based on the survey results (Survey 1, 2008).
The data show that there are some significant differences exist between the three groups. Although the APPU model was established only three years ago, APPU members have on average the longest experience in Pangasius culture among the groups, with an average of 11 years. Moreover, APPU members have the
31 The multiple-case studies are based on Khoi et al. (2008), “Farming system practices of seafood production in Vietnam: the case study of Pangasius small-scale farming in the Mekong River Delta,” ASEAN business Case studies, Center for ASEAN studies, No. 27, Antwerpen, Belgium.

Quality Management in the Pangasius Export Supply Chain in Vietnam
118
highest education level of all three groups, which indicates that they acquire knowledge in advanced techniques more easily than other farmers. Table 8.1 Personal characteristics of the interviewed pond Pangasius farmers
Independent farmers (N=100)
FA members (N=70)
APPU members (N=30)
Total (N=200)
Mean 42.51* 46.73* 38.17* 43.34
Minimum 22 28 29 22
Maximum 65 74 56 74
Age
Std. Deviation 10.194 9.888 7.125 10.070
Mean 2.34* 1.76* 3.57* 2.32
Minimum 1 1 3 1
Maximum 5 4 5 5
Education levela
Std. Deviation 1.085 0.690 0.817 1.093
Mean 4.9** 4.49** 5.3** 4.82
Minimum 2 2 3 2
Maximum 12 7 8 12
Family members
Std. Deviation 1.541 1.359 1.643 1.514
Mean 7.08* 10.13* 11.03* 8.74
Minimum 2 4 8 2
Maximum 30 33 15 33
Farming experiences
Std. Deviation 4.950 4.736 2.659 4.884 a1=primary school, 2=middle school, 3=high school, 4=college, 5=University *, **: differences between three groups are significant at 1% and 5%, respectively
Source: Survey 1, 2008
8.3 Farming practices
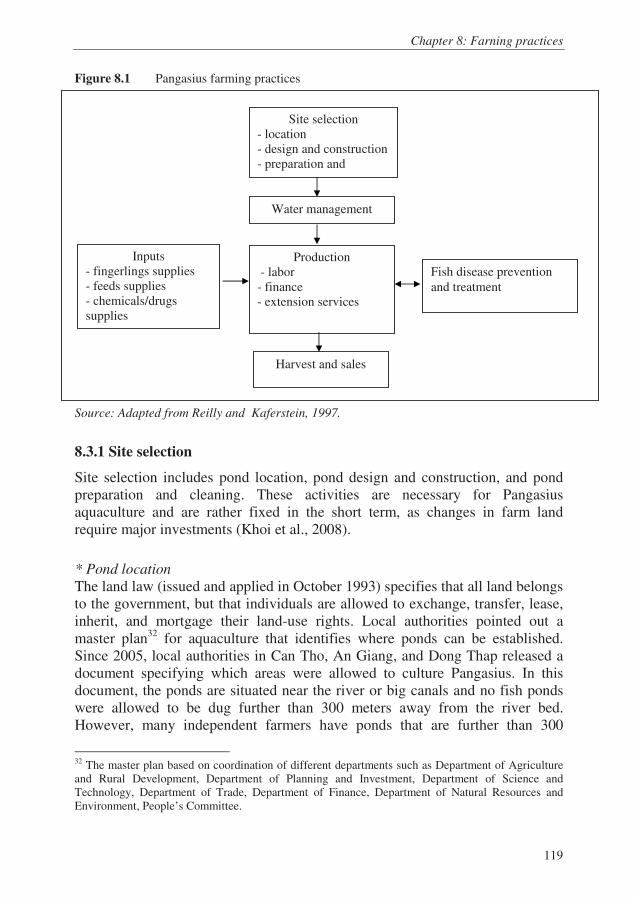
This section discusses the Pangasius farming practices as mentioned in the conceptual framework (section 4.1). Reilly and Kaferstein (1997) revealed that pond farming practices are divided into four main activities: (1) site selection, (2) water management, (3) production, and (4) harvest and sales. This discussion is based on these key activities as presented in figure 8.1. Fish disease prevention and treatment by chemicals/veterinary drugs is the main issue that affects fish safety due to the problem of drug residues. This issue is analyzed separately in chapter 9.
Chapter 8: Farning practices
119
Figure 8.1 Pangasius farming practices
The site selection and water supply are the pre-requisite conditions for Pangasius
Source: Adapted from Reilly and Kaferstein, 1997.
8.3.1 Site selection
Site selection includes pond location, pond design and construction, and pond preparation and cleaning. These activities are necessary for Pangasius aquaculture and are rather fixed in the short term, as changes in farm land require major investments (Khoi et al., 2008).
* Pond location
The land law (issued and applied in October 1993) specifies that all land belongs to the government, but that individuals are allowed to exchange, transfer, lease, inherit, and mortgage their land-use rights. Local authorities pointed out a master plan32 for aquaculture that identifies where ponds can be established. Since 2005, local authorities in Can Tho, An Giang, and Dong Thap released a document specifying which areas were allowed to culture Pangasius. In this document, the ponds are situated near the river or big canals and no fish ponds were allowed to be dug further than 300 meters away from the river bed. However, many independent farmers have ponds that are further than 300
32 The master plan based on coordination of different departments such as Department of Agriculture and Rural Development, Department of Planning and Investment, Department of Science and Technology, Department of Trade, Department of Finance, Department of Natural Resources and Environment, People’s Committee.
Site selection - location - design and construction - preparation and
Water management
Production - labor - finance - extension services
Harvest and sales
Fish disease prevention
and treatment
Inputs - fingerlings supplies - feeds supplies - chemicals/drugs supplies
Quality Management in the Pangasius Export Supply Chain in Vietnam
120
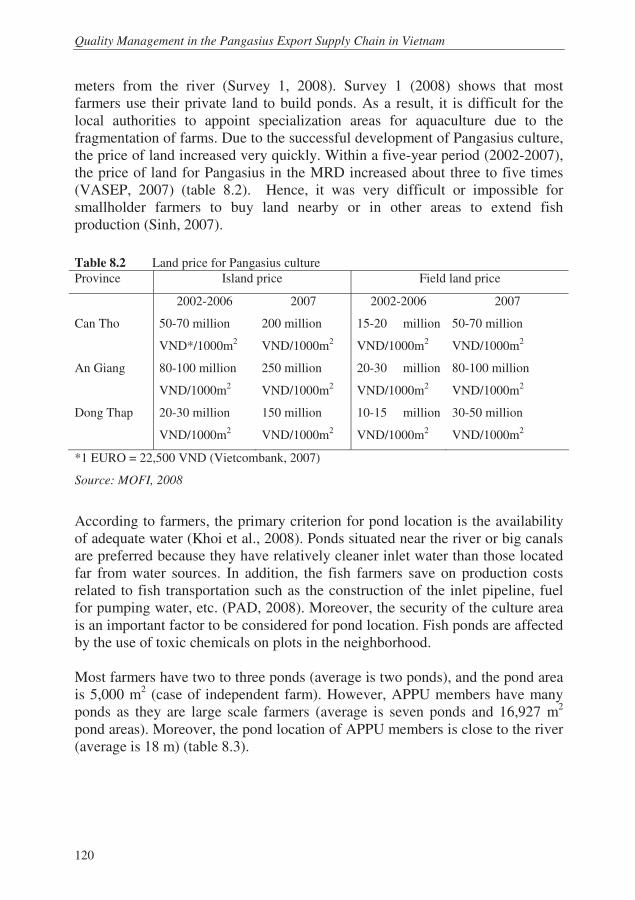
meters from the river (Survey 1, 2008). Survey 1 (2008) shows that most farmers use their private land to build ponds. As a result, it is difficult for the local authorities to appoint specialization areas for aquaculture due to the fragmentation of farms. Due to the successful development of Pangasius culture, the price of land increased very quickly. Within a five-year period (2002-2007), the price of land for Pangasius in the MRD increased about three to five times (VASEP, 2007) (table 8.2). Hence, it was very difficult or impossible for smallholder farmers to buy land nearby or in other areas to extend fish production (Sinh, 2007).
Table 8.2 Land price for Pangasius culture
Province Island price Field land price
2002-2006 2007 2002-2006 2007
Can Tho 50-70 million
VND*/1000m2
200 million
VND/1000m2
15-20 million
VND/1000m2
50-70 million
VND/1000m2
An Giang 80-100 million
VND/1000m2
250 million
VND/1000m2
20-30 million
VND/1000m2
80-100 million
VND/1000m2
Dong Thap 20-30 million
VND/1000m2
150 million
VND/1000m2
10-15 million
VND/1000m2
30-50 million
VND/1000m2
*1 EURO = 22,500 VND (Vietcombank, 2007)
Source: MOFI, 2008
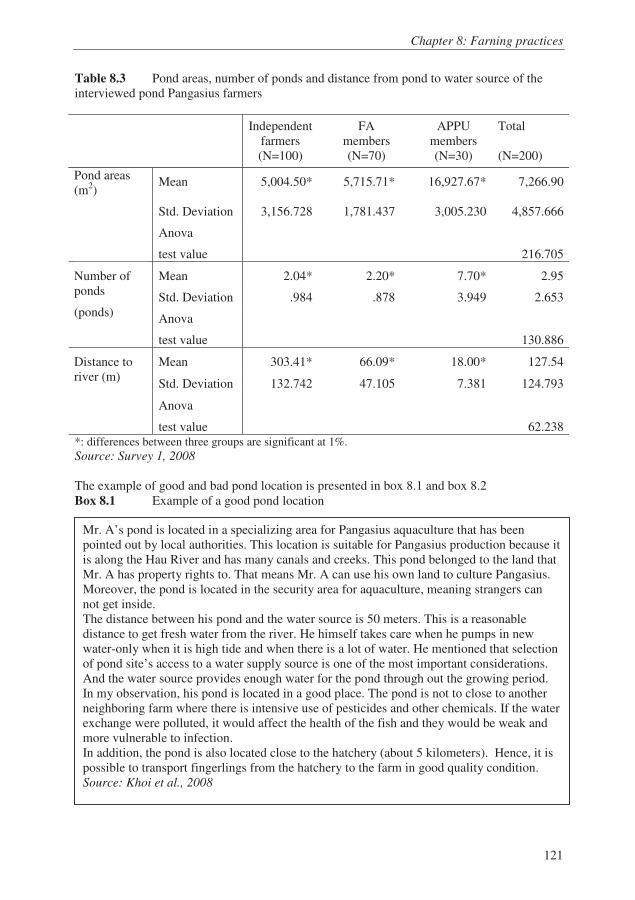
According to farmers, the primary criterion for pond location is the availability of adequate water (Khoi et al., 2008). Ponds situated near the river or big canals are preferred because they have relatively cleaner inlet water than those located far from water sources. In addition, the fish farmers save on production costs related to fish transportation such as the construction of the inlet pipeline, fuel for pumping water, etc. (PAD, 2008). Moreover, the security of the culture area is an important factor to be considered for pond location. Fish ponds are affected by the use of toxic chemicals on plots in the neighborhood. Most farmers have two to three ponds (average is two ponds), and the pond area is 5,000 m2 (case of independent farm). However, APPU members have many ponds as they are large scale farmers (average is seven ponds and 16,927 m2 pond areas). Moreover, the pond location of APPU members is close to the river (average is 18 m) (table 8.3).
Chapter 8: Farning practices
121
Table 8.3 Pond areas, number of ponds and distance from pond to water source of the interviewed pond Pangasius farmers
Independent farmers (N=100)
FA members (N=70)
APPU members (N=30)
Total (N=200)
Mean 5,004.50* 5,715.71* 16,927.67* 7,266.90 Std. Deviation
3,156.728
1,781.437
3,005.230
4,857.666
Pond areas (m2)
Anova
test value 216.705
Mean 2.04* 2.20* 7.70* 2.95
Std. Deviation .984 .878 3.949 2.653
Number of ponds
(ponds)
Anova
test value 130.886
Mean 303.41* 66.09* 18.00* 127.54
Std. Deviation 132.742 47.105 7.381 124.793
Distance to river (m)
Anova
test value 62.238 *: differences between three groups are significant at 1%. Source: Survey 1, 2008
The example of good and bad pond location is presented in box 8.1 and box 8.2 Box 8.1 Example of a good pond location
Mr. A’s pond is located in a specializing area for Pangasius aquaculture that has been pointed out by local authorities. This location is suitable for Pangasius production because it is along the Hau River and has many canals and creeks. This pond belonged to the land that Mr. A has property rights to. That means Mr. A can use his own land to culture Pangasius. Moreover, the pond is located in the security area for aquaculture, meaning strangers can not get inside. The distance between his pond and the water source is 50 meters. This is a reasonable distance to get fresh water from the river. He himself takes care when he pumps in new water-only when it is high tide and when there is a lot of water. He mentioned that selection of pond site’s access to a water supply source is one of the most important considerations. And the water source provides enough water for the pond through out the growing period. In my observation, his pond is located in a good place. The pond is not to close to another neighboring farm where there is intensive use of pesticides and other chemicals. If the water exchange were polluted, it would affect the health of the fish and they would be weak and more vulnerable to infection. In addition, the pond is also located close to the hatchery (about 5 kilometers). Hence, it is possible to transport fingerlings from the hatchery to the farm in good quality condition. Source: Khoi et al., 2008

Quality Management in the Pangasius Export Supply Chain in Vietnam
122
Box 8.2 Example of a bad pond location
The case study results revealed that ponds can be divided into field ponds and island ponds. Field ponds are more popular because farmers can convert their field areas into ponds, which are located in or near the farmers’ homesteads. Island ponds were established on islands in the Hau River or on the river banks close to the river. In our thesis, the island pond33 is used for the APPU case, as it has been in use since 2006, and the field pond is used for the traditional case and FA members.
Table 8.4 Differences between field pond and island pond
Characteristics Field pond
(FA and independent farmers)
Island pond
(APPU members)
Production areas (1000 m2) <10 >10
Water depth (m) 2-3 up to 5
Yield (MT/ha) 150 – 250 250 – 300
Meat quality for export* Large % of yellow/pink meat* >80% white meat*
*Grade 1: White and light pink color: highest demand in Europe and US; Grade 2: Light cream yellow: high demand in Eastern Europe; and Grade 3: Yellow: high demand in Asia Source: Khoi et al., 2008
*Pond design and construction
The pond design and construction can significantly influence the farm operation and environmental issues. Most farmers hire skilled and experienced laborers to construct the pond. Box 8.3 describes a typical pond design in the research area. Due to the increasing intensity and expansion of Pangasius operations, suitable design and construction techniques should be used when establishing new farms in order to protect the environment (VASEP, 2007). The local
33 The island ponds were built in just three years after the quick development of Pangasius export, and they have had favorable conditions in fish production since having access to cleaner inlet water. APPU farmers constructed island ponds to produce Pangasius with higher quality and better water supply than in field ponds.
The distance between Mr. F’s pond and the water source is 300 meters. This is a disadvantage for his farm. He can not exchange water frequently. Currently, Mr. F must build an inlet pipeline for pumping water and gets water only three days per week depending on the local authority’s schedule for water pumping. Moreover, Mr.F also raises animals like chickens, dogs, and ducks, which further affects water quality. Source: Khoi et al., 2008.
Chapter 8: Farning practices
123
governments have exhibited the dumping of pond sediments into the water channels, i.e., every farmer must set aside part of his or her land for treating wastewater before discharging into the river (in-depth interviews, 2006). Because a waste-water treatment system is such an important criterion for fish quality control, local authorities decided that farmers who construct a new pond must include this system (MOFI, 2008). However, most small-scale farmers did not follow the advice to use waste-water treatment ponds because doing so reduces the land available for production (1/3 of the pond production area). Moreover, farmers lack land for waste-water treatment ponds because the majority of their land has been converted into ponds already (Survey 1, 2008). As land price is high, many fish farmers can not afford to purchase more land for waste-water treatment. All APPU members and some FA members use a waste-water treatment system (see table 8.7). However, none of the independent farmers have a waste-water treatment pond due to the high cost of constructing one.
Box 8.3 Example of pond design and construction
*Pond preparation and cleaning
The case study results show that with every new culture cycle, the fish farmers cleaned and dried the pond before releasing fingerlings. After cleaning the muddy bottom of the pond, lime (CaCO3 or CaO) and salt were added to adjust the pH level. Next, they pumped water into the pond, which had been treated with a chemical substance for 24 hours. Finally, the pond was ready for the fingerlings to be stocked in. During the Pangasius production cycle, fish farmers rented laborers once a month to get mud out of the pond bottom with special machines (muddy sucking). This process reduces toxic substances that can affect fish health and quality (case study results, 2007). Moreover, lime was periodically added to maintain alkalinity and pH.
Mr. D constructed his pond with a width of 80m, a length of 200m, and a depth of 4 m. The area of Mr.D’s pond is easily to manage. The design and construction of the pond may look simple, but the process really is a time consuming and complicated. Mr. D had to hire two skilled and experienced laborers to construct the best pond for a given site. Earth that was removed to create the pond was used to build dykes around the pond or put on the land. An inlet water pipeline was built to take water from outside water bodies into the pond. Moreover, Mr. D also built a waste-water treatment system for water treatment before discharging it into the river. Mr. D mentioned that the mud in the pond contains ammoniac, feed remains, and veterinary drug residues; hence, the mud should be treated. He therefore stores the mud in a waste-water treatment system (Mr. D is a member of APPU). Source: Khoi et al., 2008
Quality Management in the Pangasius Export Supply Chain in Vietnam
124
Box 8.4 Example of pond preparation and cleaning
8.3.2 Water management
The results of the case study (2007) show that ponds with a high water exchange rate have healthier fish. In Survey 1 (2008), the majority of fish farmers checked their pond water quality regularly either by pH meter or visually (table 8.5)
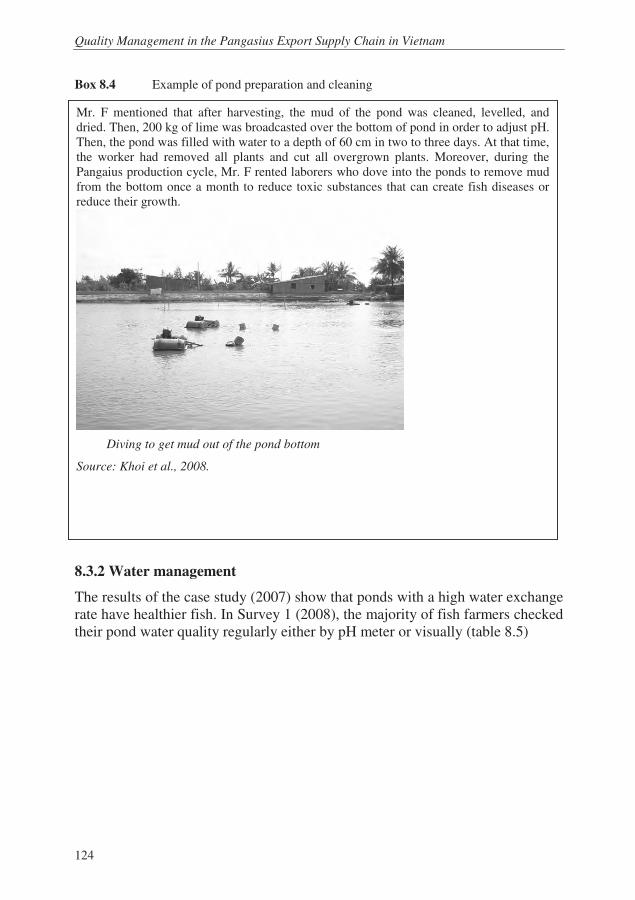
Mr. F mentioned that after harvesting, the mud of the pond was cleaned, levelled, and dried. Then, 200 kg of lime was broadcasted over the bottom of pond in order to adjust pH. Then, the pond was filled with water to a depth of 60 cm in two to three days. At that time, the worker had removed all plants and cut all overgrown plants. Moreover, during the Pangaius production cycle, Mr. F rented laborers who dove into the ponds to remove mud from the bottom once a month to reduce toxic substances that can create fish diseases or reduce their growth.
Diving to get mud out of the pond bottom
Source: Khoi et al., 2008.

Chapter 8: Farning practices
125
Table 8.5 Ways to check pond water quality
Independent farmers
(N=100)
FA
members
(N=70)
APPU members
(N=30)
Total
(N=200)
pH meter Frequency 37 (37.0%) 53 (75.7%) 30 (100.0%) 120 (60.0%)
Visual Frequency 37 (37.0%) 35 (50.0%) 15 (50.0%) 87 (43.5%)
Both Frequency 36 (36.0%) 36 (36.0%) 15 (50.0%) 87 (43.5%)
Source: Survey 1, 2008.
According to the farmers’ own experience, pond water condition can be improved by a number of methods: frequent changing of water in ponds (85.5%), treating the water by using lime, salt, or chemicals (68%), and re-conditioning ponds by sucking the mud from the pond’s bottom (72.5%) (table 8.6). The APPU members usually use a pH meter to test water quality. The farmers are equipped with water quality test kits by the company. Moreover, they send water samples to the AGIFISH laboratory to analyze water standards, thereby assuring water quality in APPU members’ ponds. On the other hand, the independent farmers and FA members usually check water quality by eye and adjust the quality of water based on their own experiences (Khoi et al., 2008). Table 8.6 Correct action of poor water quality of Pangasius ponds
Independent farmers
(N=100)
FA
members
(N=70)
APPU
members
(N=30)
Total (N=200)
Water changing frequently
Frequency 71 (71.0%) 70 (100.0%) 30 (100.0%) 171 (85.5%)
Water treatment Frequency 60 (60.0%) 52 (74.3%) 24 (80.0%) 136 (68.0%)
Re-conditioning ponds Frequency 61 (61.0%) 54 (77.1%) 30 (100.0%) 145 (72.5%)
Source: Survey 1, 2008
As mentioned previously, most farmers have no waste-water treatment system. In case in which they do have treatment system, waste-water must stay in the system for 10 hours in order for the pollutants to be decomposed before being released into the environment. Because fish farmers must exchange 30 to 50 percent of the pond water almost everyday, the capacity needed for waste-water treatment is significant (one-third of the production area) Waste from feeds, especially home-made feed, and chemicals/drugs pollute the water and lead to disease outbreaks and economic losses.
Quality Management in the Pangasius Export Supply Chain in Vietnam
126
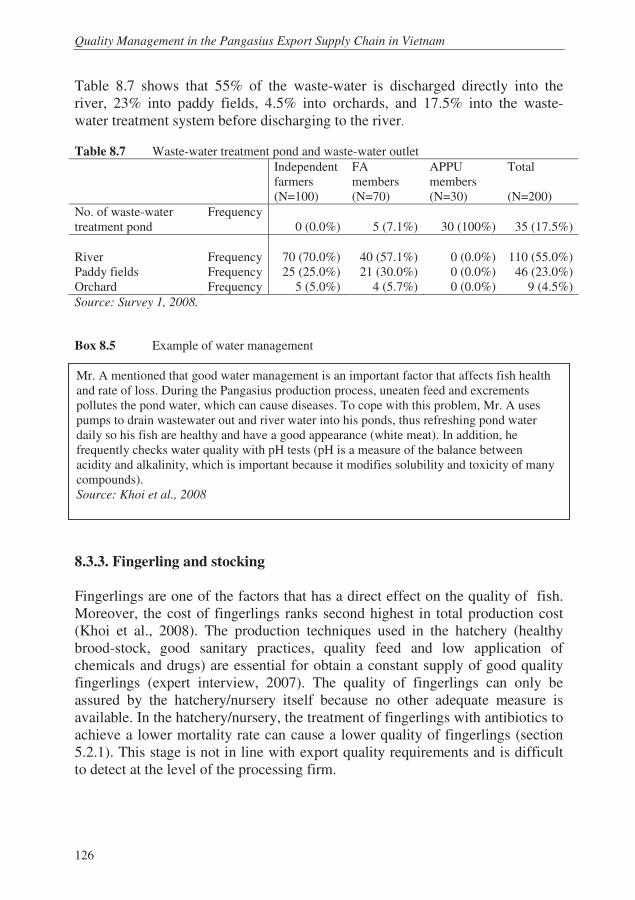
Table 8.7 shows that 55% of the waste-water is discharged directly into the river, 23% into paddy fields, 4.5% into orchards, and 17.5% into the waste-water treatment system before discharging to the river.
Table 8.7 Waste-water treatment pond and waste-water outlet
Independent farmers (N=100)
FA members (N=70)
APPU members (N=30)
Total (N=200)
No. of waste-water treatment pond
Frequency 0 (0.0%)
5 (7.1%)
30 (100%)
35 (17.5%)
River
Frequency
70 (70.0%)
40 (57.1%)
0 (0.0%)
110 (55.0%)
Paddy fields Frequency 25 (25.0%) 21 (30.0%) 0 (0.0%) 46 (23.0%) Orchard Frequency 5 (5.0%) 4 (5.7%) 0 (0.0%) 9 (4.5%)
Source: Survey 1, 2008.
Box 8.5 Example of water management
8.3.3. Fingerling and stocking Fingerlings are one of the factors that has a direct effect on the quality of fish. Moreover, the cost of fingerlings ranks second highest in total production cost (Khoi et al., 2008). The production techniques used in the hatchery (healthy brood-stock, good sanitary practices, quality feed and low application of chemicals and drugs) are essential for obtain a constant supply of good quality fingerlings (expert interview, 2007). The quality of fingerlings can only be assured by the hatchery/nursery itself because no other adequate measure is available. In the hatchery/nursery, the treatment of fingerlings with antibiotics to achieve a lower mortality rate can cause a lower quality of fingerlings (section 5.2.1). This stage is not in line with export quality requirements and is difficult to detect at the level of the processing firm.
Mr. A mentioned that good water management is an important factor that affects fish health and rate of loss. During the Pangasius production process, uneaten feed and excrements pollutes the pond water, which can cause diseases. To cope with this problem, Mr. A uses pumps to drain wastewater out and river water into his ponds, thus refreshing pond water daily so his fish are healthy and have a good appearance (white meat). In addition, he frequently checks water quality with pH tests (pH is a measure of the balance between acidity and alkalinity, which is important because it modifies solubility and toxicity of many compounds). Source: Khoi et al., 2008
Chapter 8: Farning practices
127
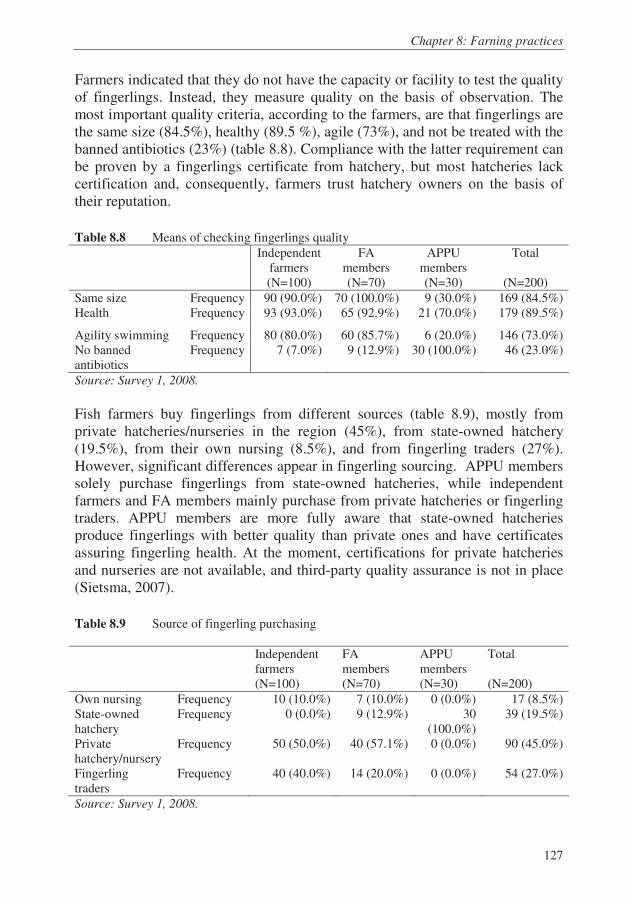
Farmers indicated that they do not have the capacity or facility to test the quality of fingerlings. Instead, they measure quality on the basis of observation. The most important quality criteria, according to the farmers, are that fingerlings are the same size (84.5%), healthy (89.5 %), agile (73%), and not be treated with the banned antibiotics (23%) (table 8.8). Compliance with the latter requirement can be proven by a fingerlings certificate from hatchery, but most hatcheries lack certification and, consequently, farmers trust hatchery owners on the basis of their reputation.
Table 8.8 Means of checking fingerlings quality
Independent farmers (N=100)
FA members (N=70)
APPU members (N=30)
Total
(N=200)
Same size Frequency 90 (90.0%) 70 (100.0%) 9 (30.0%) 169 (84.5%) Health Frequency 93 (93.0%) 65 (92.9%) 21 (70.0%) 179 (89.5%)
Agility swimming Frequency 80 (80.0%) 60 (85.7%) 6 (20.0%) 146 (73.0%) No banned antibiotics
Frequency 7 (7.0%) 9 (12.9%) 30 (100.0%) 46 (23.0%)
Source: Survey 1, 2008.
Fish farmers buy fingerlings from different sources (table 8.9), mostly from private hatcheries/nurseries in the region (45%), from state-owned hatchery (19.5%), from their own nursing (8.5%), and from fingerling traders (27%). However, significant differences appear in fingerling sourcing. APPU members solely purchase fingerlings from state-owned hatcheries, while independent farmers and FA members mainly purchase from private hatcheries or fingerling traders. APPU members are more fully aware that state-owned hatcheries produce fingerlings with better quality than private ones and have certificates assuring fingerling health. At the moment, certifications for private hatcheries and nurseries are not available, and third-party quality assurance is not in place (Sietsma, 2007).
Table 8.9 Source of fingerling purchasing
Independent farmers (N=100)
FA members (N=70)
APPU members (N=30)
Total (N=200)
Own nursing Frequency 10 (10.0%) 7 (10.0%) 0 (0.0%) 17 (8.5%) State-owned hatchery
Frequency 0 (0.0%) 9 (12.9%) 30 (100.0%)
39 (19.5%)
Private hatchery/nursery
Frequency 50 (50.0%) 40 (57.1%) 0 (0.0%) 90 (45.0%)
Fingerling traders
Frequency 40 (40.0%) 14 (20.0%) 0 (0.0%) 54 (27.0%)
Source: Survey 1, 2008.
Quality Management in the Pangasius Export Supply Chain in Vietnam
128
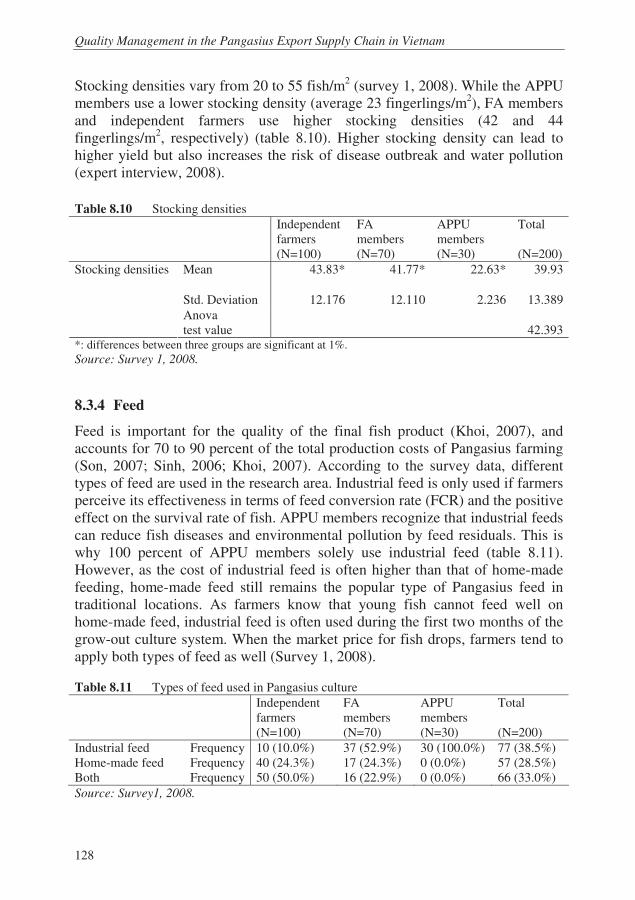
Stocking densities vary from 20 to 55 fish/m2 (survey 1, 2008). While the APPU members use a lower stocking density (average 23 fingerlings/m2), FA members and independent farmers use higher stocking densities (42 and 44 fingerlings/m2, respectively) (table 8.10). Higher stocking density can lead to higher yield but also increases the risk of disease outbreak and water pollution (expert interview, 2008).
Table 8.10 Stocking densities
Independent farmers (N=100)
FA members (N=70)
APPU members (N=30)
Total (N=200)
Mean 43.83* 41.77* 22.63* 39.93
Std. Deviation
12.176
12.110
2.236
13.389
Stocking densities
Anova test value 42.393
*: differences between three groups are significant at 1%. Source: Survey 1, 2008.
8.3.4 Feed
Feed is important for the quality of the final fish product (Khoi, 2007), and accounts for 70 to 90 percent of the total production costs of Pangasius farming (Son, 2007; Sinh, 2006; Khoi, 2007). According to the survey data, different types of feed are used in the research area. Industrial feed is only used if farmers perceive its effectiveness in terms of feed conversion rate (FCR) and the positive effect on the survival rate of fish. APPU members recognize that industrial feeds can reduce fish diseases and environmental pollution by feed residuals. This is why 100 percent of APPU members solely use industrial feed (table 8.11). However, as the cost of industrial feed is often higher than that of home-made feeding, home-made feed still remains the popular type of Pangasius feed in traditional locations. As farmers know that young fish cannot feed well on home-made feed, industrial feed is often used during the first two months of the grow-out culture system. When the market price for fish drops, farmers tend to apply both types of feed as well (Survey 1, 2008). Table 8.11 Types of feed used in Pangasius culture
Independent farmers (N=100)
FA members (N=70)
APPU members (N=30)
Total (N=200)
Industrial feed Frequency 10 (10.0%) 37 (52.9%) 30 (100.0%) 77 (38.5%) Home-made feed Frequency 40 (24.3%) 17 (24.3%) 0 (0.0%) 57 (28.5%) Both Frequency 50 (50.0%) 16 (22.9%) 0 (0.0%) 66 (33.0%)
Source: Survey1, 2008.
Chapter 8: Farning practices
129
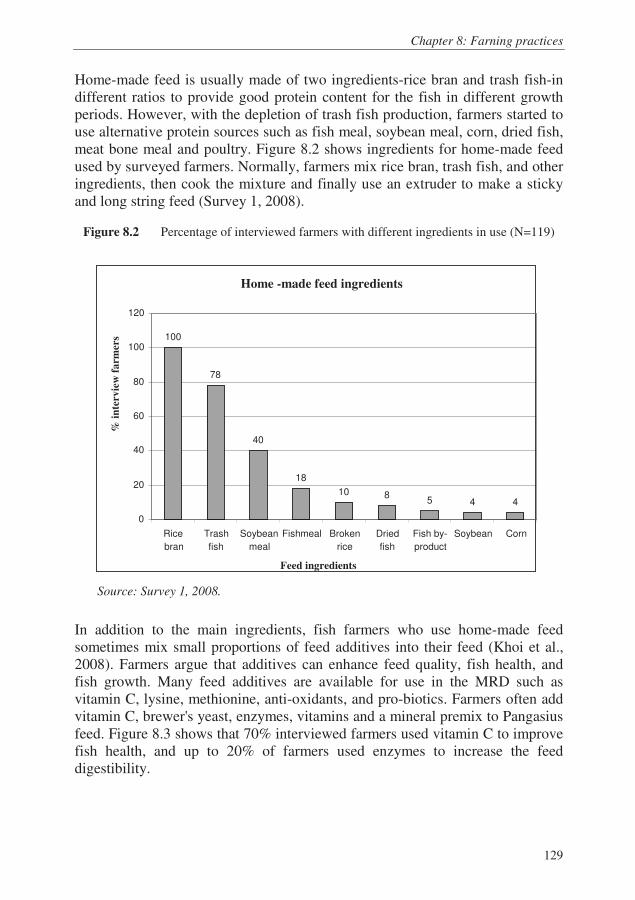
Home-made feed is usually made of two ingredients-rice bran and trash fish-in different ratios to provide good protein content for the fish in different growth periods. However, with the depletion of trash fish production, farmers started to use alternative protein sources such as fish meal, soybean meal, corn, dried fish, meat bone meal and poultry. Figure 8.2 shows ingredients for home-made feed used by surveyed farmers. Normally, farmers mix rice bran, trash fish, and other ingredients, then cook the mixture and finally use an extruder to make a sticky and long string feed (Survey 1, 2008).
Figure 8.2 Percentage of interviewed farmers with different ingredients in use (N=119)
Source: Survey 1, 2008.
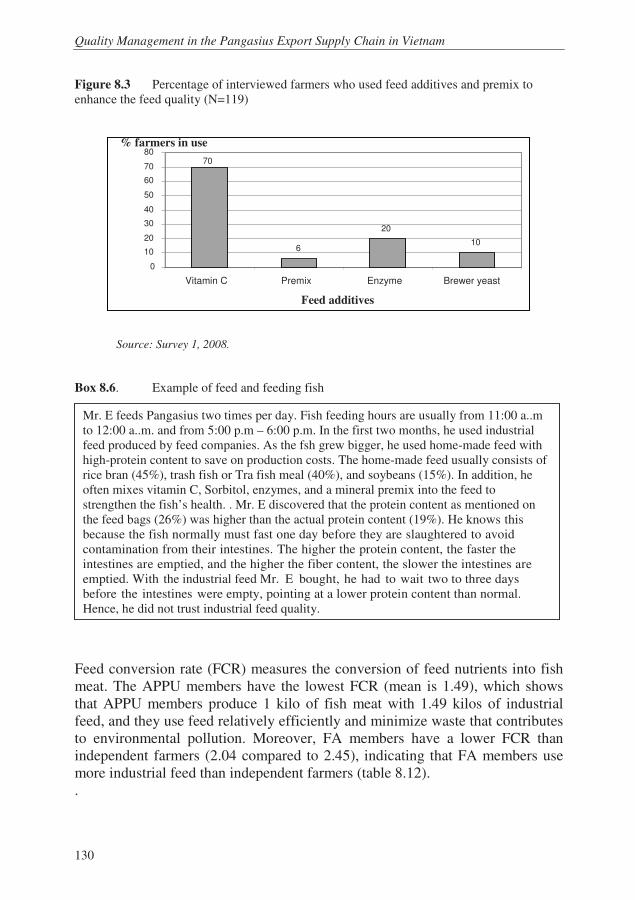
In addition to the main ingredients, fish farmers who use home-made feed sometimes mix small proportions of feed additives into their feed (Khoi et al., 2008). Farmers argue that additives can enhance feed quality, fish health, and fish growth. Many feed additives are available for use in the MRD such as vitamin C, lysine, methionine, anti-oxidants, and pro-biotics. Farmers often add vitamin C, brewer's yeast, enzymes, vitamins and a mineral premix to Pangasius feed. Figure 8.3 shows that 70% interviewed farmers used vitamin C to improve fish health, and up to 20% of farmers used enzymes to increase the feed digestibility.
Home -made feed ingredients
100
78
40
18 10 8
5 4 4
0
20
40
60
80
100
120
Rice
bran
Trash
fish
Soybean
meal
Fishmeal Broken
rice
Dried
fish
Fish by-
product
Soybean Corn
Feed ingredients
% i
nte
rvie
w f
arm
ers
Quality Management in the Pangasius Export Supply Chain in Vietnam
130
Figure 8.3 Percentage of interviewed farmers who used feed additives and premix to enhance the feed quality (N=119)
Source: Survey 1, 2008.
Box 8.6. Example of feed and feeding fish
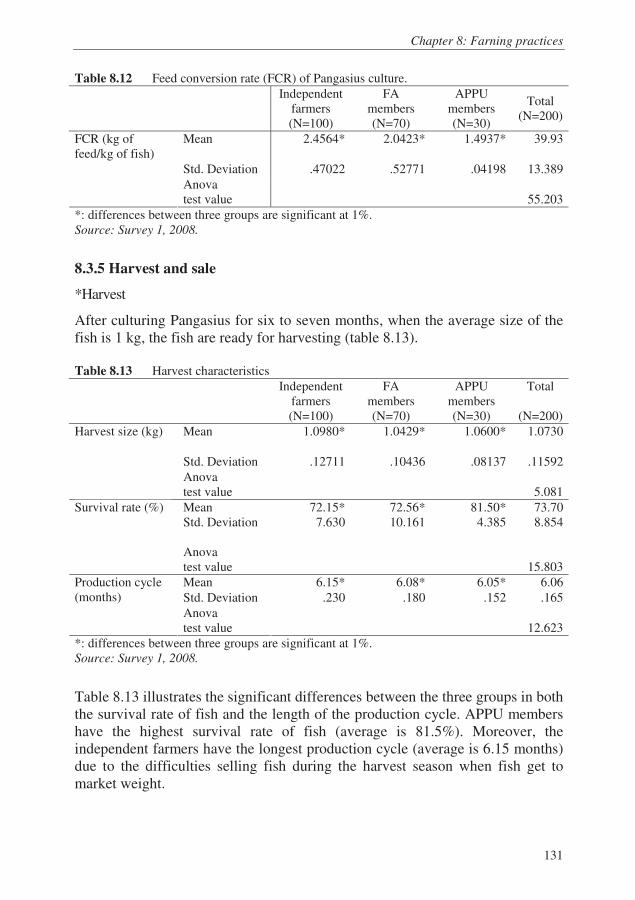
Feed conversion rate (FCR) measures the conversion of feed nutrients into fish meat. The APPU members have the lowest FCR (mean is 1.49), which shows that APPU members produce 1 kilo of fish meat with 1.49 kilos of industrial feed, and they use feed relatively efficiently and minimize waste that contributes to environmental pollution. Moreover, FA members have a lower FCR than independent farmers (2.04 compared to 2.45), indicating that FA members use more industrial feed than independent farmers (table 8.12). .
70
6
20 10
0 10 20 30 40 50 60 70 80
Vitamin C Premix Enzyme Brewer yeast
Feed additives
% farmers in use
Mr. E feeds Pangasius two times per day. Fish feeding hours are usually from 11:00 a..m to 12:00 a..m. and from 5:00 p.m – 6:00 p.m. In the first two months, he used industrial feed produced by feed companies. As the fsh grew bigger, he used home-made feed with high-protein content to save on production costs. The home-made feed usually consists of rice bran (45%), trash fish or Tra fish meal (40%), and soybeans (15%). In addition, he often mixes vitamin C, Sorbitol, enzymes, and a mineral premix into the feed to strengthen the fish’s health. . Mr. E discovered that the protein content as mentioned on the feed bags (26%) was higher than the actual protein content (19%). He knows this because the fish normally must fast one day before they are slaughtered to avoid contamination from their intestines. The higher the protein content, the faster the intestines are emptied, and the higher the fiber content, the slower the intestines are emptied. With the industrial feed Mr. E bought, he had to wait two to three days before the intestines were empty, pointing at a lower protein content than normal. Hence, he did not trust industrial feed quality.
Chapter 8: Farning practices
131
Table 8.12 Feed conversion rate (FCR) of Pangasius culture.
Independent
farmers (N=100)
FA members (N=70)
APPU members (N=30)
Total (N=200)
Mean 2.4564* 2.0423* 1.4937* 39.93
Std. Deviation
.47022
.52771
.04198
13.389
FCR (kg of feed/kg of fish)
Anova test value 55.203
*: differences between three groups are significant at 1%. Source: Survey 1, 2008.
8.3.5 Harvest and sale
*Harvest
After culturing Pangasius for six to seven months, when the average size of the fish is 1 kg, the fish are ready for harvesting (table 8.13). Table 8.13 Harvest characteristics
Independent
farmers (N=100)
FA members (N=70)
APPU members (N=30)
Total
(N=200)
Mean 1.0980* 1.0429* 1.0600* 1.0730
Std. Deviation
.12711
.10436
.08137
.11592
Harvest size (kg)
Anova test value 5.081
Mean 72.15* 72.56* 81.50* 73.70 Std. Deviation 7.630 10.161 4.385 8.854
Survival rate (%)
Anova test value 15.803
Mean 6.15* 6.08* 6.05* 6.06
Std. Deviation .230 .180 .152 .165
Production cycle (months)
Anova test value 12.623
*: differences between three groups are significant at 1%. Source: Survey 1, 2008.
Table 8.13 illustrates the significant differences between the three groups in both the survival rate of fish and the length of the production cycle. APPU members have the highest survival rate of fish (average is 81.5%). Moreover, the independent farmers have the longest production cycle (average is 6.15 months) due to the difficulties selling fish during the harvest season when fish get to market weight.
Quality Management in the Pangasius Export Supply Chain in Vietnam
132
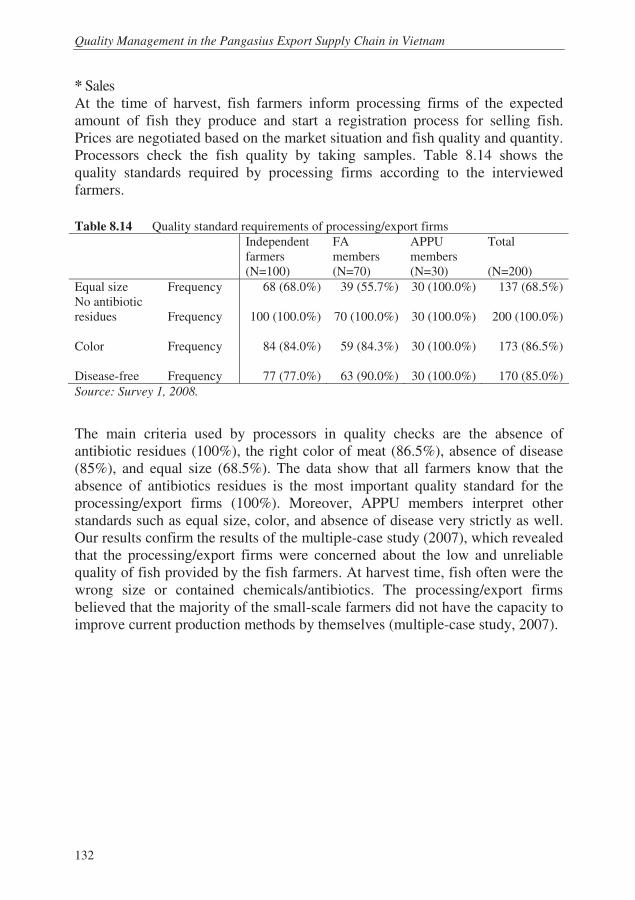
* Sales At the time of harvest, fish farmers inform processing firms of the expected amount of fish they produce and start a registration process for selling fish. Prices are negotiated based on the market situation and fish quality and quantity. Processors check the fish quality by taking samples. Table 8.14 shows the quality standards required by processing firms according to the interviewed farmers.
Table 8.14 Quality standard requirements of processing/export firms
Independent farmers (N=100)
FA members (N=70)
APPU members (N=30)
Total (N=200)
Equal size Frequency 68 (68.0%) 39 (55.7%) 30 (100.0%) 137 (68.5%) No antibiotic residues
Frequency
100 (100.0%)
70 (100.0%)
30 (100.0%)
200 (100.0%)
Color
Frequency
84 (84.0%)
59 (84.3%)
30 (100.0%)
173 (86.5%)
Disease-free
Frequency
77 (77.0%)
63 (90.0%)
30 (100.0%)
170 (85.0%)
Source: Survey 1, 2008.
The main criteria used by processors in quality checks are the absence of antibiotic residues (100%), the right color of meat (86.5%), absence of disease (85%), and equal size (68.5%). The data show that all farmers know that the absence of antibiotics residues is the most important quality standard for the processing/export firms (100%). Moreover, APPU members interpret other standards such as equal size, color, and absence of disease very strictly as well. Our results confirm the results of the multiple-case study (2007), which revealed that the processing/export firms were concerned about the low and unreliable quality of fish provided by the fish farmers. At harvest time, fish often were the wrong size or contained chemicals/antibiotics. The processing/export firms believed that the majority of the small-scale farmers did not have the capacity to improve current production methods by themselves (multiple-case study, 2007).
Chapter 8: Farning practices
133
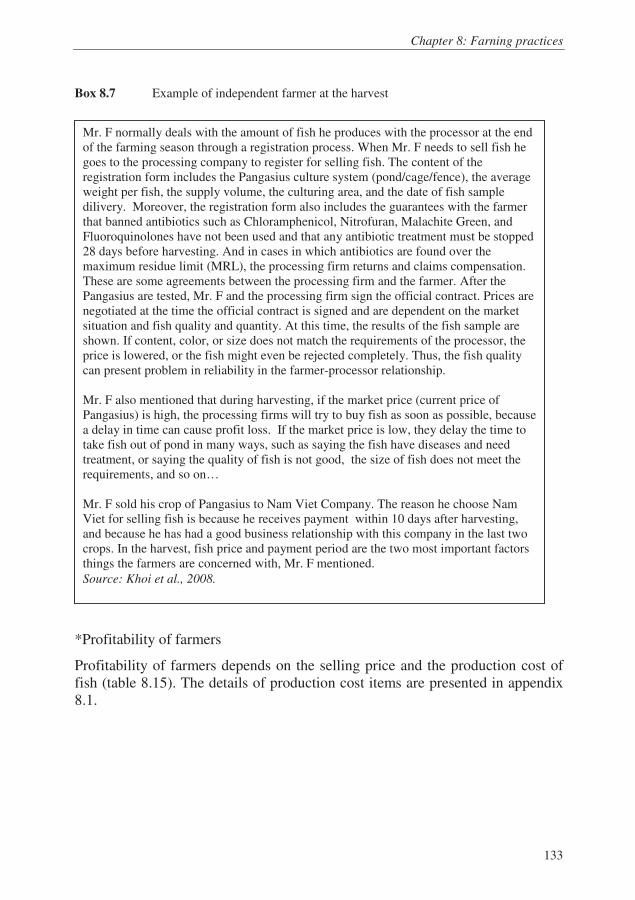
Box 8.7 Example of independent farmer at the harvest
*Profitability of farmers
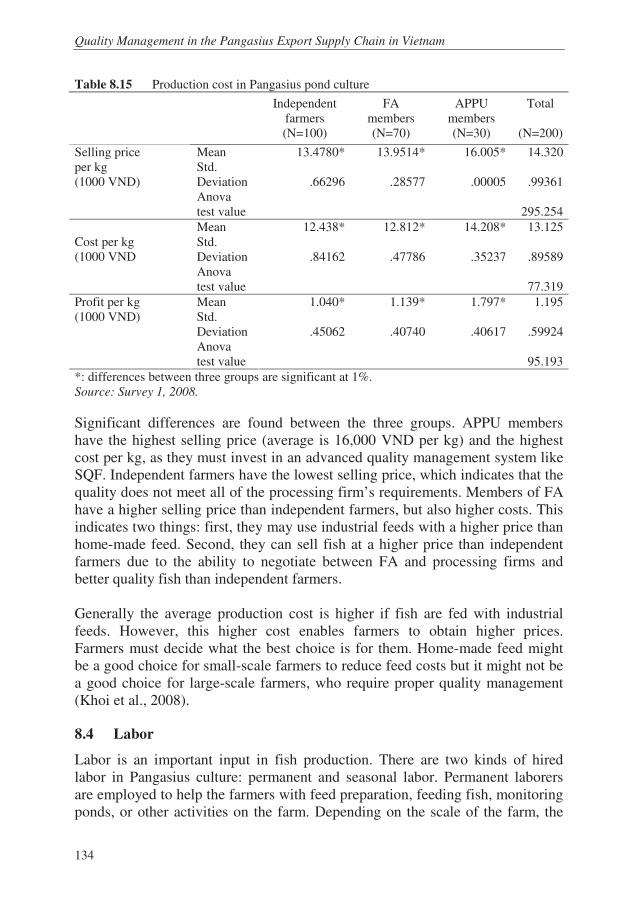
Profitability of farmers depends on the selling price and the production cost of fish (table 8.15). The details of production cost items are presented in appendix 8.1.
Mr. F normally deals with the amount of fish he produces with the processor at the end of the farming season through a registration process. When Mr. F needs to sell fish he goes to the processing company to register for selling fish. The content of the registration form includes the Pangasius culture system (pond/cage/fence), the average weight per fish, the supply volume, the culturing area, and the date of fish sample dilivery. Moreover, the registration form also includes the guarantees with the farmer that banned antibiotics such as Chloramphenicol, Nitrofuran, Malachite Green, and Fluoroquinolones have not been used and that any antibiotic treatment must be stopped 28 days before harvesting. And in cases in which antibiotics are found over the maximum residue limit (MRL), the processing firm returns and claims compensation. These are some agreements between the processing firm and the farmer. After the Pangasius are tested, Mr. F and the processing firm sign the official contract. Prices are negotiated at the time the official contract is signed and are dependent on the market situation and fish quality and quantity. At this time, the results of the fish sample are shown. If content, color, or size does not match the requirements of the processor, the price is lowered, or the fish might even be rejected completely. Thus, the fish quality can present problem in reliability in the farmer-processor relationship. Mr. F also mentioned that during harvesting, if the market price (current price of Pangasius) is high, the processing firms will try to buy fish as soon as possible, because a delay in time can cause profit loss. If the market price is low, they delay the time to take fish out of pond in many ways, such as saying the fish have diseases and need treatment, or saying the quality of fish is not good, the size of fish does not meet the requirements, and so on… Mr. F sold his crop of Pangasius to Nam Viet Company. The reason he choose Nam Viet for selling fish is because he receives payment within 10 days after harvesting, and because he has had a good business relationship with this company in the last two crops. In the harvest, fish price and payment period are the two most important factors things the farmers are concerned with, Mr. F mentioned.
Source: Khoi et al., 2008.
Quality Management in the Pangasius Export Supply Chain in Vietnam
134
Table 8.15 Production cost in Pangasius pond culture
Independent
farmers (N=100)
FA members (N=70)
APPU members (N=30)
Total
(N=200)
Mean 13.4780* 13.9514* 16.005* 14.320 Std. Deviation .66296 .28577 .00005 .99361
Selling price per kg (1000 VND)
Anova test value 295.254
Mean 12.438* 12.812* 14.208* 13.125 Std. Deviation .84162 .47786 .35237 .89589
Cost per kg (1000 VND Anova
test value 77.319
Mean 1.040* 1.139* 1.797* 1.195 Std. Deviation .45062 .40740 .40617 .59924
Profit per kg (1000 VND)
Anova test value 95.193
*: differences between three groups are significant at 1%. Source: Survey 1, 2008.
Significant differences are found between the three groups. APPU members have the highest selling price (average is 16,000 VND per kg) and the highest cost per kg, as they must invest in an advanced quality management system like SQF. Independent farmers have the lowest selling price, which indicates that the quality does not meet all of the processing firm’s requirements. Members of FA have a higher selling price than independent farmers, but also higher costs. This indicates two things: first, they may use industrial feeds with a higher price than home-made feed. Second, they can sell fish at a higher price than independent farmers due to the ability to negotiate between FA and processing firms and better quality fish than independent farmers. Generally the average production cost is higher if fish are fed with industrial feeds. However, this higher cost enables farmers to obtain higher prices. Farmers must decide what the best choice is for them. Home-made feed might be a good choice for small-scale farmers to reduce feed costs but it might not be a good choice for large-scale farmers, who require proper quality management (Khoi et al., 2008).
8.4 Labor
Labor is an important input in fish production. There are two kinds of hired labor in Pangasius culture: permanent and seasonal labor. Permanent laborers are employed to help the farmers with feed preparation, feeding fish, monitoring ponds, or other activities on the farm. Depending on the scale of the farm, the
Chapter 8: Farning practices
135
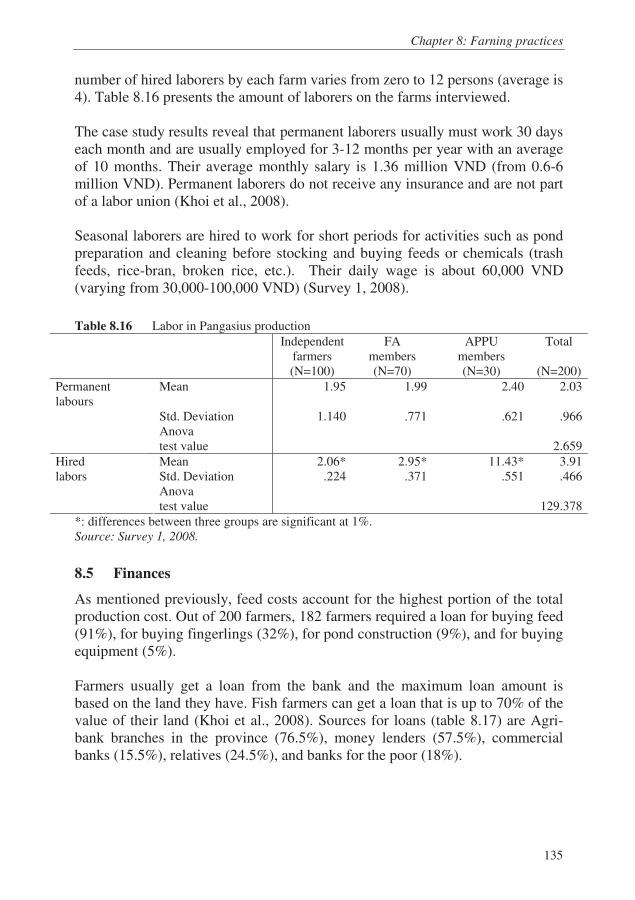
number of hired laborers by each farm varies from zero to 12 persons (average is 4). Table 8.16 presents the amount of laborers on the farms interviewed. The case study results reveal that permanent laborers usually must work 30 days each month and are usually employed for 3-12 months per year with an average of 10 months. Their average monthly salary is 1.36 million VND (from 0.6-6 million VND). Permanent laborers do not receive any insurance and are not part of a labor union (Khoi et al., 2008). Seasonal laborers are hired to work for short periods for activities such as pond preparation and cleaning before stocking and buying feeds or chemicals (trash feeds, rice-bran, broken rice, etc.). Their daily wage is about 60,000 VND (varying from 30,000-100,000 VND) (Survey 1, 2008).
Table 8.16 Labor in Pangasius production
Independent
farmers (N=100)
FA members (N=70)
APPU members (N=30)
Total
(N=200)
Mean 1.95 1.99 2.40 2.03 Std. Deviation
1.140
.771
.621
.966
Permanent labours
Anova test value
2.659
Mean 2.06* 2.95* 11.43* 3.91 Std. Deviation .224 .371 .551 .466
Hired labors
Anova test value
129.378
*: differences between three groups are significant at 1%. Source: Survey 1, 2008.
8.5 Finances
As mentioned previously, feed costs account for the highest portion of the total production cost. Out of 200 farmers, 182 farmers required a loan for buying feed (91%), for buying fingerlings (32%), for pond construction (9%), and for buying equipment (5%). Farmers usually get a loan from the bank and the maximum loan amount is based on the land they have. Fish farmers can get a loan that is up to 70% of the value of their land (Khoi et al., 2008). Sources for loans (table 8.17) are Agri-bank branches in the province (76.5%), money lenders (57.5%), commercial banks (15.5%), relatives (24.5%), and banks for the poor (18%).

Quality Management in the Pangasius Export Supply Chain in Vietnam
136
Table 8.17 Sources of loans
Independent farmers (N=100)
FA members (N=70)
APPU members (N=30)
Total (N=200)
Agri-banks Frequency 78 (78.0%) 53 (75.7%) 22 (73.3%) 153 (76.5%) Banks for the poor
Frequency 22 (22.0%) 14 (20.0%) 0 (0.0%) 36 (18.0%)
Commercial banks
Frequency 9 (9.0%) 14 (20.0%) 8 (26.7%) 31 (15.5%)
Moneylenders Frequency 81 (81.0%) 34 (48.6%) 0 (0.0%) 115 (57.5%) Relatives Frequency 15 (15.0%) 17 (24.3%) 17 (56.7%) 49 (24.5%)
Source: Survey 1, 2008.
The APPU members use industrial feed supplied by Proconco Company. AGIFISH signed a contract with Proconco and as a result supplies feed to APPU members on credit.34 Moreover, AGIFISH also provides credit for buying fingerlings and veterinary drugs. Normally, APPU members receive the feed from AGIFISH during the last two to three months of the production cycle with an interest rate varying between 1 and 1.5% per month equal to the bank’s interest rate. The interest rate depends on the source of the loan. For Agri-bank, the average interest rate was 1.5% per month for a 12-month term; for other commercial banks, the interest rate was from 1.5 to 1.8% per month for a 12-month term. Interest rates of loans from moneylenders was as high at 3.8% per month for a 3- month term (table 8.18)
Table 8.18 Interest rate of loan
Interest rate of loan Frequency Min Max Mean
Agri-banks 126 1.2 1.5 1.479 Policy banks 6 1.5 1.7 1.589 Commercial banks 40 1.5 1.8 1.629 Moneylenders 46 3 5 3.80 Relatives 14 1 3 2.8
Source: Survey 1, 2008.
The majority of farmers reported that the current term of the loan period was suitable (70%) and in line with the crop cycle. However, 30% of farmers reported that the term was not suitable because it was too short for the crop season and they could not return the loan in time (Survey 1, 2008). In term of interest rates, AGIFISH negotiates with banks to supply APPU members an
34 Farmers pay 50% of the cost of feed in advance. The remaining 50% left can be used toward their next transaction.

Chapter 8: Farning practices
137
attractive interest rates and APPU members are more satisfied than FA members and individual farmers (see 7.4 for more details).
Box 8.8 Example of loan for fish production
8.6 Extension Services
Extension services are meant to formulate and implement training on production techniques and fish disease management for fish farmers. For this purpose, a training and extension unit was established by local officers, fishery associations and veterinary drugs companies. The survey results (2008) revealed that 56% (112 respondents) of the farmers had attended trainings on production technique. Moreover, 70.5% (141 respondents) mentioned that they had received a leaflet/handout for fish production and disease treatment. They also received direct advices/instruction on fish production techniques (45% of respondents). APPU members receive free training for SQF standards, which are organized by AGIFISH and frequently include workshops and trainings on advanced farming techniques. On the other hand, FA members share knowledge together and receive more training than independent farmers. In addition, the FA magazine usually supplies updates on market information and fish farming for FA members (table 8.19).
In 2006, Mr. A borrowed VND 150 million from the Agri-bank with an interest rate of
1.2% per month to invest in fish culture. However, it was not enough to maintain the pond
and to buy fingerlings and feed. He needed another VND 300 million for buying feed.
Hence, he also borrowed money from an informal organization with a higher interest
(around 3% per month). At the present (2007), he maintained borrowing 150 million VND
from the Agri-bank with an interest rate 1.5 % per month. He mentioned that if he can get
a higher yield of fish this season, he will stop borrowing money from the bank and invest
in his pond by himself.
Source: Khoi et al., 2008.
Quality Management in the Pangasius Export Supply Chain in Vietnam
138
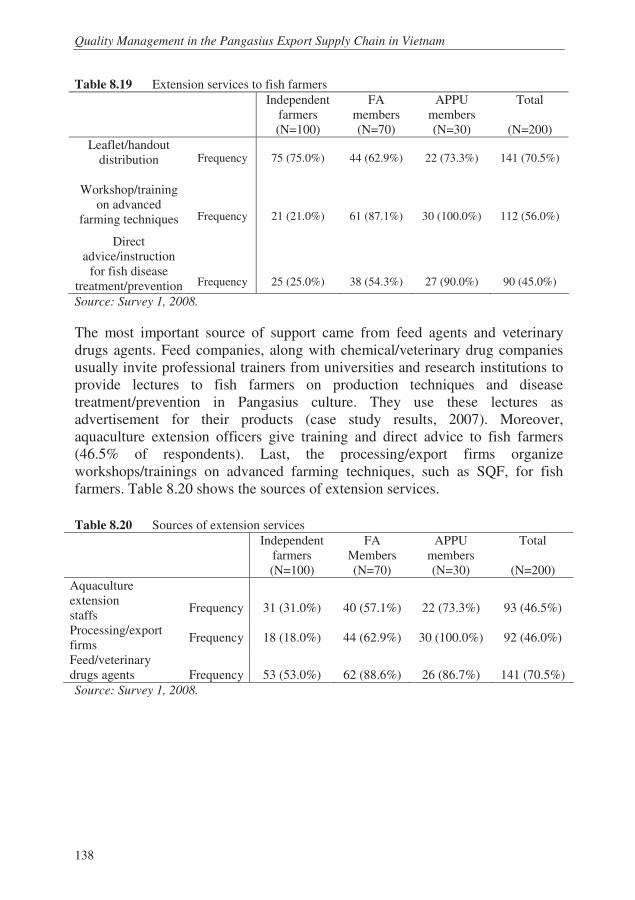
Table 8.19 Extension services to fish farmers
Independent farmers (N=100)
FA members (N=70)
APPU members (N=30)
Total
(N=200)
Leaflet/handout distribution
Frequency
75 (75.0%)
44 (62.9%)
22 (73.3%)
141 (70.5%)
Workshop/training on advanced
farming techniques
Frequency
21 (21.0%)
61 (87.1%)
30 (100.0%)
112 (56.0%)
Direct advice/instruction
for fish disease treatment/prevention
Frequency
25 (25.0%)
38 (54.3%)
27 (90.0%)
90 (45.0%)
Source: Survey 1, 2008.
The most important source of support came from feed agents and veterinary drugs agents. Feed companies, along with chemical/veterinary drug companies usually invite professional trainers from universities and research institutions to provide lectures to fish farmers on production techniques and disease treatment/prevention in Pangasius culture. They use these lectures as advertisement for their products (case study results, 2007). Moreover, aquaculture extension officers give training and direct advice to fish farmers (46.5% of respondents). Last, the processing/export firms organize workshops/trainings on advanced farming techniques, such as SQF, for fish farmers. Table 8.20 shows the sources of extension services.
Table 8.20 Sources of extension services
Independent
farmers (N=100)
FA Members (N=70)
APPU members (N=30)
Total
(N=200)
Aquaculture extension staffs
Frequency
31 (31.0%)
40 (57.1%)
22 (73.3%)
93 (46.5%)
Processing/export firms
Frequency 18 (18.0%) 44 (62.9%) 30 (100.0%) 92 (46.0%)
Feed/veterinary drugs agents
Frequency
53 (53.0%)
62 (88.6%)
26 (86.7%)
141 (70.5%)
Source: Survey 1, 2008.
Chapter 8: Farning practices
139
8.7 Conclusions
This chapter presents the farming practices of three types of farmers. The analysis shows significant differences in farming practices between APPU members, FA members, and individual farmers, such as site selection, water management, fingerlings, stocking density, feed used, and harvest. One of the most alarming results of this chapter is that FA and independent farms do not have enough areas for waste-water treatment at. As a result, most of the waste from these farms is discharged directly into rivers, thereby contaminating the environment. Moreover, independent farmers mainly manage pond water based on their visual observations, as high cost prohibit the use of monitoring equipment. Due to this inadequate system, disease outbreak often occurs in pond farming systems. We found that the sources of fingerlings used by FA members and independent farmers lack certification. APPU farmers use certified fingerlings produced by state-owned hatcheries. The findings indicate that a low stocking density is preferred to minimize disease outbreaks and use of drugs. The APPU members use a lower stocking density and, as a result, receive higher survival rates. On the other hand, small-scale farmers use higher a stocking density, which leads to stunted fish growth, low survival rates, and more fish diseases. The findings reveal that APPU members use industrial feeds for the whole production cycle, while FA members and independent farmers still rely on home-made feeds, which are not certified and tested. As feed cost is the highest percentage of production costs, small-scale farmers lack the necessary finances to purchase industrial feeds for the entire production cycle. We found that APPU members applied advanced farming practices such as SQF 1000CM, and they receive the highest price at the harvest. FA members receive more training and market information than independent farmers and they have more motivation than independent farmers to apply advanced farming practices for better quality of fish and market access. In short, small-scale farmers must improve their quality control systems at the farm level to get higher quality of fish. The fishery experts suggest that small-scale farmers need to cooperate in groups to share the cost of infrastructure, water quality, and input quality to get access to high-value markets.
