tra catfish (pangasius hypophthalmus) residue meals as - slu
TRANSCRIPT

TRA CATFISH (PANGASIUS HYPOPHTHALMUS)
RESIDUE MEALS AS PROTEIN SOURCES FOR
GROWING PIGS
by
Tran Trung Tuan
Institutionen for husdjurens utfodring och vård
SLU
Swedish University of Agricultural Sciences
Department of Animal Nutrition and Management
MSc. Thesis
Uppsala 2010
ISBN 978-86197-99-5

2
TRA CATFISH (PANGASIUS HYPOPHTHALMUS)
RESIDUE MEALS AS PROTEIN SOURCES FOR
GROWING PIGS
by
Tran Trung Tuan
Institutionen for husdjurens utfodring och vård
SLU
Swedish University of Agricultural Sciences
Department of Animal Nutrition and Management
MSc. Thesis
Uppsala 2010
ISBN 978-86197-99-5

3
Dedication
To My parents, my wife Nguyen Huynh Bich Phuong
My daughter Tran Thien Thanh and my son Tran Thiện Thanh

4
Tra catfish (Pangasius hypophthalmus) residue meals as
protein sources for growing pigs
Tran Trung Tuan
Department of Animal Husbandry and Veterinary Science, Faculty of Agriculture and
Natural Resources, Angiang University (AGU), Angiang Province, Vietnam
Abstract
Two experiments were conducted to determine the effect of diets containing Tra catfish
residue meals on total tract apparent digestibility and performance of growing pigs.
Four diets were tested, based on cassava root meal as the energy source: The control diet
(Diet FM) was a basal diet plus marine fish meal; Diet BM was the basal diet plus broken
meat catfish by-product meal; Diet OE was the basal diet plus oil extracted catfish by-
product meal, and Diet BH was the basal diet plus bone and head catfish by-product
meal. In Experiment I, total tract digestibility was determined in four growing pigs in a
4x4 Latin Square design. In the second experiment, the same four diets were fed to 24
growing pigs in a Randomized Complete Block design with four treatments and six
replications.
In Experiment I, there were differences among the diets in the coefficients of apparent
digestibility of dry matter, crude protein, ether extract and ash, that were the highest in
diet BM and lowest in diet BH (P<0.05). Apparent digestibility of organic matter was
highest in diet BH (P<0.05). In Experiment II, there were differences in the average daily
gain (ADG), feed conversion ratio (FCR) and back-fat thickness among diets, with a
descending trend from diets BM, OE, FM and BH (P<0.05). FCR in diets BM and OE
was lower than in diet FM (P<0.05). However, FCR in diet BH was higher than in diet
FM (P<0.05). Back-fat thickness in diets BM and OE was higher than in diet FM
(P<0.05), while diet BH was lower than in diet FM (P<0.05). The iodine number in diet
BM was higher than in diet FM (P<0.05), but on diet BH was lower than on diet FM
(P<0.05). The feed cost per kg weight gain of diet BM was the lowest when compared to
the other treatments (P<0.05). The gross income and net benefit per pig on diet BM were
higher than in the other treatments (P<0.05).
It can be concluded that there were differences in the total tract digestibility of dry matter,
crude protein and ether extract among the protein sources, with the best values in the diet
BM and the worst in diet BH. The ADG, FCR and economic benefits of diet BM were
highest, followed by OE, FM and BH.

5
Key words: Catfish by-product meals, carcass quality, digestibility, economic benefits,
growing pigs, performance
Table of contents
1. Introduction…………………………………………………………………………….8
2. General discussion……………………………………………………….……………..9
2.1 Methods for processing catfish by-products…….………………………...…10
2.2 Nutritive value of catfish by-products………………….……………………11
2.3 Nutrient requirements of pigs…………………………………….………….13
3. Conclusions…………………………………………………………………………....14
4. Acknowledgements…………………...……………………………………………….15
5. References………………………………..……………………………………………16
Paper I……………………………………..……………………………………………..18
Paper II…………………………………..……………………………………………….26
6
Appendix
This thesis is based on the following papers, which are referred to in the text by their
Roman numerals I and II
I. Tran Trung Tuan and Brian Ogle. Evaluation of the apparent digestibility of diets
containing fish meal and Tra catfish by-product residue meals in growing pigs
II. Tran Trung Tuan and Brian Ogle. Effects on performance of replacing fish meal by
Tra catfish by products in the diets of growing pigs

7
List of Abbreviations
AOAC Association of Official Analytical Chemists
CF Crude fibre
CP Crude Protein
CTTAD Coefficient of Total Tract Apparent Digestibility
DM Dry matter
ME Metabolizable Energy
8
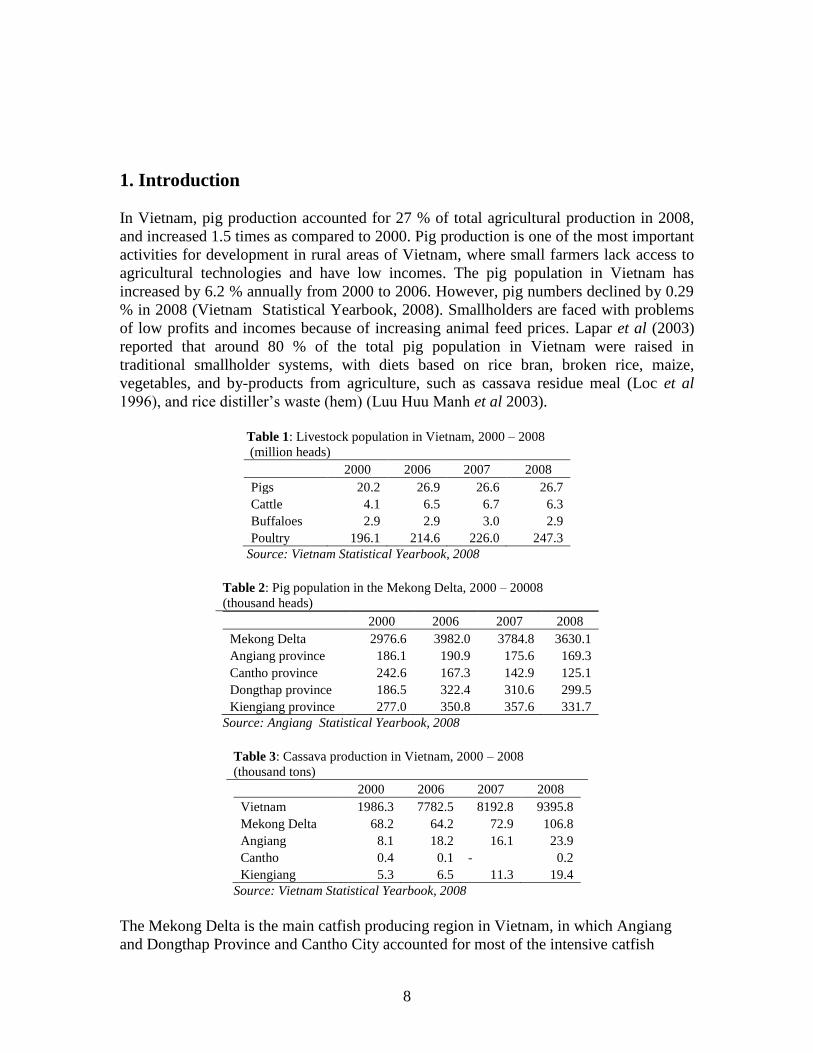
1. Introduction
In Vietnam, pig production accounted for 27 % of total agricultural production in 2008,
and increased 1.5 times as compared to 2000. Pig production is one of the most important
activities for development in rural areas of Vietnam, where small farmers lack access to
agricultural technologies and have low incomes. The pig population in Vietnam has
increased by 6.2 % annually from 2000 to 2006. However, pig numbers declined by 0.29
% in 2008 (Vietnam Statistical Yearbook, 2008). Smallholders are faced with problems
of low profits and incomes because of increasing animal feed prices. Lapar et al (2003)
reported that around 80 % of the total pig population in Vietnam were raised in
traditional smallholder systems, with diets based on rice bran, broken rice, maize,
vegetables, and by-products from agriculture, such as cassava residue meal (Loc et al
1996), and rice distiller’s waste (hem) (Luu Huu Manh et al 2003).
Table 1: Livestock population in Vietnam, 2000 – 2008
(million heads)
2000 2006 2007 2008
Pigs 20.2 26.9 26.6 26.7
Cattle 4.1 6.5 6.7 6.3
Buffaloes 2.9 2.9 3.0 2.9
Poultry 196.1 214.6 226.0 247.3
Source: Vietnam Statistical Yearbook, 2008
Table 2: Pig population in the Mekong Delta, 2000 – 20008
(thousand heads)
2000 2006 2007 2008
Mekong Delta 2976.6 3982.0 3784.8 3630.1
Angiang province 186.1 190.9 175.6 169.3
Cantho province 242.6 167.3 142.9 125.1
Dongthap province 186.5 322.4 310.6 299.5
Kiengiang province 277.0 350.8 357.6 331.7
Source: Angiang Statistical Yearbook, 2008
Table 3: Cassava production in Vietnam, 2000 – 2008
(thousand tons)
2000 2006 2007 2008
Vietnam 1986.3 7782.5 8192.8 9395.8
Mekong Delta 68.2 64.2 72.9 106.8
Angiang 8.1 18.2 16.1 23.9
Cantho 0.4 0.1 - 0.2
Kiengiang 5.3 6.5 11.3 19.4
Source: Vietnam Statistical Yearbook, 2008
The Mekong Delta is the main catfish producing region in Vietnam, in which Angiang
and Dongthap Province and Cantho City accounted for most of the intensive catfish

9
production (Chau Thi Da et al 2010). The development of Tra (Pangasius
hypophthalmus) and Basa (Pangasius bocourti) catfish production is seen in both the
number of ponds and stocking density, with highly intensive culture systems developing
in the frontiers of the Mekong Delta in recent years. The increase of fillet production for
export, which is a high value product, has increased the living standard of people in the
Mekong Delta in the Southern part of Vietnam (Pham Van Khanh 2004). The industrial
catfish farms have been rapidly developing, and are the most important form of
aquaculture. Recently, catfish production was over one million tons from 6,000 ha of
water area in the Mekong Delta in 2009, and this is expected to increase to up to 1.5
million tons from 8,600 ha in 2010, and is predicted to be up to 11,000 and 13,000 ha by
2015 and 2020, respectively (Chau Thi Da et al 2010).
The by-products of catfish processing include heads, skin and viscera, which are the main
products, and account for almost 60 % of the volume that enters the processing factories.
This means that catfish by-product is an important potential source of nutrients of high
value for livestock feed (Lovell 1980). According to Nguyen Thi Thuy et al (2007), the
by-products (head and bone, broken meat and skin) from the fillet processing factories in
Angiang province account for 65 % of the volume, which means that this has a great
potential as a source of protein for animal feeds.
Objectives
The objective of this research was to study if Tra catfish residue meal can replace
traditional fish meal in diets for growing pigs without affecting the diet digestibility and
the growth performance, and with economic benefits to producers.
The experiments were conducted with growing pigs to:
Determine the apparent digestibility of dry matter, crude protein, ether
extract, and ash in Tra catfish residue meals.
Determine the live weight gain, feed conversion ratio, back-fat thickness
and economic benefits of feeding catfish by-products.
2. General discussion
In the Mekong Delta, where a major part of farmers are growing paddy rice for sale, pig
diets are usually based on rice bran, broken rice, maize and cassava root meal as the main
ingredients to supply dietary energy. These are mixed with sources of protein, such as
commercial concentrates, marine fish meal and soybean meal, in home-made concentrate
diets for pigs, and/or complete commercial feeds. In recent years, use of commercial feed
has been increasing, and the price of marine fish meal has also been increasing as a result
of the increasing cost of oil. Moreover, pig diets are based on rice bran, vegetable and
agricultural by-products such as sweet potato vine, cassava residue and hulled groundnut
cake, and therefore containing high fibre, and low protein and energy levels (Loc et al,
10
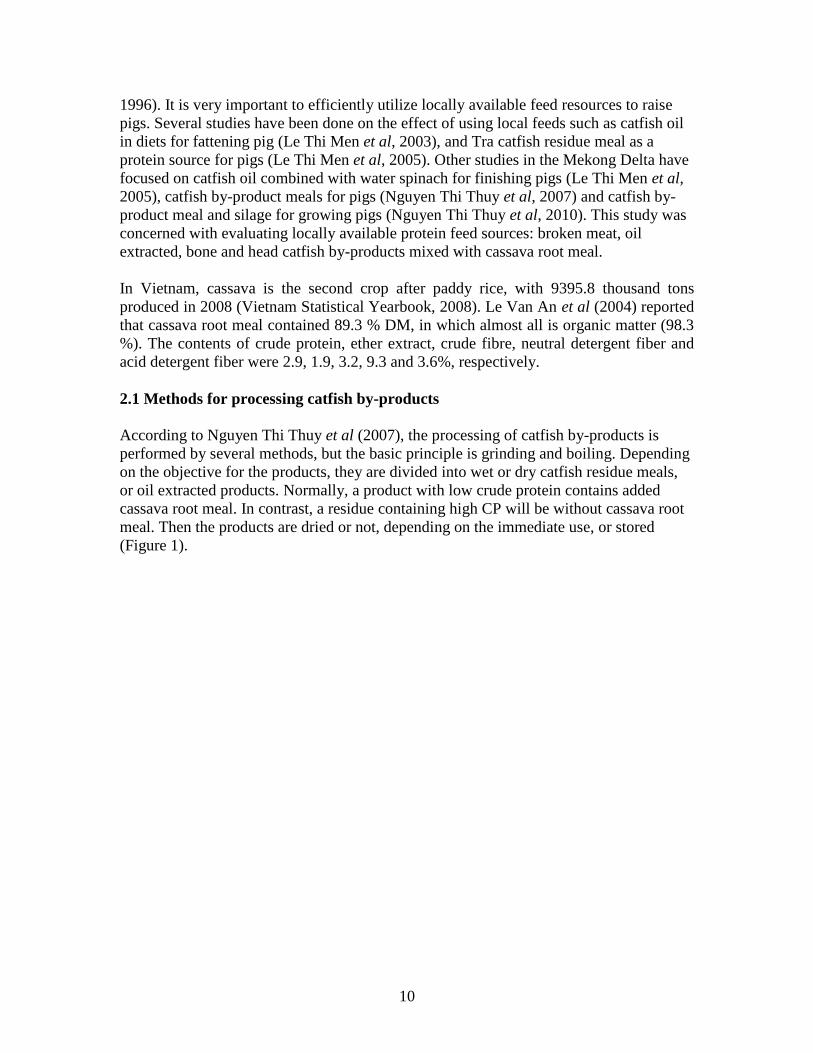
1996). It is very important to efficiently utilize locally available feed resources to raise
pigs. Several studies have been done on the effect of using local feeds such as catfish oil
in diets for fattening pig (Le Thi Men et al, 2003), and Tra catfish residue meal as a
protein source for pigs (Le Thi Men et al, 2005). Other studies in the Mekong Delta have
focused on catfish oil combined with water spinach for finishing pigs (Le Thi Men et al,
2005), catfish by-product meals for pigs (Nguyen Thi Thuy et al, 2007) and catfish by-
product meal and silage for growing pigs (Nguyen Thi Thuy et al, 2010). This study was
concerned with evaluating locally available protein feed sources: broken meat, oil
extracted, bone and head catfish by-products mixed with cassava root meal.
In Vietnam, cassava is the second crop after paddy rice, with 9395.8 thousand tons
produced in 2008 (Vietnam Statistical Yearbook, 2008). Le Van An et al (2004) reported
that cassava root meal contained 89.3 % DM, in which almost all is organic matter (98.3
%). The contents of crude protein, ether extract, crude fibre, neutral detergent fiber and
acid detergent fiber were 2.9, 1.9, 3.2, 9.3 and 3.6%, respectively.
2.1 Methods for processing catfish by-products
According to Nguyen Thi Thuy et al (2007), the processing of catfish by-products is
performed by several methods, but the basic principle is grinding and boiling. Depending
on the objective for the products, they are divided into wet or dry catfish residue meals,
or oil extracted products. Normally, a product with low crude protein contains added
cassava root meal. In contrast, a residue containing high CP will be without cassava root
meal. Then the products are dried or not, depending on the immediate use, or stored
(Figure 1).

11
Figure 1. Catfish by-product processing methods
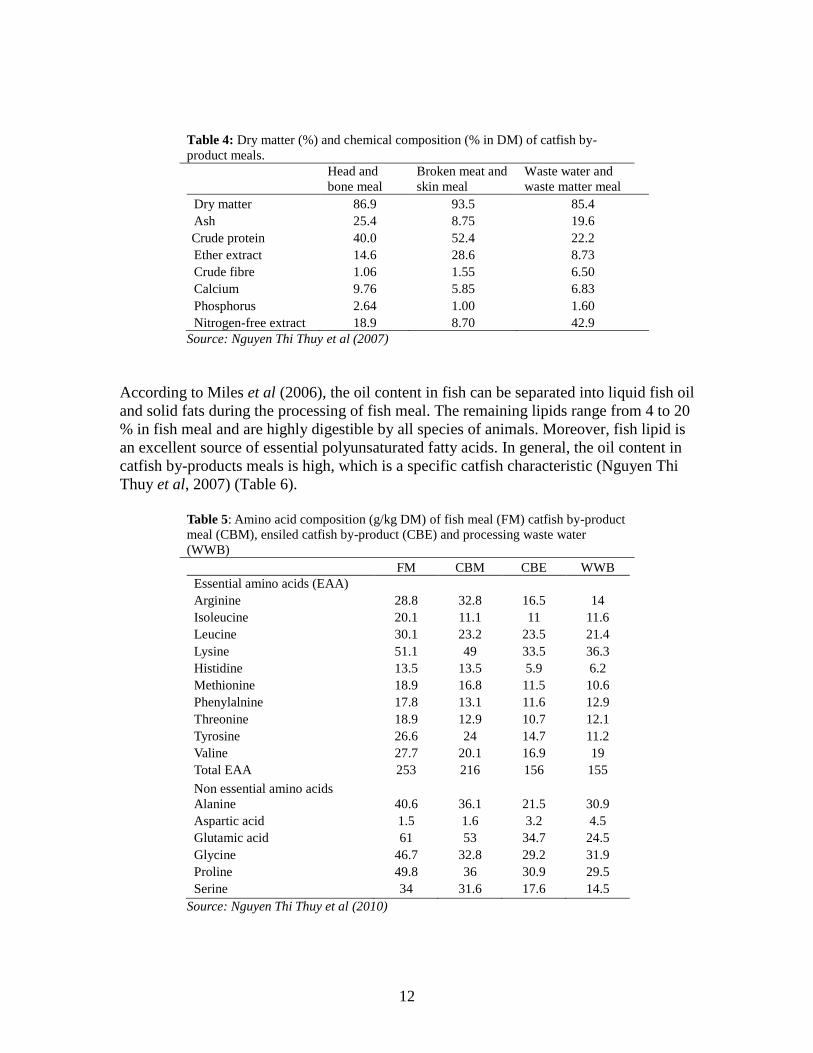
2.2 Nutritive value of catfish by-products
Nguyen Thi Thuy et al (2007) reported that catfish by-product meal was classified into
three groups: head and bone, broken meat and skin, and waste water and waste matter. Of
these, broken meat and skin contained the highest level of crude protein and ether extract,
and the lowest contents of ash, crude fibre, calcium, phosphorus and nitrogen free extract.
In contrast, the lowest value of crude protein and ether extract were in waste water and
waste matter. Moreover, the highest concentration of ash, calcium and phosphorus were
found in head and bone. Furthermore, among catfish by-product meals, waste water and
waste matter contained the highest concentrations of crude fibre and nitrogen free extract
(Table 4).
Essential amino acids are named essential because they cannot be synthesized by the
animal at all or not in sufficient amounts, and therefore, must be supplied in the diet. The
composition of amino acids contained in protein and their digestibility determine the
nutritive value of that protein. An imbalanced protein that does not contain the correct
proportion of amino acids would have a lower nutritive value. The animal has a specific
requirement of amino acids rather than of protein (Table 5).
12
Table 4: Dry matter (%) and chemical composition (% in DM) of catfish by-
product meals.
Head and
bone meal
Broken meat and
skin meal
Waste water and
waste matter meal
Dry matter 86.9 93.5 85.4
Ash 25.4 8.75 19.6
Crude protein 40.0 52.4 22.2
Ether extract 14.6 28.6 8.73
Crude fibre 1.06 1.55 6.50
Calcium 9.76 5.85 6.83
Phosphorus 2.64 1.00 1.60
Nitrogen-free extract 18.9 8.70 42.9
Source: Nguyen Thi Thuy et al (2007)
According to Miles et al (2006), the oil content in fish can be separated into liquid fish oil
and solid fats during the processing of fish meal. The remaining lipids range from 4 to 20
% in fish meal and are highly digestible by all species of animals. Moreover, fish lipid is
an excellent source of essential polyunsaturated fatty acids. In general, the oil content in
catfish by-products meals is high, which is a specific catfish characteristic (Nguyen Thi
Thuy et al, 2007) (Table 6).
Table 5: Amino acid composition (g/kg DM) of fish meal (FM) catfish by-product
meal (CBM), ensiled catfish by-product (CBE) and processing waste water
(WWB)
FM CBM CBE WWB
Essential amino acids (EAA)
Arginine 28.8 32.8 16.5 14
Isoleucine 20.1 11.1 11 11.6
Leucine 30.1 23.2 23.5 21.4
Lysine 51.1 49 33.5 36.3
Histidine 13.5 13.5 5.9 6.2
Methionine 18.9 16.8 11.5 10.6
Phenylalnine 17.8 13.1 11.6 12.9
Threonine 18.9 12.9 10.7 12.1
Tyrosine 26.6 24 14.7 11.2
Valine 27.7 20.1 16.9 19
Total EAA 253 216 156 155
Non essential amino acids
Alanine 40.6 36.1 21.5 30.9
Aspartic acid 1.5 1.6 3.2 4.5
Glutamic acid 61 53 34.7 24.5
Glycine 46.7 32.8 29.2 31.9
Proline 49.8 36 30.9 29.5
Serine 34 31.6 17.6 14.5
Source: Nguyen Thi Thuy et al (2010)

13
Table 6: Fatty acid composition (% in DM) of catfish by-product meals
Head and
bone meal
Broken meat
and skin meal
Waste water and
waste matter meal
Lauric C12:0 0.24 0.53 0.10
Myristic C14:0 3.96 4.52 3.53
Palmitic C16:0 33.4 32.4 36.3
Palmitoleic C16:1 1.78 0.90 1.70
Stearic C18:0 9.74 8.23 11.5
Oleic C18:1 36.1 38.8 34.2
Linoleic C18:2 6.47 8.15 3.77
Linolenic C18:3 0.53 0.73 0.23
Arachidic C20:0 0.34 0.20 0.37
Eicosenoic C20:1 1.29 1.20 1.67
Behenic C22:0 0.24 0.25 0.20
Cetoleic C 22:1 0.20 0.18 0.33
Source: Nguyen Thi Thuy et al (2007)
2.3 Nutrient requirements of pigs
According to NRC (1998), the dietary requirements of growing pigs are as shown in
Table 7, in diets which are based on maize and soybean meal and fed ad libitum.
Table 7: Dietary requirements of pigs allowed feed based on maize
and soybean meal and fed ad libitum (90% dry matter)
Body weight (kg)
20-50 50-80 80-120
Average weight (kg) 35 65 100
ME content of diets (J/kg) 13.6 13.6 13.6
Crude protein (%) 18 15.5 13
Estimate feed intake (g/day) 1855 2575 3075
Amino acid requirement (%)
Arginine 0.37 0.27 0.19
Histidine 0.30 0.24 0.19
Isoleucine 0.51 0.42 0.33
Leucine 0.90 0.71 0.54
Lysine 0.95 0.75 0.60
Methionine 0.25 0.20 0.16
Methionine+cystine 0.54 0.44 0.35
Phenylalanine 0.55 0.44 0.34
Phenylalanine + tyrosine 0.87 0.70 0.55
Threonine 0.61 0.51 0.41
Tryptophan 0.17 0.14 0.11
Valine 0.64 0.52 0.40
In the tropical regions, the nutritional requirements for pigs are different from those in the
temperate countries. High ambient temperatures can be beneficial in that little energy is
needed to maintain body temperature. In addition, there is a negative effect of high
ambient temperature, which reduces voluntary feed intake (Preston, 1995).
14
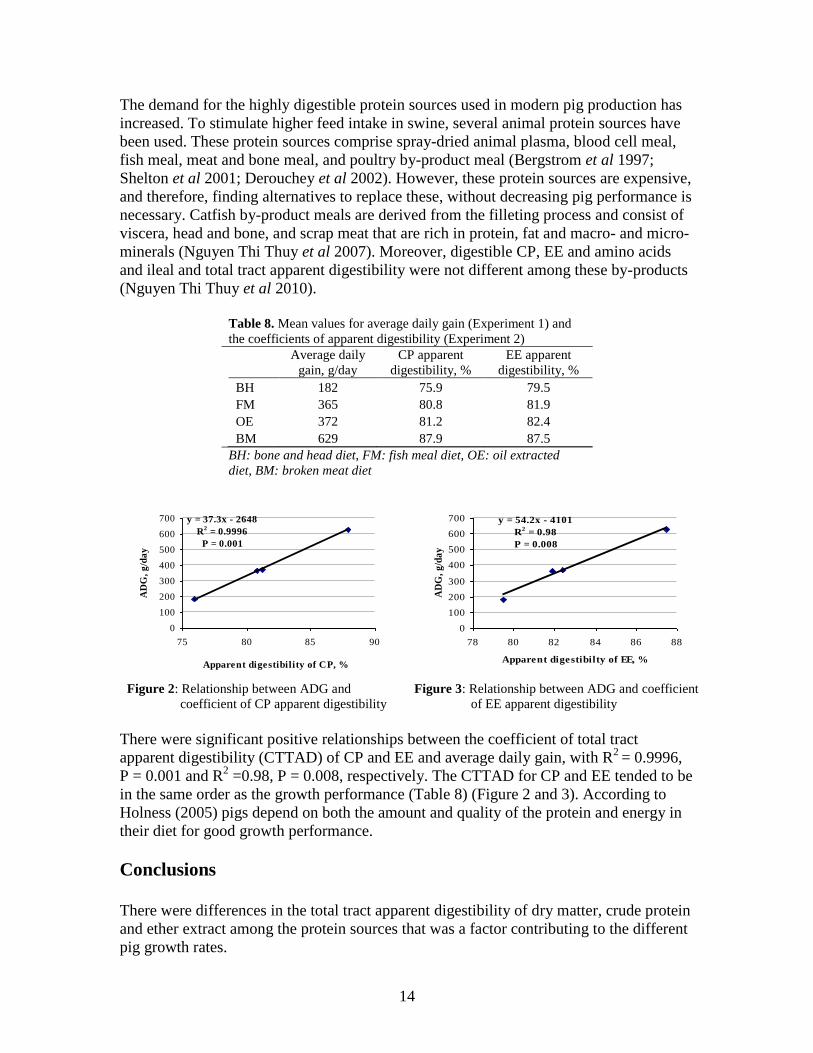
The demand for the highly digestible protein sources used in modern pig production has
increased. To stimulate higher feed intake in swine, several animal protein sources have
been used. These protein sources comprise spray-dried animal plasma, blood cell meal,
fish meal, meat and bone meal, and poultry by-product meal (Bergstrom et al 1997;
Shelton et al 2001; Derouchey et al 2002). However, these protein sources are expensive,
and therefore, finding alternatives to replace these, without decreasing pig performance is
necessary. Catfish by-product meals are derived from the filleting process and consist of
viscera, head and bone, and scrap meat that are rich in protein, fat and macro- and micro-
minerals (Nguyen Thi Thuy et al 2007). Moreover, digestible CP, EE and amino acids
and ileal and total tract apparent digestibility were not different among these by-products
(Nguyen Thi Thuy et al 2010).
Table 8. Mean values for average daily gain (Experiment 1) and
the coefficients of apparent digestibility (Experiment 2)
Average daily
gain, g/day
CP apparent
digestibility, %
EE apparent
digestibility, %
BH 182 75.9 79.5
FM 365 80.8 81.9
OE 372 81.2 82.4
BM 629 87.9 87.5
BH: bone and head diet, FM: fish meal diet, OE: oil extracted
diet, BM: broken meat diet
y = 37.3x - 2648
R2 = 0.9996
P = 0.001
0
100
200
300
400
500
600
700
75 80 85 90
Apparent digestibility of CP, %
AD
G,
g/d
ay
y = 54.2x - 4101
R2 = 0.98
P = 0.008
0
100
200
300
400
500
600
700
78 80 82 84 86 88
Apparent digestibilty of EE, %
AD
G,
g/d
ay
Figure 2: Relationship between ADG and
coefficient of CP apparent digestibility Figure 3: Relationship between ADG and coefficient
of EE apparent digestibility
There were significant positive relationships between the coefficient of total tract
apparent digestibility (CTTAD) of CP and EE and average daily gain, with R2
= 0.9996,
P = 0.001 and R2 =0.98, P = 0.008, respectively. The CTTAD for CP and EE tended to be
in the same order as the growth performance (Table 8) (Figure 2 and 3). According to
Holness (2005) pigs depend on both the amount and quality of the protein and energy in
their diet for good growth performance.
Conclusions
There were differences in the total tract apparent digestibility of dry matter, crude protein
and ether extract among the protein sources that was a factor contributing to the different
pig growth rates.

15
Average daily gain, feed conversion ratio and economic benefit of the broken meat (BM)
diet were best, followed by oil extracted (OE) meal and marine fish meal (FM). The
poorest performance was on the bone and head meal diet (BH). Furthermore, iodine
number in back-fat in decreasing order was BM, OE, FM and BH.
Acknowledgements
The studies presented in this thesis were conducted in the Angiang University
Experiment Station in Chau Phu district, Angiang Province, Vietnam, supported by the
Swedish International Development Agency/Department for Research Cooperation with
Developing Countries (Sida/SAREC).
I would like to express my gratitude to the Swedish International Development Co-
operation Agency, Department for Research Cooperation (Sida-SAREC) for the financial
support of this thesis research.
I would like to express my gratitude to Professor Brian Ogle, Director of the ‘Regional-
SAREC MEKARN Sustainable Livestock Production Systems’ Project, Department of
Animal Nutrition and Management, Swedish University of Agricultural Sciences, my
supervisor, for valuable advice and useful guidance during the study period.
I would like to express my gratitude to Dr. Thomas Reg Preston, who helped me during
the period of the study.
I would like to express my gratitude to Dr. Ngo Van Man, Regional Coordinator and Mr.
Nguyen Van Cong for their valuable support.
I would also like to express my appreciation to all of the professors, associate professors,
doctors and instructors who provided me with useful knowledge during the courses.
I would like to thank colleagues in Department of Animal Husbandry and Veterinary
Science, Faculty of Agriculture and Natural Resources, Angiang University, who shared
my work in the office during my research.
I would like to give my best wishes to my parents, my older sisters and younger brothers
for their sentiment; to my wife for her love and her sharing in all happiness and sadness;
to my children daughter and son for her warmness given to me.
16
References
Angiang Statistical Yearbook 2008 Statistical Publishing House, Angiang
Bergstrom J R, Nelssen J L, Tokach M D, Goodband R D, Dritz S S, Owen K Q and
Nessmith W B 1997 Evaluation of Spray-Dried Animal Plasma and Select Menhaden
Fish Meal in Transition Diets of Pigs Weaned at 12 to 14 Days of Age and Reared in
Different Production Systems. Journal of Animal Science Vol.75 P.3004-3009
Chau Thi Da, Bui X Thanh and Håkan T 2010 Current situation analysis and
environmental impacts of striped catfish (Pangasianodom hypophthalmus) farming
practices in the vicinity of the Mekong delta area, Vietnam: A review AUN/SEED-Net
2nd reginal conference on global environment, Vietnam National University-HCMC
Publisher, KT.01.MT(V)/DHQG.HCM-10. ISBN: 191-2010/CXB/02-8
Derouchey J M, Tokach M D, Nelssen J L, Goodband R D, Dritz S S, Woodworth J
C and James B W 2002 Comparison of spray-dried blood meal and blood cells in diets
for nursery pigs. Journal of Animal Science 80 2879-2886
Holness 2005 Pigs, revised edition The Tropical Agriculturalist
Lapar M L, Binh, V T and Ehui S 2003. Identifying barriers to entry to livestock input
and output market in Southeast Asia.
www.fao.org/ag/againfo/resources/en/publications/sector_reports/lsr_VNM.pdf
Le Thi Men, Huynh Huu Chi, Ngo Vi Nghia, Nguyen Thi Kim Khang, Brian Ogle
and T R Preston 2003 Utilization of catfish oil in diets based on dried cassava root
waste for crossbred fattening pigs in the Mekong delta of Vietnam Livestock Research
for Rural Development (15) 4 2003 http://www.lrrd.org/lrrd15/4/men154.htm
Le Thi Men, T R Preston, Truong Van Hieu, Duong T Ngan and Huynh Thu Loan
2005 Evaluation of Tra catfish (Pangasius hypophthalmus) residue meal to replace fish
meal in diets for fattening pigs in the Mekong Delta of Vietnam Workshop-seminar, 23-
25 May, 2005, MEKARN-CTU http://www.mekarn.org/proctu/lemen37.htm
Le Van An, Tran Thi Thu Hong and Jan Erik Lindberg 2004 Ileal and total tract
digestibility in growing pigs fed cassava root meal diets with inclusion of fresh, dry and
ensiled sweet potato (Ipomoea batatas L. (Lam.)) leaves. Animal Feed Science and
Technology Vol.114 127–139
Luu Huu Manh, Nguyen Nhut Xuan Dung and Erik Lindberg 2003 Effects of
replacement of fish meal with rice distiller’s waste (hem) on performance and carcass
quality of growing pigs Workshop-seminar "Making better use of local feed resources"
SAREC-UAF, Hue, March, 2003 http://www.mekarn.org/sarec03/manh3.htm

17
Miles R D and Chapman F A 2006 The Benefits of fish meal in aquaculture diets The
fishsite.com, University of Florida IFAS extension
National Research Council 1998 Nutrient requirements of swine, Tenth revised edition
Nguyen Thi Loc, Ogle B and Preston T R 1996. Pig production in Central Vietnam:
Results of a participatory rural appraisal survey and on-farm feeding trials with protein
supplementation of traditional diets. Integrated Farming in Human Development.
Proceedings of a Workshop. March 25 – 29, 1996. Tune Landboskole, Denmark.
Nguyen Thi Thuy, Jan Erik Lindberg and Brian Ogle 2010 Digestibility and nitrogen
balance of diets that include marine fish meal, catfish (Pangasius hypophthalmus) by-
product meal and silage, and processing waste water in growing pigs Asian-Australasian
Journal of Animal Science (In Press)
Nguyen Thi Thuy, Nguyen Tan Loc, J E Lindberg and B Ogle 2007 Survey of the
production, processing and nutritive value of catfish by product meals in the Mekong
Delta of Vietnam. Livestock Research for Rural Development 19, 124
www.cipav.org.co/lrrd/lrrd19/9/thuy 19124.htm
Pham Van Khanh 2004 Techniques for raising Tra and Basa Catfish in floating cages.
Institute of Research on Aquaculture. Agriculture Publishing House, Ho Chi Minh City,
Vietnam (in Vietnamese)
Preston T R 1995 Tropical Animal Feeding: a manual for research workers. Animal
Production and Health Paper 126. FAO, Rome, Italy. pp. 305
Richard T and Lovell S 1980 Utilisation of catfish processing waste. Bulletin 521,
October 1980
Shelton J L, Hemann M D, Strode R M, Brashear G L, Ellis M, McKeith F K,
Bidner T D and Southern L L 2001. Effect of different protein sources on growth and
carcass traits in growing-finishing pigs. Journal of Animal Science 79, 2428-2435
Vietnam Statistical Yearbook 2008 Statistical Publishing House, Hanoi

18
Evaluation of the apparent digestibility of diets containing fish
meal and Tra catfish (Pangasius hypophthalmus) by-product
residue meals in growing pigs
Tran Trung Tuan and Brian Ogle*
Department of Animal Husbandry and Veterinary Science,
Faculty of Agriculture and Natural Resources, Angiang University (AGU),
Angiang province, Vietnam
*Department of Animal Nutrition and Management, Swedish University of
Agricultural Sciences, PO Box 7024, S-750 07 Uppsala, Sweden
Abstract
The coefficients of total tract apparent digestibility (CTTAD) of diets with four different
protein sources were determined in growing pigs. The four diets were based on cassava
root meal as energy source. Control diet (FM) included marine fish meal as the main
protein source, diet BM included broken meat catfish by-product meal, diet OE included
oil extracted catfish by-product meal and diet BH included bone and head catfish by-
product meal. The four diets were fed to four growing pigs in a 4x4 Latin Square design.
There were differences among the diets in the CTTAD of dry matter (DM), crude protein
(CP), ether extract (EE) and ash, with the highest CTTAD of DM and CP in BM (87.8 %
and 87.9 %, respectively) and the lowest in BH (77.5 % and 75.9 %, respectively)
(P<0.05). Apparent digestibility of organic matter was highest in diet BH (91.3 %)
(P<0.05), and lowest in diet FM (86.6 %) and diet OE (86.7 %). There was a significant
negative relationship between apparent digestibility of CP and ash content in the diet
(R2=0.95; P<0.05). It can be concluded that the total tract apparent digestibility of dry
matter, crude protein and ether extract was highest in the diet with broken meat by-
product meal and lowest in the diet with bone and head by-product meal.
Key words: Catfish by-product meals, growing pig, total tract apparent digestibility.
Introduction
In the Mekong Delta, the total number of livestock and fish farms in 2008 was 2,530 and
25,311, respectively (Vietnam Statistical Yearbook, 2008), and Angiang Province
accounted for 69 and 1,455 of these, respectively (Angiang Statistical Yearbook, 2008).
Utilization of sources of nutrients that are by-products from crop production, such as
broken rice, rice bran and cassava root meal, together with fish meal and vegetables for

19
pig production in smallholder farms in the Mekong Delta is common, and pigs sales
account for a substantial percentage of cash income (Kamakawa et al 2003).
There are two common methods to process catfish by-products, boiling and drying.
According to Bui Xuan Men (2005), the crude protein content in the residue meal is not
influenced by the processing method of the catfish by-product. However, the protein
content is very different between the sources of the by-product (head and bone by-
product, broken meat meal and skin). Nguyen Thi Thuy et al (2007) for example reported
that the crude protein content in catfish by-products ranges from 37.1 to 61.0 % in DM.
Catfish by-product meal contains a high level of fat; it ranges from 6.3 to 33.8 % in DM
depending on the source of catfish by-product and processing method, and is higher than
in conventional fish meals, especially the content of unsaturated fatty acids (Nguyen Thi
Thuy et al 2007). This means that it is difficult to store because of auto-oxidation and
breakdown of the fatty acids. Especially when fed to pigs it causes soft fat in the carcass
(Maw et al 2002).
The present experiment was carried out to determine the apparent digestibility of
nutrients in diets based on cassava root meal and containing fish meal and different
catfish processing by-products as protein sources.
Materials and methods
Location and climate of the study area
The experiment was conducted in the Angiang University Experiment Station in Chau
Phu District, Angiang Province, from September 9th
to November 18th
2009.
The average annual temperature is 270C, with the highest temperatures of 35 to 36
0C
from April to May and the lowest, of 20 to 210C from December to January. The mean
annual rainfall is 1400 to 1500 millimeters. The climate has two seasons, the rainy season
from May to November and the dry season from December to April (Angiang Portal
2008).
Animals and management
The animals in the experiment were bought from a private farm in Angiang Province.
Four crossbred (Landrace x Yorkshire x Duroc) castrated male pigs with a mean body
weight at 60 days of age of 18.5 ± 0.5 kg were used. All pigs were vaccinated against hog
cholera and foot and mouth disease and were treated against round worms by
Levamysole before starting the experiment.
The pigs were kept in metabolism cages (0.8 m x 0.8 m) made of wood and bamboo and
designed to allow recording of feed intake and separate collection of feces and urine.

20
Experimental feeds
All diet ingredients were bought at the same time. Cassava root meal and fish meal were
bought from a local animal feed shop, and head and bone catfish by-product meal, broken
meat catfish by-product meal and oil extracted catfish by-product meal were bought from
local catfish processing factories in Angiang Province. Before making the dietary
formula, samples of ingredients were taken and analyzed for crude protein, and then were
mixed together following the formula every week.
Treatments
The four protein sources and diets were:
Control diet (FM): Cassava root meal plus marine fish meal and one
percent of a premix of minerals and vitamins.
Diet BM: Cassava root meal plus broken meat catfish by-product meal
and one percent of a premix of minerals and vitamins.
Diet OE: Cassava root meal plus oil extracted catfish by-product meal and
one percent of a premix of minerals and vitamins.
Diet BH: Cassava root meal plus catfish bone and head by-product meal
and one percent of a premix of minerals and vitamins.
Experimental design
The digestibility experiment was designed as a 4 x 4 Latin Square (Table 1) with 14 days
for each period. The first seven days were for adaptation to the experimental diets, which
were fed ad libitum. For the last seven days the amount of feed offered was reduced to 90
% of the previous ad libitum intake, and the last five days were for feces collection.
Table 1. Experimental layout
Pigs 1 2 3 4
Period 1 FM BH BM OE
Period 2 BH BM OE FM
Period 3 BM OE FM BH
Period 4 OE FM BH BM
Measurements and data collection
During the last five days of each period, the amount of offered and refused feed was
recorded to calculate feed intake. Samples of feed offered and feces of individual pigs
were collected in the morning and stored at -4oC. At the end of the experiment total
samples were pooled and sub-samples taken for analysis.
21
Chemical analysis
Samples of feed and feces were analyzed for dry matter (DM) ether extract (EE) and ash
according to the standard methods of AOAC (1990), and crude protein (CP) was
determined by the Kjeldahl procedure.
Statistical analysis
The data for apparent digestibility of dry matter, crude protein, ether extract and ash were
analyzed as a Latin Square Design by using the General Linear Model (GLM) of the
Analysis of Variance (ANOVA) procedure of the Minitab statistical software release 14
(Minitab, 2003). The Tukey Test for pair-wise comparisons was used to separate means
when the differences were significant at the five percent level. Sources of variation were:
animals, treatments, periods and error.
Results
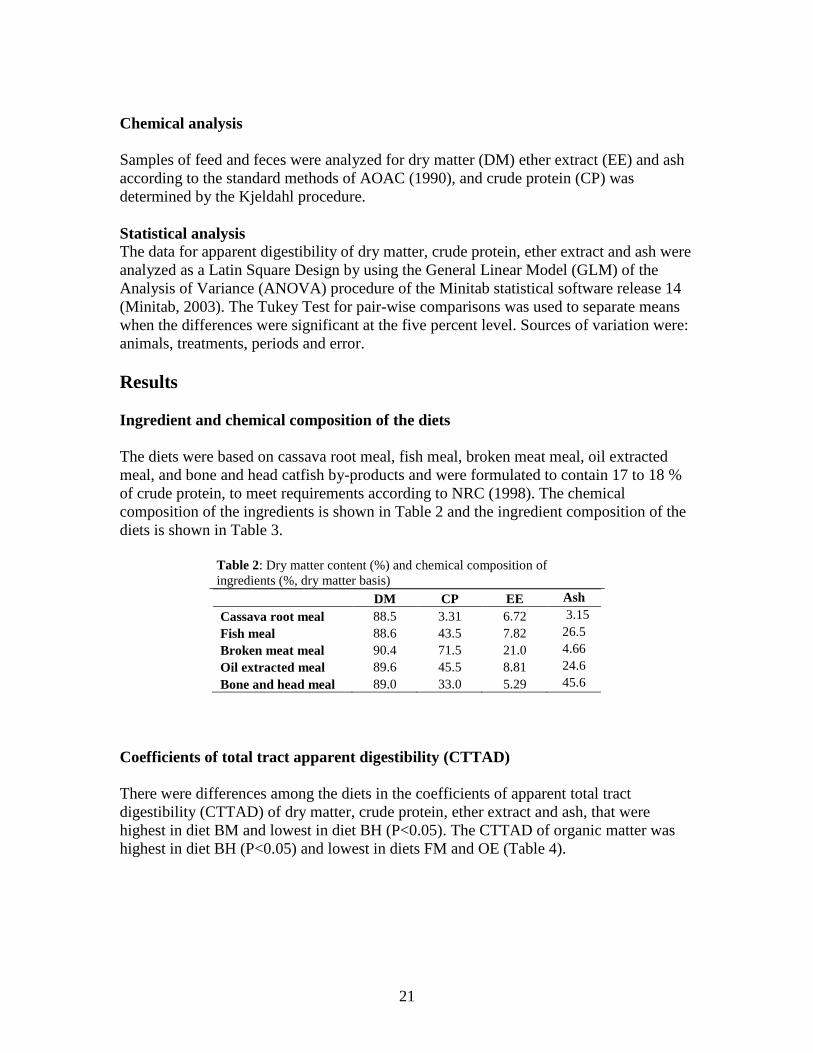
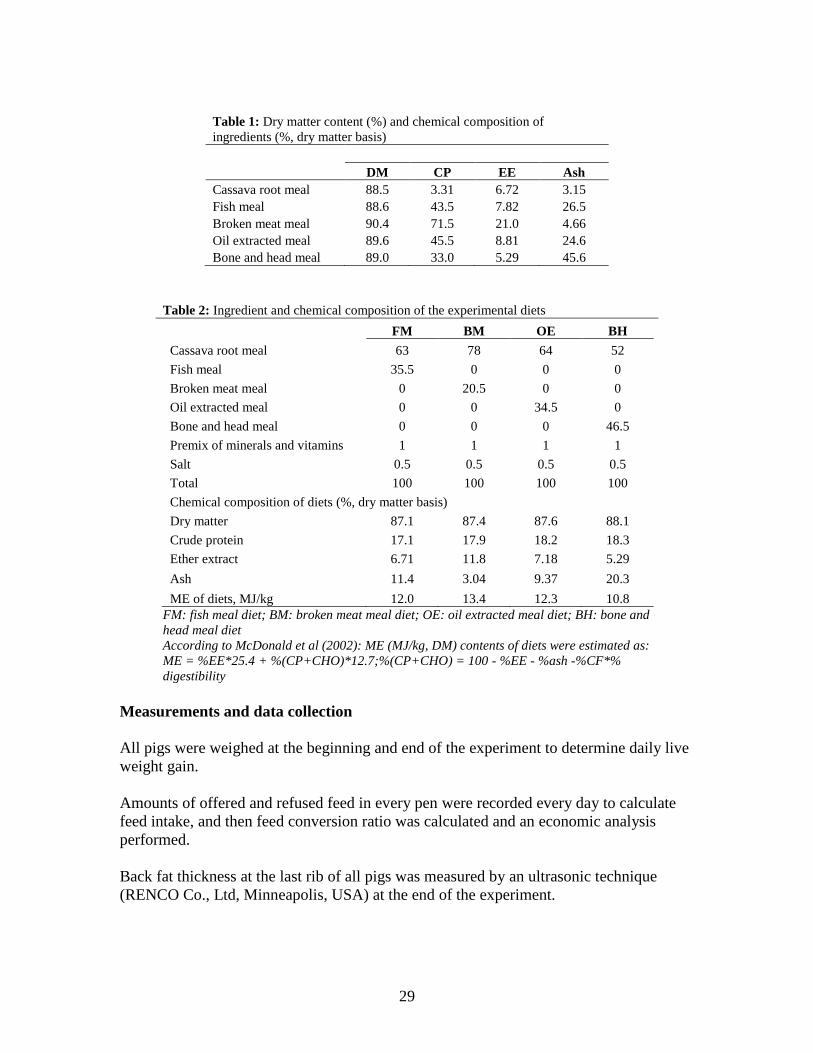
Ingredient and chemical composition of the diets
The diets were based on cassava root meal, fish meal, broken meat meal, oil extracted
meal, and bone and head catfish by-products and were formulated to contain 17 to 18 %
of crude protein, to meet requirements according to NRC (1998). The chemical
composition of the ingredients is shown in Table 2 and the ingredient composition of the
diets is shown in Table 3.
Table 2: Dry matter content (%) and chemical composition of
ingredients (%, dry matter basis)
DM CP EE Ash
Cassava root meal 88.5 3.31 6.72 3.15
Fish meal 88.6 43.5 7.82 26.5
Broken meat meal 90.4 71.5 21.0 4.66
Oil extracted meal 89.6 45.5 8.81 24.6
Bone and head meal 89.0 33.0 5.29 45.6
Coefficients of total tract apparent digestibility (CTTAD)
There were differences among the diets in the coefficients of apparent total tract
digestibility (CTTAD) of dry matter, crude protein, ether extract and ash, that were
highest in diet BM and lowest in diet BH (P<0.05). The CTTAD of organic matter was
highest in diet BH (P<0.05) and lowest in diets FM and OE (Table 4).
22
Table 3: Ingredient and chemical composition (%) of the experimental diets
FM BM OE BH
Cassava root meal 63 78 64 52
Fish meal 35.5 0 0 0
Broken meat meal 0 20.5 0 0
Oil extracted meal 0 0 34.5 0
Bone and head meal 0 0 0 46.5
Premix of minerals and vitamins 1 1 1 1
Salt 0.5 0.5 0.5 0.5
Total 100 100 100 100
Chemical composition of diets (%, dry matter basis)
Dry matter 87.1 87.4 87.6 88.1
Crude protein 17.1 17.9 18.2 18.3
Ether extract 6.71 11.8 7.18 5.29
Crude fibre 3.17 2.92 3.11 2.48
Ash 11.4 3.04 9.37 20.3
FM: fish meal diet; BM: broken meat meal diet; OE: oil extracted meal diet; BH:
bone and head meal diet
Table 4: Coefficients of total tract apparent digestibility (%) of the experimental
diets in pigs
FM BM OE BH SEM P
Dry matter 79.9b 87.8
a 81.4
b 77.5
b 1.64 0.001
Organic matter 86.6b 89.9
ab 86.7
b 91.3
a 1.22 0.016
Crude protein 80.8b 87.9
a 81.2
b 75.9
b 1.65 0.001
Ether extract 81.9ab
87.5a 82.4
ab 79.5
b 1.59 0.006
Ash 56.5ab
62.8a 53.7
ab 48.1
b 3.77 0.050
FM: fish meal diet; BM: broken meat meal diet; OE: oil extracted meal diet; BH:
bone and head meal diet; a-b
Means within row with different letters differ
significantly (P<0.05)
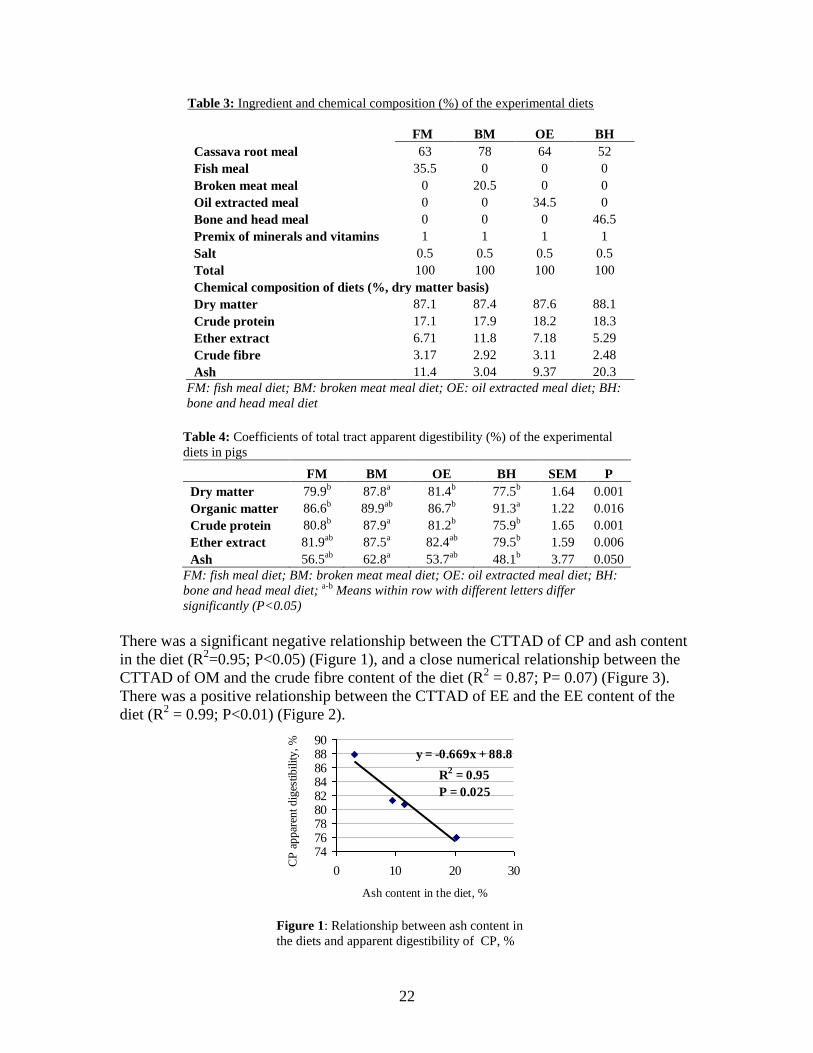
There was a significant negative relationship between the CTTAD of CP and ash content
in the diet (R2=0.95; P<0.05) (Figure 1), and a close numerical relationship between the
CTTAD of OM and the crude fibre content of the diet (R2 = 0.87; P= 0.07) (Figure 3).
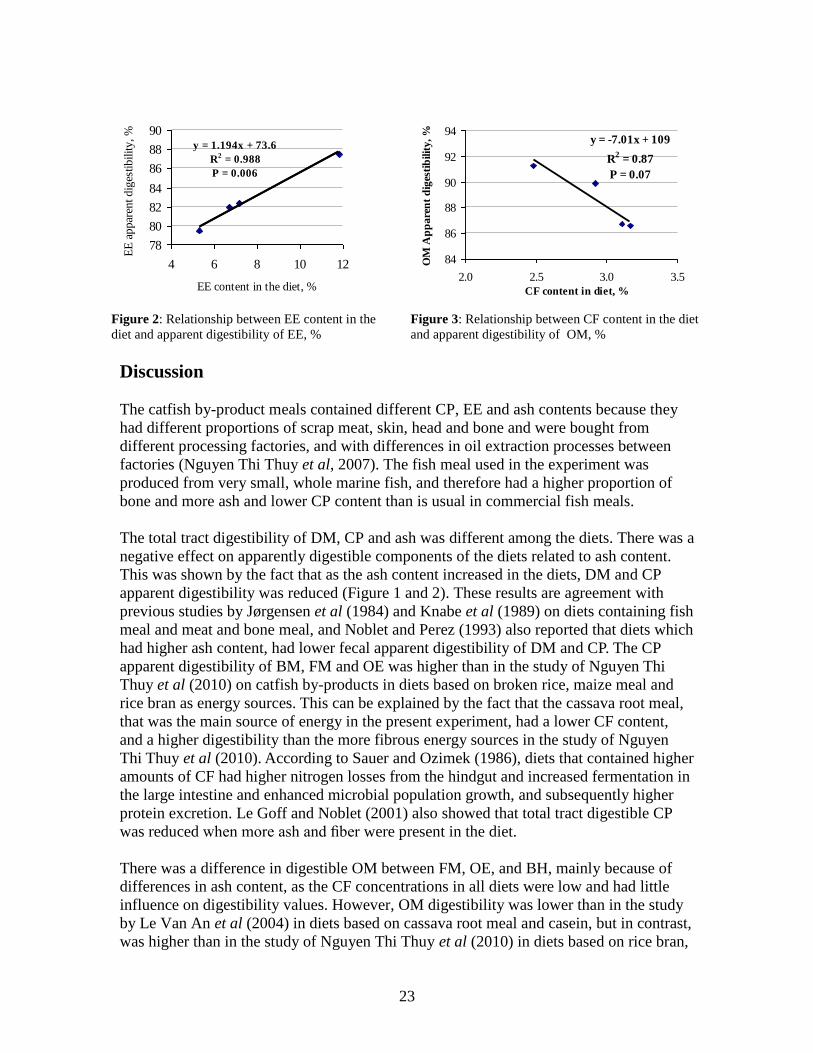
There was a positive relationship between the CTTAD of EE and the EE content of the
diet (R2 = 0.99; P<0.01) (Figure 2).
y = -0.669x + 88.8
R2 = 0.95
P = 0.025
747678808284868890
0 10 20 30
Ash content in the diet, %
CP
appar
ent dig
estibility, %
Figure 1: Relationship between ash content in
the diets and apparent digestibility of CP, %
23
y = 1.194x + 73.6
R2 = 0.988
P = 0.006
78
80
82
84
86
88
90
4 6 8 10 12
EE content in the diet, %
EE
appar
ent dig
estibility, %
y = -7.01x + 109
R2 = 0.87
P = 0.07
84
86
88
90
92
94
2.0 2.5 3.0 3.5
CF content in diet, %
OM
Ap
pare
nt
dig
esti
bilit
y, %
Figure 2: Relationship between EE content in the
diet and apparent digestibility of EE, % Figure 3: Relationship between CF content in the diet
and apparent digestibility of OM, %
Discussion
The catfish by-product meals contained different CP, EE and ash contents because they
had different proportions of scrap meat, skin, head and bone and were bought from
different processing factories, and with differences in oil extraction processes between
factories (Nguyen Thi Thuy et al, 2007). The fish meal used in the experiment was
produced from very small, whole marine fish, and therefore had a higher proportion of
bone and more ash and lower CP content than is usual in commercial fish meals.
The total tract digestibility of DM, CP and ash was different among the diets. There was a
negative effect on apparently digestible components of the diets related to ash content.
This was shown by the fact that as the ash content increased in the diets, DM and CP
apparent digestibility was reduced (Figure 1 and 2). These results are agreement with
previous studies by Jørgensen et al (1984) and Knabe et al (1989) on diets containing fish
meal and meat and bone meal, and Noblet and Perez (1993) also reported that diets which
had higher ash content, had lower fecal apparent digestibility of DM and CP. The CP
apparent digestibility of BM, FM and OE was higher than in the study of Nguyen Thi
Thuy et al (2010) on catfish by-products in diets based on broken rice, maize meal and
rice bran as energy sources. This can be explained by the fact that the cassava root meal,
that was the main source of energy in the present experiment, had a lower CF content,
and a higher digestibility than the more fibrous energy sources in the study of Nguyen
Thi Thuy et al (2010). According to Sauer and Ozimek (1986), diets that contained higher
amounts of CF had higher nitrogen losses from the hindgut and increased fermentation in
the large intestine and enhanced microbial population growth, and subsequently higher
protein excretion. Le Goff and Noblet (2001) also showed that total tract digestible CP
was reduced when more ash and fiber were present in the diet.
There was a difference in digestible OM between FM, OE, and BH, mainly because of
differences in ash content, as the CF concentrations in all diets were low and had little
influence on digestibility values. However, OM digestibility was lower than in the study
by Le Van An et al (2004) in diets based on cassava root meal and casein, but in contrast,
was higher than in the study of Nguyen Thi Thuy et al (2010) in diets based on rice bran,
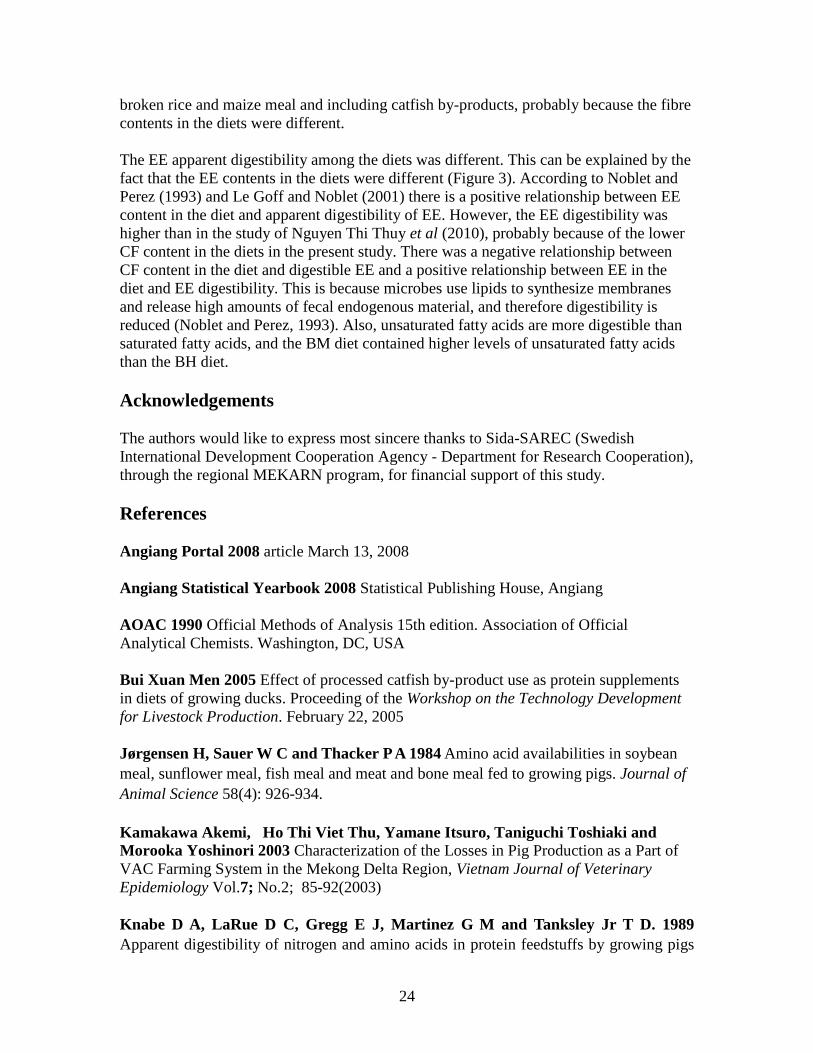
24
broken rice and maize meal and including catfish by-products, probably because the fibre
contents in the diets were different.
The EE apparent digestibility among the diets was different. This can be explained by the
fact that the EE contents in the diets were different (Figure 3). According to Noblet and
Perez (1993) and Le Goff and Noblet (2001) there is a positive relationship between EE
content in the diet and apparent digestibility of EE. However, the EE digestibility was
higher than in the study of Nguyen Thi Thuy et al (2010), probably because of the lower
CF content in the diets in the present study. There was a negative relationship between
CF content in the diet and digestible EE and a positive relationship between EE in the
diet and EE digestibility. This is because microbes use lipids to synthesize membranes
and release high amounts of fecal endogenous material, and therefore digestibility is
reduced (Noblet and Perez, 1993). Also, unsaturated fatty acids are more digestible than
saturated fatty acids, and the BM diet contained higher levels of unsaturated fatty acids
than the BH diet.
Acknowledgements
The authors would like to express most sincere thanks to Sida-SAREC (Swedish
International Development Cooperation Agency - Department for Research Cooperation),
through the regional MEKARN program, for financial support of this study.
References
Angiang Portal 2008 article March 13, 2008
Angiang Statistical Yearbook 2008 Statistical Publishing House, Angiang
AOAC 1990 Official Methods of Analysis 15th edition. Association of Official
Analytical Chemists. Washington, DC, USA
Bui Xuan Men 2005 Effect of processed catfish by-product use as protein supplements
in diets of growing ducks. Proceeding of the Workshop on the Technology Development
for Livestock Production. February 22, 2005
Jørgensen H, Sauer W C and Thacker P A 1984 Amino acid availabilities in soybean
meal, sunflower meal, fish meal and meat and bone meal fed to growing pigs. Journal of
Animal Science 58(4): 926-934.
Kamakawa Akemi, Ho Thi Viet Thu, Yamane Itsuro, Taniguchi Toshiaki and
Morooka Yoshinori 2003 Characterization of the Losses in Pig Production as a Part of
VAC Farming System in the Mekong Delta Region, Vietnam Journal of Veterinary
Epidemiology Vol.7; No.2; 85-92(2003)
Knabe D A, LaRue D C, Gregg E J, Martinez G M and Tanksley Jr T D. 1989
Apparent digestibility of nitrogen and amino acids in protein feedstuffs by growing pigs
25
Journal of Animal Science 67 (2): 441-458
Le Goff, G and Noblet J 2001 Comparative total tract digestibility of dietary energy and
nutrients in growing pigs and adult sows Journal of Animal Science 79: 2418-2427
Le Van An, Tran Thi Thu Hong and Jan Erik Lindberg 2004 Ileal and total tract
digestibility in growing pigs fed cassava root meal diets with inclusion of fresh, dry and
ensiled sweet potato (Ipomoea batatas L.(Lam)) leaves Animal feed Science and
Technology 114; 127–139
Maw S J, Fowler V R, Hamilton M and Petchey A M 2003 Physical characteristics of
pig fat and their relation to fatty acid composition. Meat Science 63; 185-190
National Research Council 1998 Nutrient requirements of swine, Tenth revised edition
Nguyen Thi Thuy, Jan Erik Lindberg and Brian Ogle 2010 Digestibility and nitrogen
balance of diets that include marine fish meal, catfish (Pangasius hypophthalmus) by-
product meal and silage, and processing waste water in growing pigs. Asian-Australasian
Journal of Animal Science (In Press).
Nguyen Thi Thuy, Nguyen Tan Loc, J E Lindberg and B Ogle 2007 Survey of the
production, processing and nutritive value of catfish by product meals in the Mekong
Delta of Vietnam Livest. Res. Rur. Dev. 19, 124. www.cipav.org.co/lrrd/lrrd19/9/thuy
19124.htm
Noblet, J and Perez J M 1993 Prediction of digestibility of nutrients and energy values
of pig diets from chemical analysis. Journal of Animal Science. 71, 3389-3398.
Sauer W C and Ozimek L 1986 Digestibility of amino acids in swine: Results and
their practical applications. A review. Livestock Production Science. 15:367.
Vietnam Statistical Yearbook 2008 Statistical Publishing House, Hanoi
26
Effects on performance of replacing fish meal by Tra catfish
(Pangasius hypophthalmus) by products in the diets of growing
pigs
Tran Trung Tuan and Brian Ogle*
Department of Animal Husbandry and Veterinary Science,
Faculty of Agriculture and Natural Resources, Angiang University (AGU),
Angiang province, Vietnam [email protected]
*Department of Animal Nutrition and Management,
Swedish University of Agricultural Sciences, PO Box 7024, S-750 07
Uppsala, Sweden
Abstract
The effects of diets with four different protein sources were determined with respect to
average daily gain (ADG), feed conversion ratio (FCR), back-fat thickness and economic
benefits in growing pigs. The four treatment diets were based on cassava root meal as
energy source: A control diet (FM) was cassava root meal plus marine fish meal; Diet
BM was cassava root meal plus catfish broken meat by-product meal; Diet OE was
cassava root meal plus oil extracted catfish by-product meal and Diet BH was cassava
root meal plus bone and head catfish by-product meal. The four diets were fed to twenty
four growing pigs in a Complete Randomized Block design with four treatments and six
replications, and the experimental unit was one pig. There were differences among the
diets in ADG, dry matter intake (DMI), FCR and back fat thickness, with a descending
trend from BM, OE, FM and BH (P<0.05). The DMI, ADG, back fat thickness and iodine
number were highest in BM (1955 g, 629 g, 13.7 mm and 52.8, respectively) (P<0.05)
and lowest in BH (182 g, 925 g, 7.81 mm and 40.1, respectively) (P<0.05). The FCR in
BM was the lowest (3.13 kg/kg gain) and highest in BH (5.31 kg/kg gain) (P<0.05). The
feed cost per kg weight gain of pigs in BM was lowest (P<0.05). The gross income and
net benefit per pig of BM were higher than the other diets (P<0.05). It can be concluded
that the growth performance and economic benefit of the treatment with catfish broken
meat by-product meal (BM) were highest, followed by OE, FM and BH.
Key words: Average daily gain, backfat thickness, catfish by-product meals,
feed conversion ratio, growing pigs, iodine number.
27
Introduction
Pig production in the Mekong delta increased strongly by 25.5 % between 2000 and
2006. However, during the same period production in Cantho Province decreased by
45 %, and continued to decline, by 4.3 % annually, between 2006 and 2008 (Vietnam
Statistical Yearbook, 2008).
The nutritive value of any protein is directly related to the amino acid composition of that
protein. A protein that does not contain the proper amounts of amino acids will be
imbalanced. Tra catfish by-product meal (broken meat and skin) contains an excellent
balance of essential amino acids, especially with respect to lysine and methionine
(Nguyen Thi Thuy et al 2007).
According to Nguyen Thi Thuy et al (2007) catfish residue meals contain high levels of
minerals and concentrations also were shown to vary considerably among by-products
and factories. For example, ash contents ranged from 3.5 to 33.8 % depending on catfish
by-product, and calcium and phosphorus concentrations ranged from 7 to 13 %, and 2 to
3 %, respectively, which means that catfish by-products are a good source of macro-
minerals for growing pigs and sows.
According to Le Thi Men et al (2005), Tra catfish residue meal can completely replace
fish meal in fattening pig diets based on broken rice as the main ingredient and without
effects on back fat thickness.
The present study was conducted in order to determine average daily gain, feed
conversion ratio, back fat thickness and economic benefits among diets based on cassava
root meal, with marine fish meal and different by-product meals from processing catfish
as protein sources.
Materials and methods
Location and climate of the study area
The experiment was carried out in the experimental station of Angiang University, in
Chau Phu district, Angiang Province, from August 25 to December 26, 2009.
The average annual daily temperature is 270C, with the highest temperatures of 35 to
360C from April to May and the lowest of 20 to 21
0C from December to January. The
mean rainfall is 1400 to 1500 millimeters. The climate has two seasons, the rainy season
from May to November and the dry season from December to April (Angiang Portal
2008).
Animals and management
The animals in the experiment were bought from a pig farm in Angiang Province.
Twenty four crossbred (Landrace x Yorkshire x Duroc) castrated male pigs with a mean

28
body weight of 22.7 kg ± 0.5 at 70 days of age were used in the experiment. All pigs
were vaccinated against hog cholera and foot and mouth disease and were treated against
round worms with Levamysole before starting the experiment.
The pigs were housed in individual pens (0.6 m x 1.2 m) made of bamboo with feeding
troughs to allow recording of offered feed and to collect refused feed. Animals were
given feed ad-libitum four times per day at 07:00, 11:00, 14:00 and 17:00 h and feed
refusals were collected and weighed before the morning and afternoon feeding.
During the trial, one pig in treatment FM died due to lung problems.
Experimental diets
The diets were based on cassava root meal, marine fish meal, broken meat by-product, oil
extracted by-product and head and bone by-product, and were formulated to contain from
17 to 18 % crude protein (CP) in DM to meet requirements according to NRC (1998).
All ingredients were bought at one time at the beginning of the experiment. The bone and
head, broken meat and oil extracted catfish by-product meals were bought in local
processing factories, and the cassava root meal and fish meal were bought from an animal
feed shop in Angiang province. Before making the dietary formula, samples of
ingredients were taken and analyzed for crude protein, and then were mixed together
following the formula every week.
Treatments
Control treatment (FM): cassava root meal plus marine fish meal and one
percent of a premix of minerals and vitamins.
Treatment BM: cassava root meal plus broken meat catfish by-product
meal and one percent of a premix of minerals and vitamins.
Treatment OE: cassava root meal plus oil extracted catfish by-product
meal and one percent of a premix of minerals and vitamins.
Treatment BH: cassava root meal plus bone and head catfish by-product
meal and one percent of a premix of minerals and vitamins.
Experimental design
The experiment was designed as a Complete Randomized Block with four treatments and
six replications, and the experimental unit was one pig. The pigs were allocated to blocks
based on initial live weight and at random within blocks according to treatment. The
experiment was conducted over four months (finishing when the pigs reached slaughter
weight, at 90 to 100 kg). The chemical composition of the ingredients is shown in Table 1
and the ingredient composition of the diets is shown in Table 2.
29
Table 1: Dry matter content (%) and chemical composition of
ingredients (%, dry matter basis)
DM CP EE Ash
Cassava root meal 88.5 3.31 6.72 3.15
Fish meal 88.6 43.5 7.82 26.5
Broken meat meal 90.4 71.5 21.0 4.66
Oil extracted meal 89.6 45.5 8.81 24.6
Bone and head meal 89.0 33.0 5.29 45.6
Table 2: Ingredient and chemical composition of the experimental diets
FM BM OE BH
Cassava root meal 63 78 64 52
Fish meal 35.5 0 0 0
Broken meat meal 0 20.5 0 0
Oil extracted meal 0 0 34.5 0
Bone and head meal 0 0 0 46.5
Premix of minerals and vitamins 1 1 1 1
Salt 0.5 0.5 0.5 0.5
Total 100 100 100 100
Chemical composition of diets (%, dry matter basis)
Dry matter 87.1 87.4 87.6 88.1
Crude protein 17.1 17.9 18.2 18.3
Ether extract 6.71 11.8 7.18 5.29
Ash 11.4 3.04 9.37 20.3
ME of diets, MJ/kg 12.0 13.4 12.3 10.8
FM: fish meal diet; BM: broken meat meal diet; OE: oil extracted meal diet; BH: bone and
head meal diet
According to McDonald et al (2002): ME (MJ/kg, DM) contents of diets were estimated as:
ME = %EE*25.4 + %(CP+CHO)*12.7;%(CP+CHO) = 100 - %EE - %ash -%CF*%
digestibility
Measurements and data collection
All pigs were weighed at the beginning and end of the experiment to determine daily live
weight gain.
Amounts of offered and refused feed in every pen were recorded every day to calculate
feed intake, and then feed conversion ratio was calculated and an economic analysis
performed.
Back fat thickness at the last rib of all pigs was measured by an ultrasonic technique
(RENCO Co., Ltd, Minneapolis, USA) at the end of the experiment.
30
The formulae to calculate average daily weight gain (ADG), and feed conversion ratio
(FCR) were:
ADG = (W2 –W1)/T
FCR = Total dry matter intake/weight gain
Where: W1 is live weight at start of experiment; W2 is live weight at the end of the
experiment, and T is the number of days on experiment.
Chemical analysis
All ingredients were analyzed for dry matter (DM) ether extract (EE) and ash according
to the standard methods of AOAC (1990), and crude protein (CP) was determined by the
Kjeldahl procedure before making the diets.
Offered and refused feed samples were analyzed for dry matter by using microwave
radiation (Undersander et al 1993).
One representative pig in each treatment was slaughtered, and back-fat samples taken for
analysis of iodine number according to the standard method of AOAC (1984).
Statistical analysis
The data for feed intake, growth rate and feed conversion ratio were analyzed as a
Randomized Complete Block Design by using the General Linear Model (GLM) of the
Analysis of Variance (ANOVA) procedure of the Minitab statistical software release 14
(Minitab, 2003). Sources of variation were: animals, treatments, blocks and error. The
Tukey Test for pair-wise comparisons was used to separate means when the differences
were significant at the five percent level.
Results
Average daily gain, feed conversion ratio, back-fat thickness and iodine number
There were differences in the average daily gain (ADG), feed conversion ratio (FCR),
back fat thickness and iodine number among diets (P<0.05), with a descending trend
from BM, OE, FM and BH. Dry matter intake (DMI) was highest in BM (1955 g/day),
followed by FM (1573 g/day), OE (1264 g/day) and BH (925 g/day) (P<0.001). The
differences between BM and FM, and BH and OE were non-significant (P>0.05).
Average daily gain was highest in BM (629 g) followed by OE (372 g), FM (365 g) and
BH (182 g) (P<0.001). The difference between OE and FM was non-significant (P>0.05).
The FCR in BM was lower than in FM (P<0.05), but not different from OE, and the FCR
in BH was higher than in FM (P<0.05) (Table 3). Back-fat thickness on the FM and OE
diets did not differ, while BM had the highest value, and BH lowest (P<0.05). Iodine

31
number of BM was higher than FM and OE (P<0.05), and was lowest in BH (P<0.05)
(Table 3).
Economic benefit
The feed cost per kg weight gain of pigs fed diet BM was the lowest, and differed from
the other diets (P<0.05), while differences among diets FM, OE and BH were non-
significant (P>0.05) (Table 4). There were no differences among treatments FM, OE and
BH in gross income and net benefit per pig. However, they were lower than in diet BM
(P<0.05) (Table 4).
Table 3: Effect of protein source on daily feed and nutrient intake, daily live weight gain, feed
conversion ratio and back-fat thickness
Diet
SEM P FM BM OE BH
Initial weight, kg 22.5 23 22.8 22.8 1.24 0.99
Final weight, kg 67.8b 101
a 69
b 45.3
c 6.26 0.001
Dry matter intake (g/d) 1573ab
1955a 1264
b 925
c 81.9 0.001
Average daily gain (g/d) 365b 629
a 372
b 182
c 24.7 0.001
Feed conversion ratio, kg/kg 4.38b 3.13
a 3.32
a 5.31
c 0.18 0.001
Back-fat thickness (mm) 10.7b 13.7
a 9.71
b 7.81
c 0.44 0.001
Back-fat thickness (mm) adjusted for
live weight as covariate 10.9 10.6 9.87 10.5 0.5 0.36
Iodine number of back fat 44.5b 52.8
a 45.3
b 40.1
c 0.39 0.001
ME of diets, MJ/kg 12.0 13.4 12.3 10.8 CP intake, g/day 269 350 230 169 ME intake, MJ 18.9 26.2 15.6 9.99 ME:CP ratio, MJ ME/g CP 0.07 0.08 0.07 0.06 FM: fish meal diet, BM: broken meat meal diet, OE: oil extracted meal diet, and BH: bone
and head meal diet a-c
Means within row with different letters differ significantly (P<0.05)
Table 4: Effect of diet on economic benefits
Diet
FM BM OE BH SEM P
Gross income/pig, USD 126b 188
a 129
b 84.5
b 11.8 0.001
Pig cost/pig, USD 43.5 44.4 44.1 44.1
Feed cost/kg, USD 0.26 0.21 0.28 0.23
Feed cost/kg weight gain, USD 1.09b 0.65
a 0.99
b 1.20
b 0.05 0.001
Total feed cost/pig , USD 49.3a 50.9
a 44.3
ab 26.7
b 4.97 0.009
Net benefit/pig, USD 33.7b 92.6
a 40.3
b 13.8
b 3.64 0.001
FM: fish meal diet, BM: broken meat meal diet, OE: oil extracted meal diet, and BH:
bone and head meal diet, a-c
Means within row with different letters differ significantly
(P<0.05)
Discussion
32
The metabolisable energy (ME) content in diet BH was very low (10.8 MJ/kg) because of
the very high ash content and low content of EE. In contrast diet BM had a high content
of EE and low content of ash, and therefore a high ME content (13.4 MJ/kg). Crude fibre
content in all diets was very low, around 3% of DM.
The DM intake differed among diets. The low ME content of diet BH would have been
expected to have increased DMI, as pigs try to adjust their feed intake to give a constant
ME intake. However, that this was not the case could have been due to the lower
palatability of diet BH, probably due to the very high ash content, and also due to
possible rancidity. This could also explain the positive relationship between DMI and
ratio of ME:CP in the diets, as diets FM and OE also had a high ash content, and DMI
that were much lower than that of pigs on BM, which had an ash content of only 3 %.
Furthermore, there were positive relationships between apparent digestibility of DM and
CP (Tuan et al 2010) and the DMI. Pomar et al (2003) and Speedy (1997) confirmed that
voluntary feed intake is limited when the feed is unbalanced in terms of the ratio between
energy and protein. According to Holness (2005) the optimum ratio of ME and CP, and
ME requirement of pigs in the tropics are 0.08 and 12 MJ/kg, respectively.
Average daily gains on the tested diets in descending order were BM, OE, FM and BH
(Table 3), and generally reflected daily dry matter intakes. Growth rates were highest on
diet BM, which also had the highest DMI. Average daily gain and DMI were very low in
diet BH, but although DMI was higher in the fish meal (FM) diet than in the diet
containing the oil extracted meal (OE), ADG in these two diets were similar, probably
because the ME content in the diets and ratio of ME:CP between the treatments were
different, and calculated ME content in diet BH was lower than the requirement of
tropical pigs, as the ideal mean ME in diets for pigs in the tropics from 20 to 120 kg is
12.0 (Holness, 2005), which is much higher than the ME content in diet BH, of 10.8
MJ/kg. There is a positive relationship between ME intake, and protein deposition in pigs
(Renaudeau et al, 2006). Several authors confirmed that subsequent growth performance
was reduced when pig had low energy intake in the early growing period (Chadd and
Cole, 1999; Smith et al, 1999; De la Llata et al, 2001). In addition, ash content in the diet
could also have negatively affected growth rate for a different reason, because animals
must excrete minerals through urine and use energy to do this when intakes are higher
than body demand. Consequently, all the above factors probably affected ADG.
The FCR among the diets were different. This can be explained by the fact that the diets
had different ME and CP ratios, and thus the diet (BM) that resulted in higher protein
deposition in pigs, also had higher efficiency of feed utilization. These results are in
agreement with Lopez et al (1997) who found that when the ME concentration in the diet
was higher, the FCR was lower, and when the ratio of ME : CP was high, the FCR was
reduced (Le Bellago et al, 2002).
The back-fat thickness was different among treatments, and there was a positive
relationship between ME content in the diet and back-fat deposition. According to
Renaudeau et al (2006) the higher the ME intake, the thicker the back-fat.

33
There were differences among the treatments in iodine number of back-fat, with the BM
diet having the highest value. Generally, when the catfish oil level was increased, the
iodine number was higher. This can be explained by the fact that the proportion of EE in
diets BM and OE was higher than in diets FM and BH and the unsaturated fatty acid
content in catfish by-product meal is very high. According to Nguyen Thi Thuy et al
(2007) the unsaturated fatty acid content in catfish by-product meal is higher than in other
fish meals. However, our values for iodine number were lower than those reported by Le
Thi Men et al (2003) in a study on the effects of catfish oil in diets for fattening pigs.
The BM diet was the best in terms of economic benefit. Although the other diets were not
different from each other, broken head meal should not be used in pig diets because of
the very poor performance.
It can therefore be concluded that the average daily gain, feed conversion and economic
benefit of the broken meat meal diet was the best, followed by diets OE, FM and BH.
Acknowledgements
The authors would like to express most sincere thanks to SIDA-SAREC (Swedish
International Development Cooperation Agency - Department for Research Cooperation),
through the regional MEKARN program for financial support of this study.
34
References
Angiang Portal 2008 article March 13, 2008
AOAC 1990 Official Methods of Analysis 15th edition. Association of Official
Analytical Chemists. Washington, DC, USA
AOAC 1984 Official Method of Analysis Chapter 28. Association of Official Analytical
Chemists. Washington, DC, USA
Chadd, S A and Cole D J A 1999. The performance response of growing and finishing
pigs fed differing proportions oat feed as a dietary fibre source EAAP Annual Meeting,
Zurich.
De la Llata M, Dritz S S, Tokach M D, Goddband R D, Nelssen J L and Loughin T
M 2001 Effect of dietary fat on growth performance and carcass characteristics of
growing-finishing pigs reared in a commercial environment. Journal of Animal Science
79; 2643-2650.
Holness 2005 Pigs, revised edition The Tropical Agriculturalist.
Le Bellego L, Van Milgen J and Noblet J 2002 Effect of high temperature and low-
protein diets on the performance of growing-finishing pigs. Journal of Animal Science
2002. 80, 691-701
Le Thi Men, T R Preston*, Truong Van Hieu, Duong T Ngan and Huynh Thu Loan
2005 Evaluation of Tra catfish (Pangasius hypophthalmus) residue meal to replace fish
meal in diets for fattening pigs in the Mekong Delta of Vietnam Workshop-Seminar, 23-
25 May, 2005, MEKARN-CTU http://www.mekarn.org/proctu/lemen37.htm
Le Thi Men, Huynh Huu Chi, Ngo Vi Nghia, Nguyen Thi Kim Khang, Brian Ogle
and Preston T R 2003 Utilization of catfish oil in diets based on dried cassava root
waste for crossbred fattening pigs in the Mekong delta of Vietnam Livestock Research
for Rural Development (15) 4 2003 http://www.lrrd.org/lrrd15/4/men154.htm
Lopez C J, Bote M, Sanz B, Perez de Ayala I and Flores A 1997 Effect of dietary lard
on performance, fatty acid composition and susceptibility to lipid peroxidation in
growing-finishing female and entire male pigs. Canadian Journal of Animal Science. 77;
301-306
National Research Council 1998 Nutrient requirements of swine, Tenth revised edition
Nguyen Thi Thuy, Jan Erik Lindberg and Brian Ogle 2010 Digestibility and nitrogen
balance of diets that include marine fish meal, catfish (Pangasius hypophthalmus) by-
product meal and silage, and processing waste water in growing pigs Asian-Australasian
Journal of Animal Science (In Press).

35
Nguyen Thi Thuy, Nguyen Tan Loc, Lindberg J E and B Ogle B 2007 Survey of the
production, processing and nutritive value of catfish by product meals in the Mekong
Delta of Vietnam. Livestock Research for Rural Development 19, 124.
http://www.lrrd.org/lrrd19/9/thuy19124.htm
Pomar C, Kyriazakis I, Emmans G C and Knap P W 2003 Modeling stochasticity:
Dealing with populations rather than individual pigs. Journal of Animal Science 81;
178–E186
Renaudeau D, Bocage B and Noblet J 2006 Influence of energy intake on protein and
lipid deposition in Creole and Large White growing pigs in a humid tropical climate
Animal Science 2006, 82; 937–945.
Smith J W, Tokach M D, O’Quinn P R, Nelssen J L and Goodband R D 1999.
Effects of dietary energy density and lysine: calorie ratio on growth performance and
carcass characteristics of growing-finishing pigs. Journal of Animal Science. 77; 3007-
3015
Speedy A W 1997 Feeding pigs in the tropics. Food and Agriculture Organization of the
United Nations Rome http://www.fao.org/docrep/003/w3647e/W3647E00.htm#TOC
Undersander D, Mertens D R and Theix N 1993 Forage analysis procedures. National
Forage Testing Association. Omaha pp 154
Vietnam Statistical Yearbook 2008 Statistical Publishing House, Hanoi, Vietnam.