university of groningen exploring the glucosylation
TRANSCRIPT
University of Groningen
Exploring the glucosylation potential of glucansucrasesDevlamynck, Tim Nick
IMPORTANT NOTE: You are advised to consult the publisher's version (publisher's PDF) if you wish to cite fromit. Please check the document version below.
Document VersionPublisher's PDF, also known as Version of record
Publication date:2017
Link to publication in University of Groningen/UMCG research database
Citation for published version (APA):Devlamynck, T. N. (2017). Exploring the glucosylation potential of glucansucrases: From enzyme toproduct. University of Groningen.
CopyrightOther than for strictly personal use, it is not permitted to download or to forward/distribute the text or part of it without the consent of theauthor(s) and/or copyright holder(s), unless the work is under an open content license (like Creative Commons).
The publication may also be distributed here under the terms of Article 25fa of the Dutch Copyright Act, indicated by the “Taverne” license.More information can be found on the University of Groningen website: https://www.rug.nl/library/open-access/self-archiving-pure/taverne-amendment.
Take-down policyIf you believe that this document breaches copyright please contact us providing details, and we will remove access to the work immediatelyand investigate your claim.
Downloaded from the University of Groningen/UMCG research database (Pure): http://www.rug.nl/research/portal. For technical reasons thenumber of authors shown on this cover page is limited to 10 maximum.
Download date: 20-01-2022
201
Chapter 7
Enzymatic transglucosylation of neohesperidin
dihydrochalcone: glucansucrase Gtf180-ΔN-Q1140E as
biocatalyst for the glycodiversification of sweet glycosides
Tim Devlamynck1,2
, Gerrit Gerwig3, Wim Soetaert
1, Lubbert Dijkhuizen
2
University of Ghent1, University of Groningen
2, University of Utrecht
3
Chapter 7: Glycosylation of NHDC
202
Abstract
Increasing rates of obesity and diabetes type 2 lead to a rapidly growing number
of health-conscious consumers, fueling the demand for low-calorie food products.
Natural high-intensity sweeteners (HIS), of which steviol glycosides [e.g.
rebaudioside A (RebA)] extracted from the leaves of Stevia rebaudiana are best
known, have a competitive edge over synthetic HIS such as aspartame and
acesulfame K, suffering from a bad reputation among consumers. Over the
years, several other natural compounds have been proposed as possible
products for the HIS market of the future. An interesting target is the flavor
enhancer neohesperidin dihydrochalcone (NHDC). The main disadvantages of
NHDC are its low water solubility at room temperature, resulting in a relatively
low bioavailability, and an unpleasant lingering aftertaste. This chapter reports
the α-glucosylation of NHDC with glucansucrase Gtf180-ΔN-Q1140E from
Lactobacillus reuteri 180, using sucrose as donor substrate, in an attempt to
improve its sensory and physicochemical properties. Structure elucidation of the
novel glucosylated products revealed that NHDC was glucosylated at the β-D-
glucosyl unit and the α-L-rhamnosyl unit, through an (α1→6) and (α1→4) linkage,
respectively. The obtained conversion degree of 65% offers a good starting point
for future improvements by reaction engineering. The α-glucosylated NHDC
products displayed much higher water solubilities than NHDC and retained
strong anti-oxidant capacities, enabling their use as nutraceuticals. Sensory
analysis by a trained panel revealed limited bitterness suppressing effects of
NHDC and its α-glucosylated products on RebA, in contradiction to previous
reports.

Chapter 7: Glycosylation of NHDC
203
1. Introduction
Previously we demonstrated the potential of the glucansucrase enzyme Gtf180-
ΔN and in particular its Q1140E mutant97
to trans-α-glucosylate rebaudioside A
(RebA) and stevioside as a means to improve their sensory properties68-70
. In
addition to these steviol glycosides from Stevia rebaudiana, also neohesperidin
dihydrochalcone (NHDC, Figure 1) has attracted considerable attention from the
food industry, due to its intensive sweetness. Later on, NHDC’s remarkable
properties as flavor enhancer, as such contributing to the mouth feel of several
food products and/or suppressing the bitterness displayed by other compounds,
expanded the interest in this versatile molecule246-248
.
First discovered in 1963 by Horowitz and Gentili246
, NHDC is industrially
produced by hydrogenation of neohesperidin (hesperetin 7-O-neohesperidoside),
a flavanone glycoside isolated from citrus fruits such as mandarin, orange and
grapefruit249
. Recently, NHDC was found to naturally occur as a minor constituent
in the plant Oxytropis myriophylla250
and in the bark of the tree Eysenhardtia
polystachya251
. Classified as a semisynthetic sweetener, NHDC is roughly 340
times sweeter than sucrose and was approved as sweetener by the European
Union in 1994. Similarly to other highly sweet glycosides such as glycyrrhizin
(Glycyrrhiza glabra, liquorice) and most steviol glycosides, NHDC displays a
lingering liquorice aftertaste limiting its application as the sole sweetener in foods
and beverages252
. NHDC is best applied in sweetener blends: it displays strong
synergistic effects when combined with other sweeteners such as saccharin,
aspartame, and RebA253
. The total sweetness intensity of such mixtures is
greater than the theoretical sum of the intensities of the individual components254
.
The use of NHDC thus provides a substantial economic benefit, as much less of
the other sweetener needs to be supplied.
In addition, NHDC finds many applications as a flavor enhancer in a wide range
of food –and pharmaceutical products, as such identified by the E number
E959255-257
. A typical example concerns the enhancement of the creaminess of
Chapter 7: Glycosylation of NHDC
204
dairy products such as yogurt and ice cream. Moreover, NHDC is particularly
effective in masking the bitterness displayed by several other compounds, such
as limonin and naringin from citrus fruits. A patent application from 2012 even
claims that the bitterness and astringency exhibited by RebA and monk fruit
extract are very effectively suppressed by the addition of 10 ppm NHDC258
. Also
the pharmaceutical industry makes good use of this remarkable NHDC
characteristic to reduce the bitterness of several drugs in tablet form, such as the
antipyretic paracetamol259
. More recently, several studies have attributed strong
antioxidant260-262
, hepatoprotective (preventing damage to the liver)263
and
prebiotic264
properties to NHDC. In the context of all these possible applications,
the main disadvantage of NHDC is its low water solubility at room temperature
(0.4 g/L), resulting in a relatively low bioavailability and limiting its application as
sweetener in water based dispersions, such as syrups and jams265
.
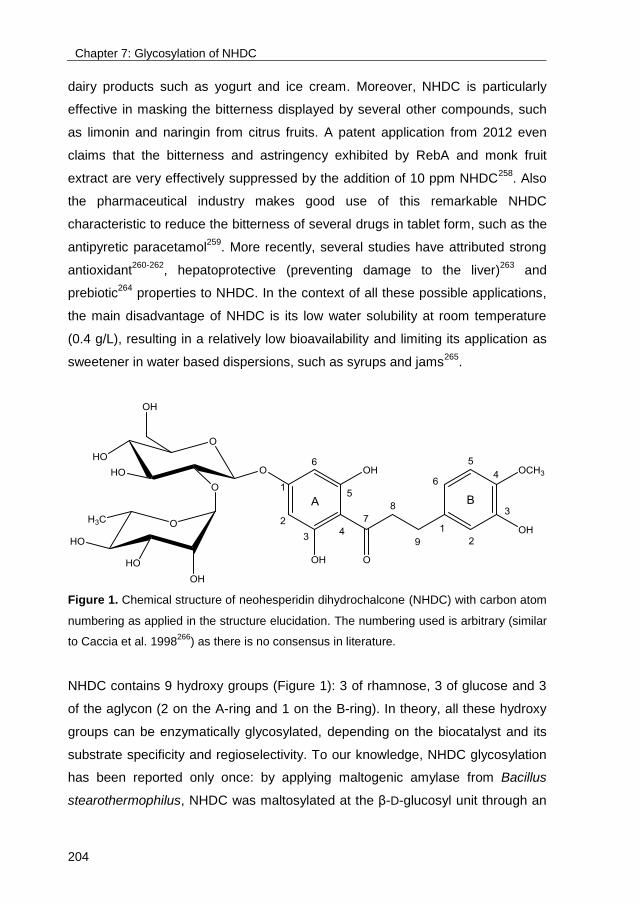
Figure 1. Chemical structure of neohesperidin dihydrochalcone (NHDC) with carbon atom
numbering as applied in the structure elucidation. The numbering used is arbitrary (similar
to Caccia et al. 1998266
) as there is no consensus in literature.
NHDC contains 9 hydroxy groups (Figure 1): 3 of rhamnose, 3 of glucose and 3
of the aglycon (2 on the A-ring and 1 on the B-ring). In theory, all these hydroxy
groups can be enzymatically glycosylated, depending on the biocatalyst and its
substrate specificity and regioselectivity. To our knowledge, NHDC glycosylation
has been reported only once: by applying maltogenic amylase from Bacillus
stearothermophilus, NHDC was maltosylated at the β-D-glucosyl unit through an
Chapter 7: Glycosylation of NHDC
205
(α1→6) linkage, resulting in a 700-fold increase of solubility and a 7-fold
decrease of sweetness267
. Previously, we reported the trans-α-glucosylation of a
wide variety of compounds, ranging from catechol to more complex molecules
such as steviol glycosides, with Gtf180-ΔN from Lactobacillus reuteri 180 and
derived mutants, highlighting the broad acceptor substrate specificity of this
enzyme68-70,110
. This chapter reports the transglucosylation of NHDC with Gtf180-
ΔN-Q1140E, yielding three new-to-nature α-glucosylated NHDC derivatives. A
detailed structural analysis is provided, a necessity for the evaluation of the
quality and safety of novel food products. In addition, the sensory properties,
anti-oxidant capacities and solubilities of the α-glucosylated NHDC products were
compared to NHDC.
2. Materials and methods
2.1. Production and purification of glucosylated NHDC
The production of glucosylated NHDC (Ingrizo) was performed at 50 mL scale in
a shake flask, in duplicate. Samples were analyzed by HPLC. The temperature
and agitation rate were set at 37 °C and 150 rpm, respectively. Gtf180-ΔN-
Q1140E97
(5 U/mL), produced as described previously70
, was incubated in a 20%
ethanol solution containing 20 g/L NHDC and 125 mM sucrose supplemented
with 25 mM sodium acetate (pH 4.7) and 1 mM CaCl2. One unit (U) of enzyme
activity corresponds to the conversion of 1 μmole sucrose (used for hydrolysis
and transglucosylation) in a solution of 100 mM sucrose, 25 mM sodium acetate
(pH 4.7) and 1 mM CaCl2 at 37 °C.
After completion of the reaction (i.e. when a steady state was reached),
glucosylated NHDC was isolated from the reaction mixture by adsorption onto
Lewatit VP OC 1064 MD PH macroporous resin. A washing step with water
removed the residual sugars and α-glucan oligosaccharides. Desorption of
glucosylated NHDC was achieved with 70% isopropanol. The resulting mixture
was evaporated in vacuo and subsequently applied onto a Reveleris X2 flash
Chapter 7: Glycosylation of NHDC
206
chromatography system, applying a Reveleris amino cartridge (40 µm) with water
(solvent A) and acetonitrile (solvent B) as the mobile phase. Following gradient
elution was used: 99% solvent B (0-2 min), 99-35% solvent B (2-20 min), 35%
solvent B (20-25 min). The collected fractions were evaporated in vacuo and
subsequently freeze dried to remove the residual water.
2.2. MALDI-TOF-mass spectrometry
Matrix-assisted laser desorption ionization time-of-flight mass spectrometry
(MALDI-TOF-MS) was performed on an AximaTM mass spectrometer (Shimadzu
Kratos Inc., Manchester, UK), equipped with a Nitrogen laser (337 nm, 3 ns pulse
width). Positive-ion mode spectra were recorded using the reflector mode at a
resolution of 5000 FWHM and delayed extraction (450 ns). Accelerating voltage
was 19 kV with a grid voltage of 75.2%. The mirror voltage ratio was 1.12 and the
acquisition mass range was 200-2000 Da. Samples were prepared by mixing on
the target 1 μL sample solutions with 1 μL aqueous 10% 2,5-dihydroxybenzoic
acid in 40% acetonitrile as matrix solution, containing 0.1% TFA.
2.3. Methylation analysis
Samples were permethylated using CH3I and solid NaOH in DMSO, as described
by Ciucanu and Kerek (1984)227
, then hydrolyzed with 2 M TFA (2 h, 120 °C) to
give the mixture of partially methylated monosaccharides. After evaporation to
dryness and redissolving in H2O, reduction was performed with NaBD4 (2 h, room
temperature). After neutralization with 4 M acetic acid and removal of boric acid
by co-evaporation with methanol, the samples were acetylated with acetic
anhydride/pyridine (1:1, 30 min, 120 °C). After evaporation to dryness and re-
dissolving in dichloromethane, the mixtures of partially methylated alditol
acetates (PMAAs) were analyzed by gas-liquid chromatography – electron
ionization – mass spectrometry (GLC-EI-MS) on an EC-1 column (30 m x 0.25
mm, Alltech), using a gas chromatograph mass spectrometer (GCMS-QP2010
Plus from Shimadzu Kratos Inc.) and a temperature gradient (140-250 °C at 8
°C/min)228
.
Chapter 7: Glycosylation of NHDC
207
2.4. NMR spectroscopy
Resolution-enhanced 1D/2D 500-MHz 1H/
13C NMR spectra were recorded in D2O
on a Bruker DRX-500 spectrometer (Bijvoet Center, Department of NMR
Spectroscopy, Utrecht University) at a probe temperature of 310 K. Data
acquisition was done with Bruker Topspin 2.1. Before analysis, samples were
exchanged twice in D2O (99.9 atom% D, Cambridge Isotope Laboratories, Inc.,
Andover, MA) with intermediate lyophilization, and then dissolved in 0.6 mL D2O.
Suppression of the deuterated water signal (HOD) was achieved by applying a
WEFT (water eliminated Fourier transform) pulse sequence for 1D NMR
experiments and by a selective pre-saturation pulse of 1 s during the relaxation
delay in 2D experiments. The 2D TOCSY spectra were recorded using an MLEV-
17 (composite pulse devised by Levitt et al., 1982) mixing sequence with spin-
lock times of 20, 50, 100 and 200 ms. The 2D 1H-
1H ROESY spectra were
recorded using standard Bruker XWINNMR software with a mixing time of 200
ms. The carrier frequency was set at the downfield edge of the spectrum in order
to minimize TOCSY transfer during spin-locking. Natural abundance 2D 13
C-1H
HSQC experiments (1H frequency 500.0821 MHz,
13C frequency 125.7552 MHz)
were recorded without decoupling during acquisition of the 1H FID. The NMR
data were processed using the MestReNova 9 program (Mestrelab Research SL,
Santiago de Compostella, Spain). Chemical shifts (δ) are expressed in ppm by
reference to internal acetone (δH 2.225 for 1H and δC 31.07 for
13C).
2.5. Solubility measurements
The solubilities of NHDC and α-glucosylated NHDC products were determined in
250 μL of ultrapure water, incubated in a thermoblock at 25 °C. Products were
added until clear precipitation was noticeable, after which the samples were
vortexed multiple times and allowed to equilibrate for 24 h. The supernatants
were diluted in ethanol and subsequently subjected to HPLC analysis. Calibration
was accomplished using the appropriate standard curves, obtained after
purification of the glycosylated products as described in 2.1. All analyses were
performed in duplicate.
Chapter 7: Glycosylation of NHDC
208
2.6. Determination of 2,2-diphenyl-1-picrylhydrazyl (DPPH) radical-
scavenging activity
The 2,2-diphenyl-1-picrylhydrazyl (DPPH) assay is widely used to determine the
anti-oxidant potential of various compounds. DPPH possesses an unpaired
valence electron susceptible to scavenging by molecules displaying anti-oxidant
activity, a chemical reaction which can be followed spectrophotometrically268
.
The DPPH radical-scavenging activity was evaluated by adding 100 μL of
methanol, containing various concentrations of NHDC and α-glucosylated NHDC
products (10-1000 μM), to 200 μL of methanol supplemented with 200 μM DPPH.
The samples were incubated at room temperature during 15 min in complete
darkness, after which their absorbance was measured at 517 nm. The
(glucosylated) NHDC concentration required to reduce the absorbance by 50%
(EC50) was calculated by linear regression (of the linear part) of the absorption
curves. Analyses were performed in duplicate. Butylated hydroxytoluene (BHT)
was included in the experiments to serve as comparison.
2.7. Sensory analysis
The sensory analysis was performed in individual tasting booths at the UGent
Sensolab (Belgium) by a trained panel (9 persons). In short, taste (sweetness,
liquorice, astringency and bitterness) was evaluated by swirling the sample in the
mouth for 5 sec after which the sample was expectorated. Aftertaste was
evaluated 10 sec after swallowing the solution. Lingering based on the maximum
taste intensity was rated 1 min later. Sucrose reference solutions (5%, 7.5% and
10% sucrose, scoring 5, 7.5 and 10, respectively) were provided. Water (Spa
Reine) and plain crackers were used as palate cleansers between sampling.
Following sweetened solutions were tasted: 588 mg/L rebaudioside A (RebA,
Tereos PureCircle Solutions), 588 mg/L RebA + 10 ppm NHDC, 588 mg/L RebA
+ 10 ppm monoglucosylated NHDC (NHDC-G1), and 588 mg/L RebA + 10 ppm
diglucosylated NHDC (NHDC-G2). All samples were evaluated in duplicate.
Chapter 7: Glycosylation of NHDC
209
Statistical analyses were performed with SPSS 23 (SPSS Inc., Chicago, USA).
All tests were done at a significance level of 0.05. One-Way ANOVA was used to
investigate any significant difference between the solutions. Testing for equal
variances was executed with the Modified Levene Test. When conditions for
equal variance were fulfilled, the Tukey test was used to determine differences
between samples210
. In case variances were not equal, a Games-Howell post-
hoc test was performed211
.
3. Results and discussion
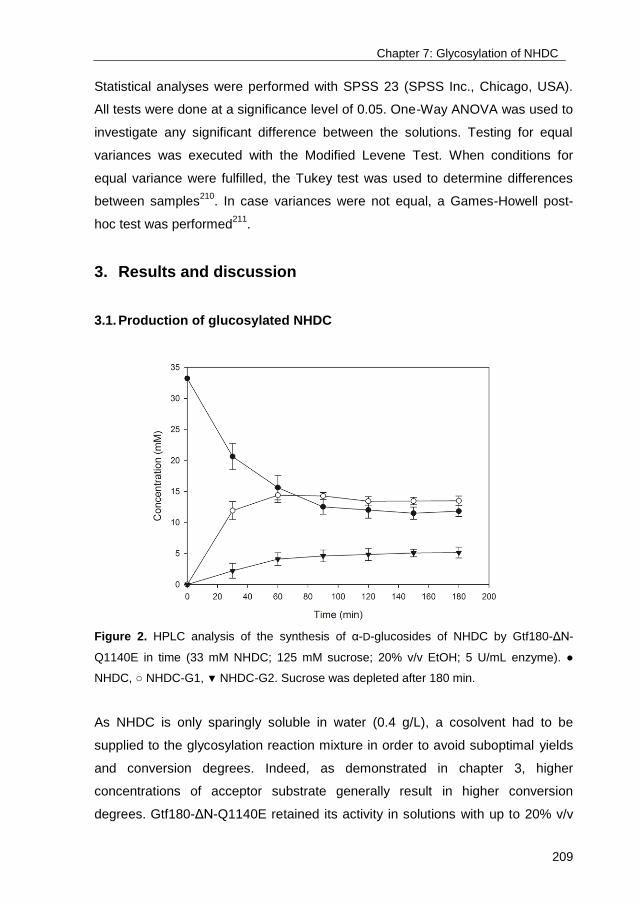
3.1. Production of glucosylated NHDC
Figure 2. HPLC analysis of the synthesis of α-D-glucosides of NHDC by Gtf180-ΔN-
Q1140E in time (33 mM NHDC; 125 mM sucrose; 20% v/v EtOH; 5 U/mL enzyme). ●
NHDC, ○ NHDC-G1, ▼ NHDC-G2. Sucrose was depleted after 180 min.
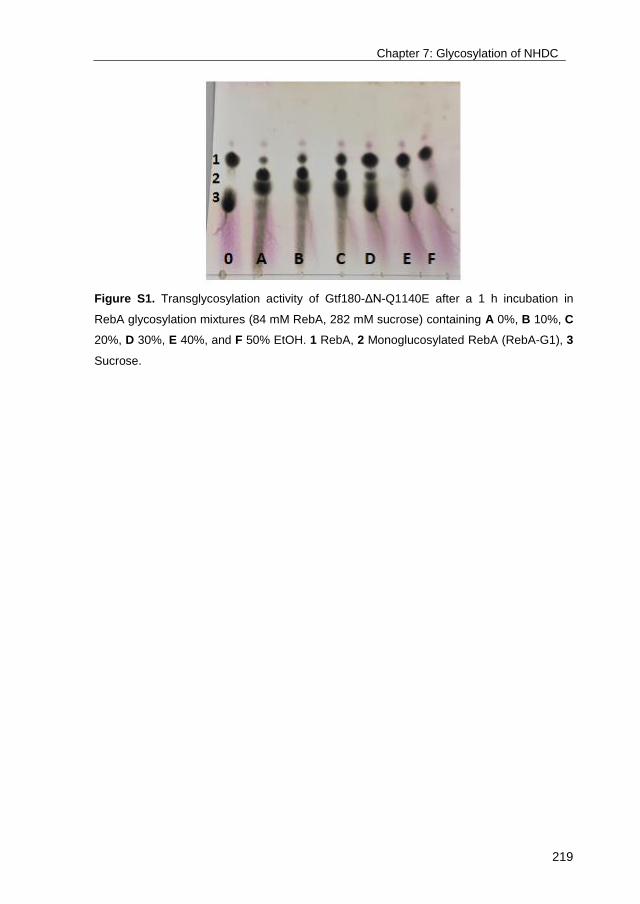
As NHDC is only sparingly soluble in water (0.4 g/L), a cosolvent had to be
supplied to the glycosylation reaction mixture in order to avoid suboptimal yields
and conversion degrees. Indeed, as demonstrated in chapter 3, higher
concentrations of acceptor substrate generally result in higher conversion
degrees. Gtf180-ΔN-Q1140E retained its activity in solutions with up to 20% v/v
Chapter 7: Glycosylation of NHDC
210
EtOH (Figure S1). The reaction mixture was consequently composed of 20% v/v
EtOH, containing 33 mM NHDC (maximal amount that could be dissolved), and
125 mM sucrose, enough donor substrate to drive the reaction to completion.
The incubation of 5 U/mL Gtf180-ΔN-Q1140E in this reaction mixture resulted in
a NHDC conversion degree of 64.4% (Figure 2). HPLC analysis also revealed
that at least two major products were synthesized, 62% NHDC-G1 and 38%
NHDC-G2.
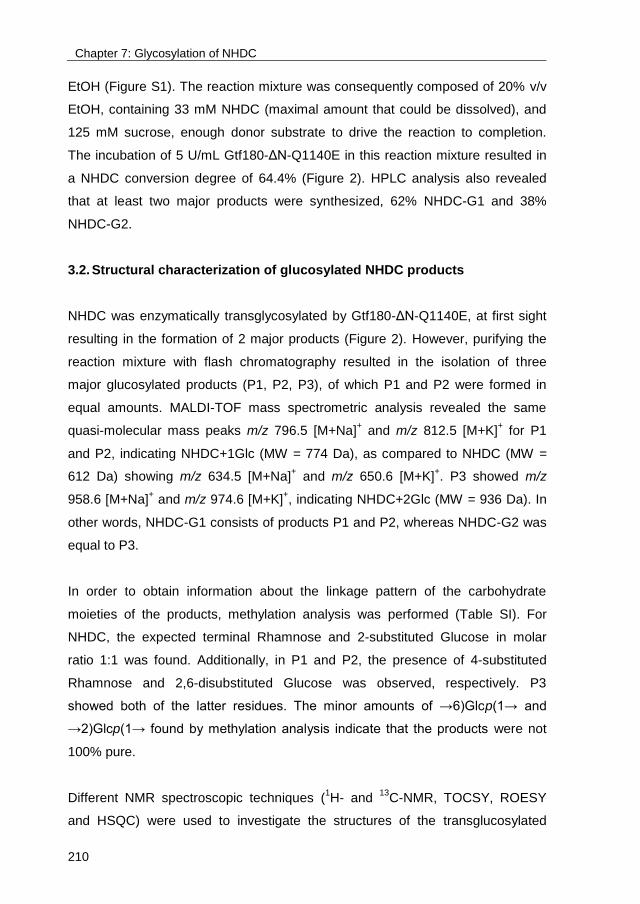
3.2. Structural characterization of glucosylated NHDC products
NHDC was enzymatically transglycosylated by Gtf180-ΔN-Q1140E, at first sight
resulting in the formation of 2 major products (Figure 2). However, purifying the
reaction mixture with flash chromatography resulted in the isolation of three
major glucosylated products (P1, P2, P3), of which P1 and P2 were formed in
equal amounts. MALDI-TOF mass spectrometric analysis revealed the same
quasi-molecular mass peaks m/z 796.5 [M+Na]+ and m/z 812.5 [M+K]
+ for P1
and P2, indicating NHDC+1Glc (MW = 774 Da), as compared to NHDC (MW =
612 Da) showing m/z 634.5 [M+Na]+ and m/z 650.6 [M+K]
+. P3 showed m/z
958.6 [M+Na]+ and m/z 974.6 [M+K]
+, indicating NHDC+2Glc (MW = 936 Da). In
other words, NHDC-G1 consists of products P1 and P2, whereas NHDC-G2 was
equal to P3.
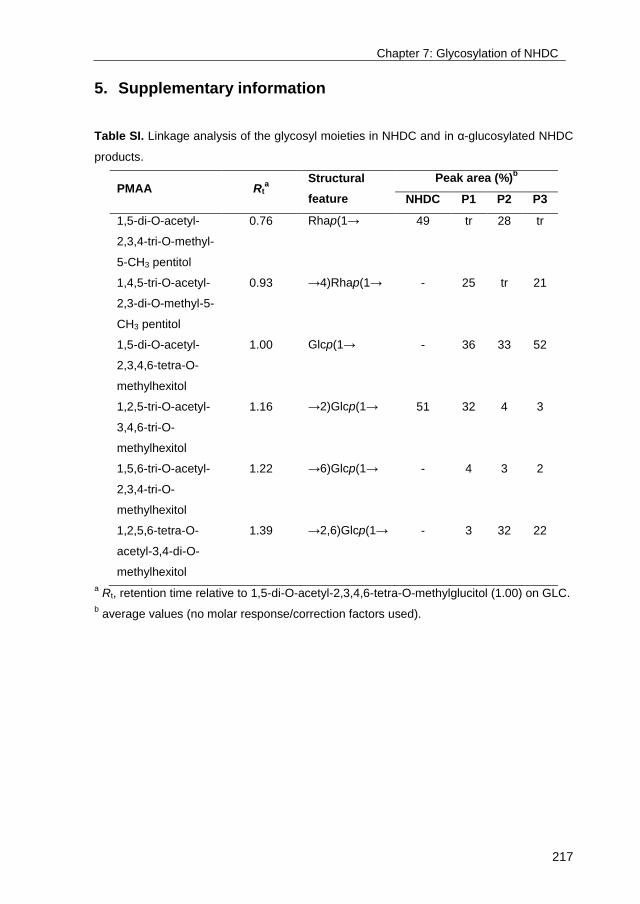
In order to obtain information about the linkage pattern of the carbohydrate
moieties of the products, methylation analysis was performed (Table SI). For
NHDC, the expected terminal Rhamnose and 2-substituted Glucose in molar
ratio 1:1 was found. Additionally, in P1 and P2, the presence of 4-substituted
Rhamnose and 2,6-disubstituted Glucose was observed, respectively. P3
showed both of the latter residues. The minor amounts of →6)Glcp(1→ and
→2)Glcp(1→ found by methylation analysis indicate that the products were not
100% pure.
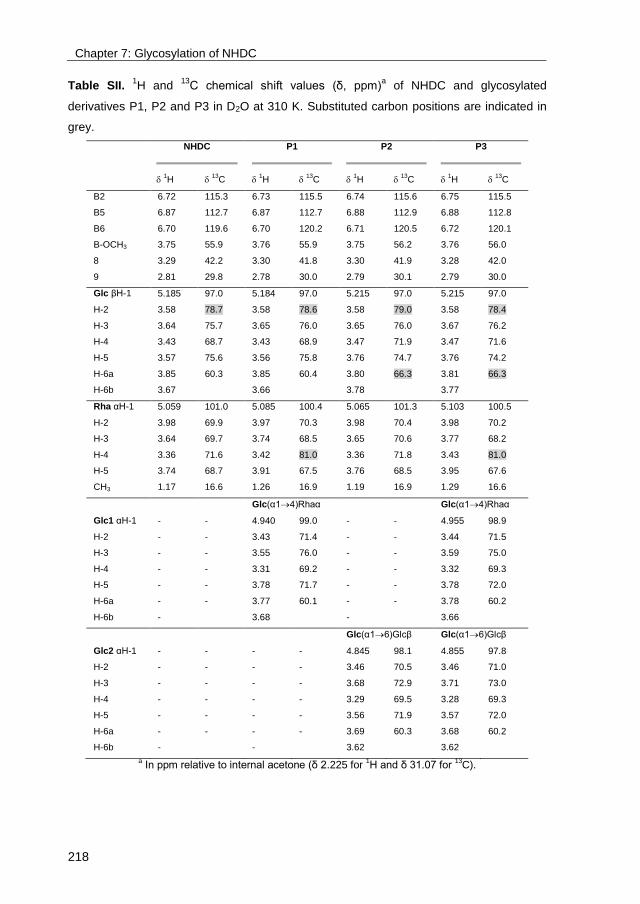
Different NMR spectroscopic techniques (1H- and
13C-NMR, TOCSY, ROESY
and HSQC) were used to investigate the structures of the transglucosylated
Chapter 7: Glycosylation of NHDC
211
NHDC derivatives. Firstly, NMR spectroscopy was performed with the acceptor
substrate NHDC in D2O to obtain reference data (Figure 3). In spite of the
reported low solubility of NHDC in water, D2O samples were easily obtained. It
has to be noted that the 1H chemical shifts are strongly affected by temperature
and sample concentrations (probably due to self-association of NHDC in D2O).
Figure 3. 1D 500-MHz 1H NMR spectra of NHDC, P1, P2 and P3, recorded in D2O at 310
K. * resonance signals stemming from contamination(s).

Chapter 7: Glycosylation of NHDC
212
The 500-MHz 1H NMR spectrum (Figure 3) of NHDC showed the signals of the
aromatic protons at δ 6.87 [d, J=8.2 Hz, B5], at δ 6.72 [s, J=2.0 Hz, B2], and at δ
6.70 [d, J=8.2 Hz, B6], together with two methylene groups [δ 3.29 (C8) and δ
2.81 (C9)] and a methoxy group [δ 3.75 (B-OCH3)], typical for the
dihydrochalcone skeleton266
. The aromatic proton signals of A2 and A6 (see
NHDC structure, Figure 1), initially found at δ 5.99, had disappeared due to
exchange with deuterium from the solvent (D2O) after prolonged time at 310 K269
.
Also, the C8 proton, in α position to the carbonyl group (C7), is susceptible to
deuterium exchange via the keto-enol route, consequently, 13
C correlations in
HSQC experiments will not be observed. Concerning the carbohydrate moiety,
the 1H NMR spectrum exhibited signals due to one β-D-glucopyranosyl unit [δ
5.185 (d, J=7.6 Hz, Glc H-1)] and one α-L-rhamnopyranosyl unit [δ 5.059 (br s, J
<2 Hz, Rha H-1) and δ 1.168 (d, J=6.1 Hz, Rha CH3)]. The assignment of the
signals (Table SII) was made through 2D NMR TOCSY experiments, using
different mixing times, and in combination with ROESY and HSQC (Figures S2
and S3). Indeed, the obtained NMR data of NHDC (Table SII) were in agreement
with She et al. (2011)250
and Caccia et al. (1998)266
.
The 500-MHz 1H NMR spectrum (Figure 3) of fractions P1 and P2 showed an
extra α-anomeric proton at δ 4.936 (J=3.7 Hz) and at δ 4.845 (J=3.7 Hz),
respectively, stemming from two differently attached glucose units, denoted as
Glc1 and Glc2. Compared to NHDC, the NMR spectrum of fraction P3 showed
signals stemming from both Glc1 and Glc2 (δ 4.955: J=3.7 Hz and δ 4.855: J=3.7
Hz). The resonance signals indicated with * in Figure 3 (e.g. p, q and r, having
mutual TOCSY connections) are stemming from contamination(s). The total
assignment of NMR signals (Table SII) was made through 2D NMR TOCSY,
HSQC and ROESY experiments in a similar way as for NHDC (Figures S4-9),
revealing that Glc1 and Glc2 were attached to NHDC at the α-L-rhamnopyranosyl
unit through an (α1→4) linkage and at the β-D-glucopyranosyl unit through an
(α1→6) linkage, respectively (Figure 4). In other words, P3 contained both the
newly formed (α1→4) linkage present in P1 and the (α1→6) linkage introduced in
P2. The results are in agreement with the methylation analyses (Table …). To

Chapter 7: Glycosylation of NHDC
213
our knowledge, these α-glucosylated NHDC derivatives have not been described
before and can thus be considered new-to-nature.
Figure 4. Chemical structures of α-glucosylated NHDC products: A NHDC-P1, B NHDC-
P2 and C NHDC-P3.
3.3. Sensory analysis of glucosylated NHDC products
NHDC is not only a high-intensity sweetener (340 times sweeter than sucrose), it
is reported to suppress the bitterness displayed by other sweeteners such as
RebA. A sensory analysis of aqueous solutions sweetened with RebA and 10
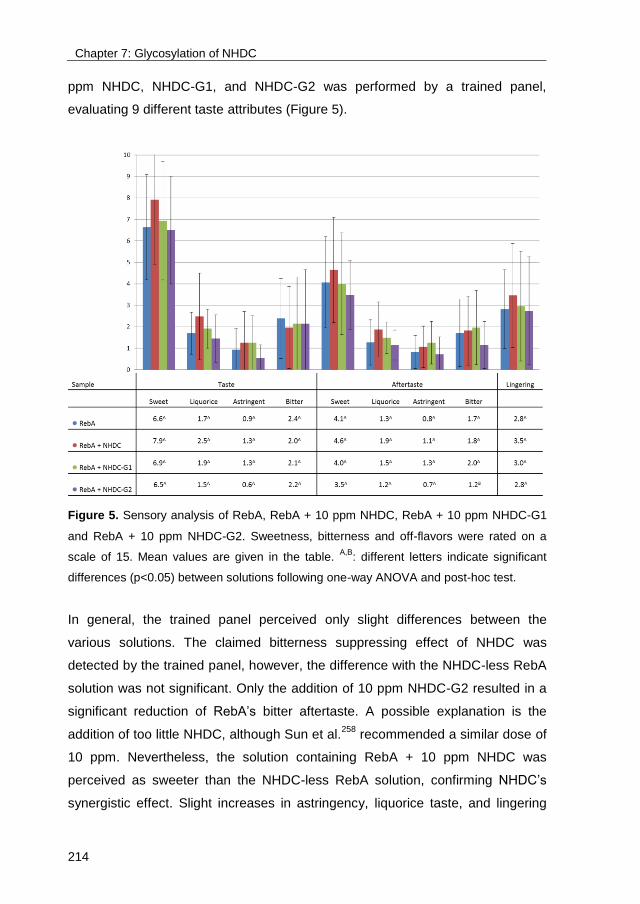
Chapter 7: Glycosylation of NHDC
214
ppm NHDC, NHDC-G1, and NHDC-G2 was performed by a trained panel,
evaluating 9 different taste attributes (Figure 5).
Figure 5. Sensory analysis of RebA, RebA + 10 ppm NHDC, RebA + 10 ppm NHDC-G1
and RebA + 10 ppm NHDC-G2. Sweetness, bitterness and off-flavors were rated on a
scale of 15. Mean values are given in the table. A,B
: different letters indicate significant
differences (p<0.05) between solutions following one-way ANOVA and post-hoc test.
In general, the trained panel perceived only slight differences between the
various solutions. The claimed bitterness suppressing effect of NHDC was
detected by the trained panel, however, the difference with the NHDC-less RebA
solution was not significant. Only the addition of 10 ppm NHDC-G2 resulted in a
significant reduction of RebA’s bitter aftertaste. A possible explanation is the
addition of too little NHDC, although Sun et al.258
recommended a similar dose of
10 ppm. Nevertheless, the solution containing RebA + 10 ppm NHDC was
perceived as sweeter than the NHDC-less RebA solution, confirming NHDC’s
synergistic effect. Slight increases in astringency, liquorice taste, and lingering

Chapter 7: Glycosylation of NHDC
215
were also observed, typical consequences of adding NHDC. Interestingly, the
addition of NHDC-G1 and NHDC-G2 instead of NHDC reduced these undesired
side-effects. However, as the trained panel was not able to perceive significant
differences between the various solutions, investigation of the appropriate dose
is required to obtain conclusive results. The limited availability of the trained
panel prevented further experimenting. In any case, it appears that α-
glucosylation of RebA by Gtf180-ΔN-Q1140E68-70
is a much more effective
strategy to decrease its bitterness than the addition of (glucosylated) NHDC. In
this context, analysis of the sensory properties of a solution containing
(glucosylated) NHDC and glucosylated RebA (RebA-G) is also an interesting
option.
3.4. Solubility of glucosylated NHDC products
The low solubility of NHDC prevents possible applications as nutraceutical, to
exploit its strong anti-oxidant properties. Determination of the solubilities in water
of NHDC and its α-glucosylated products revealed an impressive 800-fold
increase of solubility for NHDC-G1, whereas NHDC-G2 was even more soluble
(Table I). Previously, maltosylation of NHDC at the β-D-glucosyl unit, introduced
through an (α1→6) linkage, resulted in a 700-fold increase of solubility267
. An
alternative approach consisted of the cosolubilization of NHDC with sodium
saccharin, resulting in a 200-fold increase of solubility, significantly lower than the
improvement obtained after glycosylation265
.
3.5. Anti-oxidant properties of glucosylated NHDC products
In general, glycosylation of anti-oxidants increases their solubility in water,
however, the antioxidant capacity typically decreases139
. The ability of NHDC and
α-glucosylated NHDC products to scavenge DPPH was consequently evaluated
(Table I). Although glucosylating NHDC clearly reduced the scavenging activity
(EC50), NHDC-G1 and NHDC-G2 still showed excellent anti-oxidant capacities,
displaying EC50’s similar to the established anti-oxidant butylated hydroxytoluene
(BHT) which possessed an EC50 of 35.2 µM (determined experimentally).
Chapter 7: Glycosylation of NHDC
216
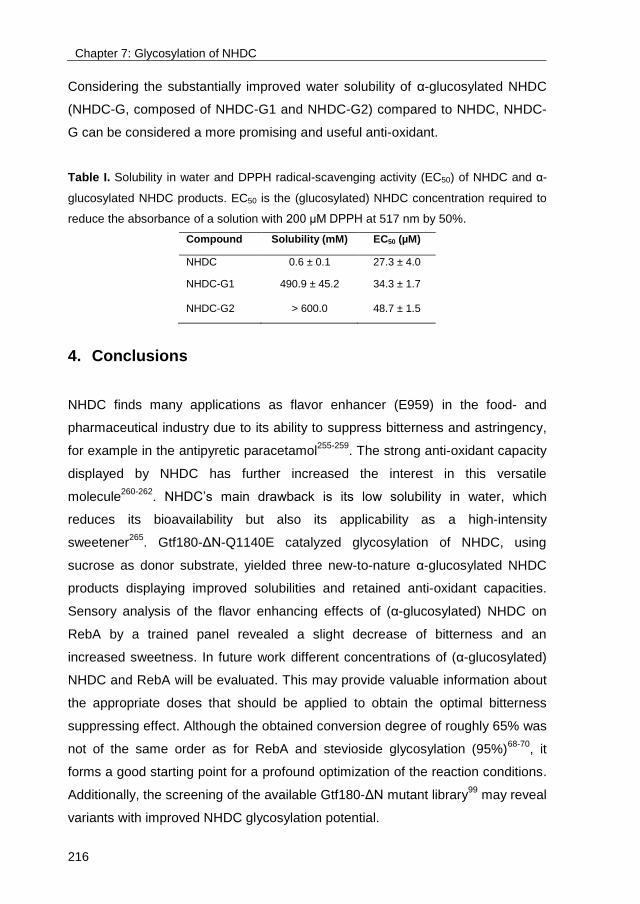
Considering the substantially improved water solubility of α-glucosylated NHDC
(NHDC-G, composed of NHDC-G1 and NHDC-G2) compared to NHDC, NHDC-
G can be considered a more promising and useful anti-oxidant.
Table I. Solubility in water and DPPH radical-scavenging activity (EC50) of NHDC and α-
glucosylated NHDC products. EC50 is the (glucosylated) NHDC concentration required to
reduce the absorbance of a solution with 200 μM DPPH at 517 nm by 50%.
Compound Solubility (mM) EC50 (µM)
NHDC 0.6 ± 0.1 27.3 ± 4.0
..
NHDC-G1 490.9 ± 45.2 34.3 ± 1.7
NHDC-G2 > 600.0 48.7 ± 1.5
4. Conclusions
NHDC finds many applications as flavor enhancer (E959) in the food- and
pharmaceutical industry due to its ability to suppress bitterness and astringency,
for example in the antipyretic paracetamol255-259
. The strong anti-oxidant capacity
displayed by NHDC has further increased the interest in this versatile
molecule260-262
. NHDC’s main drawback is its low solubility in water, which
reduces its bioavailability but also its applicability as a high-intensity
sweetener265
. Gtf180-ΔN-Q1140E catalyzed glycosylation of NHDC, using
sucrose as donor substrate, yielded three new-to-nature α-glucosylated NHDC
products displaying improved solubilities and retained anti-oxidant capacities.
Sensory analysis of the flavor enhancing effects of (α-glucosylated) NHDC on
RebA by a trained panel revealed a slight decrease of bitterness and an
increased sweetness. In future work different concentrations of (α-glucosylated)
NHDC and RebA will be evaluated. This may provide valuable information about
the appropriate doses that should be applied to obtain the optimal bitterness
suppressing effect. Although the obtained conversion degree of roughly 65% was
not of the same order as for RebA and stevioside glycosylation (95%)68-70
, it
forms a good starting point for a profound optimization of the reaction conditions.
Additionally, the screening of the available Gtf180-ΔN mutant library99
may reveal
variants with improved NHDC glycosylation potential.
Chapter 7: Glycosylation of NHDC
217
5. Supplementary information
Table SI. Linkage analysis of the glycosyl moieties in NHDC and in α-glucosylated NHDC
products.
PMAA Rta
Structural
feature
Peak area (%)b
NHDC P1 P2 P3
1,5-di-O-acetyl-
2,3,4-tri-O-methyl-
5-CH3 pentitol
0.76 Rhap(1→ 49 tr 28 tr
1,4,5-tri-O-acetyl-
2,3-di-O-methyl-5-
CH3 pentitol
0.93 →4)Rhap(1→ - 25 tr 21
1,5-di-O-acetyl-
2,3,4,6-tetra-O-
methylhexitol
1.00 Glcp(1→ - 36 33 52
1,2,5-tri-O-acetyl-
3,4,6-tri-O-
methylhexitol
1.16 →2)Glcp(1→ 51 32 4 3
1,5,6-tri-O-acetyl-
2,3,4-tri-O-
methylhexitol
1.22 →6)Glcp(1→ - 4 3 2
1,2,5,6-tetra-O-
acetyl-3,4-di-O-
methylhexitol
1.39 →2,6)Glcp(1→ - 3 32 22
a Rt, retention time relative to 1,5-di-O-acetyl-2,3,4,6-tetra-O-methylglucitol (1.00) on GLC.
b average values (no molar response/correction factors used).
Chapter 7: Glycosylation of NHDC
218
Table SII. 1H and
13C chemical shift values (δ, ppm)
a of NHDC and glycosylated
derivatives P1, P2 and P3 in D2O at 310 K. Substituted carbon positions are indicated in
grey.
NHDC
P1
P2
P3
1H
13C
1H
13C
1H
13C
1H
13C
B2 6.72 115.3 6.73 115.5 6.74 115.6 6.75 115.5
B5 6.87 112.7 6.87 112.7 6.88 112.9 6.88 112.8
B6 6.70 119.6 6.70 120.2 6.71 120.5 6.72 120.1
B-OCH3 3.75 55.9 3.76 55.9 3.75 56.2 3.76 56.0
8 3.29 42.2 3.30 41.8 3.30 41.9 3.28 42.0
9 2.81 29.8 2.78 30.0 2.79 30.1 2.79 30.0
Glc βH-1 5.185 97.0 5.184 97.0 5.215 97.0 5.215 97.0
H-2 3.58 78.7 3.58 78.6 3.58 79.0 3.58 78.4
H-3 3.64 75.7 3.65 76.0 3.65 76.0 3.67 76.2
H-4 3.43 68.7 3.43 68.9 3.47 71.9 3.47 71.6
H-5 3.57 75.6 3.56 75.8 3.76 74.7 3.76 74.2
H-6a 3.85 60.3 3.85 60.4 3.80 66.3 3.81 66.3
H-6b 3.67 3.66 3.78 3.77
Rha αH-1 5.059 101.0 5.085 100.4 5.065 101.3 5.103 100.5
H-2 3.98 69.9 3.97 70.3 3.98 70.4 3.98 70.2
H-3 3.64 69.7 3.74 68.5 3.65 70.6 3.77 68.2
H-4 3.36 71.6 3.42 81.0 3.36 71.8 3.43 81.0
H-5 3.74 68.7 3.91 67.5 3.76 68.5 3.95 67.6
CH3 1.17 16.6 1.26 16.9 1.19 16.9 1.29 16.6
Glc(α14)Rhaα Glc(α14)Rhaα
Glc1 αH-1 - - 4.940 99.0 - - 4.955 98.9
H-2 - - 3.43 71.4 - - 3.44 71.5
H-3 - - 3.55 76.0 - - 3.59 75.0
H-4 - - 3.31 69.2 - - 3.32 69.3
H-5 - - 3.78 71.7 - - 3.78 72.0
H-6a - - 3.77 60.1 - - 3.78 60.2
H-6b - 3.68 - 3.66
Glc(α16)Glcβ Glc(α16)Glcβ
Glc2 αH-1 - - - - 4.845 98.1 4.855 97.8
H-2 - - - - 3.46 70.5 3.46 71.0
H-3 - - - - 3.68 72.9 3.71 73.0
H-4 - - - - 3.29 69.5 3.28 69.3
H-5 - - - - 3.56 71.9 3.57 72.0
H-6a - - - - 3.69 60.3 3.68 60.2
H-6b - - 3.62 3.62
a In ppm relative to internal acetone (δ 2.225 for
1H and δ 31.07 for
13C).
Chapter 7: Glycosylation of NHDC
219
Figure S1. Transglycosylation activity of Gtf180-ΔN-Q1140E after a 1 h incubation in
RebA glycosylation mixtures (84 mM RebA, 282 mM sucrose) containing A 0%, B 10%, C
20%, D 30%, E 40%, and F 50% EtOH. 1 RebA, 2 Monoglucosylated RebA (RebA-G1), 3
Sucrose.
Chapter 7: Glycosylation of NHDC
220
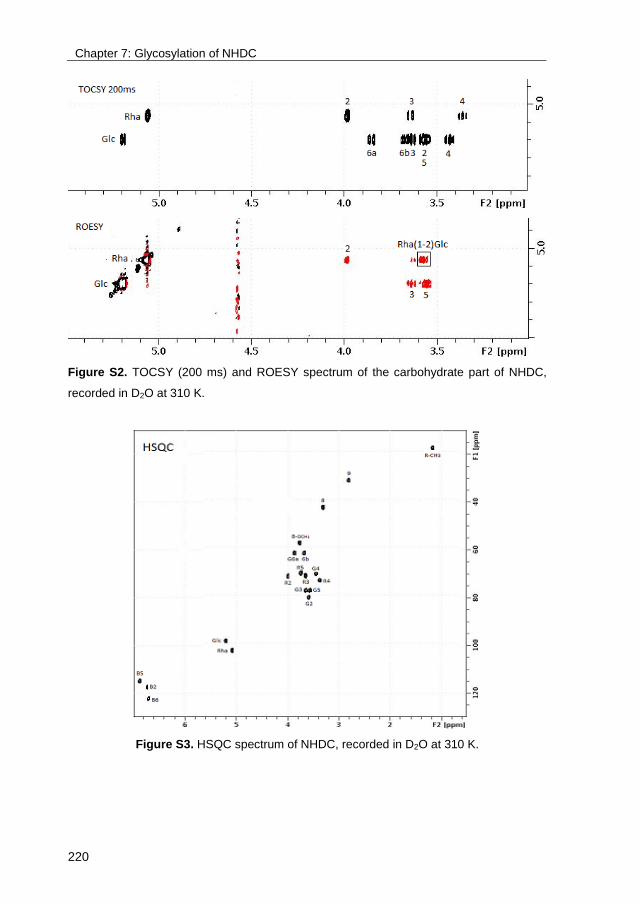
Figure S2. TOCSY (200 ms) and ROESY spectrum of the carbohydrate part of NHDC,
recorded in D2O at 310 K.
Figure S3. HSQC spectrum of NHDC, recorded in D2O at 310 K.
Chapter 7: Glycosylation of NHDC
221
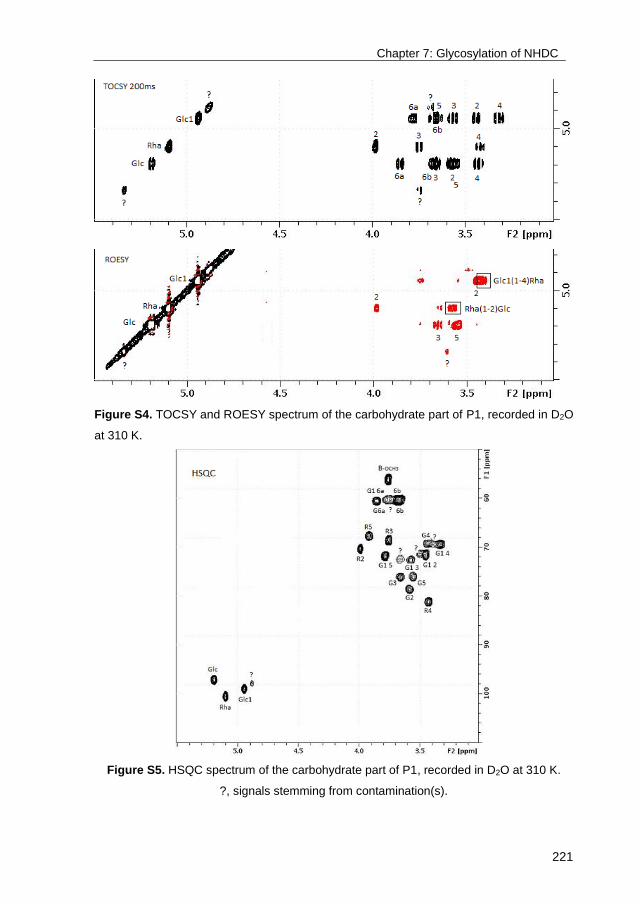
Figure S4. TOCSY and ROESY spectrum of the carbohydrate part of P1, recorded in D2O
at 310 K.
Figure S5. HSQC spectrum of the carbohydrate part of P1, recorded in D2O at 310 K.
?, signals stemming from contamination(s).
Chapter 7: Glycosylation of NHDC
222
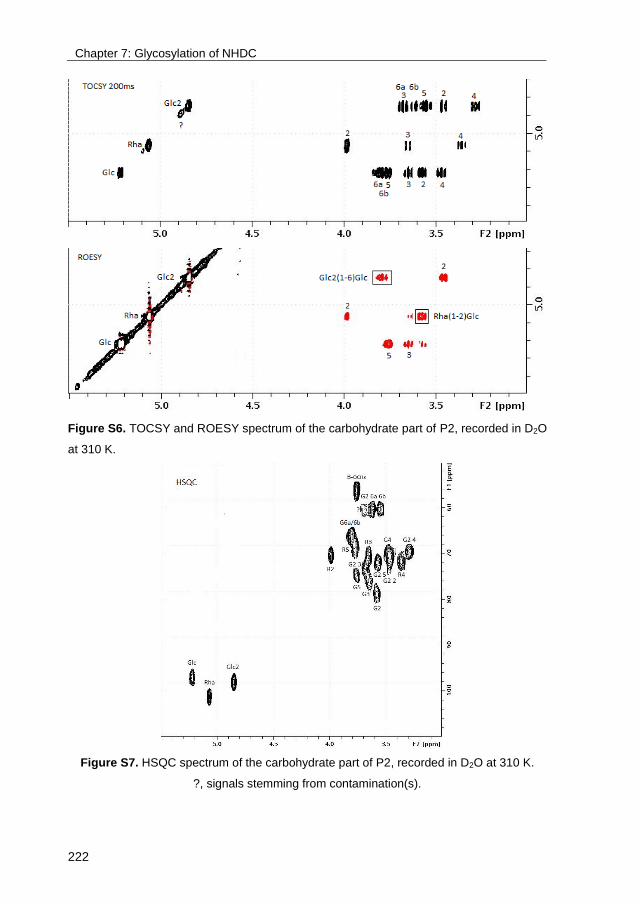
Figure S6. TOCSY and ROESY spectrum of the carbohydrate part of P2, recorded in D2O
at 310 K.
Figure S7. HSQC spectrum of the carbohydrate part of P2, recorded in D2O at 310 K.
?, signals stemming from contamination(s).
Chapter 7: Glycosylation of NHDC
223
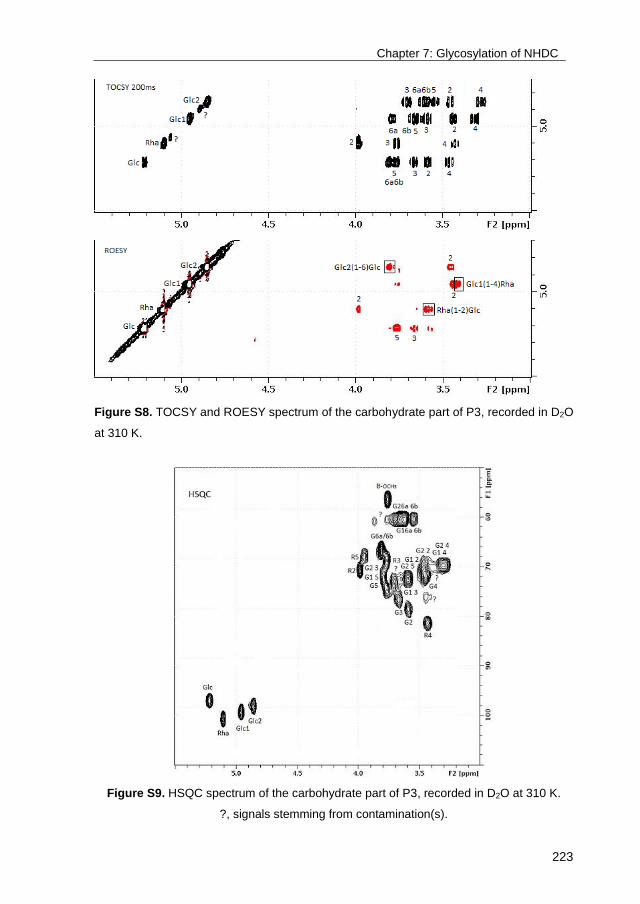
Figure S8. TOCSY and ROESY spectrum of the carbohydrate part of P3, recorded in D2O
at 310 K.
Figure S9. HSQC spectrum of the carbohydrate part of P3, recorded in D2O at 310 K.
?, signals stemming from contamination(s).
