university of adelaide · 2018-03-23 · table of contents volume i chapter 1 : fraffieijj0rk 0f...
TRANSCRIPT

tslz¡æz-
MAGNETIC AND GRAV]TY INTERPRETATION
OF AN AREA OF
PRECAITIBRIAN SED]MENTS TN AUSTRALIA
by
David Hamilton Tucker¡ E.Sc.(Hons. ) Adelaide
A thesis submitted to the University of Adelaidein fulfilment of the requirements
for the degree of Doctor of Philosophy
September', 1972

This thesis contains no material uhich has been accepted
for the aulard of any other degree or diploma in any
UniversÍty. To the best of the authorrs knou¡ledoe and
belief, the thesis contains no material pleviously
published or uritten by another person, except' ulhen due
reference is made in the text.
Davicl H. Tucker

TABLE OF CONTENTS
Volume I
Chapter 1 : FRAffiEIJJ0RK 0F THE pROtsLEi"$S
Introduction to the thesis ulork
Geology of the Adetaide Geosyncline
Framework of the geophysical problems studied
Character of vertÍcal field ground anomalies overAdelaide SYstern sediments
Paqe
20
20
22
23
25
27
37
39
43
I
I
4
1.r
I.2
1.3
2.Ioo
2.3
2,4
2.5
2.6
Chapter 2 : SCOPE 0F THE THESIS
Scope
The data studied
tYlagnetic data
Gravity data
Appendioes
Presentation
3.1 Introduction
Recording details of the 0RR0R00 aenomagnetic survey
Topographic effects and fllyinq noise
Method of study and positioning of sources
Interpretation of the magnetometer data
fflagnetization of beds
Discussion
3,2
3.4
3.5
3.6
3.7
Chapter 4 : DETAILS OF MAGNETIC BEDS REVEALED BY
GROUND SURVEYS
4rl.
4.2
Int¡oduction
l0
13
13
T4
15
L7
1B
19
PART A 3 Magnetic anomalies caused by Adelaide system sediments
Chapter 3 : AEROMAGNETIC STUDY BF 0RR0R0il
_ 3.3
43
45

4.3
4.4
4.5
4.6
4.7
Chapter 5
5.1
512
5.3
5.4
5.5
5r6
Noise
fflagnetic susceptibility measulémehts on AdelaideSystem rocks
Method of interpretatr'-on and problems
Characteristics of magnetic beds as indicated by
interpretation of ground data
Discussion of maqnetic beds
REMANENT MAGNET]SM OF THE LOIIJER TAPLEY HlLLMAGNETIC BED
70
Page
47
51
53
57
68
70
72
73
7s
78
79
835.7
Introduction
Previous palaeomagnetic ulork on Adelairle Systetn sediments
Basis of interPretation
Interpretation of ground surveys in the luaukaringa area
Strength of magnetization
Interpretation of the total field aeromagnetic anomaly
map
DisoussÍon
fYlagnetic anomalÍes not caused by Adelaide SystemPART B 3
sediments
Chapt er 6 ANOfIIALIES NOT DUE TO ADELAIDEAN SEDIMENTS
6.r
6.2
6.3
6.4
6,5
6.6
6.7
InLroduction
The anomalies
lÏìagnetic anomalies over diapirs
Magnetic resPonse of dYke sularms
Magnetic response of Quaternary sediments
Interpretation of the aeromagnetic anomalies on 0RR0R00
DÍscussion
8s
85
87
9t
93
97
100
r03

Page
PART C I Bouguer gravity anomalies associated ulith granites
chapter ? : GENERAL ASPECTS 0F B0UGUER AND mAGNETIC ANO|Y|ALfEs 105
?.1
7.2
7.3
Introduction
Presentation of the Bouguel anomaly maP
General considefations of the Bouguer anomalies ín thethesis area
Basement of the Adelaide Geosyncline
Basement of the Frome Embayment and [Ylurray Basin
D]SCUSSION OF DENSTTY DATA Ft]R THE ADELA]DE
GEOSYNCL IN E
105
108
109
7.4
'?.5
Chapter B
111
II5
118
118
119
L2L
L25
L29
136
r39
14r
r44
B.l
8.2
8.3
814
8.5
8.6
B.?
8.8
Introductíon
ClassificatÍon of rock tYPes
Measurement of densitY of rocks
Problems of estirnating average density
Density data for Adelaide System sediments
Density data for pre-Adelaidean rocks
Densitydataforpost-Adelaideanigneousintrusives
Conclusions
INTERPRETATTON OF GRAVITY LOIIJS ASSOCIATET)
IIJITH GRAN ITESChapfer 9
g.l
9,2
9.3
9.4
9.5
916
9 .'l
IntrocJuction
tYlethod of interpretation of gravity louts
Bouguet Anomaly 14 - the Anabama Granj-te
Bouguer Anomaly 11 - Glenorchy area
Bouguer Anomaly 5 - fflt. Painter area
Notes on AnomalY 2
Discussion
L44
L45
150
154
1s9
L62
163
165
I68
Chapter l0 ¡ C0NCLUSION
BibliographY

Uolune I I
Appendix AI
nA2
nA3r, A4
tt A5
tt A6
rr A?
Figr.ces to aecompanY texË
Drill core material testad
Magnetic pnopertíes of rock sanples
Ground magnetometer ùrawrsee
ftlagneùfc minetal analYses
Computer pfograrng
Interpretation of tabular body anomalie¡
Additional matters arising ftom comments
Page
i
IT
xlx
xxix
xxx
x)Ofl
xxxx

-1-
ABSTRACT
The interpretation of aeromagnetic and ground magnetic suDv€ys
mada over Adelaide System sediments in the Adelaide Geosyncline (South
Auetralia) shous tirat long linear magnetic anomalies are caused by
magnetic sedimentary beds" 0f the L4 magnetic beds recognized in the
lllilpena, umberatana and Burra rock groups near 0rroroo, only one is an
iron formation; the others lie uithin shales, slates, quartzites and
tillÍtes. The magnetic beds have the form of thin sheeÈs conformabl"e
u¡ith the sedimentary layering. These maqnetic sheets are interbedded
,ith non-magnetic layers forming beds tuhích have a total thickness of up
to 300 metres. Individual sheets are r¡¡eathered to depths of up to 200
metres" The beds are usually maqnetized in a dÍrection close to the
geological layering. Remanent magnetism is usually a more important
cont,ribu.bor to the magnetic anomalÍes than the magnetic susceptibility.
Interpretation of the anomalies indicates that in the Lourer Tapley HiIl
magnetic bed, a comPonent of remanent magnetism acquÍred before foldinq
lLes in a direction of I35o east of north, and is close to the qeological
Iayering¡ the direction of the pre-folding component of remanence u,as
deduced by a study of vertical field anomal-ies around ant,lclinal structures "
The strength of magnetization of the most strongly magnetic beds is about
I0-3 coÇ.s. units.
llJhile most of the shalloru source magnetic anomalies observed over
the Adelaide Geosyncline are caused by magnetic beds urÍthin Adelaide
System sediments, there arersome ulhich are caused by other sources"
Basic igneous rocks uithin di{pirs are magnetic. tllith the uride spacing
(I.O k:.lometres) of aeromagnetic flíght lines it is difficult to recognize
anomalies uhich might be caused by smalI unrecognized or unexposed igneous
bodies. A uleak aeromagnetic anomaly (4 garnmas) uas reco¡ded over small

-.11 -
carbonatite dykes in the tllaÌlouay Diapir"
tYìoE;t of the anomalies over plains of Quaternary sediments ar'e
þ.roÏrably ploduced by variations in Lhickness of the magneüic pant of Ll-re
sc¿dirnents, but sr-lsceptibitity changes ulithin the sediments may also be
impor,cant" The magnetic susceptibiliLy of the Quaternary sedirnents is
abou'i: l-, 000 x .10-6 c. g. s . units at one locality.
The magnel,ic pattern a-1-so shotus various broad anomalies and
l-ineagents ulh-i-ch ale probab-ì.y caused by deep magnetic bodies beloLl the
Ace .r-aide S)¡stem sediments"
It a¡:pears that thn ¡r.,'eia1e density of Adelaide System secìiments aild
o-r-cler basement roclcs is approximately the same; thus tlre regional Bouguer
anoma-'l-y da'bl do ttot give info-rnation on the depth to the floor of l,ho
Aclel-aide G::osyncl-ì-i-io. Negat--r,,ve gravity anomalies uith an amplitudc oÍ
Z-O. 4O mi¡--iigal-s indica''¿e tha'¿ 1ou Censity granite batholiths of considecable
s-ize ancj depi;h ex'rent occur in the tTlt" Painter arear near Glenorchy llome-
steacl, and in the area of the Anabama Granite. There ate varÍous lonq
g:avity gradj-ents Luhich may be caused by density changes in ùhe basemen'b
bei-our the Aclelaj.Ce Sysiean sediments.
Comments uhiclr clarify varicus points raised duning examinai:ion of
the Llresis are included as Appendix 47.

-IaI-
ACKNO|JJLEDGEMENTS
The uork for the thesis uas carried out at t,he Department of
Economie Geology of the University of Adelaide u¡hile the autho¡ ulas in
receÍpt of a Commonulealth Post Graduate Aurerd. The author acknouledgee
ruith pleasure the stimulating supervision given by Professor D. M' Boyd
during the research. Various geologist colleagues at the university
provided valuable assistance uith the ulork. The author is particularly
grateful for help by Dr. V. Gostin and tYlr. J. SUmartojo of the Department
of Geology and tYlíneralogy, and Dr. R. Both and ffir. J. Barry of the
Depantment of Economic GeologY.
The author thanks the Director of the Sourth Australian Department
of ttlines for allot¡ing access t,o original aeromaqnetic fliqht chants and
other unpublished data for the research projectr arìd for providing office
space in ulhich to study the material. Officers of the Department of
fYll-nes gave valuable assistance; in particular, thanks are expressed to
lYlr. G. lllhitten, tllr. D. fflcPharlin, Mr. R. Gerdes and [Ylr. B. MÍlton'
During the research uork the authol ulas on leave ulithout pay from
the Bureau of lTlineral Resourcesr Cant:erra. The author thanks the
Director of the Bureau for providing the data from the 1970 negional
Helicoptee Gravity Survey of the eastern part of South Austral-ía, and
for allotuing access to other unPublished material. The author is
particularly grateful for the assistance and advice given by ffir' F'
Brouln in preparing a report on the gravity ulork for the Bureaut and
for the drafting by [Ylr. R. Sandford in connection uith the gravity uork.
UJhile the research project ulas essentially geophysical, it uas
necessary to investigabe the mineralogy of varioUB lock Bamples.

The author gratefully acknourledges the help given by fYlr. l.J. flussared
in pneparing thin and polished thin sections ¡ and the mineragraphic
uork by Dr. A. llJhitüle, Dr. R. Both and lllr' J' Barry'
Various mineraf exploration Gompanies assisted uith the uork by
proViding drilI hole material, and allouing access to unpublished geophy-
elca1 information from various areas " Although the geophysical data
(mainly magnetics) are not discussed in the text of the thesis' it
provided valuable checks on the conclusíons drauln from the autho[rs ulork.
The author particularly thanks tTlr, I" Haddou of R.[Yl"c. tYlinerals, and
fYlr. K. Price of lYlinerals, tYlining ancl llletallurgy Ltd" for drilling per-
cussion holes at three localities of interest. The author acknouledges
the assistance of Mines Exploration Pty. Ltd. and R.lì1.c" lÏinerals for
providing field hands to assist on ground magnetometer surveys Ín the
0rroroo area. The author acknou.rledges the hel-p by fYlr. D. christie of
Broken Hill South Pty. Ltd. in 9ívin9 access to geophysical data from
groUnd magneLometer surveys north of lllaukaringa. The author acknoull-edges
the assistance by ffìr. D. Colchester and fYìr" J. Stracke of Stockdale
prospect,ing Ltd. in allouling the author to examine kimberlite dykes
and plugs in the Tero,uie areae and for allouing access to an unpublished
paper on the kimberlites in the area '
The drafting of some of the diagrams for the thesis ruas done by
the author. The author acknouledges the uork by tYlr" R' CammeII of the
Department of Economic Geology, tÏiss A. Hockey and fYlr" R. sandford of
the Bureau of fylineral Resources, ulho betuleen them drafted apploximately
trLro-t,hirds of the diagrams. Mr. R. Sprod of the Department of
Economic Geology did most of the photographic ulork on the diagrams and
his help is gratefully acknourledged" The author acknouledges fhe help
by his uife, fYlarilyn Tuckeru ffliss G. Harper and t{liss K' Duncan, uho

typed drafts of the thesis and other ulork during the ¡esearch r'lork'
tylrs, H" BalI of the Department of Economic Geology typed the thesis and
ran off the copies; her help on this exacting task and othen assistance
she gave during the course of the uork is gratefully acknouledged'

-VJ-.
PUBL ICAT IONS
Tuo papers u,ere compJ-eted during the research uork.
I ItReconnaissance Helicopter Gravity Survey in the Flinders Ranges,
South Australia 1970'r by D. H. Tucker and F. ll/, Brouln. Bur.
lÏlÍner, Resour" Aust" Rec. (unpublished)"
This rJocument is the authc¡rrs interpretat,ion of the helicopter
gravity survey floun by the Bureau of Mineral- Resources for the South
Australian Department of fYlines. llJhen the author commenced reseanch f or
the thesis in March,1969, ha asked the Director of the Bureau for access
to the gravity survey data as soon as it uas availablei the Director
agreed on condition that an official document be ulritten uhich included
interpretative ulork for the thesís" The main lines of investigation
u¡e¡e the problem of densities and the problem of qrá\ri-ty lou.rs associated
uith granite bodies. HouLever, other lines of study such as the rel-ation
of regional gravity trends and lineaments to the location of mineral
occuDrencese ulere also pufsued because the author considerad these of
importance .in an interpretation of regional gravity data in an area
regarded as a mineral province.
The interpreLative uork in the officj.al document is solely that of
the author except fon the tuo appendices I and 2 uhich uere uritten by
lYlr. F . [, . BrorLln of the Bureau.
frLamprophyrlc intrusions of probable carbonatitic affinity from
South AUst¡alia" by D. H. Tuclcer and K. D. Collerson" Geol.
Soc. of Aust. (accepted f or publicâtion, tYlay r L9?2) .
In the course óf st,udy of the aeromãgnetic data for the 0RR0R00
I:250r000 sheet the author uJas j.nteresùed in magnetic anomal-ies uhlch
2

-vI].-
u,ere apparently unrel-ated to the magnetic Adelaide System sediments'
It uras urhile measuring the densities of hand specimens colÌected during
geological mapping of 0RR0R00 by Binks (tsoa), that the author recog-
nized that one r.ock ulhich came from an area afteady selected by the
autho¡ as a possÍbÌe area of igneous intrusions, resembled kimberlite'
The significance of the sample had not previousl-y been recoqnized'
Subsequent field studies by the author and tYlr. K" Cofferson (petrologist)
in the area urhe¡e the original specimen had been collected (Ual-toulay
Diapir) located five dykes and tuo plugs ofl primary carbonate rocks in
an area some 500 by 200 metres in size"
The detailed petroqraphy and geochenristry of the rocks from the
various intrusive bodies ulere investigated by Collerson; the author
carried out a study of the maqnetics of the area. A joint paper uas
uritten on the intrusives.

- vilí -
TERTIINOLOGY AND GEOPHYSTCAL UNITS
.le-qoi--[el"gy
SADfYl - South Australian Department of fYlines
BJ¡R - Bureau of fflineral Resources (Geology and Geophysics)
The Department of National tYlapping has divided Australia into
I:250r000 areas, 10 latitude hÍgh by I.50 longitude uide. These areas
have been given official names, and in the thesis are referred to in
capital letters¡ ê.g. ORR0R00. Geographical place names a¡e ¡eferred
in Louler case, ê.Ç. 0rDoroo.
Units
For gork ulith magnetic anomaliesr the unrationalized c.9.s. system
of units is used together uith the usual subdivision of the intensity
of the magnetic field (Oersteds) into gammas (Cliiburell & Gniggr 19?1).
Thus I 0ersted = 105 gammas. Volume magnetic susceptibilities are
quotecl as having rrc.g.s. unitsrr; it ulould be acceptable to use the
alternative notation rrer[ì.u. /" 3". Intensities of maqnetization are
referred to in c.Ç.s. units. Lengths are mostly scaled in metres (m)
or kilometres (t<r). This does not confl-ict uith the use.of 6.9.s. uniùs,
because in standard formulae for magnetic anomalies due to bodies of
various shapes (e.g. Gay, 1963)I the dimensions of length,urhich
desc¡ibe the depth and uidth of the bodiesrcancel out.
For r¡ork uith gravity anomalies, the standard subdivision of the
acceleration due to gravity, the mi11i9aì. (mg)ris used. Thus l-03 mg
= 1 gall = L cm/sec2.
ri
I eurnToA

-1-
Chapter L
td I
Þ:-
¡
II,I
,,
!.
)
I
I
{J
FRAMEIIJORK OF THE PROBLEMS
1.1 Introduction !o- t-hg,-thesis -.!llolK
This thesís presents an interpretation fot some of the special
features evident in regional Beromagnetic data and Bouguer gravity data
from an area of Precambrian sedimentary st¡ata in eastern South Auetralia.
As yet, very lÍttle detaíIed rL¡ork of the kind diseussed in the thesis has
been done on the regional geophysical data for Precambrian areas of
Australia or other parts of the uorld. It is hoped that the thesls
uill stimUlate other research, both geologÍcal and geophyelcal' in the
thesis a¡ea and other areas of Precambrian metasediments in Australia
(rig. 1.1).
fÏlost of Australia has nou been surveyed urith both aeromagnetics
and Bouguer gravity netuorks either by on on bahalf of the Bureau of
f[ineral Reeources (gmn). The primary purpose of most of the ruork has
been to dalíneate sedimentary basins prospectíve for oil and to this end
the data have been very useful. In the course of the uork great areas
of Proterozoic and Archaean rocks have been surveyed (e.9. the Kalgoorlie
area uhere banded Íron fo¡mations are strongly magnetic), but for these
areas no detailed interpretation has beon published. The main problem
Ís that to interpret a1l of the available data uould take a great number
of geophysicists a great deal of tíme. For exampler there are mo¡'e
than turo million line mfles of aeromagnetic chartsr and to carry out a
Iino by line analysis of this in conJunction uÍth brief geological
etudfee ruould take about 300 man years¡ Reporting on regional surveys
iE usually undertaken by the BlTlR, and so far, the reponts have mainly
been very brief and point, out some of the most important features.
Å,
#

-2-
In some areas of particufar ínterest, extensive ground follour-up st,udies
have been carried out by government agencies and published¡ ê.9. Tennant
Creek (O"fy, 195?)¡ Savage River (eaOier Ig?D). In addition, mineral
exploration companies have uorked in many aleas of interest" This
ruork is unPublÍshed and is not available.
Because of the current interest in mineral exploration of the
P¡ecambrian shield areas of Australia, it is timely to present a study
of some special features of interest in the geophysical data floc an area
ruhere the geology is fairly ueII knourn. IÈ is to be hoped that simÍIar
urork gill soon be carried out in a¡eas ulhere the geology is not ulell
knouln, because it is clear that much useful information is available Ín
the geophysical data.
The area chosen for study Ín this thesis is the Adelaide Geosyncline
(Fig. 2), an atea ruhere the stratigraphic succession for sediments of
Upper proterozoic age (nOe]aiae System sediments) is established, and the
geology is lairly urell knouln. Figure I.2 shou¡s the locatíon of tho
Ade1aÍde Geosyncline in South Australia and illustnates the geology of
the area. Figures 1.3 and 1.4 shou the Bouguer anomalies and aeromagnetic
anomalies over the area of greatest interest in the thesis.
The probtems to be studied are
I magnetic anomalies urhieh are caused by near surface sources
associated r¡ith Adelaide System sedimontsr and
2. Bouguer anomaly lou¡s tuhich appear to be related to granÍtes.
Thers are special difficulties in interpreting regional geophysical
data. The first is the enormÍty of the task of studylng a1l reco¡ded
l¡
¡
{
I

-3-
anomalies. Ths second is the problem of obtaining suiüable dril-l core
material.
For the thesis research on magnetic anomalies, special attention
uas given to the 0RR0R00 sheet, an area of about 151000 sq km¡ flor u¡hich
detailed geology maps and the most recent aetomagnetic survey data uere
availabLe (figs. I.5 & f.6 in the pocket of Vol,2). Apart from the
factor of qualíty of the dat,a for 0RR0R00¡ the area uas selected for
detailed uork because it appeared that a change in magnetic properties
of Adelaide System sediments occurs across the area. In the regional
Bouguer anomaly data, a feul special anomalies uere selected for study.
During the course of the research, a general investigation of the
geophysics uras canried out for the entire Adelaide Geosyncline, At the
outset it uias hoped that rnany aspects of the geophysics could be fully
pursuedr and that an appraisal could be given for the u¡hole area. It
uras found that this u¡as far too ambitious a project for one Ph.D. As
various avenues of research ulere follouled it became evidont that they in
themselves could be the subjects of further fTl.Sc. or Ph.D. researches.
For example, the aeromagnetic and Bouguer gravity maps shoul evidence
of a fracture pattern in the basement of the Adelaide Geosyncline.
Deep source magnetic and gravity anomalies are truncated or are displaced
along dist,inct líneaments. Other anomalies line up into disüinct
lineaments. Features like these have been qualitatively interpreted
by Gay (tSlZ) as indicative of basement faults. To quantltativel-y
lnterpret the anomalies for basement structures 1s very difficult and
Ís a maJor project. Thomson (1S0S) considers that mineral occurrences
in the Adelaide Geosyncline form Lineaments indicating that deep
fracturing controlled the emplacement of minerals into the Adelaidean

-4-
sediments. Clearly a fuJ.l investigation of the basernent fracturing
uould be valuable in the area.
A second example, uhich comes from the auùhorrs u¡orkr is that the
geosynclinal sediments are often deeply magnoticaJ-ly rueathered; as yet
geological and geophysical studÍes have been confined to the ueathered
zone. It ulould be sf interest to uork ulith fresh rock samples to com-
pare the geophysical and geological properties rLlith results from the
ueathered material. The authorts uork urith magnetic anomalies due to
shallour sources is the first to use geophysics to put a quantitatÍve
estimate on depth of ueathering of Proterozoic aged strata in the Adelaide
Geosynclina. Houever, the major problem ín follouring the investigation
to a full conclusion is that there is litt1e drill core available from
belou the ueatheced zone. fYlost material comes flrom percussion holes
uhÍch do not exceed about 100 m in depth. The holes are located in
the zone of enrichment of interest in mineral eXploratÍon. CIearIy
an investigation of the kind suqgesüed above uould be of value in the
afea, but its success rests ulith being able to obtain f¡esh cores for
study. This Ís beyond the resources of the University of Adelaide and
uould have to be carried out in close cooperatíon urÍth mineral exploration
companies. The author approached 35 companies active in ths Adelaide
Geosyncline, and although they all offered some helpr none ulas prepared
to drill deep holes for pure tesearch purposeso
L.2 Geoloov of the Adelaide Geosvncline
I,2.L GeQe_ral_ qegLogJ
The name rAdelaide GeosynclÍne' uas given by Sprigg (fSSZ) to
an a¡ea of fold rnountai.ns ulhich consist predominantly of sedÍments of
Upper Proterozoic age and to a lesser extent of sediments of Cambrian age.
Figure 1.2 shours ùhe general geology of the Adelaide Geosyncline.

-5-
The mountains include the lUillouran Ranges in the north-uestr the
Flinders Ranges in the north and centnal areasr the 0J-ary Ranges in
the east near the tUillyama Blocke and the tYlt. Lofty Ranges in the south
ol the geosyncline. fYìost of the exposure has lour rel-ief uith gently
undulating hills rarely exceedÍng 200 m above sea level. The highesù
peaks reaoh ?00 m in the Northern Flinders Ranges and the l\lt. Lofty Ranges.
The geology of the area has been discussed by Thomson (fsZo) and
Parkfn (fSOS) uho have also summarised the urork by previous authors.
The Adalaide Geosyncline forms a north/south belt of relatively unaltered
sediments, fÌanked by blocks of older crystalline and metasedimentary
strata of the Gauler Platform in the urest and the ÌUíllyama Block ín the
east. The older st¡ata are of Louler ProterozoÍc and Archaean ager and
consist of granite gneisses, granulÍtes and metasediments, together urith
acid intrusives and extrusives of considerable size. Small inliers of
this material occur in the north, in the [Ylt. Painùer Block, and in the
Bouth, in the ffit. Lofty Ranges. The Gauler Range Volcanics have been
daüed by Compston et al-. (fsOO) at 1535 J 25 m.y., and this is thought
to indicate the youngest major tectonic event on the Gaurler Platform
(Thomsonr op. cit.).
The name 'Adelaidean'has been given to the time interval in uhich
rAdelaide Systemr strata, the main material in the Adelaíde Geosyncline,
uere deposÍted. Adelaidean time extends from the base of the Camb¡ian
at about 560 m.y., back to approximately 1400 m,y. (Parktn' 1969, p.49).
Sadimantation continued at least until tYliddle Cambrian time uhen the
Adelalde Geosyncline underuent orogenesis and mild metamorphÍsm uJhich
continued until early 0rdovician time. The youngesù reliabLe date for
the orogenic event is 473 m.y. for the Anabama Gnaniter uhich intrudes

-6-
sediments of Adelaidean age south-east of the lJlillyama Block.
i-2.2 Strat-ig.¡capbI
The stratigraphy of Adelaidean and Cambrian aged sediments
has been discussed by Parkin (fg6g, Chapters 2,and 3). The most recent
stratigraphic subdivision urhich ís nou in common usaqe is that proposed
by Thomson et aI. (1964), and lat'er slightly modified by Thomson (fg00)
and Fo¡bes (fsZf). Figure I,? summarises time and rock terms used in
the Adelaide Geosyncline and adJoining areas. Further details of the
stratigraphy are discussed in Chapters 3 and 4.
The total stratignaphic thickness of Adelaide System sediments in
the Adelaide Geosyncline is believed to be about 2O kn (Parkin,
1969, page S1). The sediments are mainly shallou urater marine detrital
strata except for one volcanic bed (the lUooltana Volcanics) urhich occurs
locally around the tYlt. Painter Block. DomÍnant rock types are cLean
ulashed sandstones (quartzites)¡ red, gnsen and grey shales, and sil-tstones
and carbonates. Tuo titlitíc formations aDe recognized in the sectiont
the Sturt Tillite being of uridespread distribution and occasionally
containing ironstone horizons and the Yeralina Subgroup being of local
disùribution. The total stratigraphic thickness ol Cambrian sediments
exceeds 15 km in the south of the geosyncline. Hou¡everr in the north
it is much less. Cambrian strata are knouln to underlie other Palaeo-
zoic and fYlesozoic strata in the sedimentary basíns flanking the geosyn-
cLine (fig. L.2), The lithology of Cambrian sùrata is similar to that
of Adelaidean strata and uilI not be discussed in the thesÍs.
One problem in mapping in areas of stratigraphic changes in P¡e-
cambrÍan sediments is the inherent lack of fossils and the consequent

-7-
lack of satisfactory time lines" In the Ade1aíde Geosynclinet time
significance is associated uith ubiquitous formations" Fon example,
the sturt Tillite consistently underlies, and the Nuccaleena Dolomite
overlies r the Farina and Yerafine SubgrouPs in urhich facies changee are
recognized. Daily (fSOf) pointed out the general lack of recognized
fossils in the Precambrian eection; until dates are applied the markers
should strictly be considered @ rather than stra tioraohic
markers. The application of the term tstratigcaphÍc mankers' as used by
the South Australian Department of lYlines (SnOm) is used in the thesis'
r.2.3 Ioneous intrusions in the Adelaid e Geosvncline
Igneous actÍvíty u¡as not common in the area during deposition
of the Adelaide SYstem sediments.
The lUooltana Vofcanics u,hich lie near the base of the Adelaidean
succession are knouln only locally anound the Mt. Painte¡ Block' These
may be equivalent in age to the Roopena volcanics ulhich outcrop in an
area of about I0 sq km on the uest side of the Ftinders Ranges, although
neither stratigraphic nor radiometric evidence has proved it. unfess
some of the sediments in the 20 km or so of Adelaidean succession ars
Unrecognized lavas or tuffs, the tlJooltana Volcanics are the only Undoubted
igneous material of Adelaidean age.
EXtrUsÍve igneous rocks occun at the base of the Cambrian succession'
These are the basic Truro vol-canics on the east side of the fflt. Lofty
Rangee¡ they outcDop over an area of about 10 sq km and are up to
600 m thick. The lavas 1ie unconformably on Adelaidean straÈa uhich
uJBrB pDeviously gently folded and eroded. The extent of the volcanics
bo the east under Palaeozoie and younger sedimente of the Murray Basin is
unknoujn.

-8-
Exccpt for the south of the geosyncline, east of Adelaidet geolo-
gical maps published by the SADÍYì shou feru large Ígneous bodies emplaced
in Adelaide System or younger sediments.
The largest intrusive knoun in the ulhole area is the Anabama
Granite, 40 km to the south-urest of the lllillyama Block. This granite
body is recognized in the field as a number of outcrops of the order of
2 km across on the southern limb of an anticline of Adelaidean sedlmenta.
The exposed granites lie urithin an area 50 km long by about 15 km ulde'
lylirams (fgef) suggested that the individual outcnops coalesced at depth
into a batholith. East of Adelaide, in the area of strongest metarnorphism
of the geosynclinal deposits (Fig . I.2), numerous smalf pegmatite dykes
or granites some 0.5-5 km in length aD€ knouJn' Some of these uere
emplaced in Adelaide System sediments but most are ruithin Cambrian aged
strata.
In the central and northern parts of the geosyncliner uJhich are of
most intenest Ín the thesis, intrusives are usually very small and a¡e
often associated uith aleas of dÍapiric breccia (Dalgarno & Johnson, 1965).
Basic rocks, chÍefly doleritese are fnequentj-y found in the breccia
(Coats, l-964). Usually the basics are dykes a feu metres long or small
plugs; these uere intruded during and aft,er emplacement of the breccia"
Tuo areas of diorites are knoun. In the southern part of the
Paratoo Diapir, diorites up to 2 sq km in area intrude diapiric
breccia and the enclosing Adelaidean formations over an area of about
l0 sq km. The contact relationships of the Paratoo dioriües have been
discussed by Binks (fgZf) . 45 km to the south of Paratoo, diorites
are recognized near Bendigo Homesùead (tlinamsr 1964). The contact
relationships of these are not knourn, but the SADfYl is drillinq in fhe

-9-
area and more should be knou¡n before long'
r.2.4 Struct e and metamo rnhism
The form of the Adelaide Geosyncline as considered by Thomson
(fgZO) is shouln on Figure I.8. Thomsonrs map uas compiled from geologi-
cal and magnetic interpretations and shotls basement form Iines and
important structural features for the area '
The orogeny uhich terminated Cambrian sedimentation in the Adelaide
Geosyncline produced most of the present structure of the area. This
event has been discussed by Parkd.n (fSOS, Chapters 2 arid 3) a¡ì¿
flfflen and Fleming (ISOA) uho have also summarised earlier ruonk'
There is a range of intensiùy of deformatíon and metamorphism
urithin the Adelaide Geosyncline (fig. I.2). Deformation is strongest
in the glary Ranges and extends south into the northern fflt. Lofty Ranges.
Fotds ane linear and ancuate. Biotite grade of metamorphism is attained
and slaty cleavage is common (Preiss; Off1er & Flemingr oP¡ cit.;
Binks, 197I). This area conresponds to the area of strongly magnetÍc
sedímento uhich is discussed later. To the north-uest, in the Central
Flinders Ranges, folds are less intense and commonly form open domes and
basins. Dips ane usuaLly less than 45o and slaty cleavage is absent.
In this aDea magnetism of sediments is ueak. In the Northern Flindors
Ranges deformation is strong and once again sediments are often strongly
magnetic. tUhile, to be sürictly correct, the strata of Adelaidean
age should be referred to as rmetasediments t, in the literature on tho
Adelaide Geosyncline they are called fsedÍmentsr, and this latter termi-
nology is used in the thesie.

-10-
1.3 Framouonk of the oeoohys ical Þroblems s tudied
Afeatureofspecialinterestisthatthegreatthickneseof
etrongly folded Adelaidean sediments contains very feur uolcanÍcs'
In the Adelaide Geosyncline volcanics are only locally recognized near
the base of the succeesion; these are conformable uith the sediments
and their total thickness does not exceed 2 kn. HouJever, although only
one volcanic bed is knoujn, the Adelaidean sLrata aDe magnetic and the
contour maps indicate that linear magnetic anomalies closely follou the
geological layering (Tipper & Finney, 1966) at several levels in the
stratigraphic succession. Figure I.4 shouls some of the magnetic
fsatures important to the thesis and in particular indicates the uide-
spread e¡xtent of linear anomalies associated ulith Adelaídean strata'
In addition to the linear magnetic anomalies attributable to
sedim€nts,thereareverybroadanomaliesuhichappealtocomefrom
veny deep sources possibly belou¡ the Adelaidean sediments. These are
most prominent in areas ulhere the magnetic effect of sediments is ueak,
but even uhere the sediments are strongly magnetic' superimposed broad
anomalies are eviclent. B1YIR reporters, Tipper and Finney (fS00)' Young
and Gerdes (fSOO), and fllilsom (fSOS), have stated that most of the broad
anomalies come from deep urithin or belou the Adelaidean strata and have
estimated depths to basement for the Adelaide Geosyncline' Their ulork
has been confined to aDeas u.rhere sediments are only rueakly magnebic'
It is necessary to consider the strongly frragnetic sediments in detail to
establish uhether it is a valid procedune to interpret bnoad magnetic
anomalies in these areas for depths to bassment'
Another feature of interest in the Adelaide Geosyneline is that
Very feUJ igneous intrUsive bodies more than a feul metres across ate

-Ll -
reoognized, Houlever, the magnetic and gravity maps shou nrany nearly
circufar anomalies uhich might be caused by unrecognized intrusive sourcBs
close to the surface, Tipper and Finney (rgoo) and Bennett (rs0a) stated
that the magnetic anomalies attributabLe to intrusives may also indicate
the presence of unrecognized or buried diapiric structures ín ühe arBa'
Small intrusive dolerites and other basics are recognized in most of the
diapÍrs in the Adelaide Geosyncline (Oa1garno & Johnsont 1965; Coats'
;;g6q). As yet no one has published confirmatory evidence that the smal1
circularanomaliesarecausedbyeitherdiapirsorintrusives.
ulhile geological and aeromagnetíc studies have contrÍbuted to the
understanding of the shape and depth to basement of the Adelaide Geosyn-
cline, the gravity data have not yet been fu1ly assessed to flnd ulhether
a useful contrÍbution can be made to the problem. Figure 1.3 shou¡s the
Bouguer gravity contour map and the geology for the area of most importance
to the thesis. The most prominent anomalies are lot¡s. In the east the
Iouls are associated ulith granites. In the uest the tu¡o prominent lous
are elongate featunes Lying approximatety along tongitude ISBo' These
have an unknouln soL¡rce but appear to be due to very deep density conttasts.
Regíonal geophysical maps can be oxpected to delineate the 1ar9e-
scale features of an area and BtylR reporters, inclUding the authorr have
done this for most of the Adelaide Geosyncline' Therefore it is nou¡ of
special importance to uork in d.etail over some of the best defined
aûomalies in the area to find ulhat they mean and to shoul hot¡ much can
be derj.ved from the regional geophysical data. To do this has been the
main Puxpose of the thesis research'

-L2-
Three specific problems are discussed in the ühesie' These are¡
I Do the linear magnetic anomalies over Adolaide System sediments
indicate the presence of conformable magnetio beds, and urhat
special characteristics of the bede can be revealed by magnetic
interpretation?
a
2. Can anomalies be selected from the aenomaqnetics urhich are
Iikely to be caused by unrocognized or UnexPosed lntrusive
bodfes in ateas of Adalaide Systen sediments?
5. t[hat interpretation oan be made for the Bouguer gravity lours
on the east side of the AdetaÍde Geosynclina?
I
I
l
I

-r3-
Chapter 2
SCOPE OF THE THES]S
2.I Scope
The scope of geophysical studies of geological problems can be
extremely ulide. For example, if it is knoun that a rock body is magnetict
then magnetic anomalies can be interpreted to give infonmation on the
bodyrs shape, size, depth and magnetization. If suitable roÞk samPles
are available then magnetic properties can be directly measured. lYlagnetic
minerals causing the rockrs magnetism can be identified and the special
details of the rock mineralogy and petnogcaphy can be revealed by micro-
scopic ulork. There is scope for sevenal yearsrulork on a single
magnetic body.
For t,he thesís research it ulas decided that' the maÍn emphasis
should be placed on a preliminary investigation of magnetic and gravity
anomalies in a lange area rather than on the dotailed analysis of one or
tuo special problems Ín a small area. llJhile the latter approach u¡ould
have been possible, it uas considered that for the area studied, the
former approach uould have the advantage of providing rleul information of
urida appeal to geologj-sts, and furthermore, rlould J-ay the grounduork for
more detailed geophysical investigations in the future.
After 18 months t uork Ít ulas considersd that one particular sedi-
mentary formation (tne taptey Hill Formation) uas of special interest
because it contains a magnetic zone urhich can be traced for hundreds of
kilometres along strike. It uas considered that a study of fresh and
magneticatly ueathered rock could provide information of application to
othen magnetic problems in the area. ThUs at that stage of the u,ork,

-L4-
the research nearly became orÍented to the lines of palaeomagnetic
research. The pnoblem ulas to get magnetically fresh rock samples from
a deeply uleathe¡ed fo¡matÍon. Because suitabl-e material tuas unavailable
and an appeal for neul drill holes met ulith limited success, this lino of
research ulas abandoned. Information on the magnetic properties of the
formation u¡as obtained from the rnagnotic anomalies.
lllhen the author left the BIYIR to undertake Ph.D. research, it tuas
agreed that uhen the BÍYIR completed Íts regional helicopter gravity survey
of the Adelaide Geosyncline, he uould have the first opportunity of
intenpreting the data. It r.!ae agreed that if the offer uas accepted,
then the author u¡ould urite an interpretativo report for the BlllR. The
neport uas rlritten. It is currently being edited by the BMR and urill
shortly appear in the unpublished rRecond Seríes' (under joint authors,
Tucker & Brouln) and ulill late¡ be published in the rReport Seriesr.
0n1y part of the rLrork included in the'Recondris presented in the thesis.
lllhelever possible the author made use of the University of Adelaiders
CDC 6400 computer to assist urith interpretations. A list of the prograrns
and their functions is included as Appendix 45. AIl programs r utith the
exception of one to find the gravity or magnetic anomaly due to a body of
arbitrary shape, uere uritten by the author. No neu special interpre-
tative technique uas devised because it appeared that there uas a
suffÍcient f¡ameurork of techniques available uithin published literature.
2.2 The data studied
Figure 2.1 shorus an index map to I:2501000 sheets of eastern South
Australia. Each sheet is I.50 longitude uider and Io latitude high.
In ühe thesis, I:250r000 sheets are refeped to in capítal letters;
place nantes are leferred to in louler case. The figure also shous the

-15-
localities of ground magnetometer su¡veys and drÍtI holes from ulhich
material rlas tested for maqnatic susceptibiJ'ity or density' Drill
holes are listed in Appendix A1; ground maqnetometer trave¡ses are
Iisted in Appendix 43.
Published and unpublished SADfYl geotogical, ael'omagnetic and
Bouguer gravity maps (? km grid) for tho area shoun on Fiquîe 2.I ulere
studied in the course of the research. fTìost of these maps are at a
scale of 1:250r000. The sADIYl 1t471520 geological maps uere used durÍng
detailed ulork on 0RR0R00.
The flight charts for 0RR0R00 uene
âreËr¡ and for mosù of the area shouln on
uere flotun on east/west lines, one mile
ground clsarance of 500 feet (150 m).
the SADtYl from the flight strip film and
examined in detail. For this
Figure 2.1, aeromagnetic surveYs
apart (I.6 km) at a continuous
Flight paths uJere Decovered bY
1:63r360 photo mosaics.
2,3 Maqn etic data
The 0RR0R00 sheet ulas chosen fon detailed study of the magnetícs,
urhere geological mapping by the SADp (Binksr 1968) ruas of an exceptionally
high standard, and ulhere the most recent lou-IeveÌ aeromagnetic survey
had been conductedr arìd the contoul map clearly shotls many of the sedi-
mentary fo¡mations are magnetíc. Binks' map of 0RR0R00 and the SADtrl
total field aeromagnetic contour map are in the pocket at the back of
the thesis (figs. 1.5 & 1.6).
0ther parts of the Adelaide Geosyncline are less ueII suited fon
detaíIed study, because either the availabte geo109y maps or aaDomagnetic
data are not of as high a quality as for 0RR0R00. For example' on
BURRA (mirams, Lg64) the geology map is extremely generalized and needs

-16-
eeveral changes in the naming and subdivision of formations. In addition
the aeromagnetic contour map of the area is contoured at 50 gammas and
shous little detail of any but the most strongly magnetic straùa. 0n
pARACHILNn (Da1garno & Johnsonr 1966), the geology map is cf high
quallty but the sediments are only ueakly magnetic. 0n COPLEY, although
an exceptionally high quality unpublished SADM geoloqical map is availabLe
and the sediments a¡e magnetic, the flight line direction is very often
parallel to strike.
The authorrs method of investigation uas to carry out a line by line
study of the aeromagnetic flight charts and then examine particularly
Ínteresting features uith a ground magnetometer. Clearly to follout up
all ae¡omagnetic anomalies r¡ith a ground magnetometer ulould be an
enormous task and this ulas not attempted. Rather, a suite of represen-
tative featunes u¡as follou:ed up. It uas considered that a study of the
most strongly magneti-c features uould reveal data applicable üo the less
ruell defined u¡eakly magnetic featuros. Trial field surveys uhero âEro-
magnetic anomalies are uloak (e.g. 50 gammas or less), u.lele disappointing
because good anomalies for detailed interpreùation uere seldom found.
Although most ground ulork u,as on 0RR0R00, surveys uere also conducted
at localitiee as far south as BARKER and as far north as C0PLEY ' It
ulas considered necessary to do this to be sure that the particular
magnetic beds identifíed on 0RR0R00 urere not just confined t'o that area.
A 1imitation to the magnetic interpretatíon utas imposed by the lack
of suitable drill core for the measurement of rock properties. Thus
as yet, varíous models proposed to aecount for magnetic anomalies ale
untested by drilling. Because of the problem of obtaining fresh rockt

17-
littlem.ineragraphicandnopalaeomagnetic¡lorkulascarriedout.It
ruas considered that little could be learnt untÍI suitable drill core
is avaílabte for studY '
2.4 Gravi tv data
untike aeromagnetic data uhich shou great detail along flight lines'
regional gravity data have littIe debait over small-scale structures '
It ís a far coarser geophysícal tool- than aeromagnetics' As a result'
the minimum size o1 features ulhich can bo studied uithout cesort to
detailed ground r¡ork is lar9e, uith dimensions being approximately four
times the grid spacing. At the outset of the research it uras decided
that no detailed gravity surveys uould be carried out ' This uae mainly
because the university of Adelaide does not oun a gravirneter, but' also
because the uork uould have taken too 1ong. In accordance ulith this,
the place of the regional- Bouguer gravity interpretation in the thesis is
to provide information on large-scale features'
The area chosen for discussíon is centred on the 0RR0R00 sheet and
includes a total of 15 surrounding sheets (rig. I.3). Houever, discussion
is mainly timited to the areas of Adelaidean outorop east of longitude I38o
because other students are r¡orking tlest of this line' lljhÍIe the author
could have confined study to the magnetics alone, it ulas considered bene-
ficial to uork concurrently on the magnetics and gravity because this
ulould aLlour as u:Íde a range of information as possibLe to be available
forfutureuorkers.Inadditiongacombinedstudyoftenreveals
features uhich, ulith one method alone, might 9o unnoticed'
The major limitation to the gravity work (apart from the station
spacing) uas the problem of densities. This aluays confronts gravit'y

I8
interpretere and is not easily overcome ulithout extensive u¡ork' This
is particularly so urhele density cont'rasts betureen rock units of interest
are lou.l. The probJ-em of obtaining representative rock densities for
VaTioUs Units became more appa¡ent as the tuork proceeded; as mantioned
earlier, there is little drill core available" Tn additÍon'most of it
comes from geoJ-ogically disturbed areas" UJhiLe reasonable lengths uere
taken to obtain densities representative of various ¡ock units' the
IlBsults are Largely disappointing. The ¡esults sGìvG to ilLustrate
just horu much uork is necessary to obtain adequate density data" In
accotdance uith this problem, the densÍty contrasts necessary to eXplain
the variogs anomalies discussed Ín the thesis, a¡e sometimes assumed"
2 . 5 J,p_p-e-q-'d,,r^q-c_s_
Appendices of ca'ba important to the thesis a¡e incfuded in volume 2"
BuJ-ky materiaL, fol example the grouncl magnetometel profliles, has been
ornitted. tYlagneLic suscepLibilities are presented in drill log or histo-
gram form rather Lhan as tabies, Listings ofl computer programs have
been omitted" A dossier of ground magnetometer profiles, and computer
listings are held in the Department of Economic Geology, universit'y of
Adelaide.
one appencix çives cjetails of the authorrs use o1 the magnetic
method in the interpreLation of anomalies due to dipping tabular bodies
of infinite stril<e length and depth extent. Uhile this information ís
essentially a reiteration of published material, it is incLuded because
several colleagues indicate¡l it' uoul-d be of interest to them to have
debails of methods especially applicable to the thesis atea.
Appendix A? contains ccmments uhich clarify points raised during
examination of the thesis.

-19-
2.6 Plgeentatiorl
The Ínterpretative ulork Ín the thesis is presented in th¡ee parts.
part A deals u.rith the magnetic response of Adelaidean sediments. Part B
discusses the magnetic anomalies like1y to be caused by other sources.
Part C deals utith interpretation of the Bouguer gravity fie]d.
ll¡herever possible, maps in the thesis have been kept to the minimum
practical size, and conform to metric scales currently in use in
Australia. The presentation of geophysícal data in juxtaposÍtion r¡ith
geological- data is a major problem. For the thesÍst maps have been
símplífiad and generalized as rnuch as possible ulithout losing ímportant
detalls. In soma cases oVerlays have been Used. 0verlays used Ìn the
figures uere sometimes drauln from maps on a dífferent projection from
the base diagrams. They have been photographically adjusted to confotm
as closely as Poseibl-e uith tlre base dÍagrams.

PART A
lÏagnetic anomalie-s caused by Adelaide system sediinents
¡l
-20
Chapter 3
AEROMAGNET]C STUDY OF ORROROO
3.1 Intro lon
Línear magnetic anomalies have been observed over metamorphosed
sedimentary strata in many parts of the ulortd. Sometimes the anomalies
ar€ caused by beds of ironstone or iron formations and the aeromagnetic
or ground magnetic methods are used in an initial discovery role or to
map eXtensions of knouln mineralization" Good examples of magnetic iron
formatÍons aDe those of the Lake superior district (Bath, I96?i Leneyt
1966). Volcanics are commonly magnetic and produce prominent linear
magnetic anomalies uhen interlayered u:ith sediments. Houever, quite
often slates and shales are magnetic and produce prominent linear mag-
netic anomaliesr 8.9. in the lllitulatersrand area (Roux, 1-96? ) and Nova
Scotia (mcCrath, 19?0).
A vast qua.ntity of aerornagnetic data has been collected in Australia
by goVernment agencies and it is cfear that Precambrian strata ale some-
times magnetic, and that anomalies often follot¡ geological layering'
Some of the Adelaide Syetem sediments in the Adelaide Geosyncline are
magnetic (tipper & Finney,1966), and there is almost a compJ-ete absence
of volcanics, although some ironstones are knouln. Upper and Lor¡ler
proterozoic strata on the north side of the Amadeus Basin are often
closely folloued by aeromagnetic anomalies (Young & Shelleyr 1966).
Shelley (fSOS) suggested that linear anomalies in the DaIy River atea
are caused either by volcanics or the sedimentary strata rlith r¡hich they
interlayer. Dockery and Tipper (fSOS) reported that some of the
Protsrozoic metasediments in the tYlount Isa area are magnetic'
tI,
rì'
I
t
¡
)
I
I
('
þ
The primary purpose off the regionaì- aeromagnetic surveys in Aust'¡alia

-2L-I
Þr
has so far been to delineate sedimentary basins and there is little
published information on the Precambrian shield areas.
The interpretation of ground magnetometer survays appeaDs to be at
a simirar state to the airborne urork. From the limited published material
it appears that beyond a mappinq role, the magnetic interpretation has
usually been dropped at an early staqe'
In Australia no detailed line by line anafysis of aelomaqnetic fliqht
charts over magnetic sediments has been published and it is unlikely that
such an analysis has been attempted for a large arsa. one reason for
this is that a great deal of tÍme is required. Another i's that feur
suitable areas in Australia have detailed geological maps avail-able¡ and
therefore t,he conclusions to be draun from a detailed study of the aero-
magnetics are linlited. Hou¡ever, uhete geoloqical information is sca¡ce
the aeromagnetics may be the only data available and can be used to give
a vepy generalized outlÍne of important features of the geology' There-
fore it is important that eventually at1 aeromagnetic data for Australia
should be studied.
To fill in the gap in the knouledge of the magnetic response of
Adetaide System sediments¡ the authon studied an area ulhere both detailed
geological maps and high quality aeromaqnetic data are available ' The
area is the 0RR0R00 I;2501000 map sheet in South Ausùralia uhich covers
steeply cJipping strata of Adelaidean aqe. 0RR0R0tl is particularly
interesting because in one part bhere are numerous strong linear anomalies
(e.g.100 gammas or mone) from shallou sources, rlhile in the other there
are only a feu ueak Linear anomalies" lYloreover, the geological mapping
by Binks (rgee) shours that st,ratigraphic changes and a change in meta-
,l
{
I
I
I
:
I

-22-
morphic grade occurs betueen the strong and ueak magnetic response
parts of the sheet (einXsr 19?1) "
Tipper and Finney (fSOO), in an unpublished BIYIR repont, briefly
discussed the aeromagnetic data for 0RR0R00 and PARACHILNA and concluded
that there are at, Ieast three strongly maqnetic sedimentary units, the
Holouilena Ironstone, the Tindelpina shale Member and the llJilpena Group'
They noted that nume¡.ous uleak anomalies occur uhich are usually difficUlt
to trace betureen flight lines.
0n close analysis it uas found that the rL-re¿rk anomalíes can be traced
betueen flight lines and that these, like the strong anomalies, usually
fall over particular fonmations. In this chapter the results are
presented for the detaj-Led study of the 0RR0R00 fJ-ight charts' Linear
magnetic anomalies are correlated grith mapped Adelaide System sedÍmentary
strata and the positions of the main maqnetic beds in the stnatigraphic
cofumn are established. Broacl magnetic anomalies, possibly due to a
deep magnetic basement bel-oul the Adelaidean strata, are not discussed in
this chapter.
3.2 Recordi no detaiLs of the 0RR0R00 aeromaonefic SUfVEV
The 0RR0R00 total field aer,omagnetic survey uras floun utith an msF-3
fluxgate magnetometer in a stinger instatlation in a DC-S aircraft'
tYlagnetic data ulere recorded ulith a chart recorder ulhich had a full-scale
deflection of 500 gammas (50 gammas/inch). Horízontal scale on the
charts uasapproximately 1:50r000 and ruasdependent on the aircraft speed"
The flight path u,as recolded ulith 35 mm strip film and u'as recovered by
the sADfï by plotting every tenth photo centre on 1:631560 scale photo
mosaics; the plotted centres ulenelocated about 0.6 km apart' subsequent

-23-
to this the path ulas also plotted by the sADffì on Lz47 r52O base maps
ulhich are 0'5o of lonqitude uide and 0'250 of latitude high' These are
referred to hereafter as fliqht path maps '
The altitude of the aircnaft uas nominally 150 m above ground level'
flight lines ran east,/utest, and ulere spaced nominally at l mile (1'6 km)'
Because the survey uas not specifically designed to obtain high resolution
data, the altitude uas not closely control-Ied and variations betu¡oen 100 m
and 300 m uere common " tYlost of the hills in the 0RR0R00 area axB gently
rounded urith peaks less than I00 m above the lor¡lands' Houever, in the
far ulest of the area the topography is rugged and slopes of 30o reaching
200 m ane not uncommon and here the altitude varied significantly from
I50 m.
3.3 Topoqraphic-effects and flvlnc noise
To establish the louer limit of detectabiliùy of anomalies caused by
susceptibility contrasts ulithin near surface material, it is importanü to
consider topographic effects and the pseudo-anomalies resulting from them'
The problem has been considered flor ground ulork by Gupta and Fitz-
patrick (fSZf) ruho shoued that strong anomalies can be produced actoss
cliffs in magnetic material, 8.9. â gfound traverse across a 7'5 m cliff
in material uith magnetic susceptibi¡.ty k = 21000 x 10-6 orQos' units
gives an asymmetric* anomaly of about I SOO gammas. Even quite lout
susceptibility material urilt produce significant ground anomalies; for
the case above? ifl k = 50 x 10-6 c.Qrsr uníts, amplitUde = J 7.5 gammas"
In the thesÍs magnetic anomalies ulhich consist of tulo associatedpeaks ulil1 be reFe¡red to as rasymmetric anomaliesr. Thus an
äsymmetric anomaly has a positive peak and an associated negativepeak,
t(

-24-
Susceptibility data (Appendix A2) indícate that the background
susceptibility of Adelaidean rocks in the 0RR0R00 area is probably less
than I00 x 10-6 crQrs. units. Small topographic features lÍke the cliff
discussed above uill have a nagligible effect at an aLtitude of 150 m'
Houever, large hiIls can be expected to produce significant anomalies on
aeromagnetic charts even for ueakly magnetic rocks. The theoretical
anomalies produced by several idealized st,ructutes are indicated on Table 3.1.
Table 3.1
fflagnetic anomalies produced by topography
lf Anomalies calculated for features of infinite length and triangulancross section uith a base r:ridth of 550 m and suscãptibllity 100 x t0-6c. Qo 9. ur,¡its .
Tab1e S.L shours that an aircraft passing 50 m above a north/south ridqe
100 m hÍgh and 550 m tuide at the base, can record a total- field anomaly in
excess of I0 gammas if the rock has susceptibility I00 x 10-6 c.Çrs. units'
This is an extreme case because usually the a.ircraft gains altitude
before reaching a steep hill to avoid dangerous aír cunrents and avoid
stallÍng. In the 0RR0R00 aeromagnetic survey, high hi[s ulere usually
cleared by at least I50 m. Thus the maximum anomaly amplitude expected
Gnound Feature Heí9htAircraft Altitude
above Base ofFeature (m)
Amplitudemax-min( gammas )
HaIf -tuidth(')
Long North,/South Ridge*
It
n
50
50
I00
L00
I50
2s0
150
259
4.0
1.9
10.6
415
2AQ
360
220
320

-25-
|s less than 5 gammas if the susceptibility is I00 x 10-6 c'$os' Uhits'
In the u¡estern part of 0RR0R[J0 in aroas of steep topographyr anomalj-es
possibly attribUtable to topographic effects are usually less than
2 gammas in amplitude. This indicates that the backgcound susceptibility
may be less ühan S0 x 10-6 c.Ç.s. units. In the eastern pant of 0RR0R00
uhere the magnetic response of' gome sediments is strong, it Ís probable
thaù the background susceptibility is less than I00 x ]0-6 cog'e' Uñits'
0ver the entire survey a¡ea the flight charts shou a ripple ulith an
envelope of up l,o ! 2 gammas rlhich can probably be attributed to variations
in aircraft headÍng, and electrical noise of equipment on board. The
ripple usually has a sharp leading or trailing edge and half-uidth of
lees than 500 m.
For this chapter the louler limit for the detection of genuine
anomalies (i.e. caused by susceptibility contrasts at or belou.r gnound
levet) is taken as f 5 gammas above background'
3.4 Melhod of st-udv andiosÍtionÚo of sources
A1l anomalies greater than 2 gammas in amplitude and urith half-uridths
or slopes indicatiVe of eoUrges close to the sqrface ulere selected from
the aeromagnetic data. Figure 3.1 illustrates hou the data ulere inter-
preted. A regional level u¡as drauln along each flight profilet and the
peak amplitudes and positions of anomalies above or beloul this uere
noted. Figure 3.I(a) Íllustrates the interpretation procedure and
Figure 3.1(b) shonrs hom, if the tnue base level for the profile ie
unknou,nr an erroneous interpretation may be made"
The positions of peaks of anomalies on t'he flight charts ulere
plotted on I; 4?,520 base maps urhich overlay the SADtTl f light' path maps

-26-
(see Fig. 3.1(c))" For nearly symmetrical anomalies a small a¡nou,
indicating the sign and the amplitude uras ma¡ked at the interpreted
position of each source. Asymmetric anomalies uere indicated by tu:o
arrouJs connecùed ruíth a dashed line to indioate the relationship betueen
the positíve and negative peaks. From thÍs the approxÍmate source
positions rilere located. Anomalies uíth the characteristic shape due to
sou¡ces ulith limited depth extent urere indicated on the maps. Anomalies
panticularly suited to ùhe calculation of a source depth uere given a
special symbol (".g. double or triple shafted arrour on Fig.3.1(c)).
Estimation of the position of a magnetic source from its cocrespondinq
magnetic anomaly is subject to error. Gross errors occur if anomalies
Ín t¡e magnetomet'er chart are interpreted as tulo minÍma (corresponding to
tuo separated bodies) ruhen they should be interpreted as a -single maximum
(corresponding t,o a single body), or vice versa (fig. 3.1(b)). A feu¡
cases of this kind were observed and uere picked up by the fact that the
tulo different interpretations uere sometimes made on adjacent lines.
ìllhere observed, the data ulere reinterpreted to give consistency on
adjacent lines. The accuracy of an interpreter's geographie positioning
of magnetic sources flrom magnetometen charts is usually in the range
j SO ,n for uell defined anomalies and up to j tSO rn or more for partly
resolved oD asymmetric anomalies.
Because rbroadr anomal-ies caused either by deep or Very b¡oad
magnetic bodies are not discussed in this chapter, no qualification
(u.g. narrou, or sharp) is needed in the follotuing discussion. The top
surface of all magnetic bodies discussed lies uithin 300 m of the ground
surface.

Thebasemapsofmagnetiosourcepositionsu¡ereoverlalnonthe
SADfrl].z4T,S2ogeologybasesheetsr¡hichujerecomPiledbythesADtY|during
mapping of the 0RR0R00 area'
3.5 Inte roretation of the maqne tometen data
Figures.2shouJsanoverlayofthepositionsofshalloulmagnetic
sources on a generalized geology map of 0RRÛR00; each source has a
number cotresponding to the amplitude of response' Table 3'2 shouJs the
amplÍtuderangescorlesPondingtothenumbersandhoumanyanomalieslie
in each range.
Table 3.2
AmplitudeNumber
Amplitude Range( gammas )
No. ofAnomalies
DescriptiveTerm
I2
3
4
5-20
2 1-100
101-400
401+
1965
479
187
25
u¡eak
medium
strong
fïìost anomalies are uieak and theee are fairly evenly distributed over
thearea.About'one-thirdofallanomaliesareinthemediumandstrong
amplituderanges,andmostoftheseareoonfinedtothesouth-eastpart
of 0RR0R00.
There is a marked correlation of the linear trend of magnetic
anomaLies ulith the trends of sedimentary bedding over the uhole ampli-
tude range of anomalies considereO (S to 1t500 gammas)' In general'
thene is continuity of magnetic souroes betu¡een adjacent flight lines
ulhere the fliqht lines both cross the same sedimentary formation'
Houever, some anomalies are not assocÍated ulith the sediments and are

-28-
Êaused by other eources (discussed in chapter 6). In this chapter
only anomalies correlatable uith Adelaidean sediments are diseussed"
3.5.1 Character of an omalies and sources for Adelaidean sediments
To itlustrate the character of the total field magnetic anomalies
over the Adelaide System sediments ttuo adjacent flight charts are lepro-
duced on Figure 3.3 above the corresponding geologÍcal- sections'
AnomaLios aDe recopded over the same formations on both limbs of the
synclinesbuttheiramp}itudeSareusuallyunequalandsomeareof
negative sign. These are common leatures oveI' the uhole 0RR0R00 sheet
and ane probably due to the combined effects of variations in souroe
dímensions, depth of uleathering, magnetíc mineral content and remanent
magnetization. A¡'lomalies over notth/south striking strata are often
symmetrical in shape and therefore are particularly simple to interpret
for source position, dimensions and depth. Many of the anomalies a¡e of
the partly resolved kind (see Fig.3.3)r and it is often difficult to
distinguish betueen the case of tulo or more magnetic sources separated
by ueakly magnetic material, and conceni;rations of magnetic material in a
broad magnetic zone" The key to clistinguishing these tuo distinctly
different phenomena often comes from a profÍIe further aJ-ong strike
uhere anomalies are better resolved'
The sources ofl the linear magnetic anomalies oveD Adelaidean sedi-
ments are steeply dipping tabular bodies of considerable strike length
and depth extent, and are approximately conformablo ruith seclimentary
layeríng.
This is suPPorted bY:
I.Thelinearcontinuityofanomaliesatcor¡espondingstratigraphic positions on adjacant flight lines'

-29-
2.Thecocresponc,lenceofanomalyshapesuithùhetheoretical
shapesexpectedoverinfinitetabularbodies.Anomalies
rlith shape attributable to bodies of limíted depth extent
â1ê fã18.
Intenpretation of some of the best resolved aeromagnetic anomalies
using the methods of Guy (1963), Koulomzine et al. (rezo) and othars,
indicateJ that the apical r.uidth of the tabular bodies is usually less
than 300 m. This uras confirmed by ground studies (chapten 4). This
estimate puts an uppeD limit on the thickness of the bodies because as
dips become veDy steep the thickness approaches the apical ulidth' Depth
estimaLes to the top surface of sources usually do not exceed 200 m
belou ground level.
Becau-se the tabular bodies correlate closely uith the stratigraphyt
theycanbecalledqag.[ç.ticbedqandthisterminologyurillbeadheredto
hereafter. A rmagnetic bed' is a geophysical rather t'han geological
feature. Its dirnensions largely depend on the altitude of observation
urith the magnetometer. tYlagnetic beds closer together than about tulice
the altitude of the aircraft above cannot be resolved from thc correspon-
ding magnetic anomalies. Therefore (and as grouncl u¡ork in Êhapter 4
shouls) single magnetic beds interpret'ed frorn the aeromagnetic charts
may be composed of ttuo on more thin magnebic horizons interlayered uith
ueakly maqnetic material. Although a magnetic bed is a geophysical
featu¡e, it has geological significance in that, it indicates fhe
presencê of an anomalous amount of magneùic minerals. The presence,
or absence of magnetic minerals may be associated ujith other special
geological phenomena, including mj-neral composition, grain size, and
oxidation state. Because the magnetic beds Iíe ulithin sedimentary

-30-
strata but have theír top surfaoe belour ground level, it is evident
that magnetic minerals in the near surface part of the sedirnents have been
ueathered out.
Because anomalies change significantly ín amplitude and shape over
distances of as tittle ae r0 km, the beds are not homogeneous ovå a
great strike length. lllhile amplitude variations can be attnibuted to
variations in depth of ueathering, source uiidth or magnetic mineral
content, it is usually difficult to be suce r¡hich mechanism is most
important. A small change in depth of ureathering (e.9. 101) cannot be
distinguished flrom a small change in source thÍckness or magnetic mineral
content. Experience indicates that changes Ín depth of uleathering are
less important than changes in eoutce ulidth and magnetic mineral content'
lncontrollingtheamplitudeofresponseofthemagneticbeds.
Interpretation of individual anomalies Índicates that remanent
magnetism is ímportant in the area. Anomalies are commonly not of the
shape expected if inductive magnetism acts alone and in some cases,
particularly over the lor:¡er part of the Taptey HilI Formatlon, the
influence of remanent magnetism is far greater than inductÍon' The
problem of remanent magnetism is discussed in Chapter 5'
3.5.2 Corre 10n m utith
Incorrelatingaeromagneticanomaliesu:ithgeology,reliance
is placed on the accuracy of plots of the aircnaft flight path¡ the
accuracy of the geological maps and the accuracy of the interpreter
in Locating the source posÍtions from the anomalies. For 0RR0R00 the
photo positioning and geological data are of a high standard and there
are feu problems here. The main problem líes r¡ith the character of the

-31 -
magnetic beds. Because they are often ueatheted to L00 m or mo1.et
the position interpreted from the magnetometer charts uill lie on the
doun-dip side ofl the outcnop. lljhile this migration is not large for
very steep dips, for lotu dips of the order of 30o, the mignation can be
200 m or moDe, rJepending on the depth of ueathering. Most of the
mapped formations on 0RR0R00 are 500 m or more thick and there is little
problem in deciding uhether or not magnetic beds lie urÍthin them.
Houever, to find the precise stratignaphic position requires ground
magnetometer ulork. Tha precise locations of some sourcee in the strati-
graphic column are discussed in Chapter /+.
In correlating the magnetics and geology r maps at a scale of
Lz47¡520 uere used" Figure 3.4 shouLs t,he magnetic beds traced on
0RR0R00 from aeromagnetic anomalies of 5 gammas or more in amplitude'
The map uJas prepared after ground uork had been carried out. The
magnetic beds are shouln on Figure 3.4 as discontinuous lines, often
terminating uhere flight lines are nearly parallel to the geological
strike (".g. around the noses of fold structures). This illustrates
a limitation of mappíng uith the magnetic method. A flight line must
cross a magnetic bed to alloul its geographical position to be determined
from the anomalies. lllhere several maqnetic beds lie close together
the individual anomalies often merge around the noses of folds' ThUs
in these areas, although the anomalies indicate a magnetic zonet the
individual beds cannot be traced. A neu, suDvey uith flight lines
running north/south urould help to complete the mapping in problem areas "
flnly uhere sources can be traced betueen three or more adjacent f1ight
lines is a bed marked in. Often anomalies uith louer amplitude than
S gammas can be traced further along strike. In other cases anomalies

-32
sometimes occur at corresPonding stratigraphic positions several
fliqhtlinesapart.Thesea¡enotconsidered.Thepositionsof
magnetic beds in the Adetaidean section are shoujn on Figure 3'5'
The magnetic response of Adelaidean sediments changes acDoss a
line draun from about longitude I38o30tr latitude 33o to longitude I39o'
Iatitude 32o (see Fig. 5.4)' The anea in the east of 0RR0R00 urill be
referred to as A¡ea A and in the ulest as Af,ea B. The fo110uin9
differences occur 3
fTlore anomalies
14 magnetic beds
Area B.
arê Decorded in Area A than Area B '
aDe recognized in Area A and only I0 in
5o The amplitude of anomalies is often I00 gammas ot more
in Area Ar urhile it is usually less than I0 gammas in
Area B.
/+, tlagnetic beds can often be traced continuoualy along
strike of outcrop for more than 30 km in Area A' uhile
inAreaBtheycanrarelybetracedfo¡morethanl0km"
Binks (rsoa, 19?1) reported diffenences in the geology of the
eastern and uestern parte of 0RR0R00." The diffeDences occu¡ in
1. stratigraphy, and
2, metamorPhic arade "
ThechangesinstratigraphyareshoujnonFigureS.S.Features
of special ínterest are that the siltstones of the tuÍlpena Group are
red in Area B and green ín Area A¡ and that the sedimentary iron content
of the Yudnamutana Subgroup increasas flom ulest to east' Binks (fgZf)
1
2

-33-
noted that although the rocks of the 0RR0R00 af,ea are essentially
Unaffected by metamorphísm, Iout grade metamorphlsm (biotít'e, chloritet
se¡íoite) has taken place in the Adelaidean rocks in the east' He
suppoDted Tipper and Finney (1966) ruho considered that the high maqnetic
response in the east of 0RR0R00 uas probabty due to metamorphism of the
sedíments.
3.5 .3 ositi ofm etic beds the ti
Rocks of the Adelaide system have been grouped into four maJor
units (Thomson et aI., 1;964) named the lllilpena Group, Umberatana Group
(includes the Yeralina Subgroup, the Farina Subqroup and the Yudnamutana
SubgroUp), Burra Group and Callanna Bedsr a'd these are convenient sub-
divÍsions for the discussion beloul (sea Fig. 3.5). The Calranna Beds
are omitted from it beoause their aeromagnetíc response is uleak and
their stratigraphy is not ueII established on 0RR0R00' For the folloulng
discussíon of stratigraphic positions it may be helpful to refer to the
published 0RR0R00 geoloqical map (fig' I'5)'
3.5 .3.1 Burra GrouD
Tuomagneticbedsu,e¡erecognizedinAreaAandtheselie
ín the Minburra Quartzfte and near the top of the cradock Quartzite'
The magnetic bed ulithin the fYllnburra Quartzite is the more extensive of
these; it has the strongest response (I00 gammas) in the north-east of
Area A near llJaukaringa. ThÍs local increase in response is also evident
in magnetÍc beds in the Holouilena Ironstone and the lor¡er part of the
Tapley HíLl Fornlation of thc Umberatana Gloup'
InAreaB,threemagneticbedsoccul:atthebaseoftheBelair
Subguoup, ruithin the fìlinbu¡ra Quartzll-e, and urithin the Cradock Quartzite'

-34-
As in Area At the fÏìinburra QuantzÍte magnetic bed is the most extensive
and easilY traced bed'
3.5 .3,2 Umb-e-rqt¿rna- GroUP-
Yudnamutana SubgrouP
0n0RR0R00thissubgroupmainlyconsistsoftheAppÍId
Til}iteulhichcontainstheHolotuÍlenalronstoneinthenonth-easLof
the area.
There is a single díscontinuous magnetic bed near the subgroupre
base¡ulhichcorrelatesuliththeHoloulilenalronstoneu:hereitismapped.
ThehighlymagneticHolotllilenalronstoneuhichcontainshematiteand
magnetite(Binks,I9?I;alsodiscuseedinAppendixR4)ismappedover
a strike length of about 25 km in the nof,th-east of Area A' It
produces anomalies uith amplitudes of up to 1'500 gammae¡ houevelt
theyfadetoaboutl0gammasnomorethanlSkmtothesouthandulest
alongstríkefromthemappedouLcrop.TheanomaliesstrÉngthenlocally
in central 0RR0R00 and then fade out once again touards the ulest "
ülhere the Holorlilena lronstone is mapped on the north side of the
0opinaAnticline(t0kmnorthofllJaukaringa),dípsofbeddingaremainly
to the north and north-eaetr and here the corresponding magnetic anomalies
arechieflyofpositivesign'Houever'onthe56uf,þernsídeofthe
anticline(oxmnorth-ryestofllJaukaringa),uheretheYudnamutanaSub-
groLtpdÍpssouthrandulheremagneticinterpcetationindicatesthat
remnantsoftheHoloulilenalronstoneoccur,thesignofanomaliesis
negative.Fromthissignchangeitísevidentthatthetesponeeof
the Holouilena lronstone is a functlon of geological dip' The
magnetiobedappearstoplegeDveanelementofremanentmagnetization
acquired before ¡olding occurred"

-35-
Farina Subgroup and Yeralina Subgroup
Five magnetic beds occur in Area A and four in Area B.
The magnetic bede in Anea A lie close to the base of the Tapley HiIl
Formation (mapped as the Tindelpina Shale tYlember)r urithin the Tapley
Hill Formation, at tho boundary betueen the Tapley HilI Formation and
Tarcouie Siltstone¡ at the boundary bet,ueen the Tarcoulie SÍltstone and
lllaukaringa Siltstone fflember and ulithin the Yeralina Subgroup. A bed
u,as recognized urithin the Tarcourie SÍltstone uhere the lllaukaringa
Siltstone uas not mapped. Possibly this is equivalent to the one be-
tuleen the lllaukaringa Siltstone lTlemben and the Tarcoulie Siltstone.
In Area B magnetic beds uiere found close to the base of the Tapley
HilI Formation (Tinaefpina Shale tYlember), uithin the Tapley Hill Forma-
tion, close to the boundary betueen the Upper and Lou¡er lllillochra
Formatione and ulithin the Upper tUillochra Formation. In Area Br very
u.reak magnetic anomalies (less than 5 gammas sometimes) not easily traced
betuleen flight J-ines, Iie close to the boundary of the Tapley Hill
Formation and Unoonda Siltstone fYlember, uithin the Etina Formation and
the Elatina Formation" These mÍght be caused by very ureakly magnetic beds.
The position of magnetic beds in the stratigraphic column for the
Farina and YeDalina Subgroups suggests continuity through the strati-
graphic changes in the 0RR0R00 area.
The strongeet and most extensive anomaly in these trlo subgroups
is associated ulith the Tindetpína Shale flember ruhich is an extensj.ve
marke¡ in the Adelaide Geosyncline; this is a pyrltic carbonaceous
shale about 60 m thick at the type locality on C0PLEY" Binks (fgZf)
etates that the Tindelpina Shale contains minor pyrDhotite. There are

-36-
nopublishedanalysesfon0RR0R00tosupport'ùhis.TipperandFlnney
(rsoo), uho recognized that the anomaly rJas partly caused by remanent
magnetism, assurîed that the souDce of the magnetism uas pyrrhotite
occurring ruith the pyrite in the shales. ujhile acknoruledging that
pyrnhotitecouldbeverystronglyremanentlymagnetized,itruould
probably require 5S or more to produce aenomagnetic anomalies of up to
500 gammas over a bed uhich is about I00 m thick and magnetically
ureathered to about 100 m beloul the surface ' It ís doubtful that
pyrnhotite is the magnetic minenal responsible for the anomalies'
Groundulork(discussedinChapter4)shouledthatthemagneticbedis
much thicker than the zone of bhe stratignaphic column Decognized as
the Tindelpina shale [llember. In the fíeId on 0RR0R00 the member is
oftendifficulttorecognizeandasyettherehasbeennodrillingto
define its thickDESe.
ït is clear from this case that there are prciblems in associating
the geophysically located magnetic bed ulith a geological bed' It is
consÍdered t,hat at this time the position of the magnetic bed discussed
above should be described as Inear the base of the Tapley HiII FormatÍonr '
In Chapters 4 and 5 the magnetic bed is referred to as the I Louler Tapley
HlIl magnetic bedr .
3.5.3.3 UJilPgng Gro.g,P,
Slx magnetic beds recognized in Area A are as follouls:
four uÍthin the ulupa Siltstone and one uithÍn the Bunyeroo FormatLon
and the lllonoka Formation. The louiest bed lies near t'he base of the
Ulupa Siltstone¡ Just above the Nuccaleena Formation'
ThreemagneticbedsrecognÍzedÍnAreaBarelocatedasfollotus:

-37 -
one uJithín the A.B.C. Range Quartziter one u¡ithin the Brachina Formation
and one bctueen these tu¡o f ormations. It is not knouln u.lhether any of
the four magnetic beds u,ithin the Ulupa Siltstone in Area A cornelate
urith the magnetic beds of Area B.
The most strongly magnetic bed in Area A has anomalies up to 600
gammas on the uestern limb of the Dauson Syneline (ZO km north-north-east
of peterborough)r urhile on the eastern limb 10 km auray, the corresponding
anomalies are of the order of 100 gammas ín amplítude. These amplitude
changes may be due to an element of remanent magnetízation. The
response of the equivalent magnetic bed drops from about I00 gammas to
20 gammas acf,oss other synclines to the east and north-east of the
Dauson Syncline. These amplitude changes may be dUe to changes in
magnetic mineral content of the magnetic bed or perhaps to an influence
of remanent magnetism u¡hich is a functÍon of geological dip.
3.6 fYlaonetization of beds
Because remanent magnetization is important in the rnagnetic beds of
the 0RR0R00 area, the susceptibility cannot be calculated directly from
aeromagnetic profiles. Rather, the qltcgtrve meqnetization (lr) or the
effecti ve maone susceot litv (fe) are the parameters u¡hich can be
estimated (".9. by the oquations of Gayr 1963). The effective magnetic
suseeptibilÍty is the suscepüibilÍty uhich is requÍred to produce the
observed magnetÍc anomaly if the source is inductively magnetized by
the earthrs fie.Ld. The eusceptibÍlíty of country rock enclosing fhe
magnetic beds is assumed to be zeno. In the field area the earfhrs
field has an intensity of 591000 gammas, and is directed uputalds at an
inclination of 65o to the horizontal. A minimum estimate of ke can be
made from the magnetic anomalies if the source body ís given the minimum

-38
possible depth bel-ott surface and the maximum ulidth. A maximum
estimate can be made if the source body is given a maximum depth
and a minimum thickness. To illustrate the order of effective suscep-
tibility required to produce the observed anomalies, minimum and
maximum estimates corresponding to several aeromagnetic anomaly
amplitudes are shouln on Table 3.3. These are for magnatic beds aesumed
to be magnetically homogenelousr 300 m or 50 m thick, and magnet,ic at the
surface or 150 m beloul the surface.
Table 3.3
Estimates of Effective fflagnetic Susceptibilityfrom Aeromaqnetic Anomalies
*Estimates fon north/south striking, ínfinite tabular bodiesdipping vertically. ur = apical uridLh, ¿ = depth beloul groundleveI.
These estimates indicate that some of the beds are very strongly
magnetized. Houlever¡ ühey are ol tittle valuo for the direct comparison
of various beds because for most beds the precise thickness is unknouln.
The thicknees and magnetization of particular beds is discussed ln
Chapters 4 and 5.
Total fieldanomaly amplÍtude
at l-50 m aboveground level
ke* (mfn)crQrs. units
(ur = 300 m
¡=0m)
ks* (max)c.g.g. units
(ur=50mz=150m)
Example stratigraphicpositions of
magnetÍc beds
10 gammas
I00 rr
500 ll
11 500 rr
50 x 10-6
500 il
21500 il
71500 rr
?00 x 10-6
?1000 ll
35 r ooo rr
105 ,000 I'
tUonoka Formation
Upper Ulupa SiltstoneLouer TapIeY Hill
FormatLon
Holouilena Inonstone
-39-
3.7 Discussion
0n 0RR0R00, linear aeromagnetic anomalies often 20 km or more longe
are causad by magnetic beds conformable uich the stratigraphic layening
of Adelaide System sedirnents. The beds are no more than 300 m thick
and lie u¡ithin ureakly magnetic strata which probably have a magnetic
susceptibillty of less than I00 x 10-6 c.g.s. units. F¡om the avaiLable
geological evidence, none of the magnetic beds are volcanics, and only
one is correlated uith an iron formation; thei.r occurrence indicates
an increase of magnetic mineral content over small intervals of the
stratigraphie succession.
Because some of the beds are remanently magnetÍzecJ it is not
possible to estimate magnetic susceptibility from the aelomagnetic data.
illoreover, in consequence, it is not meaningful to use the empirical
relationships of magnetic susceptibility and magnetic mineral content
such as those in Grant and llest (fSOS, pp.2671268) to estÍmate the
amount ofl magnetic minerals present in the beds. Except for the HoIo-
ullena Ironstone magnetic bed and ühe most strongly magnetic bed uíthin
the Utupa Siltstone uhere magnetit,e is recognized (Appendix A4), the
magnetic minerals causing the anomaLies ane unknouln as yet. Adelaidean
sediments often contain a feu percent of pyrite, either at the surface
or in bore core¡ ancl it is possible that a smafl amount of pyrrhotite
coexists uith the pyrite at depth and contributes to the magnetic response.
The magnetic response of shales of the llJituatersrand System in the
Republic of South Africa is comparable urith that of Adelaidean sediments.
Here the magnetic mineral is magnetite (RouX, L96?). It is likely
that magnetite is the dominant magnetic mineral in Adelaidean sediments
and in most of the magnetic beds probably does not excead about 1%.

-40
Ground magnetometer u.lork is necessary to provide detail of the form of
the magnetic beds, particularly to find r¡hether each consists of
several thin magneLj-c sheets as can be expected in ulell laminated
sediments " In addition ground ulork can provide a more accurate
estÍmate of total bed thickness Lhan is possible ulith aeromagnetic
profilBS.
StUdies of grounrJ magnetometer profiles to find more about the
form of the magnetic beds and the influence of reman8nt magnetism are
presented in ChaPters 4 and 5.
0RR0R00 can be rouqhly dÍvided into tu¡o areas' In the eastern
area (Area A) magnetic xesponse of the sediments is higher than in the
ulestern area (Area B). tllhÍIe the difference can be attributed to a
difference in magnetic iron content of magnetic beds in the tuo areas,
from the magnetometer data it is not possibl-e to conclude urhether this
is related to a difference in totaL iron content of the sediments'
Binks (fgzf) has stated that the total iron content of the Yudnamutana
subgroup Íncreases from east to ulest; possibly the same is true for
other parts of the section. Binks (op. cit.) has report'ed that meta-
monphic arade increases from uest to east on 0RR0R00 and thís corresponds
t,o uleak magnetic response in Area B and strong resPonse in Area A.
Unpublished urork by Brotherton (Honours thesis, L967, Unlvensity of
Adelaide) compared the metamorphic arade and Íron mineralogy and geo-
chemietry of st¡atigraphically equivalent lllilpena Group rocks at Luro
areas on BARKER. He found that the ueakly metamorphosed red shales
and siltstones llear Sellicks HiII contained more hematite than magn€-
tite (average of three samples "
le2o3 = 3,32/" by ureight¡ Feo = L.95/"
by ureight), ruhile in the gr,ey-green phyllites neal Delamere the opposite
-4L-
occurs (average of three samples; Fe203 = 4.22% by ueight¡ FeO = 4¿15%
by ureight). B¡otherton attributed the development of magnetite to meta-
morphic processes. The aeromagnetic contour map over the BARKER area
shans very ueak anomalies over the ¡ocks of Sellicks HilI, tuhile near
Delamere anomalies exceed 200 gammas in amplitude. It appears that the
most important factor controlling Lhe magneüic Desponse of the sediments
Ís probably metamorphism. There is no evidence that magneùite occurs
ae detrital material. Hotuever, this possibility should not be oven-
look ed .
To resolve the problem of the relationship betueen magnetic iron
content and total iron content of the Adelaidean sediments requj-res
mineragraphic study of rock samples. Houlever, a further problem is
presented. The magnetic beds are often magnetically ueathered up to
200 m bel-our the surface. Thus deep drÍlJ.ing is required to obtain
truly fresh rock for study.
gne of the potentially most useful featunes bnought out by inter-
pretation ofl the aeromagnetics of 0RR0R00 is that the magnetic beds can
be traced for long strike lengths and appear to continuo through litho-
logically different buü stratigraphically equivalent rock units, partí-
cUlarly in the Umberatana Group. Some of the beds may be usefuf as
stratigraphic markers although only ten magnetíc beds uete recognized
in Area B urhj.le 14 ulere recognized in Area A. The reason for the
diffsrence in numbers is not clear and only in the case of fhe Holo-
ulílena Ironstone magnetic bed in the Yudnamutana Subgroup ís there
direct geological evidence fot a maqnetic bed to lense out to the
uest. A great deal of furthe¡ uiork is required to resolve uhether
all the magnetic beds are aluiays prosent in the stratigraphic successiont
¡
tttl
)
i'
!
I
i
1.
r
i;¡{)
p

-42-
u¡hich tuould be of great interest to stratignaphers. The major problem
is that the responee of the beds in Area B is much ueaker than in Area
A. It is doubtful if further uork uíth aeromagnetice on0RR0R00 ulill
add much to ühe picture already established for the area. To detect
magnetic beds uith uleak aeromagnetic response requires ground magneto-
meter ulork but even this has assoeiated problems. Ground profiles
shoul the presencê of a strong surface noise component u¡hich tends to
mask the Ínfluence of ueakly magnetic beds¡ particularly if they are
uaathered to a considerabLe distance belou the surface, The influence
of noise is discussed further in 8hapten 4.
A study of the contour maps for other pa rts of the Adelaide Geo-
syncJ-ine indicated that the detailed picture established for 0RR0R00
is probably not a local featUre. For examplee the magneùic bed
near the base of the Tapley Hill Formatíon can often be t¡aced on
COPLIY in the north and ADELAIDE in the south. One or turo magnetic
beds can oftan be üraced in the Ulilpena Group as far south as BARKER.
f
¡
È-
!
¡
,t
{
ïlI
I
ì
i
i,
H
p
,,
i
I
I
ì

-43-
Chapter 4
DETAILS OF MAGNETIC BEDS REVEALED BY GROUND SURVEYS
4.I Introdtlction
UJhiIe aeromagnetic interpretat,ion can give an apProximate position
of a magnetic body to u¡ithin about 50 m¡ ground magnetometer surveys
are Bssential to locate sourc€s accurately. As groUnd uork provÍdes
more detail of anomalies than is possibte ruith airborne uorkr the
results are of great value if dímension parameters to describe the
sources are desired. Ground u.rork is particularly important ulhere sources
are thin or small in extent.
The use of the aeromagnetic method to provide data for huge aroas
since the 1940rs has overshadoured the more mundane use of magnetometers
on the ground¡ and the literature clearly reflecte this. Publications
on the use of the ground magnetomþten and the special problems in inter-
preùation aDe rare, and most attention ís given to airborne tuork.. The
major problem of groUnd ulork is the almosü oVerulhelming detail uhich can
be gathered, and in thís respect the use ofl aÍrborne methods for the
study of shallour sou¡ces has the outstanding advantage of simplifying
the data. Sorne of the problems in the interpretation of ground magnetic
data ane díscussed in this chapter"
There are feu recent published teports on ground magnetomeLer
surveys across Piecambrian metasediments; most of these discuss iron
fofmations or intrusives (e.g. Eadie, L97Oi flebb, 1966; Leneyr 1966;
Stranguay, 1965), Some of the earliest ulork on extensive magnetic beds
uras done by Krahman (fSS6) in tne ülituratersrand anea of the Tnansvaal;
it uas found that magnetic shales of the lllitulatersrand System could be
tracsd under younger cover by the magnetic method and used as strati-
I
à
¡
t
t

-44-
gDaphíc markers in the search for gold bearing beds (Summary Ín Roux,
;,;967). At that time most attention uas given to finding the geo-
graphical position and depth of magnetic material, rather than detailing
the precise form of the souDces. In recent years interpretation
teehniques have become incneasingly sophisticated and ule can nour expect
to derive special dotails of the form of magnetic strata from their
anomalies.
GnoundmagnetometersurveysacrossAdelaidesystemsedimentsuere
carried out at numerous localities in the Adelaide Geosyncline, both to
accuratel-y locate sources and to provide detailed data for the estimation
of parameters ofl the magnetic beds. Ideally magnetometer lines across
linear bodies are best if run normal to strike of outcrop' It ulas not
alurays practical to foltou¡ this rule. For interpretation pl.ocesses,
profiles from magnetometen lines oblique to 9eological stnike ulene con-
tracted in j.ength to appear as if they urere taken normal to strike'
Details of the survey procedure are included in Appendix A3' A total
of 120 lines (totatling 25O km in length) urere put in; some of these
uere isolated reconnaissance lines and others uJeIe close together and
parallel to provide local detail. fYlost ground lines uete more than 2 km
Iong uíth station spacings of 7.5 m (ZS feet) oI mo.e. Localities ulere
chosen on the basis of tho quality of the aeromagnetic anomalies and
exposure in the êI¡Eâ. Although there alle numerous roads in the thesis
area'magnetometerlinesuerenotusuallyputinonthem,because
experience shoued that man-made magnetic sources are often present'
PrelÍminary groUnd surveys in areas of strong and uleak aeromagnetic
anomalies indicated, as ujas expected, that the best defined anomalies
ulerefound ulhere the aeromagnetic anomalies uerestrongest' For this

-45
reason effort uas concentrated on beds uihich had strong aeromagnetic
anomalies (".g.100 gammas or more). The ground ulo¡k ulas mainly con-
fined to the eastern part of 0RR0R00. Houever, reconnaissance lines
urere put in, both in ùhe r.lest of 0RR0R00 and in other areas ofl the
goosyncline (eee Figs. 2,L & 4.4). Most uork utas perfotmed across
the Lourer Tap1ey HilI magnetic bed because it is the most extsnsj've
magnetic bed in the geosyncline and preliminary inveetigations indicated
that general concfusions on the natqre of this bed are applicable to
others.
In this chapùer Ínterpretations of six selected ground magnetometer
profiles from 0RR0R00 are shoun to illustrate featutes of maqnetic beds'
0thers not included in the thesis shot¡ similar features and the conclu-
sions drauln for the six profiles are not restricted to a feu isolated
Iocalities.
4.2sedimegLq
All profiles discussed in this chapter uere obtaíned urith a
Vertical field fluxqate magnetometer. The sign convention conforms to
that in Gay (f963)i an induced vertical field anomal¡/ over a vertical
rod at the south magnetic pole is of neqative sign (a tot'al field anomaly
ie of positive sign).
The ground magnetometer profiles acDoss stoepLy dippinq Adelaide
System sediments shoul the presBnce of broad symmetrical or ¡early
symmetrical anomalies uith half-uidths of 500 m or less (attributable
to deep nragnotÍc sources), together with superimPosed nar¡ou anomalies
(attribrltable to near surface magnetic matehiaf). Figures 4'1' 4'3
and 4.4 iLlustrate the form of the anomalies. The anomalies evident on

-46-
aaromagnetic charts and of primary interest in the ground ulork are the
broad anomalies; the narroul anomalies can be considered to be a noiee
urhich rapidty decreases in amplitude urith increasing altítude. Noise
is considered in detail in section 4.3 of this chapter'
The broad anomalies usually have tuo or more main peaks, indicating
that turo or more sources contribute; in only a limited number of cases
uere single ulell isoLated broad anomalies found. They often closely
approximate the shape of theoretical anomalies across eteeply dippinq
thin tabular bodies (cf. Gayr 1963). Broad anomal-ies are usuall-y
essentíal1y similar in shape over distances ofl 10 km or more along strike.
Houever, details often change over distances of as little as 500 m'
For examp1e, an anomaly ulhich shouis several partly resolved peaks at
one location may have only one or tuo peaks at another. This sort of
change can be attributed to an increase in depth on lensing out of the
soutoBs. It appears valid to interpret the anomalies as due to steeply
dipping tabular bodies of considerabl-e strike and depth extent.
The vertical field anomalies are usuafly symmetrical or nearly
symmetnÌcal in shaper even for east/uest, strikinq north dipping beds'
This indicates that magnetization Ís close to geological layering.
If beds are inductively magnetized by the eanthrs field, it urould be
eXpected that vertical flield anomalies uould be of symmetrical shape
over south dipping east/urest strikíng magnetic beds, and of asymmetrical
shape over north dipping beds. Feul asymmetric anomalies uieDe recorded.
The theoretical vertical field anomalies over tabular bodies magnetized
in the plane of bedding uilt be symmetrical, independent of their strike
or dipn In ühe main, this condition aPpeals to exist for most of the
magnetic beds. There are tulo phenomena ulhich can independently
account for magnetization alurays lying close to the plane of bedding.
These are I. demagnetization effects associated uith material of very

-47-
hÍgh suscePtibilitY' and
2o strong remanent magnetization in a direotion close to
the plane of bedding"
Because anomalies are often of opposite sign to that expected if
inductiVe magnetization acted alone, it appears that remanent magnetism
is more important than demagnetizatÍon effects '
After preliminary field t¡ials it ruas found
of t5 or 30 m usually provided sufficient detail
to allorl quantitative interpretation" Houevert
7.5 m or less, u,ere often necessary across peaks
the anomalies to give fulI definition.
that a statíon spacing
of the broad anomalies
closer stationsr El.g.
and tunning poÍnts of
0n the basis of the tabular body morJel the broad magnetic anomalles
can be interpreted to give depth estimates of 50-100 m or more. It is
shotun in section 4.6 that the upper surface of maqnetic beds is quiùe
complex in shape.
4,3 Noj-se
The major problem in the interpnetatíon of the ground data is the
pres€nce of magnetic noise on the profiles. All- magnetometer profiles
acloss the Precambrian strata, and for that matter younger cove¡ rocks,
shouj the presence of broad anomal-ies up to 500 gammas oI. mole in ampli-
tude, attributable to sources up to 100-200 m belou the surfacet
together ulith a superimposed noise component attrÍbutable to soulces
urit,hin about 5 m of the surface.
The noise component appeaDs on the ground profilee as sharp
spikes, commonly of an amplitude up to t 20 gammas, and oocasionally of
J tOO gammas ot more. Usually the spíkes lie betueen thtee statíons

-48
(grid 7.5 m or more) and measurements 1 m apart ot less are required
to provide detaÍl of their ehape.
Repeat readings at dífferent tines uere made along tuo traverses
to alloul estimaLion of Ínstrument reading ecrora. Figure 4.I(a) shours
a ve¡tica1 fietd profile fnom the thesÍs area uhich ulas read orì tuo con-
secutive days. To alloru eomparison of the tulo results a sùatio difference
of about 50 gammas in background leve.I has been included. The envelope
of dÍfferences betueen the ¡eadings is about 10-20 gammas tLlide. A feul
diffenences lie outside thís range, possibly because the exact position
occupied on the first reading ulas not occupied on the second. Thus the
reading accuracy of the magnetometer is betueen I s an¿ I I0 gtttu".
Therefore some of the l-oul amplituda noise spikes on field profiles can
be attnibuted to reading erroîs. Houever, the noise is often of higher
amplitude than can be attributed to reading erDors and much of it must
be due to the influence of magnetic material at ground l-evel or belou¡.
Because the sign of ths spikes is often opposite to that expected if
inductive magnetism acted al-one, it is evident that the sources are
often remanently magnetized"
Detailed measurBmentg ac¡oss some ofl the spikes indisated that the
sources often have limit,ed sürike extent (5 m or less) and appear to be
¡andom in theÍr occurrence. Houever, sometimes the spikes are
apparently associated in some uay urith deep magnetic beds. For
example¡ there is often a stnong bursü of noise on the geological uP-
dip side of a deep magnetic bed. Figure 4.1(b) shours an example of
this and iLlustrates the use of the term tup-dip'. The high amplltude
spikes tabeLled (f) fie on the up-dip side of a broad anomaly u.rhich is
due to magnetic beds in the louer part of the TapLey Hill Formation.

-49-
The noise burst,s can often be traced along strike for 500 m cl1. mo¡e,
and Ín this situation it is ofùen possible to t¡ace individual spikes
along strike for a considenable distance. lllhere noise bursts are
associated ruith deep magnetic bedse the èign of individual spikes is
often the same as that of the anomaly due to the deep sourcÉs. It ls
possible that some of the noise is due to very thin near suDface remnants
or derivatÍone of the deeper magnetic sources' fYlaqnetic minerals
present in the remnants ulould presumably be t'he eame as at dapth.
For eituations uhere there is no evidence of associated magnetic material
at depth¡ sorlìB other mechanism, probably an influence of ueatheringt may
act to concentraüe magnetíc minerals nea¡ the surface" Alternativelyt
some of the near surface rocks may prese¡.ve small lensee or pods of
magnetic minerals r¡hich have been unaffected by uleathering processes'
This may be the case in the follouing example'
Seven percussion holes ulene drilled in the Appila Tiilite 12 km
south-uJest of l.lJaukaringa to test three anomalies uhich uere classified
as noise (see Appendix A2 - Ajax Holes I to ?). The highest amplitude
recorded utas l¡500 gammas positive. The sÍgn of the anomalies uas the
same as recorded over the Louer Tapley HilI magnetic bede sofTlê 100 m
higher in the section. InterpretatÍon of detailed magnetometer pro-
fÍles indicated that two of ùhe sources lay no more than 3 m beloul the
surface. There u,as no eVidence of a large deep source beloul them'
The anomalies are caused primarily by remanent magnetism and so suscepti-
bility measurements on cuttings are of limited value. It uas expected
that material of high susceptibility (Uith associated strong remanence)
urould be penetrated. It uas not. The recorded suscepüÍbiJ.ities urene
all beloul 200 x 10-6 coÇ.s. units. In most holes, susceptibilítieg
drop by one half in the top 3 m and rise to a background level of about

-50
]00 x 10-6 coÇ.s. unite at 5-10 m. Approximately I.Sf pyrrhotite
uras found in tuo samples of cuttings magnetically separated (AppendÍx
A2, Samples 0R60 & 0R62). It aPpears that the drÍll holes missed
the targets. A brick-sized bLock of surface rock tested ulith a
magnetometer for remanent magnetization produced no useful De8ults.
No sulphide tuas visible in the rock. It contained about Ifi limonite
p€¡eqdomonphs after pyrite. It is pnobable that strong remanent mag-
netizationofunexposedpyDrhotite.bearingrockcausedthemagnetic
anomalies.
The randomly occurring component of noise is present on a1I ground
profiles for the Adelaide Geosyncline ulhether they are from areas of
exposed Adelaidean strata or thÍck youngÊr rocks (".9. Quaternary).
An example of this kind of noise can be seen on Figure 4.I(b) in the
vicinity of spikes labelled (2). UsuaIIy the spikes cannot be attri-
buted to magnetic rocks at the surface; surface rocks are usually only
ueakly magnetic. fflagnetic susceptibility tests on drill hole cuttings
and other samples (Appendix A2) from both Adetaidean and younger strata
indicate that a zone of enrichment of magnetic minerals about 2-5 m
thick often líes at or close belou¡ the surface. In this zone sÌuscepti-
biLities in the ¡ange 200-400 x L0-6 crÇ.s. units are often found in
Adelaide System sediments; just belour the magnetically enriched zone
susceptibilitÌes are usUaIIy about 100 x 10-6 c.g.s. units or less'
Cook and Carts (WAZ) measured susceptibilitÍes of residual soils in
the U.S.A. and Panama, and concluded that maqnetic minerafs oflten
form Ín place near the surfaca, uiz. maghemite, and contribute substan-
tially to the observed magnet'Ísm of the soils. It is probable that
the same mechanism is important in the rocks of ühe Adelaide Geosyncline.
Inductive magnetization of near surface concentrations of magnetic

-51 -
minerafs probably causea some of the magnetic noise. Although no
direct measurements uele made of the natural remanent magnetism (t\lRm)
of nngnetic material causing the noise spikes in the Adelaide Geosynclinet
it is evídent from the magnetic interpretations that material close to
the surface eXhibits an appreciable magnetic lemanence. Possibly
chemical remanent magnetism lCnm) and viscous remanent maqnetism (VRm)
are important (Irving, L964, pp.28-34).
4.4 fYlaqnef ic susoeptibilitY measurements on Adelaide Svstem ¡ocks
The volume magnetÍc susceptibility of Adelaide System rocks uas
measured urith tuo eusceptibilíty bridges. The detailed results oî
neasurements are included in Appendix 42"
Obtaining fresh rock for measuring the susceptibility of magnetic
beds uas a problem. UJhiIe the cores or cuttings from many drill- holes
in the Adelaide Geosyncline are held in the SADIYI corestorer they are of
Iimlted use for magnetic interpretation. There are tulo reasons for this.
Firstly, the drilI holes put dorr.rn in the past by explonation companies
have not been to test the sources of magnetic anomaliesr and secondly
they are usually of limited depth (less than 200 m) and ars
often Ín geologically disturbod areas uhere the rueathen-ing depth is
likely to exceed that in less disturbed areas.
To the authorrs knou-rledge only one bed urhich often has associated
rnagnetic anomalies has been dritled (near the base of the Tapley HiIl
Formation). Houlever, the drill holes u.lene not sited to give informa-
tion on magnetic sources; rathen they ulere placed to test for copper
mineralization urhich often oecurs at this f,evel (associated uith the
TÍndetpina Shale tYlember). tYlappinq by the SADÍYì lndicates that the

-52-
Tinclelpina Shale Member lies at the base of the fapley H1Il FormatÍon
at, the LocaLities of the five cores tested. The holes did not exceed
200 m in depth and the susceptibilities recorded uere usually less than
100 x 10-6 crgos' units' rn arl of the cores' fnesh pyrite uaspresent
beloul about 50 m and this may indÍcate ùhat the rocks are magneÙicaIIy
fresh at these depths. Houever, thereua€¡no indication of a high
sUsceptibíIity zone beloul the depth of oxidation of pyrite. [Ylaqnetic
response in the areas of the drill holes u,as very uleak. ThUs at the
localities of the drill holes the Louer Tapley Hill maqnetic bed either
does not occur, or is veny ueakly maqnetízed,
The magnetic interpretation indicated that maqnetic beds ane
usually uleathered to a considerable distance beloul the surface. Thus
it ulas to be expected that susceptibility IneasuDements on surface nock
samples uould be of limited value. This ulas found to be the case and
of the 100 samples tested, hígh values uere obtained only for a feul
samples of Holouilena lronstone and UlUpa Siftstone. For the Ulupa
Siltstone there is a ueak grouping of susceptibilities around 50 x 10-6
crÇrs. units and 11000 x 10-6 crÇ.s. units. 0f the 31 samples tested
nine have susceptibílities betr.ueen 11000 X 10-6 and 30r000 x 10-6 crÇ's'
units. FouD samples of Holouilena Ironstone uere tested and their
susceptibilities lie in the range 100-58r000 x 10-6 crÇ.s. units.
tYlagnetite altering to martite u,as recognized in the Ulupa Siltstone
and Holouilena Ironstone (see Appendix A4).
From the available direct measurement data it appears that the
susceptibitity of magneticalty u¡eathered Adelaidean rocks ís usually
Iour, and is probably less than I00 x 10-6 c.Çrs. Units except ulithin
a feu metnes of the surface uhere in some places it is knoun thaü the

-53-
sqsceptibility is 300 x 10-6 crÇrs. Units or mone. It aPpears that
the susceptibility of material in the magnetic beds could be quite high.
If measupements on the Ulupa Siltstone and Holou¡ilena Ironstone ane taken
as a guide, susceptibilities of the components of' some magnetic beds lie
in the range 30,000-60 r 000 x 10-6 c. Ç. s o units. Hor.uever, there is
evidence that magnetic beds contain strongly magnetic and uleakly maqnetic
layers. Thus to assign an averaqe susceptibílit'y to a bed is not
possible from the availabLe direct measurement data'
fflcGrath (fSZO) reported susceptibÍlity measurements on surface
samples and drill cor€s from the Halifax FormatÍon in Nova Scotia'
The aeromagnetic ¡.esponse of these slates is very similar to that
observed over the Adelaidean strata. lYlcGrath considers that the
magnetic effect of the Halifax Slates is primarily caused by pyrrhotite
(X <g00 x 10-6 cr9.s. units), but that u¡íthin the more high1y meta-
morphosed contact aureoles surrounding intrusive granites o magnetite
is the main magnetic mineral (Ir000 x 10-6< k <61500 x 10-6 crÇ.s.
units). Possibly his susceptibility range for magnetii;e rocks applies
to some of the strongly magnetic beds in Adel-aide Systenr sediments'
4.5 tYlethod of inLeroretation an d orobl-ems
Interpretation schemes fon magnetic anomalies have become j'n-
creasingly sophisticated in recent years and there is a range of pouen-
ful methods available, particularly for anomalies due to steeply
dipping infinitely long tabular bodies (".9. Peters, 1949; SmeIIiet
1956; Hutchison, 1958i HalIr 1959; Brucksharu & Kunaratnamt 1963;
Gayr 1963; Pouell, L9671, tYlcGrath & Hood, L97O3 Koulomzine et, al.
1970). Anomalies of inte¡est can be enhanced by linear fíIt,ering
or continuation methods (".S. Hendersonr 1960; Zurfluehr L967i

-54-
Naídu, L96B). A ulell defined magnetic anomaly 'rhich is close to the
theonetical shape expected for an infinitely long dippinq tabular body,
can be analysed to yield source dímensions, depth and strength of
magnetization ruithin error bounds of about ! lol,'
0f the published interpretation methods, the curve matching
methods (".g. Gayr 1963), uhich require fitting o'l an entire theoretical
anomaly to the field anomaly, u,ele found the most ueeful in the Adelaide
Geosyncline. Houever, it must be acknouledged that if an anomaly
observed in the field closely approximates the theoretical shape of a
tabular body anomaly, then other simpler interpretation methods (n'9'
Peters, lg4g) uil] give closely similar I'esu1ts. The particular
adVantage of a curve matching method is that it can often be success-
fully applied to noisy data, Houever, to be most offective, the
influence of noise must be assessed, particularly above the halfl ampli-
tude points of the anomaly. In many instances, particularly fon
anomalies of I00 gammas or more in amplitude, the general fonm of the
anomaly can be seen. The interpretation method apptied by the aufhor
uas to choose an initial profile from Gayrs set of standard curves
ulrich had the same shape as the field profite and then make successive
adjustmente to the corresponding model until the ùheoretical proPile
closely fitted the field profile. Theoretical anomalies ulere produced
by computer. Adjustments ulere made by triaL and erlor rather than by
a computerized iterative method such as that of flcGrath and Hood (feZO).
Usually about five adjustments ulene necessãD!r
For all profiles interpreted in thÍs chapter the geological dip
of Adelaidean sediments uas measurecl in the field. It ulas found that
in most cases the theoretical anomaly expected if inducüive magnetism

-55-
acted alone did not match the flÍeld profiles. lt is considered that
remanent magnetisrn is an important cont¡ibutor to nearly all anomalies
studied. Gay (fg63) stat,ed that his method uas just as effective for
finding dept,h and uridth of remanently magnetized tabufar bodies as for
inductively magnetized bodies. The essential quantities de¡ived are
depth and apical uridth (i.". ulidth of the flat top surface of the
tabular body); because geological dip uras measured in the field¡ so
thickness and strength and direction of magnetization could be derived.
The influence of noise is a problem partícularly for loul amplitude
anomalies (e.g. 50 gammas or lesg) because it often completely masks
the parts of the curve most necessary for quantitative interpretat'ion.
Linear filtering techniques (Henderson, 1960; Naidur 1968) ulere
applied to temove ùhe noise from sevo¡al loul amplitude problem anomalies.
After trial runs uith various filters it ulas found that the resultanl:
smoothed profiles did not clearly shoul one of the mosù important features
evident in most of the best unfiltered data; it is often evident in uell
defined high amplitude anoma.Iies that ttuo or more tabular sources at
different depths are present. Fittering tends to destroy evidence of
the shallou.lest sources" In addition, linear fliltering is strictly
applicable to eases of random noise; quite often over important parts
of anomalies the noise is not random and shouls a preferential sign
which is the same as fon the broad anomalies. Because of these
factors it uas decided that most benefit u¡ou1d come frorn a study of
uelt defined, unfilte¡ed strong anomalies uhich uere least influenced
by noise,
The technique of dounuand continuation (Hendersonr oP. cit.) rlas
applied to several anomafies to gain more information Dn tho contnibuting

-56-
sources. Noise uras removed by hand or by linear filtering and the
resultant profile r.uas then continued. The method uas found to be very
seneitive to the fílter used; any small Írregularities due to near
surface noise tended to become ovor emphasized by the continuatl-on
procesg. Thus several trial runs and successive smoothings u'e¡le
necessäry before a successful continuation ulas achieved, urhich only
enhanced anomafies due to deep sources. Because of the problem of
noise, it is considered that dounulard continuation is not a particUlarly
usaful technique for the study of anornalies due to sediments in the
Adelaide GeosYncline.
It is difficult to assess the influence of demagnetization effects
in ühe area. Demagnetization becomes important in magneLic interpre-
tation Íf the susceptibility of source rocks is about 0.1 crÇ.s. units
or more (G.y, 1963). Because the magnetic method cannot resolve several
closely spaced eouDces at a depth much in excess of their sepanatlone
it is usually difficult to decide r:¡hether the source of an anomaly ís a
single thick magnetíc bed, or several closee very strongly rnagnetized
thinbeds.Inthelattercasedemagnetizationeffectsmightbe
important. Houever, if the susceptibility measurements in the area
are taken as a guÍde, demagnetízation effects can be neglected.
Another problem of interpretation is that of separating the
effects of induced magnetism and remanent magnetism of beds ulhene both
are important" tytethods such as those of HaII (fsse¡, Gty (1963) and
pouell (rSos) allow rapid estimation of magnetlzation inclination if
the geological dip is knoun t,o ulithin about 1 loo (as is usually the
case for Adelaide System sediments). The strenqth of apparent
magnetization (¡t) can also be estimated if the geological dlp is

-57-
knouln. Fotr a single long magnetic bed, tuhere inductive and remanent
magnetism are both important, Ít is not possÍbIe uith magnetic interpre-
tation to find the true direcùÍon and intensity of magnetization (J).
In genetal J is greater than or equal to Jr. Susceptibility data
alloru estimation of the indÍvidual effects of induced magnetization
and remanent magnetism in the plane normal to strike of the bed (i.e.
apparent remanent nragnetization)" Unless suseeptibility of the bed
is knoun no accurate estimate of the apparent strength of ¡emanent
magnetization can be made. Reliable susceptibility data uere not
availabl-e for the magnetic beds in the Adelaide Geosyncline; therefore
the authorrs ulo¡k uas confined to estimation of the stnength and
directÍon of apparent magnetization, except for the Lourer Tapley HílI
magnetic bed urhere special geological circumstances permitted an approxi-
mato estimation of the strength of ¡emanent magnetization (discussed
in Chapter 5).
A method for finding the intensity and direction of apparent
magnetization (J') by use of Gayrs (fS6g) method is outlined in
Appendix 46" In the thesis c.g.s. u¡its arc used. Therefore if
a nragnetic nock of susceptibilíty k (".g.s. units) is inductively
magnetized by t,he earthrs field (0.59 Oorsteds), the magnetization J
is equaÌ to 0.59 x k coQ.s. units'
4.6
Most ground ruork uas carried out acPoss the Loule¡ Tapley HilI
magnetic bed and the fotlouing discussion is mainly of anomafj-es
associated ruith this bed. The ground magnetic anomal'ies are often
200 gammas or. more in amptitude, and the problem of noise is less

-58-
t¡an over beds ulith ueak responsêr It is considered that interpnetation
of the magnetic anomaLies associated uith this L:ed can yield information
applicable to other magnetic beds in the Adelaide Geosyncline. tllhile
g¡our¡d lines u,ere Dun across many of the magnetic beds, only the Holouilena
Ironstone is discussed apart from the Louer Tap1ey HfIl magnetic bed.
Figure 4.4(d) shours the locality of field lines on 0RR0R00 and indicates
those discussed in this chaPter.
4.6.I Presentation of interoreted maqnet ometer profiles
presentation of interpreted magnetic anomaJies is a problem.
Some authors shou the field profÍte and theoretical anomaly in juxtapositiont
oth,ers separate the ùulo. Because the field profiles have important
details urhich uould be obscured by the juxtaposition presentationr for
thÍs thesis it uas decided to separate the prof iles " The ind.:'-vidual
anomalies interpreted are draurn at various horizontal and vertical scales
so that they all have about the same uidth and height (niqs . 4,3 & 4.4).
The figures illuetrating the interpretation of magnetic anomalies
shour the corrected field profiles on an arb-itrary base level¡ above the
calculatecJ theoretical profiles, the models, and the geology. The
base level for the theonetical profliles is common uith the ground surface
for the models. The horizont,al axes and vertical axes beloul ground
level are soaled ín metres, uhile above groUnd level the aXes are
scaled in gammas. The inset clocks shou the direction of Tor, the
orientation of the effective total magnetic field (cf, Guy, 1963), and
the directÍon of J I e the interpreted apparent magnetization responsible
for the magnetic anomalies. It uiII be seen that in most cases the
direction of J' is quite different from Tof. The theonetical anomalies
uere calculated r.uith a grid interval appropriate to gÍve a clear picture.

-59-
The grid interval is indicated near each of the theo¡etical profilesi
4,6.2 Geolocy of the louler pa¡t of the Tapley HiIl Formation
Thomson et aI. (1964) described the Tindelpina Shale fflember
of the Tap-ley Hill Formation as a bJack carbonacgous pynitÍc shale
about 200 ft (oo m) tnicX uhich frequently contains thin interbeds of
carbonate. The bod is a macker unit u¡hich persists over the ulhole of
fhe Adelaide Geosyncline except for rare rpinch-outs I due to local
erosion (Parkln, 1969¡ 0haptel 2). It lies at the base of the
Tapley HilI Formation uhich Ís a silty unit, and lies Ímmediately above
the Yudnamutana Subgroup, urhich on 0RR0R00 mainly consists of the Appila
Tillite, a glacial quartzite unit. From the authorrs experience, the
true thickness of the TindelpÍna Shal-e lYlember is often hard to ascertain
in the flield because both iü and the lourer part of the Tap1ey tlill Forma-
tion often do not outcrop and are thinly covered by soil. The Appila
Tillite usually forms prominent ridges uhich can be easily traced both
on aerial photographs and on the ground.
Figure 4.2 shours a stratigraphic column for the Tindelpina Shale
fYlembe¡ in the north-east of 0RR0R00, compiled by the author uith the
help of tuo geologists of tht¡ UnÍversity of Adàlaide, Dr. V. Gostin and
[Yl¡. J. Sumartojo. Binks (fgZf) stated that the TindelpÍna Shale con-
tains minor pyrrhotite; in the anea studied by the author no pyrrhotite
uas observed. The main indication of sulphides Ín the area studied is
tho presence of Iimonits pseudomorphs after pyrite in the surface nocks.
In rare cases limonite octahedra after magnetite are present. The
ptesence of these octahedna is some of the strongest evidence avaÍIable
from geologícal studies that the Tindelpina Shale fYlember contains

-60-
strongly magnetic mine¡als. In additÍon magnetic separation of
cuttings from a dnÍll hole into the shale at the Southern Cross ffline
on CgpLEy revealed a trace quantity (O.Of%) of maqnetite (Appendix 44,
Sample C063). The evidence from the magnetometer data is that
probably L/" ot mone of magnetite exists betour the depth of magnetic
ueathering.
Interpneted vertical field maqnetometer profil es across the4.6 13lo-ure-t l-epley- Ull mepIre-tie Þed
4.6,3,L Prcf¿lE-É9-
Thisprofile(Fig.4.3(b))i"perhapst'hekeytothe
shape of anomalies due to magnetic sedimentary beds in the anea. It
shouls a broad, nearly symmetrical anomaly (I) together uith a narroueD
anomaly (Z) on the up-dip síde and numerous noise peaks (".9.3r4r5),
most of uhich have the same sign as the broad anomaly. Many of the
ground profi}es aro veDy similar to Profile 68. A model and the
corresponding theoretícal anomaly are shoun beloui the fíeld profile.
The model uhich accounùs fo¡ the anomalies consists of a body uith an
apical u¡idth of 180 m at a depth of lB0 m, out of uhich extends a body
ulith an apical ulidth of 30 m at a depth of 30 m. An alternative model
for the deeper of the truo bodies uould be several thin closely spaced
magnetic sheets. Houevêr, it is not poesible to resolve them' Because
the anomaty sign is opposite to that expected if inductive magnetism
acted alone, Ít is apparent that the source is Demanently magnetized.
As the anomalies ane symmetrical, the magnetization must lie close to
the ptane of bedding. Magnetization in the dip plane for the model
(i.e. the ptane nonmal to the trace of ouücrop) ie lt = 2.6 x 10⁻³
coQr9. units.

-6I-
The model probably approximates the form of fhe magnetic beds.
At thís tocality it appears that magnetic minerals are uleathered to a
depth of 180 m except in a ùhin bed urhich extends closer to the au¡face.
The noise peak (3) on the dou,n-dip side of the broad anomaly may
be caused by a very thin magnetic bed at a depth of 6 m. A narloui
anomaly or noise peak often occurs at this position on the other profiles
across the louler part of the Tapley HilI Formation. lllhere it is absent
iü is probable that the thin source bed is deeply ueathered. Peaks (4)
and (5) ruy have a similar source to that suggested for peak (S).
4,6.3,2 Profile 765
This prof ile (Fig. 4.3(a)) shous tr.lo partly resolved
anomalies (LrZ) uhich make up a b¡oad anomaly. The peak of anomaly (2)
is disguised by noise. The peak of anomaly (1) is sharper than expected
for a síngle flat topped source. A three body model uras constructed to
account for anomalies (L) and (z). The major contribution to the
theoretical anomaly comes f¡om trLlo deep sources (apical uidth 60 m¡
depth 120 m, and apicat u.ridth 55 me depth 110 m). The sharp peak ofl
anomaly (f) ís not lully undenstood and modelling to account fo¡ it is
difficult. tYlodelling uith a third source (depth 30 m) partly accounts
for the sharp peak.
Anomalies appear to be symmetrical and the sign is opposite to
that expected if inductive magneLism acted alone. Therefore the
sourcea are remanently magnetized and magnetization lies close to the
pJ-ane of bedding. An estimate of magnebizatÍon in the dip plane fon
the modeL is Jr = 4.O x 10-3 ooÇrs. units.

-62-
The model probably approximates the form of magnetic beds at the
Iocality. It appears that the beds are u¡eathered to a depth of
110-120 m sxcept for one or more very thin beds uhich extend closer
to the surface.
4.6,3.3 Profile ?4
Thís profile (fig. a.3(c)) shours a broad anomaly urith a
peak rather too sharp for the source to be a singler thick¡ flat topped
body. The anomaly is similar to anomaly (I) on Profile 765. A tt¡o
body model can account for the anomaly. This consists of one body utith
an apfcal uidth of I05 m and a depth of 55 m and anothsr rlith an apical
r.uidth of I0 m at a depth of 23 m. The depth and dimensions of the thin
sour6e are Very approXimate because ùhe residual anomaly separated
from the main peak for this profile is subject to considerable EDDoD¡
Houever, the model shorus the same form as those for Profiles 765 and 68.
An alternative model ulhich r.uould equally u¡ell account for the anomaly on
Prolíle ?4 consists of several thÍn, closely spaced sources. Yet
another consists of a thick body urÍth a trlangular top surface nather
than a flat surface.
The model probably approximates the general form of magnetic beds
at the locality.
The anomaly is symmetrical and is opposite in sign to that expected
if induction acted alone. The¡efore the sourca ís remanently magnetized
inadírectionc].osetotheplaneofbedding.Anestimateolmagnetiza-
tion in the dip plane of the model is Jr = 0.9 X I0-3 coQos. Units.
ù
¡
ùr
ü

;63-
4.6.3.4 Profíle I15
Thisprofile(rig.4.3(d))shorL,rsabroadanomaly(})
and a poorly defined broad anomaly (Z) on the left side. Noise is
random and can be filtered off in this case. Becaqse anomaly (Z) ie
not uell defined even aftar fíIterifrg and doulnuard continuation, the model
constnucted only accounts fol anomaly (f). The model consists of a single
thick source uiith an apical uidth of 160 m and a depth of 80 m' Douln-
u;ard continuation indicated that a tuo body model urould also explain
anomaly(1).Theuidthofthesinglebodymodelisbaeedonthe
¡esults ol continuation.
Anomaly (I) j.s symmetrical and onposite in sign to that expected
if inductive magnetism acted al-one. Therefore the source is remanently
magnetízed and the direction of magnetization Iies close to the plano
of bedding. An estímate of magnetization in the dÍp plane of the
model is J¡ = 0.25 x 10⁻³ crÇosr Units. If a tuo body model is used to
account for anomaly (t), the magnet'ization is approximately foun times
this va1ue.
Themodelprobablyapproximatesthegeneralformofmagneticbeds
at the locatity. It appears that the beds ate rnagnetically rueathered
to a depth of about 80 m.
4.6 r4 CUSS o of rT ma ne bed
ThereisevidencethattheLoulerTapleyHillmagneticbed
revealed by aeromagnetic interpretation consists of tr¡o or more thin
magnetic beds uithin a zone 250 m ulide. The loulost' of these Lies in the
Tj.ndelpina shaLe, tylember (see Fig. 4.3). Thus the u¡hole of the 250 m
thÍck magnetic zone does not exactly correspond urith the Tindelpina shale
tylembr as def ined by Thomson et aI. (fSO+). Interpretation of magnetic
anomal_ies indicates that the upper part of the bed is magnetic at a
I
Þr
f,

_64-
depth of about 80-200 m belour the surface'
Because of the great depth of magnetic ureathering of the beds it
is not possible to resolve the fine details fuIly ruith the magnetic
meLhod. Drilling uiII be requirecl to find uhether the magnetic source
consists of a single thick bed ueathered to give the appearance of
several thin sheets or uhother the source is made up of several thin
sheets ueathered to various depths '
untiL fresh rock is available for study the problem of ulhether the
mineral causing the magnetic anomalies is rnagnetite or pyrrhotite cannot
be ¡esolved. The available evidence indicates that magnetite is present
but Lhe quantity is difficult to ascertain. Empirical reLationships
bntueen magnetíc susceptibility and magnetite content (GranL & tllest,
1965, pp.36?r368) are not directly applicable because the beds are
remanently nagnetized. If the 250 m thick magnetic zone discussed
above is treated as a single thick bed (cf. interpretations of Profiles
115 & 68), the equivalen¡ magnetic susceptibility Ís 400-41000 x 10-6
coÇos. units" If treated as seve¡'l thin beds (cf. interpretation of
profile 765), the susceptibility of individual beds may be 81000 x 10-6
crÇos. units or higher. It is likely that the ratio of remanent mag-
netism to induced magnetization is tuo or more (sec Chapten 5). Thene-
flore the true susceptibilÍty is probably less than half the equivalent
susceptibility¡ o.Çr about 2OO-2r000 x 10-6 c.Çrso units. From the
¡elations in Grant and lJJest (op. cit.) the quantity of magnetite
present in the Loruen Taptey HiLl''roagnetic bed could be 0.1'-1'0%'
The quantity of pyrrhotite required to produce susceptibilities in
the range ZOO-2.000 x 10⁻⁶ c.g.e. units urould be 1-10% or more
(Jakosky, 1950, p.154). Although it is possible that pyrrhotite
þ-

-65-
contDibutes to the magnetic response of the Tindelpina Shale, it is
more likely that a small quantity of magnetite causes the anomalÍes.
4,6 .5 Geoloqy of the Holouilena Ironstone
The Holoulilena lronstone is described by Thomson et al. (fS6+)
from PARACHiLNA as a hemabite siltstone, urith lenses of dolomite and
greyuacke, uith glacial erratics, total1ing 400 ft (f20 m) tnicX.
A bed of hematite and magnetite siltstone rLlhich can be traced for 20 km
near the base ofl the Yudnamutana Subgroup in the north-east corner of
0RR0R00 is consÌdered by Binks (fgZf) to be equivalent to the HolouriLena
Itonstone on PARACHILNA. Measurements on the ground by the author
indicate that in the north-east of 0RR0R00 Èhe Holouilena lronstone is
less than 50 m thick and that of this thickness more than half consists
of interbedded siltstones. A mineralogical study of tuo small samples
containing 50% iron oxides by volume (Rppendix A2) indicated that mag-
netite íè alùering to marti'Le, The susceptibilities measured for tire
samples (O.Ott-0.058 crÇrs. units) are probably one-half those of un-
altered equivalent rock at depth. Ttuo other samples gave the values
I00 x L0-6 and 400 x 10-6 c.Qos. units fol susceptibility. Although
heavily stained, these samples contained l"ess than tOl iron oxides.
4.6 ,6 Interpreted maonetonreter pnofiles across the oloulilenaIrons tone
4.6.6.1 Profile I2I
prof Íle l_2I (Fig. 4.4(a)) ulas taken across boldly out-
cropping Holouilena lronstone. The complexity of the magnetic anomalies
is typical of that expected over a dipping layened tabular source
r¡|rich is magnetic at the surface. 0n Figure 4,4(a) the zone over
ulhich ironstone crops out is indicated by a heavy line. This part of

-66-
the profile uas re-fead at 1 rnetre intervals to proulde detail of the
anomalíes 11 2 ancl 3, bUt the detailed p¡ofile is not incl-uded here.
The detailed r¡ork shoued that magnetic anomalies are displaced tou¡ards
the doun-dip sicle ofl magnetic outcrops. ThUs although surface locks
ale strongly magnetic, material beloul the surflace is even more strongly
magnetic.
The model uhich accounts for the field profile consists of three
tabular bodies urith apical ulidths of 2 m at depths of 3 m, 3 m and
6 m (for anomalies lr 2 and 3 respectivel¡r) and a thicker body u.rith an
apical rLridth of 48 m at a depth of 24 n. It ulas found that the model
could be built up assuming the sources are influenced by inductive
magnetism acting alone. Figure 4.4(a) indicates that the direction
of magnetization is almost normal to the plane of bedding of the
sources. An estimate of the intensity of apparent magnetization of the
thick body in the model is Jr = 0.03 crQrs. Unitst cornesPonding to a
magnetic susceptibility of 0.058 crÇrs. units. The coD¡.espondence of
this value r.uith a measuDed susceptibílity is coj.ncidental. At this
locality it appears that the rocks preservs a stnong component of
remanent magnetization uhich lÍes close to the plane of bedding'
Because it also Iies close to horizontal (nppendix 42, Sample AAHI)
the remanent magnetism has little effect on the anomalies "
UJhile it is considerecl that the mociel apploximates the form of
magnetic beds associated urith the HolotuÍlena Ironstone at the localiüyt
from the magnetometen data iü is not possible to resolve ulhether the
souDce of anomaly (4) is a single thick body as shourn on Figure 4'4(a)
or uhether it is a muLti-layerod body.

-67 -
4.6,6.2 SJgIåI"--I?É.
This profile (Fig. 4.4(b)) shous a bnoad anomaly (1) ulith
a narrou¡ anomaly (Z) on the up-dip side" Anomaty (2) ties close to an
outoropping inonstone bed 2 m thick" Houever, as for the case of
profile 121, the anomaly lies on the dourn-dip side of the outcrop" Be-
cause the anomaries are not of the shape expected if inductive magnetism
acted alone it is evident that remanent magnetism is important' The
model constructed to account for anomalies (1) and (2) consists of a
tabula¡ body urith an apical uidth of 23 m aL a depth of 23 m and a tabular
body ulith an apical rlidth of 4.5 m at a depth of 4.5 m. An estimate of
magnetization in the dip plane of the thick bed of the model is Jr =
0.1 c.S.s. unÍts.
4.6.7 Discuss ion of maqn etic beds assoc iated uit h the HolouilenaIronstone
The magnetic data indicate that magnetic beds in a tot,al thick-
ness of 60 m are associated uith the Holou.rilena lronstone" Some of
these beds are probably very thin and come close to the surface, but
the top of the thickest bed lies about 23 m be]ou the surface. Both of
the interpretations indicate that a thick maqnetic bed overlies one or
more thin beds " Some of the thin beds are maqnetic at the surface but
pass doun-dip inùo even more strongly maqnetic material. There are no
distinctive ironstone beds exposed at the surface u:hich cof,respond to
the strongly magnetic bed aL 23 m depth '
To the south-ulest of the area uhere Profiles l2l and 126 uere
taken the vertical field anomafi-es at the equivalent posítion to the
Holowilena Ironstone are positive. Here the beds dip to the south
rather than to the north and north-easL as in the vieinity of Profil-es

-68-
LZI and L26. Thus the siqn of anomalies is a function of geoì-ogical
dip (see Chapter 5 for discussion of this feature in connection uith
the Louer Tapley Hill magnetic bed), and it is probable that the ¡atio
of remanent to induced magnetization is up to tu.ro or mone. Tlre
susceptibility of the maqnetic bed is close to 0.06 c.9.s. units.
This suscept,ibility could be caused by approxímately 2O/" nagnetite in
sedimentary rocks (Grant & UJest, 1965r p.368)'
4.7 Discuss ion of maane tic beds
The single magnetic beds indicated by interpretation of the aero-
magnetic data can often be resolved into several beds by use of ground
magnetics. Thus each magnetic betl predicted from aeromagnetics probably
consists of a zone of thin strongly magnetic beds separated by less
strongly magnetic material. The totaL thickness of the Louer Tapley
Hill magnetic bed is about 250 m. From other studies (not presented
in the thesis) of ground anomalies associated urith the Ulupa Siltstone,
it appears that 250-300 m is usually the maximum thickness of the zones
of magnetic st¡ata.
Ground magnetic ansmalies over Adelaidean sediments have a very
characterÍstic shape. They have a broad component attributable to
deep rnagnetic material and a complex ar'1'angement of sharp anomalies
on the Up-dip side of the broad anomaly, attrÍbutable to remnants of
the deep material.
The depth of magnetic uleathering is variable both urithin each
zone of beds and along strike. It appears that 200 m is about the
maximum depth of ueathering, although it is a common feature thaù
various thin beds are only uleathered to depths of from 5-30 m ot less '

-69-
oftentheshalloulueatheredbedsappeaDtoextendrJpfromadeeperthick
magnetic bed. This feature has a close parallel uith the uray in uhich
locks break doun near the surface; ¡esistant sttata outcrop' less
resístant strata decompose to gneat depths ' In the areas studíed
thereisalittleevidencetocorrelatemechanicalbreakdounulith
magnetic uleathering in the case of the Holotuilena lronstone magnetic bed'
and the Ulupa Siltstone magnetíc bed (the bed urith 600 gamrna aeromagnetic
anomalies - Fis. 3.5).
InallofthegroundstudiesoveDmagneticbedsthereu'ereno
magneticanomaliesulhíchcouldbeunequivocallyduetoinductive
magnetismactingalone.Rather,itappearsthatingeneral,remanent
magrretismÍsmoreimportant.BecauseDemanenùmagnetizationis
important and magnetic beds are interlayered uith rueakly magnetic
materia! estimates of susceptibility from magnetic interpretation aDe
subject to great Brlors, possibly LOOÍ" oD mole. Houever, it appears
that the magnetic susceptibility of magnet'ic beds is probabry rr000 x
10-6 c.Ç.s. units or more above tho backgroUnd sr'ts6eptibility'

-?0-
Chapter 5
REIYIANENT MAGNETIS{YI OF THE LOIIJER TAPLEY HILLÍYIAGNET IC BED
5.1 Introduction
The most uridespread and consistently occurring maqnetic bed in the
Adelaide Geosyncline is the one near the base of the Tapley Hill Fonma-
tion. For ease of cJiscussion in this chapter the maqnetic bed uill be
referred to as the Lourer Tapley HiIl magnetic bed. It is for this
magnetio bed that Tipper and Finney (fOOO) suggested that an element of
remanent magnetization uas acquired prior to folding, such that the
observed magnetic anomalies are a function of geological dip' They
sUggested that the proposed pre-folding component of remanent magnetism
l-ies c-lose to the plane of bedding. Uliùh such an arlangementt reversals
in sign of anomalies actoss folds are to bre expected. Interpretation
oî total field aeromagnetic contour maps over the uhole area of the
Adelaide GeosynclÍne indicates that it is a common feature that
anomalies over the magnetie bed on adjacent limbs of fold structunes
are either opposite in sign or of different amplitude (figs. 5.I & 5,2),
From a detailed analysis of aBromagnetic flight charts and g¡'ound
magnetometer profiles on 0RR0R00 it uas found that reversals in sÍ9n
of anomalies ovel magnetic beds occur at several positions in the
stratigraphic column. tYlost of the reversals recognized have the same
sensg as the reversals over the Louer Tap]ey HiIl magnetic bedt viz'
Holouilena Ironstone magnetic bed, magnetic bed betrleen the Tarcouie
Síltstone and ll¡aukaringa Siltstone. Thus Lota1 field anomalies ovec
beds dÍpping to tfie north, north-uest or urest are often of positive
sign, uhile beds dipping south, south-east or east are often of
negative sign. A similar sign relationship holds for vertical field

-71 -
anomalies. Vert,ical field anomalies over beds dipping to the north'
north-u,est or ulest .re oft"n of negative sign¡ and ovel beds dipping
to the south¡ south-east or east, are often of positive sign. fÏloDe-
ovex, ít ls usual that the vertical field anomalies are symmetrical or
nearly symmetrical independent of geologicat dip ulhich is indicative
of the magnetization lying close to the plane of bedding.
To learn more aboUt the suggested pre-folding component of
remanancç, detailed ground magnetometer Ij'nes u,ere tun on tulo plunging
fold structures south-r.uest of lljaukaringa (see Fig ' 5'2) uhene it
appeared likely that both Lhe dírection and inclination of the remanent
magnetÍsm associated ulitþ the Lourer Tapley Hill magnetic bed could be deter-
mined from the anomalies. The ground uork uas concentrated in an area
uhere anomalies change sign across fold structures, rather than ulhere
the anomalies have the same sign but different amplitude. It ulas
expe6ted that a ground study nea¡ the zone of sign change of anomalies
ulor1ld give information on the azimuth of the lemanent magnetization. The
basis of the interpretation is outlined in section 5.3" The author has
seen no report in the literature in urhich both the inclination and azi-
muth of a pre-folding component of remanent magnetízation relative to
the plane of bedding of sediments have been derived from magnetic
anotnalÍes by the method discussed in this chapter. Reported uork is
often similar to that discussed in Chapter 4 ulhere the component of
magnetization in the dip plane is found (".g. Bath, L962) '
The ulork done has a parallel in Grahamrs tests for stabilÍty of
natural r€manent magnetism (frlnm). Gtaham (fS+S) stated that one of the
best tests for stability of NRIYI is to find ulhether results of palaeo-
magnetic tasts from tu.ro limbs of a fold give the same rÞmanent vector

-72-
oríentation urhen the fold is mathematicarry unforded' Another test
for stabilily comes from the self consístency of palaeomagnetic results
ovgr a ulide area. Because the interpretation of magnetic anomalies
lndicates that Adelaidean sediments are deeply uleatheredr and because
palaeomagnetic testing on surface rocks in the Adelaide Geosyncline by
Briden (fSOS, 1967) f,a¿ disappointing results, it uras decided to
confine the study of remanence to large magnetic anomalies.
5 ¿2 Previous Palaeomaqnetic u.lork on Adelaide Svstom sodiments
Briden (tSA+, 196?) discussed results of palaeomaqnetic tests on
surface samples and drill cores from several sites in the Adelaide Geo-
syncline. He collected samples from areas u.rhere he considered that
metamorphism has been uleak; subsequent study by the author indicates
that the beds tested do not produce observable anomalies on the aero-
magnetic maps in tire area tested. Thus the rocks sampled may be
oiassified as uleakly magnetic in comparison to the magnetic beds dis-
cussed in Chapters 3 and 4 of this thesis.
Briden (op. cit.) found it difficult to isolate a primary component
of NRM" Samples from the upper part of the Adelaidean, uí2. ìllilpena
Group¡ and the overlying Carnbrian sediments have NRtYl consistent ulith
a lYlesozoic on early Tertiary age. He suggested that the dominant
NRtyl is a secondary magnetization uhich probably nesults from a surface
effect or metamorphic effect.
It is to be expected that in the parts of the Adelaide Gaosyncline
uhere meüamorphism has been strong the main lJRfll detected uiLl be a
secondary component. Therefore it is unllkely that a pri.mary com-
ponent acquired at the time of deposition of the AdelaÍdean sediments

-?3-
ulill be detected. Nevetthelu"=r ar'ry informatíon about a pre-folding
component of remanence for Adelaidean sediments is still of interest.
5.3 Basis of interpretq-tíon
The influence of remanent magnetism on magnetic anomalies over
dípping tabular magnetic bodies is ure1I knoun and intenpretive schemes
have been devised to account for it (e,9. Sutton & fYlumrne, 1957; HaIIt
1959; Gayr 1963; Poruell, 1965; Koulomzine et aI.¡ 19?0)'
Consider the case of strong temanenL magnetism acting on a long
uniformly magnetized thin magnetic bed of constant thickness and depth
of ueathering, and such that the direction of remanence lies in the
plane of bedding. Fon the follouing discussj-on iü is assumed that
the effect of inductivo magnetism is negligib1e. The amplitude and
sign of vertical field magnetic anomalies over the dipping bed are
dependent on the magnitude of the component of the remanent magnetiza-
tion in the dip directione i'8. the apparenb magnetization. This
cornponent is the only one important 1n producing vertical field anomalies
over the bed. Thus if the component in the dip direction is zero,
so the anomalies are zero, and if the component in the dip direction
is maximqm, then the anomalies are a maxímum, urith the sign dependent
on Uhether the vector direction is up-dip or dorln-dip. Follou-ting the
oonvention that the earthrs field lines point upuards in the southern
hemisphere and dournu¡ards in the northern hemisphere (cf. Gay, 1963)t
then uJith the vertical field magnetometer, neqatÍve anomalies are
lecorded over the remanently magnetized bed if the vecton direction is
up-dip, i.e. pointing up out ofl the ground. lllhen the vector points
down-dip vertical field anomaLies are of positive sÍ9n.

-74-
TotaL field anomalies measured in areas other than at the poles
uill not Ín general be symmetrical over. a bed magneLized in the plane
of bedding. In the southern hemisphere, over steeply dipping beds,
the anomalíes u¡ill be mainly positive if the vecto¡ is up-dipt and
mainly negative if doutn-diP.
If the remanently magnetized bed discussed above occuxs in a pene-
planed dome sttucture, then by measuring the amplitude and sign of
anomalies around the structure the direction of the rernanent vector
can bc deduced. Taking the case of anomalies changing sign along
strike from positive, through zero amplitude, to negat,ive, then urhere
the anomaly amplitude is zero the remanent vector points along the
geologÍcaI strikc tou.rards the reglon ulhcre anomalíes are of negative
sign" For a thin magnetic bed uith a constant depth of ureathering and
strength of remanent magnetization, anomaly amplitudes plotted against
strike direction around a closcd structuf,e uill closely fÍt a sinusoid.
The area uhden the anomalies rLrill also cl-osely fit a sinusoid. Ampli-
tudes and areas under anomalies are independent of the geological dip
of the bed.
For tuo or mote identícal thin magnetic beds arranged parallel
ancl close together (in the structure discussed above), and uhich
produce partly resolvecl anomalies, the sum amplitude uil1 depend on
the geological dip, because uith lou dip the top surface of the bcds
are lurther apart than u¡ith steep dip. Thus the anomalies u¡Í11- be
bette¡ resolvecl ulhen the geological dip is loul" Houever, the total
area under the anomalies is independent of dip and u¡i1l closely îit a
sinusoid íf plotted agaÍnst strike direction around the closed structure.
If thc magnetic becjs have finite thickness, then anomaly amplitudes aDe

-75-
further dependent on dÍp because the magnetic charge density on the
top surface is decreased as the apical uídth increases. Houeverr once
again the area under the ourves plotted against strike direction shoul-d
lie close to a sinusoid.
If the remanent magnetic vector is oblique to the bedding planc,
then thc interprotation problcm to find thc vector dÍrection ís morc
complcx but still solubla, fn this casc tho shape of thc anomalies
uiII not usually bc symmctrical as for thc simplo case discusscd above.
Interpretation problems arise if inductive magnetism is important
and if a second component of remanent magnetism has been acquired in a
direction other than the plane of beddinq since foJ-ding occurred. To
fuIIy account for these influences uou.Id be ímpossible uithout taking
measurements on oniented samples uith palaeomagnetic apparatus.
Hou:ever, if the influence of the second component of remanence or
inductive magnetism is not too strong, as appears t'o be the case for the
area studied, simple approximations can be made to account for them and
the detailed study ofl rock specimens can be avoided.
5.4
Figure 5.3 shous the verticaL field anomalies over thc Lor.uer
Tapley Hill magnetic bcd on tuo adjaccnt noscs of a plunging antÍclinal
stnucture near lllaukaringa. The profiles shoul the noj-sy field data
nather than emoot,hed idealized anomafies, to illustrate that at the
outset there is a problem in interpreting the data. The anomalies
change sign from positive ulhere bcds dip southuardsr to negative urhere
beds dip northurards. The infl-uence of inductivo magnetÍsm appears to
be Very much lcss than remanent magnctism. If the contribution of

-76
induction ulas important, the anomalies over south dipping beds (positive
anomalies) could be expected to be of louler amplitude than over north
dipping beds (negative anomalies), u.rhen considered in combination u¡ith
the influence of lemanence uith constant azimuth in the plane of
bcdding" Houever the opposite occurs. The positive anomalies are
of higher amplitude than the negative anomalies. The strongest of
the positive anomalies, viz. Profiles 65s, 68, 69r 445 and 645r are
nearly symmetrical in shapc and this indicates that magnctism is
closs to the plane of beddíng (probably uithin j fOo). The negativc
anomafies are more complex and their shapes are more strongly influenced
by noise, but in this area and other parts of the Adelaide Gcosynclinc
they shoul stronq influence of a eomponent of magnetization close to
the plane of bedding, viz. Profiles 60N, 62 and 65N. It is considered
that the influence of inducti-ve magnetism can be neglected in interpre-
tation of the anomalies "
tuhile interprctation of a simple theoretical case likc that out-
lined in section 5.3 is straightforuard, interpret'ation of the field
data is not.
For the particular application of interpretation required in this
chapter, perhaps the mosb difficult problem ujas that of accurately
mapping the magnetic beds. The most important factor required to
determine the direction of remanent magnetization is the strike of the
magnetic bed near the point of sign change of the anomal-ies. It uas
near this negion that the complexity of the anomalies largely prevented
accurate mapping. It u,as necessary to interpolate from ulhere anomalies
uere uelL clefined into the region ulhere t,hey uere not. UncertaÍnties
in ttre depth of magnetic ueathering, bed thickness and strength of

-7'7 -
magnetization made interpolation difflcult. Sor¡te guidance uas taken
f¡om tracing outcroPPing beds '
It is considered that the main features of the field profiles can
be explained by considering a pro-folding componcnt of remanence in the
plane of bedding toget,her ulith a second component urhich has had an
appnoximately equal influence both on the positivo and negativc anomalies '
This sccond component appears to be directed dounulards close to layering
in the magnetic beds. The basis for proposing the existence of this
second component of temanence ruith such epecÍa] directional properties
comos partly from tho ground ulork in this and other aDBas¡ arìd partly
from the picture provided by the aeromaqnet1c coverase (discussed further
in section 5.6). l¡here dips are 1ou around the noses of the anticlinal
structures, the anomalies shou.l evidence of tuo parallel sources' ThUs
in this area the Lor¡en Tapley Hill magnetic bed appears to contain tulo
magnetic beds (cf. Chapter 4)" For analysis of the remanent vector
direction the magnetic sources urere assumed to lie in a single thick
rnagnctic zone (see Fig.5.3). Furthermore the beds uere assumed to be
uleathered to the same depth, both r.uithin the zone and alonq strike
(depth of rleatherinq estimates from the best anomal-ies 1ie in the range
100-200 m).
Figure 5.4 shous amplitUde and areas of hand smoothed anomalies
plotted against geognaphic strÍke direction of the tnagnetic beds'
Data fnorn both structunes are combined on the one plot. Sine curves
have been fitted by hand to this data. It is considened that the
azimuth of the pre-fo1din9 plane of bcdding comPonent of remancnt
magnetism is gÍven by the zero amplitude and area points on the sine
cufves (dashed base line). The adjustment of base level to zero

-78-
accounts for the proposed second component of rernanence. It is
estimateci that the clecl-ination of the pre-fotding plane of bedding
component of remanent magnet,i-sm is 1350 geographic. The error bounds
are probably about ! ZOo. Thus in the unfolded beds a linear rod
oriented in a direction of I35o uould have north magnetic poles on its
south-eastern end.
FoId patterns in the southern part oF the Adelaíde Geosyncline
shou concavity .out,h-eastrLlards, indicatinq that tectonic stresses acted
from Uris direction. In vieur of this, the folding may have migrated
'bhe direction of pre-folding r'emanent magnetism from about 1200 (9eo-
g::ap¡ic) Uo its presently calculated direction of l-35o (geographic) '
5 . s --$-!-r.cgs,!b.-ql-t9.9 !i tu-t-i,orl
An estimate of the strenqth of maqnetization in the Lower Tapley
HiIl magnetic bed can be made frorn the verticaÌ field magnetometen
profij-es in the lllaukaringa area. Because the amplitude and sÍgn of
anomalies cþange across anticfinal structures, it is necessary to con-
sider proliles over both north and south dipping beds. Tuo profiles
are considered, 68 and 60N on Figure 5.3. The anomaly on Profile 68 Ís
discussed in chapter 4 and the estintate of strength of magnetization is
Jt = 2.6 x I0-3 c.g.s. units, directed dourn-dip. The best dofined
positive anomaly on Figure 5.3 Ís on Profile 60N and this appears to be
the partial reso-l-utÍon ofl anomalies due to tulo on more thin parallel
beds over a total apical uidth of I?0 m. Each of these probably lies
at a depth of about 45 m. An estimate ofl nagnetization for a singla
thick bed made after continuing the partty resolved anomaly to 135 m
is Jt = 0.6 coÇ.s. units. Here the distance from source to maqneto-
rnetec is the same as for the source of the anomaly on Prcifils 68.

-79-
Because of the uidespread occurrence and simllarity t'rf magnetic
anomalies over the Louer Tapley Hill magnetic bed bot'h in the locality
of ground lines discUssed in this chaptere arìd other parts of the
Adelaide Geosyncline, it is reasonable to assume that' the overall
thickness of the bed is fairly constant. In support ofl this the
intenpreted total thicknesses of the magnetic beds on Profiles 68 and 60N
aDB appDoximately the same. Therefore ule can use the interpreted
strengths of magnetizatíon from Profiles 68 and 60N to gÍve an approxi-
mate estimate of the strengt,h of the components of rnagnetization acquired
before and after folding (viz. JI and J2 respectively) in tne Uaukaringa
area.
Thus
And
JL+J2 =
-Jl+J2 =
JI=
J2=
2.6 x 1o-3 crÇ.s. units
0.6 x I0-3 c.S.so units
1.0 x 10⁻³ crÇ.s. unite
1.6 x 10⁻³ cog.s' units
Thus in the ujaukaringa area the pre-fotding component of remanent
magnetization has an intensit,y of 1.0 x 10⁻³ c.Çrs. units and the post-
folding component has an intensity of 1.6 X 10⁻³ c.9.s. unj-ts. These
figuresapplyforamodelassumedtoconsistofasinglemagneticbed
about 200 m thick. In vier¡ of the diacussion in section 5'6 it is to
be expected that the strength and ratio of the tulo components of
remanenBe ulill be different at different localities. Houlevert the
estimate rnade above serves to establish the order of síze of the mag-
netization.
5.6 er tion o anoma
Jhe map of total fÍeld aBtomagnetic anomalies (Fig. 5.I) shouls
three main sets of chatactenistie areas (eee Fig' 5'2)t

-80-
c erl-s c1
Areas uhere sout'h or east dipping beds have negative anomalies
andadjacentnorthoru¡estdippingbedshavepositiveanomaliesof
lou¡er amplitude (considered previously in this chapter) '
Characteristic 2
-ÆAreasuJhefesouthoreastdippingbedshavenegativeanomaliesof
higher amplitude than over adjacent north or uest dipping beds'
Characteristic 3
Areas uhere east and urest dÍppÍng beds have positive anomalies
buttheamplitudeoveruestdippingbedsusuallyexceedsthatovereast
dipping beds.
Verticalfieldgroundmagnetometerr¡orkinareasshorrringthese
characteristÍcsproducedsymmetricalorneaclysymmetricalanomalies
Índicativeofmagnetizationclosetotheplaneofbedding'
TJremainfeaturescanbequalitativelyexplainedonthebasisof
three factors:
(1) A component of remanent magnetism close to the plane of
beddingandofconstantazimuth,pnoducedbeforefolding.
(Z) A component of remanent magnetism close to the plane of
beddingproducedafterfoldÍnganddirecteddorun-dip.
(3) Inductive magnetÍsm and/or a third component of remanence
di¡ected upulards (probably close to the plane of bedding).
Factor (1) produces negative total fÍeld anomalies over east or
south dipping beds and positive anomalies over uest or north dipping

-81 -
beds. Factor (2) produces anomalies of negative sign and facto¡ (3)
produces anomalies of mainly positive sign" If amplitudes A(I) , A(Z)
and n(3) are assigned to the total field anomalies produced by the
three factr:rs, then the three main sets of characteristics can be ex-
plaÍned as follou¡s s
Characteristic 1
n(r)>n(z)>A(3)
Charactaristio 2
A(2) > A(1) >A(3)
Chanacùe¡istic 3
A(s) >n(r) >n(z)
The possible geological implications of this interpretatíon are
manifold.
The t,ime of acquisition of the interpreted pre-folding component of
remanence is not knouln. The main folding in the Adelaide Geosyncline
occumed during the Louer OrdovÍcÍan (Parkin, I969e p.L06)" Therefo¡e
the pre-folding component of remanence must have been acquired in the
Louer 0rdovician or before" The palaeomagnetíc data for Australia are
incomplete fon times before 0rdovician (e.Ço sê€ Irving, L964). It is
qulte possible that the remanence results from a rmoderate temperature
viscous remanent magnetÍzation I acquired uhen the beds r.uere deeply buried
beneath a thick sedimentary pÍte (cf. Irving & Opdyke, 1965). A thenmal
mechanism appc¡aDs more likely than a mechanical oner s.g. Detrital
Remanent lYlagnetism (cf. Nagata, L962), because the pre-folding remanence
associated ruith the Louer Tapley H1II magnetic bed also appears to be

-82-
associated tuith other beds in the Umberatana Group, ví2. near the
boundary of the tUaukaringa Siltstone and the Tarcouie Silt'stone, and
the Holouilena Ironstone. Thus a similar effect is observed over a
total stratigraphic thickness of at least 2 kn. llJhatever the mechanism
of acquisition, the pre-folding component has survived metamorphism
associated u:ith the 0rdovician orogeny.
The proposed second component of remanent magnetism is of special
interest because, Iike the lirstl it appears to fie close to the plane
of bedding. If the second component uas acquired during or after
folding, then the ancient magnetj-c field uould probably have had to be
near vertical. It is conceivable that the magnetic minerals in the Loule¡
Tapley Hill magnetic bed are of a platy nature and l-ie parallel to
bedding planes such that the magnetic susceptibility is anisotropic
and is maximum in the bedding planes; the inclination of TRlfl in such
an arrangement ulilt tend to lie close to the plane of maximum susceptibi-
Iity (Irving, 1964r p,35)" Magnetite, magnetically separated from
cuttings of Tindelpina Shale (nppendix 44, Sample C063) u¡as of a pj.aty
nature uhich gives support to this suggestion.
0n the basis that remanent magnetism is due to thermal effects
before, during and possibly after foldingu it is possible to suggest a
mi.gratory or time-varying habit to the cantres of heating. A¡eas uhere
the pre-folding component of rsmanence is lour (e.g. Charasteristics 2 & 3
on Fig.5.2) may have been heated longer after folding than areas uhene
it is uel1 preserved ("..J. Characteristic 1). Alternatively, uhere pne-
folding lemanence is lou, heatinq may have been l-otl before folding.
It is possible that the observed differences in aeromagnetic

-83-
responsEl are assocÍated in some uay uith differences in magnetic
minerals and grain size.
5.7 Discussion
The particufar method usod in this chapter to derivc a direction
for the pre-folding component of remanent magnetism probably has
limited application. Suitably magnetized beds in structures suitable
for interpretation are probably fairly rarer although in the Adelaide
Geosyncline the method could probably be successfully applied at various
looalities to test both the Louer Tapley Hill magnetic bed and others"
Perhaps the most important aspect of the uork is that magnetic interPre-
tation in the Adolaide Geosynclino can give neu information on remanently
magnetized beds urhich are strongly ueathered near the surflace. The
information is of bulk pnoperties of a thick magnetic bed (e.g. 200-300 m)
inaccessibl.e ulithout drillÍng.
It appears that:
1. The Louer Tapley Hill magnetic bed, a feature some 250 m thíckt
is remanently magnetized near the plane of bedding.
2. The plane of bedding nemanence u,as acquired in at feast tulo
etages, one before fotding and onc (or moro) after folding.
3. The pre-folding component of magnetism has an azimuth ofl 1350
(geographic) nean UJaukaringa; this fiqure is probably valid as
far ncrth as fYlt. Painter (COClfV) and almost as far south as
Adetaide (norlnIDE) "
4" The strength of pre-foldíng and post-folding remanence neal
lUaukaringa is 1.0 x I0-3 and 1.6 x I0-3 c.g.s. units.
.i
,{
t

5
-84-
In some areas the second component ís markedJ.y stronger than
the first (viz. Area 2, Fig,5,2).
In one anea the influence of inductive magnetism or a third
component of remanence is evident (viz. Area 3, Fig. 5,2)'
6.
I
Èr
I
I
t
It'
i
I
i

= 0l r-o l cf ts
. o 0) = o = NJ ts f,. fJ a = o o Ð tr a íD a (t Þ o_ TD F Ê) F. a o c' a cl- o = !) iD Ê- P'
= o = cb ú)
E Ð -l E
ìr '
-'j

-85-
Chapter 6
ANCMALIES NOT DUE TO ADELA]DEAN SEDIÍIIENTS
6.1 Introduction
An interpretation of the magnetic responsB of shallou sôurces in
the Adelaide Geosyncline urouLd not be complete tuithout considering
some of the less commonly observed features uhich, although difficult
to interpret, and nst fully understood by the authore are lmportant
to the overall picture. lUhile most aeromagnetic anomalies are probably
caused by magnetic Adelaide System sedimentse there are others rL¡hich
dÍffer in character and may be caused by intrusives or other bodies'
It is these anomalies Uhich are discussed in this chapter.
A special feature of the Adelaide Geosyncline is that feul large
igneous bodies have been found u¡ithín Adelaide System sediments. The
Iargest body knourn is the Anabama Granite (on OLARY) ulhich is 40 km
longl the second largest is a body of melaphyre and diabase 6 km
acroea in the Oraparinna Diapir on PARACHILNA (Johns, Lg72) ' Dio¡ítes
2 km across are mapped in the Paratoo Diapir on 0RR0R00 (BÍnkst 1968)
and near Bendigo Homestead on BURRA (J¡irams, L964). There afe feur
published reports r¡hich discuss intrusives in the aDBai most attention
has been given to Adelaidean scdirrêñts.
There are 30 or morc breccia structures in the Adelaide Geosyncline
ulhich Dalgarno and Johnson (rgos), Binks (rgzr) and othcrs consider to
be diapÍrs. The broccia consists of sodimentary material rlhich ulas
probably derived fÌom some of the loulost members of the Adelaido Systcm
(Coats, 19647 Binksr op. cit.). U,ithin the breccia small baeic
intrusive plugs and dykes, a feu met¡es acrossr are often found.
þ--
I
-86-
Usually these are dolerites, but in the llJalloujay Diapir (ORnOROO)
small plugs and dykes of carbonatitic rocks are recorded (Tucker &
Collerson, in press). Some diapirs have associ.ated magnetic anomalies,
and on this basis Tipper and Finney (1966) and Bennett (fSAe)t predicted
the locations of a total of eight unrr:cognized diapirs from a combined
study of aeromagnetic and geology maps for 0RR0R00 and pARACHILNA'
Their predictions have not yet been confirmed'
Auay from the diapirs most recognized intrusives are small' 0n
BURRA, Colchester (in pr6ss) reports 1,hal, 24 dykes and scven plugs of
micaceous kimberlite are knoun about 25 km east of Teror¡ie. The dykes
arc from 20 cm Lo 2 m across and are Up to 400 m long. Thc largest
pluç¡s are about 100 m across. It is only in the southern part of tho
Adelaidc Geosyncline ulhcre metamorphism has been strongestr that
intrusive bodies of a fouj kilomet¡os in length are fairly common'
For examplo, on ADELAIDE about 50 pegmatite and dolcrite dykes more
than 2 km long aro shouln.
0nthebasisoftheknoungoologyitappearsthatunrecognized
igneous bodies üo be cxpcctod in the northcrn part of the Adelaide
Geosyncline aDe probably quite small and ruill not excecd 100-500 m
across. It is to bc cXpected that magnctic bodics of this size are
difficult targets to recogníze ulith regional aeDomagnetic surveys of
thc anca becausc of bhe predominance of magnetic scdiments"
lllhile thc contout maps for thc Adelaide Gcosyncline shou several
strong circuLar anomalies of 100 qammas or notc uhich may bc caused by
large igneous intrusivc bodics ulhich lie near thc surface, it is clear
that a carcful study of fright charts and thc knoun goorogy is requircd
to reoognÍze anomalics ulhich might bc causcd by small bodics' lljhilc

_87-
the flight linc spacing of I mile (1.0 km) tor surveys in tho arca is
too uide to be sure that all magnetic bodics capable of producing
observable aeromagnetic anomalies at 150 m altitude urere crossedt the
data are suitable for a preliminary study'
The aenomagnetic records for ORR0R00 ulere studied in detail'
Numerous anomalies ulere found ulhich appear out of charactêr ulith the
response of Adelaide System sediments. tTlost of them Jie over the
plains of Quaternary sediments and appear to come from sources rlithin
or beneath the flat lying strata. The amplitudes of most of these
anomalies are less than 20 gammas '
It uas beyond the resources of the university of Adelaide to
provide drills to test the sources. one exploration comPany, fYlinerals,
tytlning and fYletallurgy Ltd., provided help on the pnoblem and drilled
six holes into the Quaternary sedjments of the lllallouay Plad,n to test
u¡hether a 40 gamma aeromagnetic anomaly u,as caused by the sediments.
6.2 The anomalies
For the study of magnetic sediments 5 gammas uas taken às the loulest
significant aerornagnetic anomaly amplitude. As discussed in Chapter 3t
there u,ere many anomalies of less than 5 gammas picked from the flIight
charts; they uere not considered significant because they might be
caused by variaticns of aircraft altitude or by topography. For the
same reason, for the uork discussed in this chapter 5 gammas uas taken
as the loulest significant anomaly amplitude'
The 1 z4? r52O scale base maps of interpreted shallou sourcc
magnetic anomalies Uere studied in conjunction ulith the qeological
fïìêps. selcction of special featuros in Area A of 0RR0R00 is a problem

.BB-
because the pattern is dominated by anomalies due to magnetic beds.
Houiever, in Area B Èhe lesponse of Adelaíde System sediments is ueak
and isolated or crose cutting features are more easily detected.
Those of particular interest are shouln on Figure 6'1' Some of the
features have been recognized previously by Tipper and Finney (fS00) and
Bennett (fSOe); these ane indicated on Figure 6.1 by a T or a B.
Four types of features u,ere recognized in the data for 0RR0R00.
These are:
Linear anomalies transverse to strike of exposed Adelaide
System sediments.
Anomalies observed on one or tulo flight lines and therefore
of unknouln or uncertain strike direction and extent.
Anomalies clustered in sma1l groups in areas 5 kfi or more
across.
Linear zones about 2 km ulide ulhich can be traced across
Adelaidean and youngeD sedimentse and in uhich there are
none or very feu anomalies.
The method of selection of these features is discussed beloul.
6'2'L Tvoe 1 - IÍnear ano-nalies
Figure 6.2 shouJs tuo examples of cross cutting magnetic
features (heavy lines) near the touln of 0rroroo. The southern-most
of the turo lies over the boundary betuleen Quatornary strata and the
Adelaidean. The northern-most lies over Quaternary strata and is
approximately paratlel to the boundary rlith the Adelaidean. [Ylan-made
features are shoun on the map to illustrate that they are not important.
fflost of the linear features recognized in the area lie close to the
I
2
3
4

-89-
boundary betu¡een Adelaidean and Quaternary st'rata. The anomalies
are usually of the asymmetric kind urith the positiVe limb on the
northern side. Thc amplitude is usually less than 40 gammas.
6,2.2 Tvpe 2 - isolated anomalieF
To illustrate the problem ofl solection ofl isolated anomalics
unlikely to bc causod by Adelaidean strata, one seemÍngly isoLated
anomaly is indicated on Figurc 6.2 by a bold arrou. The map to the
south shours that anomalies occuD at a corrcsponding stratigraphic
position furthen along strike. Thus the arrowed anornafy is almost
ccrtainly caused by a magnctic sedimentary bod. Over arcas of Ade-
l-aidoan outcrop (undisturbed by diapirs), no isolated anomalies urith
amptítudes of 5 gammas or more uere found, Luhich uetre clcarly not
caused by the scdimonts. In all cascs an appapentJ-y isolatcd anomaly
on one flight line lay at a position uhich further along strike (perhaps
3-5 km) na¿ corresponding anomalics at thc same stratigraphic lcvel.
In areas of Quaternary cover thc lack of gcological control makes
thc problem ofl scicction of isolated anomal-ies evcn more difflicuLt.
In addition therc is evidcnce that thc Quatcrnary material is strongly
magnetic and produccs aeromagnctic anomalies of 2O gammas or morc. FoD
t,his ¡eason only the strongest, of the isolatcd kind of anomalies over
Quaternary sodimcnts u.lerc sclected. Three fcatures of this kind are
shoun on Figure 6.1. Tulo of them 1ie in arcas uhcre the gcologÍcal
maps indicate zones of disturbance and the third 1Íes nea¡ t'he northe¡n
end of a Type f f,eature.
6.2,3 Type 3 - groups of anomalics
Numorous anomalies urith ampl-itudes usually less than 20 gammas

-90
aIle Deoorded over plaíns of Quaternary sediments and do not appear
to fo1lou the linear trends uhich might be expected if the underlyíng
stnata have a trend and response similar to the surroundinq Adelaidean
rocks (eee Fig . 3.2), In Area B thero are more anomalies over the
plains than ove¡ the surrounding Adelaidean strata" Althouqh some
of them lie in quite uett defined groups, it is difficult to establish
trend directions. Fi.gure 6.1 shotus three of the best Ísolated groups
in u¡hich four or more anomalies 01 20 gammas or mote in amplitude
ulene racorded "
6 ,2.4 Tvoe 4 - non -mâQ[ì etic zones
0n any map of randomly distributed points there rlill aluays
be a feu short line-ups tuhich can be seloctcd. A map of plotted
points such as Figure 3.2 combinos both ¡3¡dom and systematic data.
From this sort of data it is to be expected that linear zones can be
selected uhich are oblique to thc aeneral geological trends' This
appgar-s to be the case for Figure 3,2. Numerous non-magneti.c Zones
oblique to bhe geological strike are evident betueen four or five
flight fines.
lllhile it is probabia Lhat some ofl these zones result purely from
the statistics of the data, it is possible that some are due to un-
mapped geological features.
For control in the interpretation of the anomalies described in
this section, three lines of nesearch tuere follouled' fYlagnetic ano-
mafies over diapÍrs, dyko sularms and Quaternary sediments uere
investigated. The results of the investÍgations are Pnesented in
the foll-oruing three sections.

-9t-
6.5 [ìlaqnc tic anomalies over diaoirs
Figurc 6.3 shor¡s the locations of a¡cas of diapiric breccia on'
0RR0R00 and indicates the position and arnplitudc of magnetic anomalies '
In vier¡ of tho discovery of magnetis carbonatites in the northorn cnd
of the tlallouray Diapir, uthich have an associated aeromagnctic anomaly
of 4 gammas (Tucker & Collerson, in prcss), the amplitude significanccr
lcvel uas reduced to I 3 gammus for díapirs. Table 6.1 shouls the
maximum amplitudo of anomalics ovor the brcccia uthich can be attri-
bUtable to nclar surfacc sourcss. The table also indicatos the struc-
tures in uhich Íntrusivc rocks have bcen reported (eintsr oP. cif.;
Tucker & Collerson, in Press).
Table 6.1
Amolitudo of Aeromaonc!-ic -.¡!.¡¡crnaliosovon Diaoirs on 0RR0R00
* Amplitude in brackets is that of magnetic anomalies very closeto breccia zones and probably due to maqnetic bodies associatedruith the diapirs.
Intrusive rocksknouln Ín
the breccia
lYlaximumanomalY
amplitudeNameNumben
dolerítes and basalts
??
oarbondtifesdolerites, quartz
porphyrfes & aplites?
dioritediorite
2?
eee
ee
e
e
2r)
2
quartz micr
??
odiorite
T2
:
;
30
3tr
16-413
? (10o)*400
-ro (-eo)*
( r¿õ )*
lllorumballlorumballjorumba
tllirreandalljirreanda
Round Hill( Ínformat )YanYarri-eCa¡rietonGreat Glad-stoneOladdieCoomooroolllallouayfYlelrose
BanattaParatoo[Tlt. GraingerBulininnie0odlauirra
I234567B
91011
1213I4
I516T7I8
19202L2223

t92-
The magnetio response of most diapirs on 0RR0R00 is ueak (less
than 20 gammas) and oven many, no anomalies ulere recorded. The
strongest response (4OO gammas) over the Paratoo Diapir, is attributed
to large p1u9s of magnetic diorite. ll,leak anomalies (10 gammas) over
the fflt. Grainger Diapir are associated rLlith dykes of diorj.te. The
Round HilI Diapir (informal name), has associated anomal-ies (r-tp to
30 gammas) uhich delineate a linear feature trending north-east ín
the southern-most part of the structure. tljhile the Baratta' [|ìt.
Grainger and 0odlaulirra Diapirs have ueak or negligible response over
their outcrop, strong anomalies are cfosely associated ulith themr E.Ç.
a 10û gamma l-inear anomaly lÍes uithin 0.5 km of the uiest side of
Baratta, a 90 gamma linear anomaly lies uliühin 0.5 km of the cast side
of tYlt. Grainger and a 140 gamma linear anomaly l-ies uithin 0.5 km of
the east side of the 0odlaulirra Diapir. The source of the strong
anomalies is not knor¡n oxcept for the Paratoo Diapir. Interpretation
of thc aeromagnetj-c anomaties indicates that the source rocks have a
magnetic suscaptibility of 1r000-3r000 x 10-6 c.Ç.s' units cofnparablc
rLlíth that f or dolerite or gabbro "
Rcconnaissancr. ground magnetometer sutveys across thc l.llallouay
Diapir (OnnOnOO) and the t\lt. Coffin Diapir (COnlfV) shoured that only
igneous intrusive bodies are strongl-y magnetic. The brecciated
sediments arc very urcakly magnetic.
Binks (fgZf) states that the crush brcccia utas probably derivcd
fron'r tho louest mambers of tho Adelaidean sedimonts, viz. Callanna
Beds; over the areas of outcrop of relatively undeformed Callanna
Beds auay from the diapirs ¡ the magnetic response is very uleak and
on 0RR0R00 aeromagnetic anomalies do not exceed I0 gammas in amplitude.

-93-
The available evidence indicates that most of the aenomagnetic
anomalles associated uith diapirs ale caused by igneous intrusive rocks.
This generalization applies not only to 0RR0R00, but to other parts of
the Adelaido Goosyncline as ulell-. For example, on PARACHILNA stnong
aeromagnetic anornalies (200 gammas in amplitude) recorded over the
Enorama, Blinman and 0raparinna Diapirs, Iie over a variety of igneous
rocks, including melaphyresr cJolerites and gabbro. Similarly in the
Spalding Diapir on BURRA, strong anomalies lie over basic plugs and
dykee r
0n 0RR0R00 the four most strongly magnetie diapirs lie ín Area A
uhere the Adelaido System scrdiments are strongly magnetic. Although
the cause of this association is not understood it is possible that if
the magnetism of sedimênts primarÍIy results from mctamorphic effects t
then the magnetic components of these diapirs may also be a product
of the same motamorPhic evont "
6 ¿4 fYlaqnetic resÞonse ofl dyk e su,arms
There are three dyke suarms of importance to the intarpretation
of magnetic anomalies in the 0RR0R00 area. These are the Eyre Penin-
sUla dykes, the lUallouay Diapir cafbonatites and the Teroulie klmberlites.
One of these, the Eyre Peninsula dyke suarm (fig.1.4)¡ has
beeñ recognized only on the Garuler Platfornr, but if ít uas continuous
ao¡oss the Adelaide Geosyncline it uould extend across the south-uestern
half of 0RR0R00. The existence of the dykes is inferred from aero-
magnetic interpretation; no outcrop of igneous materÍaI associat'ed
u¡ith the anomatries has ever beon reported" Because it ulas considered
possible that some of the linoa¡ oross cutting anomalies ulÍthin the

-94-
geosyncline may be an extension of the Eyrc Peninsula dyke su:arm, a
study uas made on the Eyre Peninsula to learn more about them and in
particular to find uhether they intrude Adelaidean strata" The
pnoblem of age uas not resofved" Reconnaissance ground surveys ujel'e
car¡ied out 12 km north of Hesso, 1I km uast of Yudnapinna and 25 km
ulest of lUoomera in areas uhere the aeromagnetic contour maps shoued
north/uest trencJing }Ínear anomalias cut across areas of flat lying
Adelaidean strata. A total of ssven ground lines uere read at the
three localities.
lljhcreas the aeromagnetic interpretation indicated that near Hesso
and üloornera the depth to sources u,as in the range 0-300 m, interpre-
tatíon of the ground data gave depths in thc range 90-180 m' In the
Hesso area (Fig, 6.4) a search for remnants of igneous rocks in a
ulater oourse, uhich from interpretation of the magnetic anomal"ios is
coincident ulith the dykes for ? km, reveal-cd nothing. The ground uork
shou.¡ed that a single dyke interpreted from aeromagnetic data could be
resolved into thrce thin bodies ovcr a total ulidth of 1r200 m'
Each body is probably betueen l-0 and 100 m rlide urhich puts maqnetic
susceptibility estimates in the range LrzOO-Izr000 x 10-6 coÇos' Units'
These valucs are consistent ulith the susceptibilÍty of dolerite'
The higher estimatc is consÍstent ulith a susccptibilÍty measured fol
a dolcritc dyke near lllhyalta (Boyd, pcrs. comm.). Because no outcrop
of thc magnctic material uas found r¡lithin Adelaido system sedimentse
as yet there is no dÍrcct evidence that the dykes intrude Adelaidean
matcrial. fTloreover there arc no dnill holcs close to thc field area
studied uhich can give definite information that the flat lying
Adelaidean strata a¡e thicker than the 90 m depth estirnate to the
top of t,hc dykes made from magnetic data. The problem is not fully

-95-
resolved; the author considers that ¡¡s Eyre PenÍnsu1a dykes intrude
the Adelaidean sediments on the Gauler Pfatform.
Although anomalies uith amplitude comparable urith those delineating
the Eyre Peninsula dyke surarm do not extend across the Adelaide Geo-
eyncline, there are indications in the geology that fractures extend
south-east across 0RR0R00 and BURRA" Thonrson (1SOS) noted that
rnineral occurrences frequently lio on north/r¡est trends and suggested
the presence of deep fractures in the basement ofl the geosyncline.
The locations of seismic epicentres shou trends in the north-uest
direction (Steuart & tTlount, I9?2) across the Adelaide Geosyncline.
The üJallouay DÍapir cacbonatites and the Terowie klmberlites
are post-Adelaidcan features. llJithin the north end of tho UJallouay
Diapir five dykes ancl tuo plugs of lamprophyric rocks of kimbcrl-Ític
and carbonatitic affiníty urere found ulithin thc diapiric breccia.
The largest dyke is Iå m thick and 150 m long¡ and the p1u9s are at
least 5 m across. The intrusions form a ring strUctuno about 500 m
long by 200 m across. I kn to the south of the intrusions recognizcd
by the author, the exploration lease holders, Electrolytic Zinc Co. of
Australasia Ltd., foL¡nd a dyke of similar material cutting out of the
diapir into Adelaidean sediments ( Horne, peIS . comm. ) . tYlagnetic
susceptibility measurements on four small samples from different
bodies gave values in the range 7OO-7,000 X 10-6 c.Q.so units. Verti-
cal field ground magnetometer profiles across the northern end of the
tljallouray Diapir shouledllttle departure from a background level except
ulhen nearly directly over the exposed dykes and plugs, ulhich indicates
the rocks are magnetic at the surface. Anomalies ranged in amplitude
from 100 to 6r000 gammas" The longest dyke produced a symmetrical

-96-
6,000 garìma posltive veltical fíe1d anomaly. The sign uras opposite
to that expected if inductive magnetism act-s alone and thus the body
must be remanently magnetized.
A single flight }ine of the 0RR0Ril0 aeromagnetic survey passed
over the carbonatites at 150 m and recorded a total field anomaly
of 4 gammas negativog it appears that this ulas caused by the long
pemanently magnetized dyke. If the line had passed directly over
this body, then a total field anomaly of about 25 gammas negative uould
be expected, The ground magnetic anomalies and susceptibiLíties conform
closely urith those of kimberLite pipes and dykes in Yukatia in the
U.S.S.R, ancJ in South Africa, uhÍch are discussed by Gerryts (lg0Z),
The Terourie kÍmberl-ites intrude Adel-aidean sediments of the
Umberatana and Burra Groupsr and shou a preference for locations Ín
anticlinaf structunes " The strike of the dykes does not appear ùo
be influeneed by existing rock structures although sevetal do occur
ín a fault (Colchester, in press). 0verallrthe stnike directions
of the dykes shou a preference for the north-ulest direction.
The kimberlites are knoun to be magnetic (Colchester, pers. comrn.)r
but as yet, the only susceptibility vaLue knouln is 3,000 x 10-6 crÇ.sr
units ruhich uas obtainecl by the author for a eingle specimen of one
dyke. The BURRA aeromagnetic map shous little useful data over the
Terouie kimberlite field, probably because the contour interval is
50 gammas. It also appears that the fliqht lines did not pass
directly over the largest, and most magnetic bodies. Hotuever, the
contours do shoul r¡eak ffuctuations in the area urhich may indicate that
the maximum aelomagnetic response j.s less than 50 gammas. Because the
precise positions of the indiv:ldual kimbe¡lites are not knoun, the

-97-
original flight charüs for the area uJere not Examined.
If the magnetic susceptibilitiee conform to the range 100-6t000
X 10-6 crgrs. units for RussÍan kimbertites (Gerryts, 196?)t then the
Iargest dyke could produce a total field aeromagnetic anomaly of I0
gammas at 150 m altitude. The large plugs, u¡hich are more than 100 m
actoss, could produce aeromagnetic anomalies of more than 100 gammas'
6.5 etic res o eof se
tylagnetic susceptibility measuraments on percussion dríII cuttings
from sÍx dri1l holes in the Quaternary sediments of the tLlallouay
plain gave surprisingly high values. These are shoun fully in
Appendix AZ and are summarised on Table 6'2'
Table 6.2
fYlacnetic 5usceptibili tv of lljallouav Plaín SedÍments
Depth Volume SuscePtibilltY *Age
0-5 metres
5-2D rr
2o-3ox rr
30-33 il
Average 0-30 m
700 x
350
2 r4OO
60
1o-6 oogrs. unitsll
il
ll
Ir090 x 10-6 ciÇrsr units
QuaternarYIt
ll
(z) n¿eraidean
* gne sample in this interval contained approximage¡y Ifi maqhemite'
Aeromagnetic intenpretation indícated that a no¡th/south trendinq
40 gamma linear anomaly on the ulest side of the llJal-louay Pl'ain could
bo caused by a steeply dipping tabular body at a depth of 0-50 m.
Four vertical field ground magnetometer profiles uere read acnoss the
fcaturs at one locality (arrogred and numbered I on Fig. 6.1)
-98-
Anomalies u,ere Up to 140 gammas in amplitude and uere Very noisy;
an anomaly approximating the theoretical- shape expected over an ideal
dipping üabular body nras located on only one of the four lines" The
lines urere f km long and 150-200 m apart" A depth estimate made for
the best fine using a dipping tabular body model uas 60 m. The
drill made available to test Lhe magnetic anomaly had a depth capacity
of 33 m. Because of this, the pattern of drill holes u;as deeÍgned to
test ulhether the Quaternary strata themselves caused the magnetic
anomalies. The six holes drilled uerc sited 15 m apant in line to
cover the central part of the Ínterpreted asymmetrical anomaly.
UJhite thc drilling results do not nulo out thc possibility that
a thin dipping tabular source bclou.r thc Quatornary strata causcs the
anomalies, they indicatc that susceptibility contrasts ulithin thc
Quaternary sodimcnts may bc important. As shouln on Tablo 6.2, suscep-
tibilÍtios are high from the surfacc to 30 m. Although the ancaL
dÍstríbution of thc stnongly magnetic material ís unknotunr it is
possible that in the vicinity of the drill holcs it forms a nãr.rou,
linear north trending zone (e.g. bounded by basement faults). A
theoretical anomaly across a north ürendingr 200 m uJider flat ribbon
of material ulith susceptibility contrast 2r000 x t0-6 c.Çre. units,
dapth I?0 m (cornesponding to aircraft alùitude above the source)
and thickncss l0 m, is symmetrical- and has a maximum total field
amplituda of 9 gammas. This is 31 gammas less than the obsorved
aepomagnGt,ic anomaly. Furthermore, ùhc theoretica.l- anomaly is
symmotricaf uhereas thc observed aeromagnctic anomalies arc asym'-
mctrÍc. lt is possiblc that the Quatc¡nany sediment's are remancntly
magnotized. This could account for both the high amplitude (40
gammas) and the shape of the aeromagnetic anomalius.

-99-
The average magnetic susceptibility of the Quaternary sediment,s
at locali.ty I discussed aboVe is 1¡090 x 10-6 coÇrs. units. Theore-
ùical total field anomalies computed across the north/south edge of
a 30 m thick flat eheet (i.e. a sheet extending east across the
lllallou;ay Plain) u"" asymmetric and have an amplitude of 25 gammas
at an altitude of I50 m. lllhiLe the amplitude and shape of the com-
puted theoretical anomaly is simÍlar to that of the observed aero-
magnetic anomalies, a theoretical vertical fíe1d anomaly compuùed at
ground level is quite diffe¡ent frorn the field results " The amplltude
and gradients of the theoretical anomaly exceed those of the observed
ground anomaÌy. Thus the problem of finding the sou¡ce of the linear
aetomagnetic anomaly on the uest side of the tUalloutay Plain is not
solved. Neverthelcss, because the magnetÍc susccptibility of
Quaterna¡y sediments is so high it Ís ovident ühat changes in thick-
ness or distribution of the magnetic matorial could produce aeromagnetic
anornalies of 25 gammas (or more if the material is thickor than 30 m).
It is to be expected that faults in the basement ruith a throu¡ of 10 m
or more ulill shoru up in the aeromagnetic dat,a, Similarly, valleys or
other depressions in tho basement can be expected to produce observable
aeromagnetic anomalies.
fflagnetic separations u,ere made uith a hand magnet for tuto
samples of cuttings (Appendix 44, Samples ORSB & 0R59). One
sample ulith a susceptibility of 3r500 x 10-6 c.Ç.s. units contained
n% (by ureight) strongly magnctic material. Onc tenth ofl the
magnetic portion consisted or maghernite and most of the remainder
consistcd of microcrysùal1inc goethite, earthy clay limonitc and
coll-oflorm lÍmonite. lllaghemitc has a susceptibility closc to that of
magnctite (LinAstey et a1., 1966), but thc other minerals normally

-r00-
have very lou susceptibilities " It is probable that the observed
susceptÍbility of the sample is due almost entirely to the maghemíte'
It ulas observed that ulhen the magnetic grains ulere shaken on a piece
of paper they grouped together into an aggregate; probably aII grains
incJ-uding the maghemite are strongly remanently magnetizedt uhich
accounts for the fact that they are strongly attracLed to a hand magnet.
6.6 Intero tation of the aeromaonetic anomalies on ORROROO
The foltouling intenpretation is given for the features shouJn on
Figure 6.1.
6 .6.1 Tvoe 1 - Iinear anomalies
It is probable that most of the features around the borders
of the ulillochra and l.lJaLlouay Plainsare caused by the maqnetic QuatePnaly
sedíments thickening across smaLl basement ridqes. Houever at the
one test site (numbered 1 on Fig.6.I) the results are eqt'1ivocal for
both an intrueive source and a QUaternary sediment source. Until
fUrther dritling tests are carr.icd out, tho problem rlilt not be resolved'
There ace feu Type I featurcs r.uhich are unlikely to be causod by tho
Quaternary sediments. Thcse are listcd bcloul:
l_ The 20 gamma feature cxtending south-tu8st from the Baratta
Diapir appears to be closely associated uith tho diaplr,
An igneous intrusive source is suggested"
2. Tho 500 gamma feature 13 km uest of the Baratta Diapir lies in
the core of an anticline u¡hich may contaÍn a diapir (Binks,
l9?I). In the Adelaide Geosyncline, diapirs arc pneferentially
locatcd in anticlinal structures. An igneous intrusive souDco
is suggestcd"

4
I01 -
|:'2 The l-0 gåmtna featUte 22 kn uJest of the tYlt. Glainger Diapir
lies in the core of an anticlinal structure. An Ígneous
source possibly associated uith dÍapirism is sugqested "
The 10 garnma feature 5 km south of the Round Hill DiapÍr may
be an extension of the 30 gamma feature uithin the diapir.
An intrusj.ve source, possibty urith an associated south-uest
extension of the diapir under Quaternary sediments is suggested.
The 50 gamma feature close to the small areas of diapiric breccia
in thc south-ulest corne¡ of 0RR0R00 may be due to intrusives
associated uith the dÍapir.
The 15 gamma feature extending south-r¡est from near the Oodla-
r:rirra DiapÍr closely follous a fault inferred by Binks (fSOe).
tllhilc there is a possibility that strongly magnetic Adelaidoan
sediments are the source, an intrusive sourco is more likely.
Ths I0 gamma fcature r¡hich trends south-east, across the Koonamore
Plain and appears to be associated urith a I0 gamma feature cutting
across Adelaidean sediments is a problem. The I-:63r360 photo
moeaics shoul no corresponding lineament over the Adelaidean out-
crop. fYloteover, a search on the ground near the northern end of
the feature over Adefaidean outcrop revealed nothing ' UJhile the
turo features might be caused by a very thin intrusive (".9.10 m
thiok or less) it is possible that they result from a fortuitous
line-up ofl magnet'ic anomal-ies due to Adelaide System sediments.
5.
6.
lt
6,6,2 Type 2 - isolated anomal-ies
One of the three features of speciaf interest u.ras tested ulith
a ground magnetometer (numbered 2 on Fig. 6.1). A combined interpne-
tatÍon of the aeromagnetic data and ground data from tulo east/uest lines

-IO2-
0.8 km apart acró58 the anomaiy indicated that the source might be a
plug 200 m across at a depth of 180 m. An estimate of susceptibility
made from the Ir100 gamma ventícal field anomaly on one line (assuming
inductive rnagnetism acts alone) is 51500 x 10-6 cog.s, unlts. This
value is consistent uith that for a basic or ult,rabasic intrusive
source (".g. gabbro or kimberfite). A search Ín creeks in the area
revealed no i.gneous rocks; the creeks are about 3 m deep and only
rarely are Adel-aidean sediments exposed in them, It appears that the
sourcc uill only be revcaled by drilling through tho Quaternary eedi-
ments uhich cover the area.
It is probable that the tuo Typc 2 features shouln near the south-
east and no¡th-east sides of Figure 6.1- arc caused by intrusive plugs.
Bccausc of the proximity of the feature on the south-east sids to an
araa of diapiric broccia and the Paratoo and Bendigo diorites, it is
suggestod that the source may be a diorit,e associated ruith a diapir.
Hou.rever, thc possibility that the source might be a large kimberlÍtc
should not be overlooked.
6.6 .3 Tvoo 3 orou of anomalies
None of the thrce fleaturcs shoun on Figure 6.L uas tcstcd on the
ground. Tipper and Finney (fSee) suggesteci ùhat the 20 gamma featurc
to the north of the lUa1louray P]-ain u,as associatcd urith a buried diapir.
llJhile the possibility that a diapir exists in the arca cannot be con-
firmed u¡ithout drilì-ing, the author considc¡s that the magnetic sources
lic ulithin the Quaternary sediments. Thc anomalios may bc causcd by
variations in thickness of the magnetic componcnts of the Quaternary
scdimcnts, possibly duc to bascment topography. The tu¡o featurcs
selectcd on thc tlJillochra Ptain may also bc eauscd by thc Quaternary
sadiments.

-103-
6.6.4 Tvpe 4 - non-maqnet-igif ones-
lljhile the non-magnetic zones sel-ected on Figure 6.1 might be
due to the statistics of the data, there is a possibilÍt'y that they
Índicate subtle geological featuree. For example, along a zone of
smafl faults Ít could be expected that the depth of magnetic rleathering
is greater than in non-faulted areas. Alonq such a zone the amplitude
of response of sediments could be reduced, thus givinq an apparently
îoD-rnagrìetie zone. A feature of special ínterest is that lour of the
zones lie close to a line betuleen the north end of the UJalloulay Díapir
(in urhich carbonatites occur) and the area on BURRA ulhere kimberlites
ocour. It is possible that the zones are in sone uay associated ulith
the int¡usives. These lineaments defined by the four zones have a
trcnd direction parallel to that of thc Eyre Peninsula dykcs. It is
possible that the non-magnetic zones definc a deep fracture uhich is
associated uith the dYkes.
6,7 Discussion
The uork done on non-Adelaidean magnetic sou¡.ces is of a preli-
minary nature, and the conclusions draun are tentatiVc. Houever,
several ímportant points can be made.
Firstly, the Quatcrnary scdiments can be strongly magnetic and
can cause aeDomagnctic anomalies of 20 gammas or morc. Secondlyt the
sizc of intrusives to be e¡pectod in the area is very small. ThUs
regional surveys of the kind carried out so far in the Adolaidc Geo-
syncline are unlikely to locate many magnetic intrusive bodios, and
interpretation of thc uridety spaced Iínes uill be difficult. A
detailed survey ulith flight lines possibly 0.4 km apart or less af
,l
i
.t'
$
tr

-104-
as lour an altitude as possible is required. Thirdlyr rhany diapine
have aesociated magnetíc anomalies dUe to near surface sounces. It
appears that igneous intrusive bodÍes are most important in producinq
the anomalies. Founthly, it is evident that a study of original
f}ight charts combined r¡¡ith study of the geology is necessary to
Ísolate anomalies urhich might be due to intrusives. The magnetic
anomalies due to Adelaide Syetem sÉdiments domlnate the patüern and
mãke selectfon of nÞn-Adelaidean souroes very diffÍcult.
):
.ti:
IL¡
ùt-
I
{'t',J
i't,
i
Ì!.1.
.
rÍ
I
i¿'
PART C
Bouquer gravity anomaf ies associated rLLj th granites

-105-
Chapten 7
GENERAL ASPECTS OF BOUGUER AND MAGNETIC ANOMALIES
7.I Introduction
The regional helicopter survey Bouguer gnavity maps for the
Adelaide GeosyncJ-ine u,ere studied during the course of the fhesis
nesearch. A map of the area considered Ís shouln on Figure 1.?.
Data u.rere collected on a 7 km square grid oriented north/south.
The techniques of interpretation of Bouguer anomalies are dis-
cussed in various text books (u.g. Jakosky, 1950; Grant & Ujest, 1965;
Parasnis, L966) and other publications. In any geopÌrysícal study it
is important to assess uhat can be derived from the data. Regional
helicopter gravity surveys have been completed over most of Australia
and in the course of the uork both sedÍmentary basins prospective for
oil, and Precambrian shield areas have been survayed on grids ranging
from 7 to 15 km. The primaly purpose of the uork has been to delineate
major structures and to provide data suitable for estÍmation of thickness
of sediments in ùhe Palaeozoic and younger basins. lTlost of the reports
on regional surveys axe unpublished as yet and are held by the BMR.
There are a îeur published reporfs in the BlllRrs Report Series and
Petroleum Search Subsidy Act Series, but these are mainly qualÍtative,
and little quantitative material is availabl-e. In partieular, there
is little published quantitative information on Precambrian shield
survays. It is Precambrian shield areas rather than young sedimentary
basins uhich are of concern in this thesis,,
To help Ín assessíng urhat could be expected from the data for the
Adelaide Geosyncline the literature uas studied both for AustralÍa and
other areas. In general, reports are of tuo kinds; qualitative accounts
¡
t-
L06
for large areas (".g. Kane et al., L9?2) and quantitative interpre-
tations of Índiùidual ahomalies in smal1 areas (".9. ll1atts, 1972;
Healey, 1966; fYlabey, 1966). The place of regional studies is to
establish large-scale featUres and delineate areas uihere detaÍIed
ulork can be ofl help ín undetstanding the geology. For a negíona'l
study to be most reularding, adclitional information such as detailed
gravity lines, seismic depth estimates, drill hole data, density data
and geological data are neoessäry. Cfearly a geophysical interpreta-
tion must be tied to t,he knouln geoloqy as closely as possible. Houlevert
regional su¡veys can be expecLed to delineate special features ulhich
are unrecognized in geologlcal mappÍn9, and in areas ulhere the geology
Ls not ueII knorL¡n they can be eXpacted to give a very generalized
picture of the geology, e8p6cially if aeromagnetic maps aro studied
along uith the gravitY maps.
To interpret the individual anomalies quantitativei-y from an area
is rJifficult; each anomaly needs an individual approach. The main
pcoblem in shield areas is that density data are usually scance and to
sample adequately is diffÍcutt,. 0ften the dansity contrast betrueen
various uníts is lou (gnithsonr I9?I). In addition, variations in
metamorphic arade and geological complexity can produce changes in
density of a unit and therefore it is difficult to assign an average
density applicable ov(r¡ a urÍde arèa. Another problem specific to
regional data is that because of tha uide Stat,ion spacing, anomalies aret
often ontry poorly defined. This problem, coupled with a lack of den-
sity data or other helpful information, makes quantitative interpretation
of some anomalies imPossible.
i
Before commencing interpretatfoil of the most recent helLcopter

I07 -
Bouguer anomaly data collected by the fJlTlR (COpLEY, PARACHILNAT 0RR0R00,
0LARY and parts of CALLABONNA, FR0IYìE, CURNAÍYI0NA, CH0IIJILLA and P0RT
AUGUSTA, see Fig. I.3), iL uas agreed that in exchange for the author
having first access to the neu data¡ he uould urite a rePort on his
findings fo¡ the BtYlR. The uork uas to be first compiled as an internaf
Record flor the BIYIR and in time it uas to be published as one of the BtllRrs
Report Series. The BIYIR Record has been prepared (Tucker & Broutrn, L972).
f1n. F. ll¡. Brourn of the BITIR ulas co-author lor the report; he assisted in
editing¡ and the preparation of figures, and in addition turofe appendices
on the statistics of the survey.
For any gravity interpretation it is of heJ.p to have data from
surrounding areas. Bouguer anomaly maps are available for areas adjoining
ühe ulest, south and north sides of the area shouJn on Figure 1.3r but not
for the east síde. The area shourn includes areas of Precanlbrian rocks
and Palaeozoi.c basins. For the BfflR Record Lhe autho¡ made a basic
interpretation (mostly qualiùative) of ùhe uhoLe area shoun on Figure 1.3
and discussed j-n detail the gravity louis r.rLhich appear to be associated
urith granite bodies. Because mUch of the area covers a mineral pro-
vince (tne ROetaide Geosyncline) an attempt utas made to find associations
betuleen gravity features and mapped mineral occurDences. The associa-
tion betureen sotre gravity lineaments and the location of seismic epi-
centres ulare noted.
For the thesis it ulas decided that turo problems of the gravity
uiork uere most important. The fi¡s'b ulas the fundamental problem of
obtaining density data. The second problem uas that of interpreting
some ofl the gravity minima ulhere the geological and geophysical maps
indicate that the source rocks are probably exposed o¡ close to the

-IOB-
surface. The tuo problems are discr.lssed in chapters I and 9.
The area in uhiclr quantitative analyses uere performed lies east
of longitude l38o. Others are urorking in the area to the ulest of this
line (Gerdesr fYl.Sc. student) and so for the thesis (and the BlllR Record)
Iittle detailed analysis ulas performed in the uest.
In the fotloging sections of this chapter various qeneral aspects
of the BougUer anomaly data for the thesís area are discUssed, and in
addition varj.ous genenal comments are made about the basement of the
Adelaide Geosyncline, and the basins of Palaeozoic sediments on the east
side of the geosyncline. A discussion oF the basement is important to
the int,erpretation of gravity lotus presenLed ín Chapter 9.
7.2 P_lese¡Lat:Lon _of LlLe- BoLrqueI_-a0_qrlqll 0al:_
The bouguer anomaly map (fiS. I.3) uas prepared by the BMR from
I:2501000 maps contoured at 5 mg. Data u¡ere reduced to mean eea level
at Adelaide, The Bouguer densities used in the reduction vary from
place to pIace. In the north of the area 1.9 g/cn3 ulas used for
basinaL areas of predominantly Palaeozoic and younger strata. In the
south-east corner 2,2 g/cnt3 uJas used for an area of simila¡ strata.
For most of the area covering Precambrian rocks 2.6? g/cn3,r,as used.
The boundary betueen areas reduced with different Bouguer densities is
marked ulith a double line. The contours have not been adjusted to
match at the survey boundaries.
Inaccuracies in the Bouguer densities used for reduction of data
over the young basins are not of great importance because the elevation
of most stations is only a feul metres above mean sea level. floulever,
for the areas of Precambrian rocks the Bouguer densities are of more

-109-
importance because the elevation of some of the stations is several
hUndred metres above sea level. lllork to derive an estimate of
average density fo¡ Adelaidean and pre-Adelaidean rocks is discussed
in Chapter B. From this it seems that the Bouguer density of 2.67 g/cn3
used Ín the reduction is probably lotu by about 0.06 g,/cm3. 0ver most
of the Adelaide Geosyncline elevations do not exceed 700 m above sea
Ievel. If a Bouguer density of 2.13 g/cn3 u,as USed instead of 2,67 g/cns,
then the Bouguer gravity at some of the highest stations urould be 1-2 mg
less than shoun on Figure I. It is considered that Èrrors in the
Bouguer gravity vafues due to an incorrect choice of Bouguer densify
are ofl littte consequence over most of the areas of Precambrian rocks.
7,3 erations of the Bouou r anomal-ies in the thesis areae
Some of the Bouguer anomalies in the thesis area uere bríefty dis-
cusged in Chapter I. Figure 1.3 shouJs a cornposite map of Bouguer
anomal-ies and geologY.
The most prominent anomalies lie close to the margins of the Ade-
laide Geosynctine (refer Fig. I.3) and most ofl these are louJs. The
background levef over much of the atea is 0-10 m9, A 1ou reaching
-40 mg lies close to Lake Callabonna; a lour reaching -45 mg lies nean
Curnamona Homestead; a J-otu reaching -40 mg lies south of 01ary. 0n
the ulestern side a louL reaching -35 mg lÍes over the lUillouran Ranges,
and a lour reaching -40 mg lies ove¡ the u'restern part of PARACHILNAT
0RR0R00 and BURRA. lljithin the latter anomaly an intense localized
loul reaching -50 mg lies in the north-urest corner ofl BURRA " 0ver the
central part of Lhe geosyncline the gravity anomalies are very broad
and do not depart much from 0 mg. 0ver the pre-Adelaidean rocks of
the Gauller Platform the pattern is complex and localized residual

-110-
anomalies of up to ! 2O mg occur. The background level for this area
is about 0 mg. 0ver the thin flat lying Adelaidean and Carnbrj.an
strata on ANDAfi1O0KA and T0RRENS the pattern is complex and hlghs and
lous reacfr j fO mg or more above a backgnound level of about -I0 mg.
Uhil-e the gravity pattern shotus a Loose correspondence ulith the
geology, uhen considered in detail most of it is dÍfficult to interpret.
For example, the gradient on the uestern side of the long lotir near the
edge of PARACHILNA, 0RR0R00 and BURRA, corxesponds urith faults (mapped
and inferred) uhich Thomson (fsZO) considers make up a single featune
caLled the Torrens Lineament. Houever, on the geological maps there
appears to be no corrasponding fault system in the Adelaidean material
along the gradient on the aastern side of t,he lour. The aeromagnetic
pattern in the area of tlre graviüy lotu is almost, featureless; therefore,
depth to magnetic basement estimates ane unreliabfe. Geological
evidence (Thomsonr op. cit.) indicates that the AdeLaidean mat,erial
may be less than 10 km thick. Detailed interpcetation of the gradient,s
around the loul is prevented by the uide station spacing (Z t<m). Elemen-
tary interpretation of the gradients using a step model (Bancroft, 1960)
indicates that, the depth to the lou density body is no more than 11 km.
It appears that it lies in strata belou the AdelaÍdean sedimentary pile.
Hourever, the lou may indicate a qreat thickening of Iou density compo-
nente of the Adelaidean rocks.
A gravity Loul simila¡ to the one discussed above lÍes over the
llJillou¡an Ranges. The geology in this area is not uel-I knou.rn, but
depth estimates f¡om aeromagnetic data indicate that the magnetlc
basement (probably pre-Adelaidean) roy be no more than 4 km belour the
surface. Elementary interpretatj.on of the gradíents of the gravÍty

-llt-
Ionr using a step modeL (Bancroftr oÞ, cit.) indicates that the depth
to the source is no more than 12 kn. It appears tikely that the
lou density bcrdy lies in strata belou the Adelaidean. Houeve¡, as
yet it cannot be discounted that the lorLr is caused by great, thickening
of loul density Adelaidean rocks.
It is to be hoped that tuo¡k in progress at the University of
Adelaide uill help resol-ve the problem of the gnavity Iou;s on the ulestern
side of the Adelaide Geosyncline.
In Chapter 9, some of the best defined localized gravity lous on
the eastern side of the geosyncline ale discussed. It seems most
likeJ.y that all ofl fhese features are caused by granitic bodies,
7.4 Basement of the Adel-aide Geosyncline
Information on the nature of the basement underlying the Adelaidean
sediments is accumulating but there is much to be done before it is
fuIIy understood"
Seismic evidence (Steu.rart, in press) indicates that there is
virtually no velocity gradient uith depth urithin and beil.our the Adelaide
Geosyncline dotun to the bottom of the crust at 38 km. This is an
UnUsuaI phenomenon and may indicate eithe¡ that the Adelaide System
sediments and t,he underlying material are closely simil-ar in average
composition and therefone have the same seismic velocity, or that the
Adelaidean strata persist to the bott,om of the crust. The former
suggestion is supported try the fact that the highest crustal velocity
recorded in the pre-Adelaidean rocks of the Gauller PLatformr 6.3 kn/sec
(Ooyle & Everíngham, L964), is nearty identical with the velocity in
Adelaidean sediments, 6,25 kn/sec (Steuart, op" cit.).

-t]-,z-
lïeasured stratigraphic thicknesses (in Parkin, 1969; Thórnson
et al., 1964) for the various Adelaide Sysùem sedimentary units
total 18 km or more in the central and northern parts of the Adelaide
Geosyncline, The totar stratigraphic thickness of cambrian units
exposed in the northern part of the geosyncline is at least, 4 km.
Thus at the cessation ofl deposit,ion the totaL sediment thickness may
have been in excess of 22 kn, but, probably much less than the presenü
c¡ustaL thickness. Because ofl the complexity of structures produced
by onogernesis it is impossible fnom geological evidence alone to
accuraLel-y estirnate the thickness of the Adelaidean unit. Thomson
(fOUO) made estimates from stratigraphic thicknesses observed on the
limbs of fold structures assumed to be concentrically folded" His map
is shoun on Figure t.B. He estimated that the depth to the basement,
uae in excess of 10 km near the no¡th,/south axis of the geosyncline.
The author made six depth estimates on 0RR0R00 and PARACHILNA across
suitabl-e fold structures assuming concentric folding and arrived at
values of about 10 km Ín agreement Luith Thomson. Houeverr not all of
the Adelaidean section is exposed and t,his r.uas not allou.red fo¡" Thus
l-0 km is probably a minimum estimate of depth t,o basement.
Geological evidence that a basement of rocks dÍssinil-ar or older
than the Adel-aidearr sediments exists near the deepesL part of the geo-
syncline comes from diapirs. tUhile diapiric breccia ofterr closely
resembLes the louest units of the AdeJ-aidean, it usually contains acid
and basÍc rocks of i.gneous origin, some of ulhich may have been torn
from the basement (cfl. coats. 1964). No comparative study has ever
been made of the igneous rocks in all the diapirs and thclse found on
surrounding basement aleasr s.g. Gau.ller Platform and tllilì.yama Block.
Thus as yeù iù cannot be said from geological evidence that the basement

-113-
of the Adelaide Geosyncline is or is not sÍmilar to these areas "
The Bouguer gravity contour map does not help much in a study
of the basement of the Adel-aide Geosyncline. The Bouguen anomalies
are iueak over most of the area of Adelaidean outcrop and do not deparü
much from 0 mg. In Chapter B it is shor¡n that there is little or no
difference betu.reen the average density of the Adelaidean strata and
the average density of pre-Adelaidean strata. It apPears that for
ínterpretation of the gravity data the Adelaide Geosyncline cannot be
modelled as a simple basÍo of loru density matarial on a dense basement"
Furthermore, from the discussion of anomalies in section ?,2 of this
chapter; it appears that more uork is required to resolve rLlheùher the
lou density sources of the tuo najor lorLls on the uestern side of the
geosyncline lie uithin the basement under the Adelaide System sediments
oD tuithin the sediments themselves.
Quantiüative'.Ínformation about ùhe depth to basement and its pro-
bable oomposition comes from magnet,ic data althouqh at this time much
stltl remains to be done. An aeromagnetic map and qeotogical map of
tlre area ate shourn on FigUre 1.4. Various BfflR reporters (Tipper &
Fínney, 1966; Young & Gerdes, Lg66; and others) consider that broad
magnetic anomaLies over the Adelaide Geosyncline come from magnetic
sou¡ces beloul (or possibly uithin) tfre Adelaidean sedimentary fi11"
Most of thei¡ depth estimates (ris. ?.1) urere made for uell defined
anomalies marginal to the north/south axis of the Adelaide Geosyncline
in areas ìJhepe Adelaide system sediments are only rLreakly magnetic at
the surface. Anomalies near the deepest parù of the geosyncline as
postulated by Thomson (19?0) are poorly defined, indicative of a gneat
depth to magnetic basement or a ueakly magnetic basement. The feu¡

-1r4-
estl¡nates on PARACHILNA and 0RR0R00 near the axis of the geosyncline
are for poorly defined anomafies and do not exceed 10 km. Although
f¡om these it might appear that r¡e can say that the magnetic basement
of the Adelaide Geosyncline lies at l-0 km or less near the deepesL part,
preliminaf,y interpretations by the author of some of the lou amplitude
broad anomalies give depths of t5 km or mote, particularly in the areas
of strongly magnetic sediments. The author considers that the data
need restudying both in areas already covered by BIYìR reporters, and ulhere
depth to basement estimates have not been made, paying particular atten-
tion to the recognition of intrabasement and suprabasement features.
The authorrs study of the magnetic response of the Adelaide System sedi-
ments has Laid the ground'Lrork for further interpretation of the deep
sou¡ce magnetics of the Ade.l-aide GeosynclÍne. It is unlikely that
suscept-ibility contrasts uithin the sediments themselves cause broad
anomalies in areas uthere the aeromagnetic lesponse due to the near
surface material is u.reake i.€. over most of the northern part of the
Adelaide Geosyncline. The average suscept,ibility ofl the sediments is
probably fess than L00 x L0-6 c.Q.e. units in this area. In the area of
strongly magnetic sedimentary beds in the south-east of the geosyncline,
broad anomalies (u.g. ruith half-uidths ofl about 20 km) are probably due
to the combined effects of unexposed strucLures of magnetic sedÍmentst
and other deep sources. Depth estimates in this area can give minímum
and maximum estimates of thickness of the AdeLaidean material.
It is a general featuce of the magnetic pat,tern that over exposed
strongly folded Adel-aidean strata, uiz. €ast of lonqitude 1380, t,he
magnetic anomaLies attributable to deep sources are very rleakr tt]hile
over essentially unfolded Adelaidean strata, viz. uest of tongitude ISBot
the anomalies aùtributable t,o deep sources are very strong and clearly
-rIs-
come from shallouler sources than in the anea of strong folding (see
Figs. L.4 &, ?.1). The pattern over flat lying Adelaidean strata on
the Gauler Platform resembfes that over ühe lJJillyama Block and other
pants of the Gauler Platform, as does the pattern betueen the fYlt.
painter Block and the l,Uillyama Block " it appears rnost likely that the
deep magnetie basement in these tulo areas consists of pre-Adelaidean
rocks símilar to, or the same as some of those of the lllillyama Block
and Gar¡Ier Plaùforrn. In the aDea of strong folding in the Adelaide
Geosyncline, the magnetic pattern indicates a deeply depressed basement.
Houevere as yet it is not possible to say ruhether the magnetic basernent
is similar to the pre-Adelaidean sbrata surrounding the geosyncline or
not. Analysis of the indivÍdual anomalies to rJete¡mine block sizes and
susceptÍbÍlities may help on this problem.
7.5 Basement of the F'rome t and fYlu¡'tay Basin
The aeromagnetic maps give information on the stnata comprising the
basement underlying flat tying Quaternary and Palaeozoic sediments.
Tu.ro areas of particular interest are the northern part of the fflurray
Basin and the Frome Embayment (fiS" I.4). Both areas are prospective
for oí1 and are currently being exPLored uith seismic surveys and dril1
holes" Permian aged sands are the main strata of interest. fYlost
published drill hole Ínformation is for the fflurray Basin (earkin; ].969,
p.I78).
None of the drÍll holes (maximum depth 300 m) in the northern pant
of the Murray Basin has penetrated strata older than Quaternaxy in aqe'
although 15 km to the south of CH0IIJILLA, the Renmark Bore bottomed in
Permian sands al, 41018 ft (frZ0O m). Dri1l holes further sout'h
bottomed in schists and phyllitese and Thomson (fSZO) and others equate

-116-
jt uith the ¡etarnorplrosed Kanmantoo Group Ín the [llt. Lofty Ráhges.
For example, one of these Clrlll hOles is the Pirnaroo Bore, 100 km
eouth ol'ÛHCUJILLA, uhich bottomed at I'ZBO ît' (SSO m) in schists and
phyllites. others further south bottomed in simí1ar material. Thomson
(op, cit.) considers that, the Kanmantoc Group underlies mUch of the
fylurray Basin and rnay reach a total Lhickness similar to its observed
stratigraphic thickness in the l'lìt. Loflty Ranqes (about 20 krn). Aero'
magnetic maps shoru that some of the Kanmantoo Group foiks have a response
simil-ar to strongly magnetic Adelaide Sysbem sediments. For example?
the Nairne Pyrite llìember produces prominent linear aetromagnetic anomal-ies.
In the northern part of the l¡lurray Basin shoun on Figure 1.4 the
aeromagnetic pattern is simiLar to that ovet strongly magnetic Adelaide
System sediments. AnomaLies are li.near and foLl-ou a general arcuate
trand uhich closely parallels the outcrop on the eastern side of the
Flinders Ranges on BURRA, 0RR0R00 and OLARY, Although it is most
probable that the magnetic anomalies aris-' frorn magnetic Adelaidean
sedimentary beds at depths up to about 1 km belorl the surfacer it should
not be overlooked that some might be caused by Kanmantoo GroUp meta-
sediments. Because the magnetic pattern is closeJy similar to that
over outcrop of Adelaiclean material, it is cl-ear that the magnetic beds
are folded and have baen peneplaned before deposition of the fflurray
Basin sediments. The magnetic pattern indicates that folds are elongate
ín the north-east direction.
Unpublished data from dril-l holes around Lake Frome by the De1hi-
Santos grogp shor.u that strata of lfliddle Cambrian age occur at a depth
of about 6CI0 m. No drill holes have penetraùed the Adelaidean or pre-
Adelaldean. It has been suggestecl by Thomson (fSZO) tnat in the a¡ea

-tr?-
of the Frome Embayment the pre-Adelaidean basement may lie at a dept'h of
l0 km or more belou the surface. The author disegrees uith this vieul
in the light of geophysical data. The aeromagnetic maps for the
Frome Embayment shoul a complex pattern of circular anomafies similar to
that over the lJJitlyama Block. Anomal-ies are circular, sometimes
falling in north/south lines. Depth estimates from the most prominent
deep source anomalies by BftìR authols are usually in the Dange I-6 km
uith the deepest 1yin9 close to the eastern side of the Flinders Ranges
(fig. ?.I). It is probable that the magnetic basernent under the Frome
Embayment lies at a depth of 1-6 km and consists of pre-Adelaidean
maLerial simifar to that on the lJJirlyama Block. It is most unlikely
that, the magnetic basement consists of Adetaide system sediments' The
outcropping Adelaidean to the u¡est of the Frome Embayment on PARACHILNA
and the southern part of CIPLEY i-s very ueakly magnetic and if Adelaidean
strata do occun in the FROtTt and CURNAIYI0NA areas beneath Palaeozoic and
Quaternary strata, it is unlikely to produce the observed magnetÍc
anomalies.
The aeromagnetic pattern in the uest of FROIYIE shouls a circular
feature about ?E km acnoss (Fig. I.4). The anomaly has steep gradients
defining its boundaries and encloses l-ocafized anomalies¡ sofTlE of t¡.thich
have north/south alignment. The Bouguer gravity map shouls'a b¡oad
lou (residual, -10 mg) over the anea of the magnetic anomaly. lllhile
the lou¡ might be caused by a thickening of lour density sedimentst it
coulcl indicate the presence of a lou density basement" It is probable
that the sounce of the circular magnetic feature lies ulithín pre-
Adelaidean material. The basement rocks may be of granitic composition"

- 118
Chapter B
DISCUSSION OF DENSITY DATA FOR THE ADELAIDE GEOSYNCLINE
8.1 Introduction
A problem uhich mus{: be faced in any interpretation of Bouguer
gravity data ís that of estimating Depresentative densities of rock
units and density corrtrasts betueen rock units in the apea' In a
metamorphie area like the Adelaide Geosyncline and its surroundings,
the problem is perhaps most acute because the density contrast betueen
various lithologies of interest can be expected to be lou. For the
case of basins of Palaeozoic or younger sediments ruithin a metamorphic
enviDonrrìent often the problem of densities is not as bad because the
density contrast betr:leen the basement and sedj.ments is likely to be
hiqh (possibJ.y 0.30 9/cm3 or more). In this situation a small error
(say 0.OS 9/cm3). in a density estimaLe uill probably not seriously
influence the results of interpretation of the gravity data" Houlevert
in a metamorphic terrain an error of 0.05 g/cn3 might be larger than the
density contrast sought. llJhile there are values published for different
IiLhologies fnom various areas throughout the uorld (Grant & lUestr 1965,
p.199; Smithson, 1971) o it is essential in a neu area to make neu,
measurements.
At the outset of ulork on the regional Bouguer gravity data for
the Arlelaide Geosyncline, the author l-ooked at the problem of estimating
average densities for rocks in the area. It uas found that the Prob-
Iems are manLfold. There is practically no published density data for
the area " Very feu.i drilt cones have been togged for densities eithe¡
ulÍthin the geosyncLine or the surrounding ar€as" lYloreovert the
avaiLabfe published and unpublished data are usually lrom geologically

-1I9-
disturbed aleas of economic interest. As r¡ork proceeded on Luhat uas
originally considerad t,o be a fairry elementary problem, it ruas found
that it uras extremely difficult to produce meaningfur density data.
It became clear uhy in many papers on interpretations of Bouguer
anomalies any reference Lo density measurements on rocks is made in
an almost guarded fashion.
In thÍs chapter the results of the authorrs uork on densit,y are
presented. Problems uJhich arose and ulhich urill probably be of intarest
to futune ulorkers in the area are discussed. The authorrs uonk has
done litt,le more than expose the t,íp of the iceberg.
8,2 Classification of rock tvpes
The geoloqy of South Australia has been discussed by SADtyl geologists
in Parkin (f96g). The ¡ocks important in the interpretation of tha
regional Bouguer gravity data over the Adelaide Geosyncline can be dÍs-
cussed under three broad classifications. These are¡ Adelaidean and
CambrÍan sediments, pre-Adelaidean crystallíne basement rocks and post-
Adelaidean igneous intrusives. These are eoneide¡ed in turn beloul.
8.2,L Adelaidean and ian sediments
In the Adalaide Geosyncline these sed.iments mainly coneist of
foun lithologies:
1. Carbonates (dolomites, limeetones and intermedÍate members),
€.g. t,he Nuccaleena Dolornite.
2. Siltstonee (e.9. Tapley HiIl Formation) and calcareous
sÍItstones (e.g. lllonoka Formation).
3' Shales (argillaceous rocks), e.g. the Tindelpina Shale fYlember.

-r20-
4. Quartzites (incJ.udes continental tillites in the Adelaidean
stratigraphÍc succession, but not, in the Dambrian), 8.g. the
Appifa Tillite.
The stratigraphic columns for the published SADIYI geological maps
of the Adelaide Geosyncline shor¡ that repetition of formations of simiÌar
overall lithology occurs in distances ol about 0.5-3 km.
The contour maps of Bouguer gravity anomaL.ies indicate that the
mixing of the varÍous sedimentary lithoJ-ogi-es by folding processes has
been quite effective. There are feuJ areas ulhere the contours closely
follou the outcrop of a particular formation. One of these is in the
south-r:lest corner of PARACHILNA (Carnbrian limestones), It appears that
even though ít can be expected that there aDe density differences betueen
units of different lithology, in general they have been mixed so that
from the point ofl vieru of a negional Bouguer gravity surveyr they can be
considered as a single geologicat unit. Cambrian materiaL does not
outcrop uridely in the northern part of the geosynclj-ne. Furthermoree
the lithologies of Cambcian sediments are similar to those of Adelaidean
sediments (see Parkin, 1969). Therefore, for the discussÍon of densities
tuhich folLous in this chapter no distinction is drau.rn betueen Cambrian
and Adelaidean strata. For the discussion of densit,ies the slab of
material consisting of folded Adelaidean and Cambrian sediments will be
refer¡ed to as the tAdelaidean Unitr.
8.2.2 Pre-Adglaideg¡ m,etaqgrylhic basement ¡ocks
0ther than for the tYìt. Painter Block (Coats & Blissett, f971)
too little is knourn of the pre-Adelaidean rocks to classify them into
the numerous lithologies expected j.n metamorphic terrains. Being
guided by published and unpublished SADIYI maps and reports on the meta-
-I2L-
morphic basement areas, it appears that most of the rocks fall into ttuoI
broad classifications.
Metasediments (incJ.udes schistsr gneissosr sandy meta-
sediments, quartzites and local Íron formations).
Extrusive and intrusive acíd igneous and refated rockst
e.g. the Gau¡]er Ranqe Volcanics, granites of the ffit.
Painter Block.
From the Bouguer gravity anomaly maps it is evident that the density
of pre-Adelaidean rocks changes from place to p1ace. For example, ovetr
the south-east side ofl the lllillyama Blocke the Bouguer anomalies are
positive (rs mg urith Bouguer densiby = 2.6.1), uheDeas over the north-
ulest eider the Bouguer anomalias are negative (-15 mg urith Bouguer
density = 2.67). Similarly, ov€lD the Garuler Platform both positive and
negative Bouguer anomalies are Decorded.
8,2,3 Post-Adelaidean eous intrusives
tYlost of the J-arge igneous intrusives into Adelaidean sedimentary
strata are acidic and can be loosely classified as granites (e.9. the
Anabama Graníte).
8.3 fÏeasurement of density ol qocl-s-
There are several qualifications of the term rdensityr. It is
Ímporbant to distinguish betuleen them (cf, G¡ant & lUast,1965' p.192).
They are Bulk Dets_i_t¿ urhich is the volume density of speeimens of fiâcro-
ecoplc size, and Sæi¡_!qns!!y ruhich is the density of the actual rock
fonming minerafs. Bulk dansity can be subdivided into dry and uet
bulk density. 0qy__Þ!_th_-dgns.i!-Y. is the volume density of a dessicated
rock, uhile uret, b_ulk de_nsijÞy is the density of a rock fully impregnated
I
2

-I22-
ulith ulater, For highly porous sedi¡nents the difference betueen uet
and dry densities can be 3O/, or more (Hedberg, 1936). For fresh
crystaÌline or metamorphic rocks the difference is probably less than
3fi (UJoollard, i-959). In gravity interpretation it is usual ùo use ulet
bulk densities to establish density contrasts, although if the body of
interest l-ies above the u.rater tab1e, dry bul-k densities tuould have to be
used. It appears that a further qualificatíon of the term density is
required uhen unueathered rocks deep belou.l the surface are considered.
The term rtrue bulk densityt oD ttrue density'is probably appropriate.
ff ue consider a geoloqical formation rLLhich extends from tlre surflace to
great depth, the progressfon of names to describe the density of the nock
in place are dry bulk density, uet bulk density and true bulk density.
A uet bulk density is appropriate for a rock belour the rirater table but
urithin the ueathered zone, ulhereas belou the uleathened zone the rock is
Iikely to be less porous and thus the tenm rtrue densityt should be applied.
If depth estimaLes made from magnetic anomalies over sedimentary
beds can be taken ae a guide, then the depth to fresh rock in tþe
Adelaide Geosyncline is probably 100-200 m or more" The uater level
in three abandoned mine shafts on 0RR0R00, namely the llJaukaringa ffline
(north-east), the Ajax tYline (north-east) and the Spring Creek Mine (south-
rlest) uas 20-30 m belou the surface. It is probable that the urater
table in most of the area of Adelaidean and pre-Adelaidean rocks con-
sidered in the gravity interpretation lies abouL 2O-3O m belorLr the
surface. Thus for rocks in place the various densiti.es can ba assigned
as flol}otus :
0-30 m
30-200 m
200 m+
dry bulk density
ulet bulk densitY
true density
I.2.
3.

For interpretation of regional
found ovgr granite batholiths,
required "
-123-
Bouguer gravlty anomalies, such as those
estimates of true bul-k density are
There are various direct and Índirect methods uith ulhlch to
estimate the density or density contrast betuleen rock units. These
are described fu]ly in geophysical texts (".q" Grant & Ujest, 1965¡
parasnis, 1966). Tuo main methods ulene usecl by the author; t'he uater
displacement method (sometimes referred to as Archimedes Method) and
t density profiling I .
Dny bulk densities of dry surface nock sampLes and drill core samples
ueighing about 2OO g ulerg measured by the u.rater displacament method uith
a fYlettler 11000 g balance (reading accuracy of 0.0I g). Rocks uere
ureighed in air and then suspended in a beaker of ùap uater by a thin
cotton threacl. The operation uas done quickly so that uater had titt,le
time to soak j.n. if any samples bubbled they ulere discardad. The Value
found by this method is the specific aravity of the rock. If the density
of urater used is I g/c¡n3 then the specific gravity is equal to bulk
density. For the thesis specific gravity and density are assumed to
be the same.
An approximate estimate of true density ruas obtained lor the
Adelaidean Unit by use of the tdensity profilingr method trhich uas
described by Nettleton (fSSS). LÍnsser (fSeS) has discussed some of
the problems of the method and shoun horLl in suitabl-e areas a grid of
points, rather than individual profilese can be analysed to gíve a
better estimate of the average density of rock " For the thesis an
individual profile approach was used. llJith this method Bouguer gravity
anomalies are calculated across hiqh hills for various assumed Bouguer

-r24-
densities. The Bouguer density for the anomaly uhich shours least
influence of topography is approximately the density of rock composing
the hill, provided the density of rock in the area is fairly constant.
To give best results rocks must be of constant density. For sedimentary
material best results should be found uhere the sediments are flat lying.
In these cases density profiling urill give an average density. The
method should be valid on a regional scaLe for Bouguer anomalies across
rnountain ranges provided the condition of constant rock density is satis-
fied. This appears to be the case for the Adelaide Geosyncline. A
gneat thickness of sedimentary strata ol various lÍthologies has been
folded and effectively mixed so far as the regional gravity is concerned.
Particularly in the northern part of the geosyncline u,here some peaks in
the Flinders Ranges reach to 700 m or more above the surrounding plaing
there j.s a marked correlation betuleen topography and Bouguer anomalies.
Elecause there is seismic P urave veJ-ocity data avaiLable from eanth-
quake and atomic explosion studies for the rocks of the Gauler Platform
and Adelaide Geosyncline, an attenpf uas made to use the empirical
relationships betureen velocity and rock density (e.g. lllooltard, 1959)"
Because the velocity versus density curves publíshed by various authors
give quite d.ifferent density vaì.ues for the one velocity, it appears
that the method is of limited use in the area. Houever, the seismic
data give supporting evidence that the average density of pre-Adelaidean
and Adelaidean ¡ocks is the sarne.
There is no locality in the Adelaide Geosyncline uhere the density
ofl the Adelaidean Unit can be estimated from a combined study of knoun
basement depth and Bouguer gravity anomalies over faults. In the
regional Bouguer anomaly daba, gradients on probable faultsare not uelI
*3lt1î'

-l2s-
defined, and there are no deep drill- holes through the Adelaidean UnÍt.
B, 4 p_tg¡Ieuqgl-e-stb:-LmqL!¡q averqqe- dens rtJ*
In the authorrs rLlork three main problems u.lere encountered, namely
tho problem of col-lecting an adequate nunber of rock samples to be
representative of rock lithologÍes of interest, the problem of porosity
of rocks and the pnoblem of density changing urith depth. fhese are
discussed below.
I . 4.I Sampl_i[q
From a survey of the literature it is evident that if gravity
ínterpreters collect any su¡face rock samples at allr then they usually
collect betuleen one and tuenty from each unit of Ínterest'
The author collected a total of tB6 fiet sized surface rock samples
of various lithologies from various parts of the Adelaide Geosyncline.
Some (110) uere colfected during the u¡ork on magnetic sediments; others
(+S) came from the collection accumulat,ed by fYlr, P. Binks of the SADtYl
duríng mapping of 0RR0R0tl, and others (SS) from the coffection of fflr. J.
Sumartojo of the University of Ade1aide. Because in the Adel-aidean
succession, a rock of a particul-ar lithology (".g. sj-ltstone) fcom a
part,Ícular fo¡mation is usualJ-y indistinguishable in hand specimen frorn
a rock of the same lithology in another fonmationr t,here is no advantage
in the authorts uork in shouing exactly uhere each sample came from.
tYlost of the sedimentary rocks came from 0RR0R00 (I50). Usually betrleen
one and five samples uere col-Lected at each locality; localities uie¡e
often 5-20 km apart. To give adequate informatÍon on the 20 km or more
of section of Adelaidean and Cambrian eediments uould probably require
thousands oî fresh samples. From the great va¡iability of densit'y of
I
I
I
t
il'.
$

-L26-
rocks of the same lithology it is clear that the authonfs rock samples
fall far short of being a replesentative sample (Fig. 8.2), Houever,
they do provide a starting point on the problem.
8.4,2 Ponoqitl'
surface nocks are cotnmonly more porous than at depth and a
correction for this is necessary to estimate the true density of fresh
rock in place. Hedberg (fSSO) has shourn that even in uell compacted
rocks there can be a diffe¡ence of lOfi or more betuleen dry bulk densities
and uet bulk deneities . tYletamorphic rocks can have a high porosì-ty, due
to development of fractures and the effects of solutions (Leversen, L954,
p.?I). Fox porosity corrections to be meaningful in density etudiesr a
comparison must be made betuleen fresh ancl rueathered rocks, otheruise ít
is difficult to assess ulhether the pores are filLed by solidsor fluids at
depth. parasnis (I'SSZ) made a study of rock densities in the EnþIlsh
tllidlands and considered the problem of porosity. He used density pro-
filing and measurements on sunface rocl< samples. His results of average
density using these methods u;ere almost identical. He considered that
because it is usually not knoun to uhat extent surface rocks contain
uater, the best assumption that can be made is that the true density Lies
someu¡here betueen the density of saturated and dry rock specimens. The
author considers that urhile this assumptíon is quite valid for the top
feul tens of metres or even hundreds of metres of rocks in the u¡eathered
zone, it is not valid ulhen an attampt is made to estimate the true
density of unu.leathered material ftom consíderations on surface ¡ocks.
For this case ule must consider ulhat solid material has been leached
f¡om the rocks by u.reathering procesaes (tnus increasing the porosity).
Even a ulet bulk density of a surface specì.men is likely to be considerably
l-ess than the t,rue bulk density of fresh maberj-al. To assess the
I
Þ^
I
I
{
I
lI

-t27-
impoftance of poroslùy anO the effects of leaching on meãourements
on surfaoe rocks, the follouing equation uas used:
f= fo . ftY . fzVVV
ulhere f is the true bulk density of a fresh unr¡eatherecl
rock in p1ace, u.tith volume V,
f O is the dry bulk density measurerl for the equivalent
rueathered rock, EoÇr by ruater displacement methodt
fl is the density of fluid (liquid and gas) normally
present urith the volume V1 in the fresh rock,
and f Z is the grain density of solid filling iuith Volume V2
leached fnom the fresh rock and nou replaced by voids
in the dry ueathered rock.
This equatíon ís vatid if it Ís assumed t,hat V is constant.
tl]et bulk density ( /1 is the density of pure uater) of a ueaühered
rock is given by
f w* = {o * vt 'r?V
and in general
f > fwet
Table 7.1 shous that the t¡ue density of a fresh rock in place
ls likety to be sÍgnificantly higher than the dry bulk densíty measured
for a gurface sample even if only a small porosity (S/.) ie taken ínto
account.
i
f-
I
¡
t
I
I

-128-
Table 7.1
Effect of Porosity Corrections on Dry Bulk Densities
* DensÍty of urater** 2.68 g/cn5 is also the ruet bulk density.
UsuaIIy it is not knouln t¡hat mat,erial has been leached from a rock.
Therefore to estimate the true density from studies of surface roeks
ie probably an almost impossible task. Houever, it is clear that
densiüy measurements on dry or saturated surface rocksr uill gÍve louer
estimates of t,he true density of unueathered rocks in place.
8.4.3 Density chanqes urith deoth
It is ulell established from drill hole studies that for ühe
top feur kilometres of the crust, rocks of a particular lithology
Íncrease 1n density urith depth belour the surface (e.9. Athyr 1930)"
A general increase in dry bulk density of the Anabama Gnanite ulith
depth is evident in the authorrs data from drill- hole DDH AN2 (fig.8.5).
This may be attributable to ueathering pnocesses" tlloollard (1959) states
l
I
I
fo þry)g/cnr
ì/'t
V
tfg/cns
VZ
V
2.65
2.65
2.65
2.65
2.65
0.03
o.o2
o,o2
0,01
o. 01
1.0
I.CI
1.0
1.0
1.0
0
0.0r
0.01
0 ,02
0,02
2.6( sllicates )
5'0(iron oxidessulphides )
216
5.0
2.6g**
2.70
2.72
2.7I
2.?6

-r29-
that experimental- evidence shotls that for crystalline rocks colleêted
at the surlace, a density chanqe due to the etimination of an initial
ponosity of 3/" (or less) Uy pressurer can be exactly offset by thermal
expansion at great depth. The problem is very comPlex and much u¡ork
remains to be done. ulithin the scope of present knoulLedge it appears
that a density contrast established from studies of surface rocks or
drill hole samples is probably valid at the depths of interest in
regional Bouguer gravity surveys ("'g' 5-10 km)'
8.5 sit d o d deS ediment
Because t,here is so lit,tle data available on the density of rocks
of the Adelaide Geosyncline and surrounding a¡.eas this uilt not be dis-
cussed separately flom the authorrs uJork'
B .5 . l- Direct measurements
l1umme (fSOf) measurecl bulk densities of surface samples of
diapiríc breccia and Adelaide System sediments in and aroUnd the Blinman
Diapir (ennnCHILNA). He concluded that for the purposes of interpne-
tation of his detailed Bouguer gravity surveyr the average bulk density
of the breccia near the surface uas 2.4O-2.50 g/cn3 and the average bulk
densÍty of Adetaide System sediments enclosing the breccia uas 2'62 g/cn3 '
He did not state the statistics of the sample'
The results of dritling of the Lyndhurst Diapir (CoCleV) indicated
that the dry bulk density of samples of diapiric breccia lies u.rithin a
u:ide range, Z.O5-2.85 g/cm3 (fig. 8.1), Although diapiric b¡eccia is
predominantly composed of distorted and fractured sedimentary stnata
from the lsurest menbers of the Adel-aidean Unit (ttre Catfanna Beds),
f¡om the availabl"e data it Is inappnopriate to assign a mean density fo

-130-
these units¡ Relatively undistUrbed Adelaidean sediments u,ele pene-
trated by the dríll holes. Belour 50 ft (fS m) siltst,ones and shales
of the Tap1ey HiIt Formation have dry specific gravities (dry bulk
densities) in tfie range 2,35-2.72 g/cn3 (arithmetic mean 2,49 g/cn3).
Copper-mineralized and barren tillite have dry bulk densities in the
range 2.42-2.85 g/om3. llJithout examiníng the core samples in detail
the results from the Lyndhurst Diapir are of limited val-ue on a
regional scafe. Houever, the logs on FigUra 8.1 serve to illustrate
the varÍability of densÍty of rocks in the area. For drill hole DDH LYDS
the densities ofl very near surface rocks uithin the one stratigraphic
unit (Tapj.ey Hill Formation) are significantly loure¡ than at, dept,h.
Fígure 8.2 shous histograms of the ¡esults of the authorrs measure-
ments of dry bulk density of Adelaide System sediments. The histograms
(particula¡Iy É and t) all shoui a rLride range of values ulhich is probably
índicative of variations of mineralogical composition and porosit,y'
Estimates were made of the mean and the mode of each distribution.
For histograms B and C the distributions are distinctly skeued. For
carbonatee and quartzites the mean is very close to the mode u¡hile for
siltstones and shales the mean and the mode are u:idely separated. It
is considered that the 1ou density tails of siltstones and shales may
be attributable to rueathering and highen porosity for those samples,
and that the dry buLk density of solid specimens lies close to the mode
rathe¡ than to the mean of distributions. Table 8.2 summarises the
results,
An estimate of the average density of the Adelaidean sedimentary
soction taken as a single unit composed of the four main lithologies
is shou¡n on Table 8.3. Densities of each lithologic unit have been

laute 8.2
Densíty of Adelaidean Surface Smples
I
Pc¡tsI
Dry Densityl{ode^
(e/cnrJ)
2.78
2.72
2;æ
z.62
Estinated8ffi
Confldence Limitstdm'3)
2.æ-2.85
2.6-2.æ
2.&-2.8o
2.55-2.70
Range
G/c;lr3>
2.65-2.69
2.3L-2.82
2.L8-2.8L
2.54-2.72
Sta¡rdardDeviation
Orú7
o.t2
o.15
o.05
Dry DensityMean
k/cn3)
2.76
z¿63
2,5ß
2.63
No. ofSamples
2L
4z
38
15
Lithology
Carbonates
Siltstones &calcaceoussiltstones
Shales
Quartzites
4

-L32-
ueighted according to their approximate percentage (Uy tfricHness of
seotion). The percentages uero calculated by R. Coats (pers. comm.)
of the SADM, from his measulement,s during geological mappÍng of COPLEY.
The estimates can probably be taken as a guide to other parts of the
AdelaÍde Geosyncline,
Table 8.3
Density of ùhe Adelaidean UnÍt from Surface Samples
* Approximate percentages for C0PLEY.
The data give an average dry bulk density of 2,68 g/cn3 ulhen the
modes of the dietributions on Figure 8.2 are used" Three sÍltstone
samples uere eoaked in uaüer fo¡ one uleek and then the ulet bulk den-
sitias u-rere determined. The increase avsraged 0.03 g,/omS for the three
samples. This indfcates that about 3/" of the dry rock is occupied by
vofds. ff all the rocks have an average porosity of 3% or more, then
the true bulk density (or true density) of the Adelaidean Unit rLrould be
2.71 g/cn3 o" mo"e. It Ís considered that 2.68 g/cn3 i" " lourar
LÍtho1o9y Estimated fof Section
Dny Densityffiode ( g/cnr)
Ca¡bonates
Siltstones &
CalcareoueSiltstones
ShaIes
Quartzites
llleightedfllean
7,5
39.0
oq
44,O
DensÍty
2.79
2.72
2.68
2,62
2.68 g/cn3

-133-
estimate of the average true density of the Adelaidean Unit.
8.5.2 Indirect measurements
Density profi-tee ue¡e draun for 13 east/uest, Iines of Bouguer
anomal-y data from the 19?0 helicopter gravity survey (fig, 8.3). The
original stations are not specially'marked on the profiles; they lie
at the intersection of straight line segments. Bouguer anomalies uere
calculated for six Bouguer densities (2.0r 2,2r 2,4r 2.6r 2.8 and 3.0
S/cn3) and on the origÍnal plots from uhich Figure 8.3 r.uas draun,
anomalies ulere estimated for 2.5, 2.7 and 2.9 g/cns,
The data are not ideally suited for correlation anal-ysis by computen
and uere interpreted by eye; each set of profÍles has its oun peculiari-
ties. For example, on Profiles A and e (fiq.8.3) a strong lour lies
close to the region of highest topography and cannot be removed by
reasonable changes in Bouguer density. The lou lies over granites of
the tÏlt. Painter Block. 0n Profile L, the Bouguer anomalies just to the
ulest of the area of highest t,opography shouL a strong lou uhich appears
to be associated u:ith the Quaternary sediments of the lllill-ochra Plain.
Thus not al-L of the density profiles are suitabl-e to yield an estimate
of density of the Adelaidean Unit. Six are considered unsuitabl-e.
0n most of the density profiles only a smalf part of the total
Iengùh is useful. For example, on ProfíIe D a section about 40 km
Iong across the highest peak shouts a change f¡om a loose correlation
urith the topography at a Bouguer densiùy of 2.Ao g/cn3 or less, to anti-
correlation at 2,Bo g/cnS or mor* (2.7O g/cn3 uas selected as the rbestl
Bouguer density). Reversals of correlation between peaks and anomalies
defined by three stations are common in the data (see Profile D, the
highest peak¡ Profile I near 22O kn). 25 of these uere select,ed from

-134-
the profiles; the appropriate Bouguer densities ranged betueen 2,2 and
3.t g/cn3; a histogram of the values uras faj-rly flat but shouled a
broad peak in the hange 2.5-2.9 g/cns (class interval o.z g/cns).
It is considered that r¡hile the rthree pointr r.ever'saLs are probably
useful to give a local ãverage density, tirere is an advantage in using
as great a length of profilEl as possibte to arrive at a regional average
Bouguer density.
ResuLts of densit,y profiling over distances of 30-40 km or more
are summarised on Table 8.4. The table shotus the Bouguer density
chosen anC the probable range of error. An avefage of densities is
Z,7Z g/cn3. This is assumed to be an average for the Adelaidean Unit
(TaUte 8,4). The method used is very subjective, but tr¡o repeat
estimates made one month añd t,uo months after the original study gave
almost the same result for each profile.
It is considered that the average density found by the method Ís
close to the average true density ofl the Adelaidean Unit.
Earthquake data for South Austral-ia (TaUte e.S) indicate that for
rocks in the Adetaide Geoéynclíne the seismic P uave velocity is 6.25
(J 0.03) km/sec; furthermore, there appears to be virtually no velocity
gradient from nean the surface to the bottom of the crust at 38 km
(Stenrart, Ig72). SeismÍc data from the Maralinga atomlc tests 500 km
uest of the Adelaide Geosyncline indicate that the P r¡ave velocity ofl
some of the rocks of the Gau¡Iet Pl-atform is 6.3 krn/sec (Doyle &
Everingham¡ 1964). The error bounds of the velocity for the Gaurler
PLatfonm uere not stated, but the difference in velocities for the tuo
areas are probably uithin the lfrnits of experimentaf error. Thus it
appears that on the basis of seismÍc P ulave velocityr some strata ín
the tulo areas are indlstinguishabLe.

- 135
Table 8.4
Density of the Adelaidean Unit from Density Profiling
Profile LatitudeBouguerDonsit( s/"t3
v)
Density Range
A
B
c
D
E
F
G
H
IJ
K
L
tYì
300 4r
30015 r
30051 '30046 t
310 2l
3ro14 r
3ro2gl
31045 t
szo ol
320161
3203r'
320 47 )
s2obBt
2.70
l-1. B.
f'ì.€n
2.70
3.00
Ileê.
2.'?o
2.60
2.60
2.80
floBo
O.B"
fl .B.
2.60-2,80
2.60-2.8O
2.90-3.10
2.60-2.802.5O-2,7O
2.50-2.7O
2.70-2.90
fYlean densíLy = 2.73 g/cn3
SD = 0.In.e = no estimate made because profíles arB
unsuitable
Table 8.5
Density Estimates from Seismic P tUave Data
A¡eaCrusùaI
Thickness(km )
V elocitykmrlsec
Density (s/"r3)A B c
Adelaide Geosyncline
Gauler Platform
38
3B
6,25 ! ,03
6.30 j ?
2.?5
2,77
2.86
2.89
2.70
2.72

-136-
A. Volocity to density conversion using data from
(jg Crant & lJJest, 1965 ¡ p.200 ) . For rocks of
Iogies under surface conditions.
B. Velocity to densÍt,y conversion using data from
p.1530)" For crystalLine rocks under surface
C. Velocity to density conversion using data from
Fon rocks at a depth of I km or greater.
Nafe and Drake
many litho-
lloollard ( ISSS,
conditions.
llJoollard (rSsS).
The seÍsmic P u¡ave to density conversÍons using published data give
equivocal tesuLts (TaUte e.5); any of the obtaÍned values mÍght be a
valid estimate of the average density of Adelaide System sediments "
The lack of a crustal velocity gradient in the area of the Adelaide
Geosynclina may indicate that the crustal material has a constant
density as iî composed entirely of Adelaide System sediment,s. Houever,
the experimental ulork of Birch (fgSa) on cnystalline rocks indicates
that diffe¡ent rock types under different pressure conditions can have
the same velocity but a different density. Thus it does not necessaríIy
follotu that oonstant crustal velocity implies constant crustal density.
8.6 Density data for pre-Adelaidean rocks
Density data fon the pre-Adelaidean rocks in South Australia are
scatce. The author uas only able to find a limited amount of data
for drill- core from the fYliddleback Range area of the Gau¡l-er Platform
(Taylor, 1962, 1964; Gunn, 1967) and the Broken Hill fYtines atea of
the lJjillyama Block ( eroken Hill South Pty " Ltd. , Russell, pers . comm. ) .
In vieur of the problems encountered in the study of Adelaide System
sedÍments it ulas considered that a majon sampling ppogram and analysis
rLlould be beyond the scope of the thesis. In this section the available
data and the l-imited amount of ulork performed by the author are discussad.

- I37
B .6.1 Di¡ecf mea suremênts
Taylor (op. cit.) summarised ùhe.results of density tests by
the Broken Hill Proprietary company Ltd" (eup) and the sADiyt on dritl
core from the tYlÍddreback Range area. The uo¡k tuas undertaken to
establish density contrasts beüuleen Íron ore ¡ocks and barren meta-
sedlments. He considered that for the pupposes of gravity interpre-
tation in the area the important average densíties are;
1.
2.
3.
jaspilite and magnetite rocks
hematite €cree and ore rocks
all other rocks
3,3 g/cns,
4,O g/cns,
2.? g/cns ,
He shoured ranges of densitÍes for schists (2.4-z.a g/cns), gneÍ.ss
(2,4-3,o g/cn3), amphiboliLe (2,7-s.o g/cn3) and the o¡e rocks, but did
not state sampling sùaöistics or nìeans for the individual lithologÍes.
The density ranges above conform quite urell urith other published data
(".g. srnithson, r97r). Houever, to be of general apprication in esti-
mating an average deneity of Gauller Platform rocks, means to tuo decimal
places are required. Gunn (op. cit.) measured the density of r23
surface and co¡e samples of country rock and ore types and agreed u:ith
Taylorts conclusíons. Houevet, once again the data are unsuitable for
fhe purposes of generalizing for the uhote Gauler platform.
The author measured the dny bulk density of four sorid surface
sampres of Gauller Range Porphyry, an extrusive unit ulhich crops out
ov€,l an area of 401000 sq kme and is in places accompanied by Bouguer
anomaly lou¡s. Tuo samples of flotu banded rhyolite from tuo localitieshave dry densities of 2.47 and 2.48 g/cns. Tuo sampres of massive
feJ-spar porphyry from tuo localitÍes have dny densities of 2.sB and
2.6O g/cn5, These measuremants are the only available data for acid

LISB-
igneous rocks of the Gaul-er platform.
Porphyry is a lour density unit.
It appears that the GauLer Range
The Broken HiIl results (Russe11, pêrs, oomm.) tor seLect,ed samples
from drill holes up to 850 m deep are summarised on Figure 8.4. BíotÍteand selicite schists have dry bulk densities in the range 2.66-2,7? g/c¡3(9 sampJ.esr mean 2,7r g/cn3, sD 0.0s, modo z,7z g/cn3), Garnetif er.oLrs
sohisùs have densities in the range 2.67-s.ls g/cmS (16 sample-s, mean 2.BB
g/cn3, SD 0.r4, mode z.BB g/cns),
8.6.2 Indireot me asurements
The results of seismic studies (Doyle & Everingham, 1964) from
the atomic bomb explosions at fflaralinga, South Australia indicated thaL,
fhe main P uave crustal velocity on t,he Gauler platform is 6.s km/sec
(ta¡le 8.5). üJhile the P ulave to clensity conversions shoun on Table g.S
give equivocal resul-ts it is of importance t,hat the actuaj- velocity rgcoD_
ded is cLose to that for the AdelaicJean Unit. It is possible that the
density of much of the Gaurler Platform strata (probably the metasediments)
is close to that fo¡ the Adelaidean unit" unlikr,, the case for the
Adelaide Geosyncline alea, several seismic velocitiea u,ere recorded by
Doyre and fveringham (op. cit,) for the Gaul_er platform. It is likelythat t,hese are associated ulÍth significant rithorogical changes uíthdepth.
Contrasts betueen most Adelaidean and pre-Adel"aidean rocks are
not ulell defined in the Bouguer gravity data. For example, on the
south-urest side of the ülirlyama Block t,here is not, a uell defined
gradient pararter to the contact zone (see Fig. l.g). Rather¡ the
contours lie almost at right-angles to the contact and might be inter-pret'ed to shor¡ a change of density uithin the tUillyama Bl-ock strata.

'¡ I39 -
The conùact relationships betuleen Adelaidean and pre-AdeLaidean strata
are best knou¡n around the tYlt. Painter Block (Coats & Blissett, 197f).
The Bouguer anomaly map shou.rs a 20 mg 10ú over the basement inlier
r:lhÍch is probably caused by a lorLr density body uithin it rather than
by a density contrast betueen the metasediments of the Adelaidean and
pre-Ade1aidean. This anea is discussed lurther in Chapter 9.
8.7 Denq_itv data _for post_-Ade_1ai_dean iqneous i[tÄusive_q
There is no publisherJ data available on the densities of material
composing fhe various granite bodies knotun in South Australia.
fÏleasurements of dry bulk density u.rene made on l-94 samples of drilt
oo¡e from three holes into the Anabama Granite (aritf logs in Hosking,
1970), the deepest of rL;hich reached 143 m (469 ft,) belour the surface"
The locatÍons of the drill holes are shouln on FÍgure 9.3, samples of
approximateLy I50 g in ueight ulere taken at a regular inte¡val over the
length of each core (10 feet in tu;o coles and 5 feet in the thind); the
samples ulore alL of sorid appearance, but above 20 m some contained
holes up to 2 mtn across. Drill logs shoruing the lit,hology (generalized
after Hoskingr oP. cit.) and density of samples are shouln on Figure 8.5¡
a hÍstogram of the densitÍes is shouln on Figure 8.4. Density values
lor each core becoma less scatt,ered beÌou.r 30 m; for core from holes
AN2 and AN31 30 m corresponds to a verticar depth of 2r m, urhile for
hole ANI Ìt is the actual depth belou the surface,
Table 8.6 shotus the arithmeùic mean density for samples belour 30 ¡
from each of the cores.
liJhen rounded to turo significant figures the means for the three
cores lie in the range 2.6I.2.66 g/cn3, and the mean for arl cores is
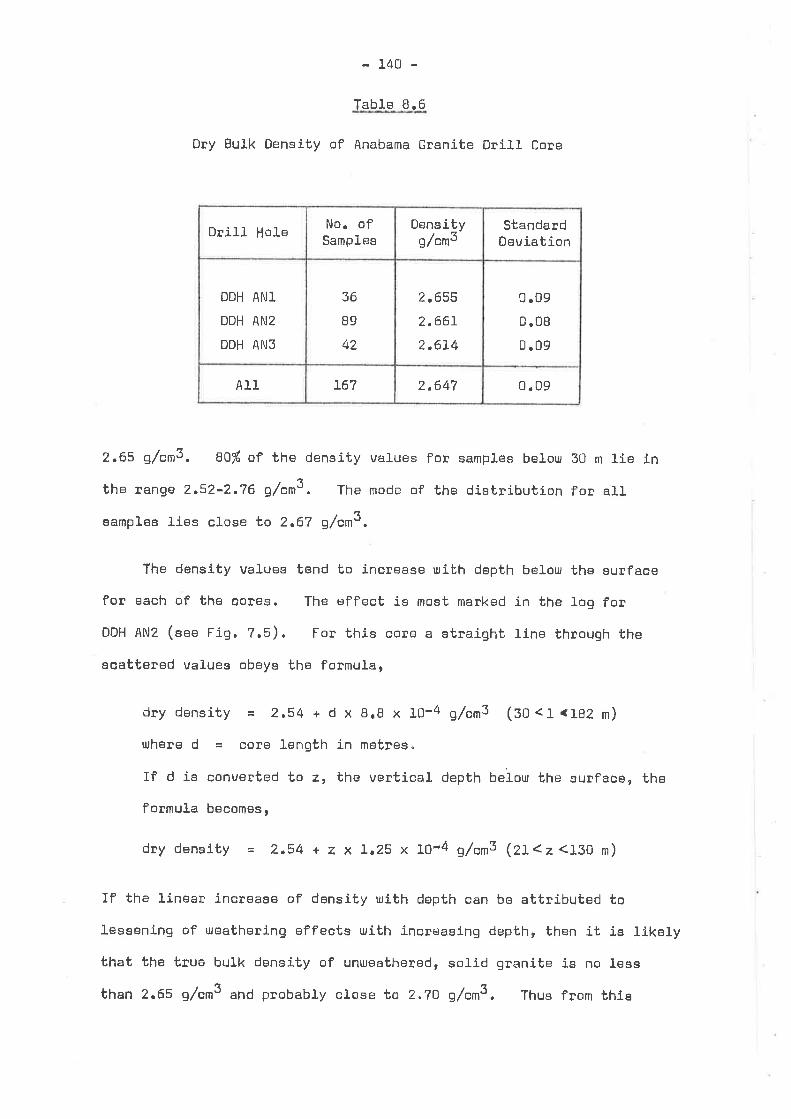
-140-
Table 8.6
Dry Bulk Density of Anabama Granite Drill Core
Drill HoleNo. of
SamplesDensÍtys/cn3
StandardDeviation
DDH ANT
DDH ANz
DDH AN3
36
89
42
2.655
2.66r2,6J.4
0.09
0 .08
0 .09
All 167 2,647 0.09
2.65 g/cn3. 801 of the density values for samples belou¡ 30 m lie in
the range 2.52-2.76 g/cns. The mode of the distribution lor aII
samples lies close to 2.67 g/cns,
The density values tend to increase urith depth belour the su¡face
for each of the cores. The effect is most marked in the log for
DDH ANz (see Fig. ?.5). For this core a straight line through the
soattered values obeys the formula,
dry density = 2,54 + d x 8.8 x ,g-4 g/an3 (90 <l <l-82 m)
uhere d = core length in metres.
If d Ís converted to z, the vertical depth belou the surface, the
formula becomes,
dry density = 2.54 + z x l.Z5 x l0-4 g/cn3 Qt<z <1S0 m)
If the linear lnc¡eage of density urith dopth can be attributed to
J.essening of uleathering effects urith increasing depth, then it is likely
that the trua bulk density of unueathered, solid graniüe is no less
than 2.65 g/cns and probably close to 2.7O g/cns. Thus from thls

-141-
core, 2,65 g/cn3 i" u minimum estimate of the t,rue bulk density. The
reason urhy the density mean fon DDH AN3 is about 0.05 g/om3 tess than
the other cones is not knor.rn; it may be an influence of lithology or
ueathering. From this core 2.61 g,/cm3 is a minÍrnum estimat,e of t¡ue
deneity.
The mean density estimates fo¡ each coree and for all cores from
the Anabama Granite, compare closely uith published figures for granites.
For example, Jakosky (fgSo e p,264) gives the normal range as 2,52-2.8I
g/cn3r and the mean ae 2.67 g/cn3. The fact that the means for eaoh
cone aDe different exemplifies the necessity to take as many observations
from as uide an area as possible if a reasonably representative density
estimate is to be derived for a rock unÍt.
Beoause there is no dríII core available from other granito bodies
in ühe area, it uras decided that a major surface samplÍng program ulould
be needed to yield even minimally useful ¡esults. Therefore, for the
purposes of gravity interpretation in the thesie granites are assumed
to have a true density of 2,61-2.65 g/cn3. It is accepted that their
true densities may be sÍgnificantly higher or louer than these values.
8.8 Conclusions
The probJ.em of finding densities of rock units and contrasts
betuleen units in the Adelaide Geosyncline and surrounding areas ie far
from solved. Houever, several useful points oan be made for inter-
pretation of the regional Bouguer anomalíes.
The Adelaidean and Cambrian sedimentary st¡ata in the Adelaide
Geosyncline, if considered as a single geoJ.ogical unit, have an
average true density of at least 2.68 g/cns and possibly up to
1.

2,?3 g'/on3 or. rIìorer
the average density
-I42-
This conforms r¡ith currenù thinking on
for the upper crust (Smithson, I97L),
4
2. At leasü part of the crust in the areas of pre-Adelaidean rocks
consists of strata simÍlar to t,he Adelaidean on the basis of
density.
3. The extrusive Gauller Range Porphyry on the Gauller Platîorm may
have a true density as loru as 2.50-2.6O g/cn3.
Tha intrusÍve Anabama Granite has a true bulk density of at least
2.6I-2.65 g/crS and possibly as much as 2.7o g/cms, 0then granitee
probably have a similar density "
5. The important density contrast for the interpretation of Bouguer
gravity louts appears üo be betueen acid igneous rocks and all
others (metasediments). If the Anabama Gcaníte is taken as a
guide, intrusive granites can be expected to be 0.05-0.10 g/cmS
less dense than enclosing metasediments "
The study of surface samples of Adelaidean strata indicates that
¡ocks of various Lithologies have significantly different densities.
The classification of rock types by the author uas very approximate.
The rocks r¡ere all uaafhered. It uould be ofl interest to ooLlect
samples of core f¡om the various drill- holes in tha Adelaide Geosyn-
cline¡ accurately classify them by microscopic st,udies, assese the
porosity and uhaü minerals have been removed by leaching, and then ¡e-
esüimate the average true density for the individual lÍthologies
and the Adelaidean Unit. Such urork could provide more reliable
density data for det,ailed gravity uork, and perhaps provide a stimulus
for uork in other axeas ulhere very lou density contrasts exist betuleen

-L43-
units of intenest. Funthermorer it could provide useful information
on the problem of ulhether a density contrast established by study of
surface rocks is also vaLid at depth.

-r44-
Dhapter 9
INTERPRETATION OF GRAVITY LOIIJS ASSOCIATED IlJITH GRANiTES
9.1 Introduction
The study of the geology of granite bodies in the Adelaide Geosyn-
cl-ine and surrounding areas has been summarised by Parktn (fSOS).
tUonk in ot,her parts of the ruorld has shourn that ulhere Boulguer anomaly
louls are associated uith granites informatioh on t,he size and shapo of
exposed graniües can be obtained (".g. Bott & Smithson, L967 ) and in
some instances can be used to predict the occurrence of large unexposed
bodies (".g. Bott & Masson-SmiÈh, 195?).
In the area of main interest in the thesis (riqs. r.g & 9.1) three
areas of granitic rocks have associated gravity louls. Anomaly 5 lies
oveD granÍtes in part of the fYlt. Painter Block, part of Anomaly 11 lies
over granitic rocks in the north side of the llJillyama Block, and Anomaly
14 lies over the Anabama Granite. It is to be expected that quanti-
tative interpretation ofl the Bouguer anomalies can yield neu informatíon
on these aleas" Other gravity lous (see F1g. g.l) in the area,
Anomalies 2r L2 and 2lr uhich may also be caused by unexposed granites,
urere not studied in detait, Anomaly 2r is being studÍed by another
uorker; AnomaJ-y 2 is under investigation by the sADfYl; Anomaly 12 is
not urell- defined by the regÌonaI gravity data.
A special problem urith the regional gravity data is that along
any single l-ine across the gravity lours ,thete\ ate too feu,t
etaùions to fulIy define profiles suitable for detailed analysis. Iù
uas found that by averaging values in a ulide strip across the anomalies
reasonably uell defined profiles can be produeed. A second probrem
common to all gravity interpretations is that of obtaining density

- l-45 -
data. The authorts uork on the Þtoblem is discussed in Chapter B,
9¡2 te eta of vit lou,r
9.2,L Geneqa_I considerations
The study of batholiths uith the gravity method has been
disdussed by Bott (rsSS, 1962)i Bott and Smith (fggg)i Skeets (rOee); Grant
& tlJest (ts0S)ç Bott& Smíthsqn (i.s0Z) endJacoby (fsZO) urho establish the
methods of attack fon solving turo maJor problems, firstly uhether a
gfavity anomaly is caused by a thickening of sediments or an unexpos€d
batholith ahd secondly, hor¡ to establish the probabre depth extent, of
the body. The approach used in gravity interpretation of anomalj-es
poesÍbly due to plutons is largely arcut and try'method. The first
etep is to propose a f,Basonable model and density contrast baeed on the
avaÍlable geoloqical and geophysicaJ- evidence. The vo1Ume of the model
should be such that the mass deficiency is approximately that established
þy integration over the ulhole anomaly. Then the theoretlcal anomaly of
the modeL (usualJ-y a profile) ís compared u¡ith the dbservecl anomaly
and the lnodel is suocessively modified untít a good fÍt is achieved.
If little useful geological or geophysical data are available the prob-
lsme afe mànifold.
The deterrnÍnation of the density contnast presents problems.
Exþorience has shourn (".9. Bott & Smithson¡ op.õit;and tho u¡ork of the
authon) tnat granites are often less dense than the country r,ooks in
ulhich ühey are emplaced, Density measurements on rock sample6 can
gfVe a guide to the contrast betueen granÍte and country rocke.
Density measurements on the rocks usually establish density contrasts
in the Dange -0.05 to -0.18 9/6¡¡3 (eott & SmÍthson, op. cit.). Irtter-
pt'etation of the anomalies using simple shapes can esüablish ¡easdnâble
,l
ll
If;

-146-
maxímum and minimum val-ues for density contrast.
Dete¡mination of the depth extent of the body is reLative to the
probJ.em of densiby contrast. Elernentary interpretation using a
simple model- uith reasonable assumed maximum and minimum density con-
t,rastse can establish the minimum and maximum depth to the bottom of a
body uith reg ard to the density contrast. There is no uay of assessing
u.rhether an estabJished density contrast is valid for the uhole geological
body unJ-ess ít is drilled. Thus a rcut and trytmodel postulated must
be regarded as a model for densÍty contrast ulhich probably approximat,es
the shape of the body.
9.2,2 Accuracy of data
The 1970 BfllR helicopter gravity and elevation data used in
the thesis u,ere establ-ished using fhe cell method of traversing descnibed
by Hastie and tlJalken (tS0Z). Gravimeters used uere a llJorden 274 (factor
0.D9I77 mq/Oiv) and a lUorden ?08 (factor 0.08330 mg/¿iv). Elevations
of stations above mean sea level- uere obtained by the tulo-barometer
technique. One barometer continuously reconded barometric pressure at
a base stationi the other measured pressure at the gravity stations.
The Bouguer anomal-y values ulere computed on the CYBER 73 computer at
fYlonash University, fYleLbourne. Statistical tests (Tucker & Brourn I 1972)
indicate that standard deviation for the elevation in the adjusted data
ulas less than 2 m (corresponding to 0.I3 mg). The maximum r.ecorded
departure of elevation f¡om the reduced l-evel uas ?.7 m (corresponding
to .5I rng). The adjustment in gravity values before correcting for
elevation uas usually less than 0.11 mg, Perhaps the most important
factor to assess is the diffe¡ence in Bouguer anomaly values betu.reen
the highest and l-ouest stations in the area if an incorrect Bouguer
density is used in reduction (Table g.1).
I
Þ-
t
f,t
it,
¡rT,1

-14?-
TabLe 9.1
Absoluto E[rors in Bouguer Anomalies
AnomalyElevation aboveMean Sea Level Average
ElevationBouguerAnomaly*
max min
5
1t
L4
679 n
33I m
424 n
242 n
62n
160 m
400 m
150 m
300 m
J".4 mg
0.8 mg
0.8 mg
* Diff*""nce in Bouguer anomaly betuleen highest and loueststations fon 0,L g/cn3 error in Bouguer density.
Table 9.1 shous that the difference betureen Bouguer anomaLies at
the highest and lor¡est stations is less than 1.5 m9 in the area of
anomalies interpreted quantitatively in the thesÍsr ifl thb BoUguer
densities used in reduction of the data ane uithÍn o.I g/cnt1 of the
correct values. For the reduction of data for quantltattve interpre-
tation, 2.67 g/cn3 uras used in the a¡ea of Anomalies 5 and 14 (maínly
Adel-aj.dean sediments, pre-Adelaidean sediments and granitas) and 2.2
g/cn3 uas used in the area of Anomaly II (mainly Quaternary to Upper
Palaeozoic sediments above sea level).
It is considered that the chogen Bouguer densities are uithin
0.1 g/cms of the average near surfaoe rock densities. Errors at any
station due to either observation or incorrect choice of Bouguer
density are usually less than t 1.0 mg. Erro¡s of this size ane
likely to have little influence on the interpretation of anomalies
of 2O mg or more. Although the Bouguer gravity anomalies have been
I¡
tr
I
I
t
t
I
i
!
I
i
I

-r48-
reduced to sea level, for interpretation of the regional data and
production of models there is no serious error in assuming the ground
su¡face flat at the average elevations indicated on Table 9.1.
9.2.3 Ça_I_c_ul_ation of excess mas_s_ Ðd_[jU!i_[LUA_!_gn_q]-_tj__con!Ias!
tYlass deficiency (hereafter referned to as excess mass) uas
calculated from the three Anomalies 5 r 1I and 14 ueing the integration
method described in Grant and llJest (fS6S, Chapter 10). The method
íncludes a tail correction for the area beyond the limÍts of integration.
A hand smoothed contour map uas draun for each anomal-y. The data ulere
regridded at 3,7 km for Anomaly 5 and 7 km for Anomafies 11 and 14 and
then the excess mass uras calculated by integration tuith a computar.
fYlass estimates ane usually lortr because there is a tendency to under-
estímate the regional fo¡ an anomaly.
Estimates of excess mass for the three anomalies ara shouln on
Table 9.2. The minimum estimates uere obtained by undenestimating,
and the maximum sstimates by overestimating the regÍonal.
Table 9,2
.L
fI
Ii
Þ.
I
If'1
il.
II
1
I
I
I
I
rlAnomaly
Excess fllass( grams )
DensÍty Co¡trast1 e/cmr )
míninfrl max
tr
11
I4
-2.L x rorT
-I.B x 1ol8
-2.0 x Io18
-2.9 x I1LT
-2.5 x 10¹⁸
-2.6 x 10¹⁸
-0.07
-0 .05
-0.08

-r49-
fylinimum densÍty contrasts for the bodies causing the anomalies
uere estimated on the assumption that the sou¡ces are rectangular
parallelepipeds, rlith tuidth defined by half amplitude points of the
anomalies. The UpFìer surface u,as assumed to be eXposedr and the
depth to the bottom surface u¡as taken as 38 km (cruet thickness)" The
theoretical anomalies uers r¡lider near the peak and ùhe base than the
observed anomalies.
9,2. 4 Production --o-f-
prof ile-s-
Profiles draun to connect vafues on any line at right-angles
to the long axis of anomafies in the regional dat'a usually differ in
detail from those adjaoent. Therefore there is an advantage in avera-
ging the Values in a leasonably uíde strip across the centre of the
anomalies. The method us¡ed r¡as to proJect all values in a strip 15-20 km
uide onto a line, and then replot and drau a smooth GUPVe through the
slightly scattered data" The profiles urere continued far enough to
allou a reasonable aesessment of the regional Bouguer gravity anomaly in
each casÊ,
Figure 9.2 shorus the Bouguer anomalies used for model studies in
thie chapter. Generalized geological eectíons are shourn.
9.2,5 fYlodelEnc
The main modelling uo¡k uas carried oUt r¡ith a computer p¡o-
gram based on the method of Talulani (1965) and ulritten by tYìr. J.
Tretheurie of Austral Exploration Servioes, Adelaide" The Program
calculates the gravity anomaly for an arbitrarily shaped three dimen-
sional solid body. The aocuracy of the program u,as checked by
computing the anomaly due t,o a sphere and comparj.nq the values uith
l
I

-150-
those calculated by hand using the efrnple sphere formula (Crant & Ulestr
1965, p.293). Valuos compared almost exactly. Values computed ulith
the program uere 0.3fi louer near the peak than those calculated by hand.
Tho discrepancy arose because ririth the computen testr the spherÍcal shape
uas appDoximated by nine horizontal circles and the curved surface betueen
the circles uJas lost. Fon the sphere model-, the program ass¡mes fhe
solid body betueen any tuo circles is a truncated cone.
As is discussed later, several reasonable density contrasts urere
tried for various models. From an initial model based on geological
and geophysical considerations, and uith an excess mass close to that
calculated for the anomaly¡ successive alterations (holding excess mass
constant) were made until. a reasonably good fit to the observed profile
uas achieved.
Because the problem of densities is not futly sol-ved¡ and it is
possible that the models (on the basis of density contrast) should be
based on a basin shape, the iterative method of Bott (fO6O) uras tried
for Anomalies II and 14. The results for Anomaly 14 ane discussed late¡"
9.3 Bououer Anomalv 14 - the Anabama GranÍt e
The peak of Anomaly 14 lies over an anea of scattered granÍte
outcrops (fig. 9.3) urhich tYtírams (fg$f ) considers are the surface
exposure of a large granite pluton or batholith (Parkln,
1969, p.34) has dnauln a cross sectÍon across the granite and Adel-aidean
strata in the area, The geology of t,he a¡ea has not been mapped in
detail. The SADtÍl unpublished photo-interpreted 0LARY sheet shotus
granite outcrops in an area some 50 km by L2 kn. A genenalized
geological cross sectj-on based on the SADI'fl mapping Ís shouln on Figure 9.2.
The exacù position of the granite boundaries is hidden by alluvium.

-151.
0n l-igure 9.3 most of the granite outcrope lie inside tulo parallel
ridges of magnetic Yudnamutana Subgroup strata (nOetaiOean). To the
Bouth-east along line AAr the cover rocks are Cainozoic and lYlesozoic
sediments of the t\lurray Basin. llìinams (sp. cit.) discussed'the field relstion-
ship of the granite. He noted that remnants of altered Adelaide System
sediments ocour uithin the granite and considers this indicates the
proximity of the noof of the granite mass. He stated that the predomi-
nant intrusive rock type is a medium to coaDse grained unstressed granite.
The aeromagnetic contour map of 0LARY shot¡¡s that the Yudnamutana
Subgroup and other Adelaidean strata contain strongly magnetic beds.
The granÍte is not strongly magnetic. Aeromagnetic contours at 1r000
gamma intervals are superimposed on the geology (fig. 9.3). It is
evident that magnetic Adelaidean material- lies beneath some of the alfuvium
uithin the general frame of Adelaidean outcrop uhich defines the limÍts
of most of the largest granite outcrops. This supports ffiiramst (op.
cit.) Ímpression that the observed granites lie near the roof of a large
body. To the south-east of the granite in the vicinity of A'on Figure
9.3 the aeromagnetic daùa indicate that magnetic strata (probably Ade-
laidean) lie at a depùh ofl 0.5-1 km beneath a cover of non-magnetic
Cainozoic and fYlesozoic strata.
There is littIe doubt that Bouguer Anomaly 14 is caused by a large
granite batholith. Three dÍmensional modeLs u,ele constructed to
account for the gravitY anomalY.
9.3.I Profiles
A profile uas drau:n normal to the long axis of the gravity
contours (RRt on Fig.9,3) using the averaging method descritred earlie¡.
A sloping tinear regional appears to be appropriate for the area (fiS. 9.4).

-L52-
A smaLt adjustment in either level or slope of the regional makes
litt1e difference to Lhe batholÍth modets produced. The original
and adjusted profilss are steeper on the south-east side than the
¡6¡tþ-urest slde.
9, 3 .2 Oe-nq-i-!v- !-qr]-t¡e -s!
In Chapter I it ulas established that the minimum density con-
trast betu.reen the Anabama Granite and the Adetaidean Unit mosù probably
lies in the range 0.0?-0.L2 g/cns. Estinrates of minimum and maximutn
density contrast, from triaf model-s indicated the ranqe 0.08-0.19 g/cn3.
The value o.1o g,/cmS ,,1"" adoPted.
9.3.3 tYlode.þ
A moclel constructed rLlith the 3D model program to account for
Bouguer Anomaly 14 is shoun on Figure 9.4 (tY|ode1 1). The initial
block uas an equilateral trapezoid u¡ith side slope 600 and u:ith surface
uidLh II km. This uidth lncludes nrost of the granite outcrops betureen
the ridges of Yudnamutana Subgnoup rocks (fig.9.3). A length of 45 km
uas adoptecl" 0n Figure 9.2 the north-east and south-uest' ends of the
block corrÊsponding to this length lie betueen the -30 and -35 mg con-
tours. Six successive adjustments of the block resuLted in the model
shouln on Figure 9.4. To obtain a good fit near the minimum of the
anomaly it ulas necessary to put the top of the block O.2 km belou
ground .l-evel, This does not necessa¡ily ímply that the corresponding
geological- bodye i.e. the qranite, does not reach the surface. Further
small adjustments to the model, for example, a slight reduction in u.ridtho
could take the block to the surface. As the model stands it uas
necessary to reduoe the uidth of the top of the block to Less than
the original fl km. The depth to the base of the Loul density block

-153-
Iies at Þ.3 kn" This is more than dotJble the depth of granite babho-
Iiths discussod by Bott and Smithson ( L967). Freliminary modelling
urith a density contrast of 0.ZO g/cns indicated that even Luith this
hlgh contrast the bottom of a trapezoidal block uould have to lie at no
less than 15 km. Variable density modelling u.ras tried but abandoned,
0n the basis of the available density data variabl-e den-sity modelJ-ing
is not ularranted.
Because there is a uleak possibÍlity that in this area the granite
and the Adelaidean Unit have essentially the same average density and
both overlie a much denser basemenȡ models u,ere constructed uith Bottrs
(fS6O) iterative method for basins. Even ulith a different, choice of
regi-ona1 than that used for the models, the models (fiq,9.4) seem
totally unreasonable" For example, on t,he north-uest side clf bhe
granites fYlodels 2 and 3 suggest the depth to basement is about 3 km.
The OLARY geological map shous that some of the youngest Adei-aidean
strata occur in this area" Because ol-der units (viz. Yudnamutana Sub-
gloup and others) also occur in the area, it is likely that the Adelaidean
Unit is up to I0 km thick on the north-uest side of the Anabama GranÍte.
9,3.4 Conclusion
0n the assurnption that the Anabama Granite is 0.1 g/cmS less
dense than both the Adelaidean Unit and any underlying pre-Adelaidean
strata in the arear the batholith lllodel I is proposed as approximating
the shape of the body. The modeL appears to extend to a depth of 23 km.
This depth differs from published work on other granites uhich suggest
10 km as a reasonabre dept,h extent. Houever, because the gravity
anomaly extends so far t,o the north-ulest and south-east of the knoun
granite outcropsr it is quite J-ikely ùhat ths density contrast (and the
-1s4-
granite) does extenci to great depth. An altennative model- to that
proposed uould probably require a laccolj.th urhich thins tourards the
edges and has a sutrstantialJ-y higher densÍty contrast (o,ZO g/en3 ot
above).
0n the basis of the model approximat,ing the shape of the Anabama
Graniüe, it appears that several of the outcrops of granite shoun on
Figure 9.3 are smal] apophoses from the main body. One of these lies
15 km north ot'Anabama HilI (the Oritl holes on the figure are located
on Anabama Hill). The uidth of the near surface part of the body is
indicated on Figure 9,3"
9.4 Bououer Anomalv 1 - Glenorchv area
llJhile the peak of Bouguer Anomaly 11 (Fig.9.6) ties over an alea
of Palaeozoic to Recent aged sediments of the Frome Embaynrent, much ofl
the southern pant of the anomaly fies over gnanitic rocks of pre-Adelaidean
age (l]]ittyama Comptex). The gravity anomaly is closely coi.ncident uith
the granitic material.
Figure 9.6 shous a sÍmplified geological sketch map of the area
taken f¡om the unpublished SADffI maps of CURNAffi0NA and 0LARY, together
ulÍth the Bouguer anomaly contours and aeromagnetic contours. Published
SADlrl 1:63r360 geological maps o1' Glenorchy (Iat. 31o45r-32000r, Iong.
139090 '-140000t) and plumbago (rat. 32000 r-32015 t, Iong. 139030 t-140000 t )
shou that pre-Adelaidean strata are predominantly of granitic compoei-
tion. For example, uithin the -25 mg gravity contour, rocks mainly
consist of anatectic granites, adamellites, migmatitesr granite gneisses
and various undifferentiated granitized terrains. Radiometric dating
data from various authors for rocks in the Crockers üJell uraniuln mi.ne
area (10 km south of Glenorchy Homestead) have been reÍnterpreted by

-15s-
Eoopor (tSlZ, in press). He considers the date of mineralization to be
1705 m.y., folloued by regional metamorphism of 5I3 m.y. From this it
can be inferred that the age of rocks in the aDea may be 1705 m.y. or more"
The published and unpublished maps indicate that outside the -25 m9
gravity contour(SO km to the east and south-east of Glenorchy)r pre-
Adelaidean rocks incluc1e both granitic material and layered metasediments.
The available information indicates that granitic material near the
southern part of Bouguer Anomaly 1l is aJ-l very old and rLras emplaced
before Adelaidean times. The AdeLaidean rocks (mainly Umberatana
Group slates, siltstones, quartzites and dolomit,es) appear to have been
deposited on the granit,es,
0n Figure 9.2 a profile is shoun along l-atitude 32o crossing the
southern pant of the anomaly. The anomaly has a broad peak and steep
gradients typical of the response expecteid over a fJ-at topped lotu density
block of limited depth extent, at or near the surface" From this and
the available geological information it appears that the gravity anomaly
is caused by pre-Adelaidean granitic rocks, uhich aDe exfrosed in the
south and extend to the north under Recent and other cover rocks. lt is
unlikely that Lou clensity cover racks contribute much to the anomaly.
Figure 9.6 shorus the outline of a pDoposed lou.r density block
responsible for the gravity anomaly. The limits of the block uere
defined on geological and geophysical grounds The southern part
encloses the bulk of the mapped granitic rocks" In the area of Recent
cover, the eastern and u.restern margins uere defined from the aelomagnetic
patfern and general aspects of the gravity anomaly. There appears to be
a correspondence betu.reen the gravity anomaly and the aeromagnetic
pattern, although it is not easy to exactly define urhat the correspondence
means. South of line AAr on Figure 9.6, there are more strong Iocalized

-156-
anomalies inside the dashed boundary than outside it. These anomalies
are probably caused by sources at a depth of 1 km or less. There is a
general rise of about 200 gammas in the background level of magnetic
anomalies over the area enclosed by the -30 mg gravity contour. Over
the northern part ofl the gravity anomaly there are feu strong localized
magnetic anomalies, urhich may indicate a composition change in the magnetic
basement, oD an increase in depth to the strongly magnotic matenial
(see Fig. 9.6). The existence of strongly magnetic material at shallou.r
depths nea¡ the minirnum of the gravity anomaly rules out the possibility
that Èhere is a great Lhickness of lou densíty sediments ulhich contribute
to the anomaly north ofl the area of outcroppÍng pre-Adel-aidean material.
The magnetic basernent aLmost certainly consists of pre-Adelaidean mate¡ial.
0ver exposed pre-Adel-aidean materiaf, strong anomalies oft,en cor¡elerte
¡rith ampþibolite dykese and metasedimentary rocks" It appears that the
sou¡Òe of the gravity anomaly is a block of lou density granitic material
ulhich is generally ueakly magnetic but contains some local strongly mag-
netic components.
l¡odels ulere constructed on the basis that the gravity anomaly is
caused by a bathoLith of loul density granitic material.
9.4.I Profiles
The Bouguer density chosen for reduction of the data uas 2.2
S/cn3. A profile uas draun normal to the long axÍs of the gravity
contours (AAt on Fig. 9.6) using t'he averaging rnethod described
earlier. Data points on the east sÍde define a fairLy definite curve;
on the rL¡est side t,here is a considerable scatter (Fig. 9,2).
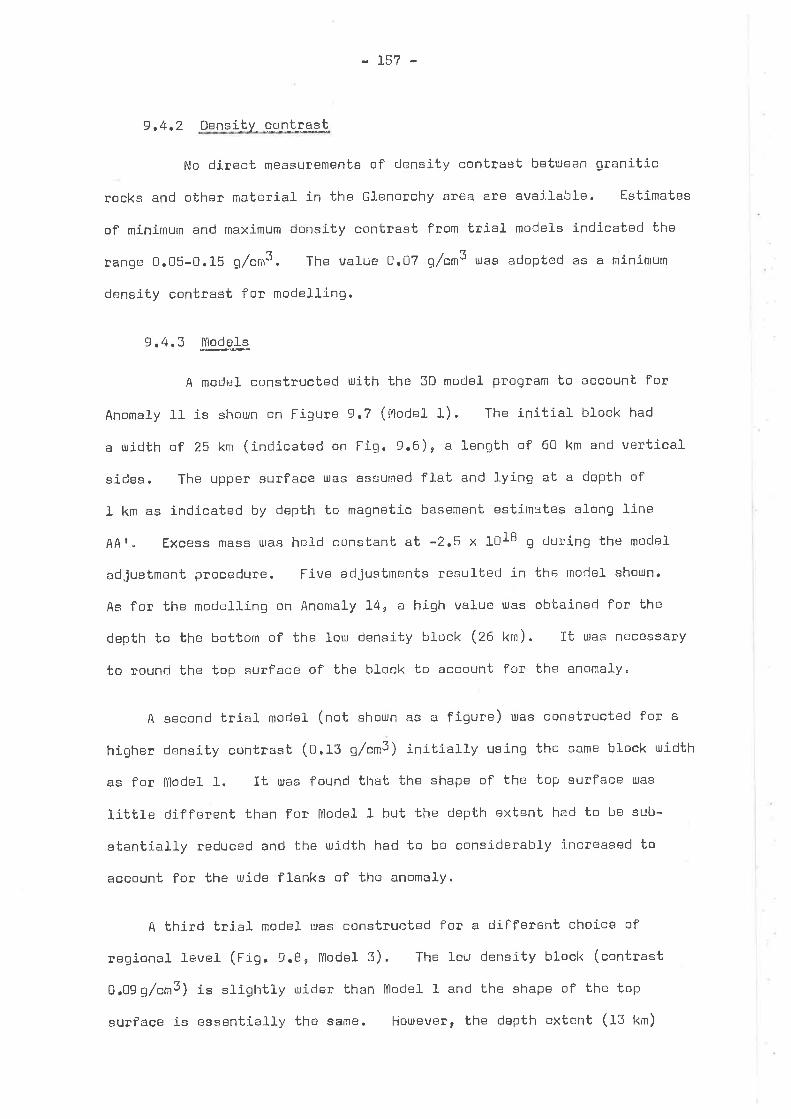
-I57-
9,4.2 Densit'Y contqaqt
No dinect measurements of density cont¡ast befueen granÍtic
rocks and other material in Èhe Glenorchy area are available. Estimates
of minimum and rnaximum density contrast from trial models indicated the
range 0.05-0.15 9/cm3. The vafue o.O? g/cn3 r"" adopted as a minimum
density contrast fo¡ modelling.
9.4.3 lLodp*Ls-
A mocJel constructed uith the 3D model progDam to account for
Anomaly 11 is shourn on Figure 9,7 (tïodel 1). The initial block had
a uidth of 25 km (indicated on Fig. 9.6), a length of 60 km and vertical
sides. The Upper surface uas assumed flat and lyinq at a depth of
1 km as indicated by depth to magnetic basement estí¡nates along line
AA r " Excess mass uras hefd constant at -2,5 x IOIB g during the model
adjustment procedure. Five adjustments resufted in the modeL shotLln.
As for the modeLling on Anomaly 14, a high value ulas obtained flor the
depth to the bottom of the lou density block (20 t<m). It ulas necessary
to round the top surface of the bl-ock to account for the anomaly.
A second trial model (not shourn as a fÍgure) uas constructed for a
higher density contrast (0,13 9/cn3) initiatly using the same block ruidth
as for tYlodeL I. It ruas found that Lhe shape ol the top surface uas
little cJifferent than for tYlodel I but t,he clepth extent had to be sub-
stantia]ly ceduced ancl the rLridth had to be considerably inc¡eased to
account for the uiide flanks of the anomaly"
A third trial model uas constructed for a different choice of
regional Level (Fig.9.8, fYlodel 3). The four density block (contrast
0.09g/cm3) is stightly uider than tYlodeÌ l and the shape of the top
surface is essentially the same. Houlever, the depth extent (13 km)

-r58-
is consiclerably less. Clearly the cofrect choice of regional is criti-
cal in determining dePth extent"
9.4.4 _C-pr3gþqioitg
Anomaly 1I is caused by lour density rock ulhich is probably a
granitic intrusion of pre-AdelaicJean age. tYlodel 3 is favoured' Granites
exposed in the vicinity of GLenorchy Homestead are probably part of the
body¡ it continues under cover to the north.
From the modelling it appears that beneath the area of Recent covefe
the t,op part of the body is rounded as if unchanged by erosion before
deposition of the sedimentary cover " If t,he model is an inclication of
the shape of the unexposed granite body, then it is not easy to explain
urhy depth estimates to magnetic basement (if assumed to be the granite or
included metasediments) do not substantially increase tourards the edges
of the body. Close to AAr on Figure 9.6 magnetic depth estimates range
from 0.5-1.0 km near the centra, Lo I-2 [4¡¡ ¡ear the edges of the loul
density block" Gravity modelling indicates 0.8 km near the centre
and 6 km near the edges. To account for this discrepancy is important
becauss magnetic anomafies urere initially used to define part of the
boundary of the lou density block, particularly the east side. Three
explanations are suggested. First¡ the strong magnetic anomalies are
caused þy small plug-Iike magnetic bodies emplaced after the general
large mass " The edge of a granite is a favourable site for Late¡
intrusions. Some of the small plugs could extend up into overlying
metasediments. Depth estimates from aeromagnetic anomalies associated
urith the plugs do not, appear to givo a valid depth estimate to t'he main
bociy. Second, the strong anomali€ls are a result of metamorphic effects
on overlying material, possibly assocÍated ulÍth emplacemenb of the
granite. For this situabion depth estimates from the strong anomalies

-159-
probably give the clepth to magnetic components of the metasecliments '
Thirci, part of the upper part of the batholith is of higher density
than the main body and does not contribute to t'he gravity anomaly '
Depth esti.mates from the strong anomalies give the true depth to the
top of the body. Ûf these explanations the first is favoured.
9.5 Bouque¡ Anoma 1v 5 - fflt, Painter area
Gravity Anomaly S Iies over the southernmost part of the tYlt'
Painter BLock. The area has been geologically mapped by t'he SADM and
the geology discussed by Coats and Blisseùt (19?1) " The geology and
BoUgUer anomaly contours are shouJn on FÌgUre 9.9 and a cross section is
shoun on Figure 9.2. Coats and Blissett think that the pre-Adelaidean
g1der Granite Suite (mainly napakivi-Iike granite and granite porphyry)
and Radium creek t\letamorphics (phyllite, schíst and quartzit'e) are domed
ínto an anticline and that this has been l-ater intruded by the lYludnauatana
Granite(granodiorite), and various pegmatites' They conside¡ that the
Olden Granite Suite is a laccolith and the f'fludnaulatana Granite is a
plug. They consider that pegmatites south-uest of the main outcrop of
the tTludnauatana Granite are related to it and may be derived from a large
unexposed bodY.
Adelaide System sediments dip outuards from the basement inlier'
Boulders of the 0lder Granite Suite rocks are found in the basal con-
glomerate of the Callanna Beds in the oLdest of the Adelaidean sediments,
indicating that at least part of the tYlt. Painter Block uas above sea
Level during Adelaidean sedimentation. Various phases of movement
have occurled, the last of uhich uas probabty in the cainozoic.
The graviby anomaly- covers only a small part of the exposures of
granites in the fYlt. Paint,er Block. This may indicate that some are

-160-
thicker than others oD that some of the granites a¡e of louler density
than others. lUhile it is almost, certain that the gravity anomaly is
causad by a grani.tic mass, from the available data it is not easy to find
r¡hich unit is the source. As can be seen on Figure 9.9r the gravity
stations are sparse, ancj the averaging method applied reasonably
successfully to Anomalies 1I and 14 does not define the shape of the
anomaly satisfactorily" Furthermore, there is no density data available
foc the granites in the area. Juto geologically acceptable models uere
constructed ruhich can account for the anomaly as deflined by the data.
9.5.I Profiles
A profile uias drauln normal to the long axis of the gravity
anomaly. Gravit,y values ruere averaged for a strip 15 km uide about AA'
(fiq. 9.2). The regional l-evel is critical for the anomal-y and a differ-
ence of one or tu¡o milligaJ.s hae a strong inf luence on tlre models.
9.5.2 Density
There are no direct density measurements available for rocks in
the area. Estimates of minimum and maximum density contrast from ple-
liminary studies of the gravity anomaly indicated the range 0.0?-0 ,2O g/cn3.
The value 0.10 q/om3,Lras acJopted for a batholith model and the vaLue
o.l4 g/cn3 uas adopted for a laccolith model.
9 .5. 3 &O .q,,!e
The tuo mode.Is constructed ulith the 3D modelling program are
shouln on Figures 9.10 and 9.1L.
tYlodel 1 uras constructed for a residual anomaly u¡ith the minimum
aoceptable cut off on its flanks " The pnesumption ulas that fhe elli-
ptically shaped core of pre-Adelaidean rocks (OtUer Granit,e Suite and

-16r-
Radium Creek fTletamonphios on Fig, 9.9) approxinrately def ines the outlÍne
of the low density mass. The model derived after five adjustments from
an 1nÍüial flat s1ab, has the shape of half an ellÍ.psoid of revolution.
The theoretical- anomaly is too u.ride near the peak and too nanroul near the
base to account for the field anomaly, but as the field anoma'ly is not
urell defined the fit is considered acceptable.
tYlodel 2 uas constructed for a residual- anomaJ.y ulith the maximum
acceptable regional Ieve1, The presumption ulas that a lorL.l density batho-
Iith ulith near surface uidth equal to that of the exposed Mudnauatana
Granite 2O kn north-east of fYlt. Painter extends beneath the surface along
the axis of the gravity lour. Four adjustments to an initial vertical
block 15 km thick resulted in the model shoun on Figure 9.1I.
9.5.4 9o.¡1g.}g*o¡S
lllithout, density data for the area and a better defined field
profile Ít is difficult to select the more reasonabfe model.
fYlodel I is geologically acceptable if it Ís assumed that the Radium
Creek fYletamorphics (probably dense strata) are thin and that the 0ldar
Granite Suite lies beneath them on the south-east side of the basement
ín1ier¡ and is a lou density unÍt. North of the area shotun on Figure 9.9
an equally extensivs area of Older Granite Suite rooks have negligible
associated gravity anomalies. tllhile it is possible thaù the 0lder
$ranite Suite rocks, extending north-east fnom the gravity lottl' are
thin thus giving little gravity response¡ from the mappÍng in the area
this seems unlikely. It is possible that there is a significant
dansity difference betueen the granites in the tuo ateas.
The batholith modet (moOef 2) is favoured for the source of the

- 162
gravity toru. tlJhile the model may be geoiogically va1id, the identity
of the 1or.u densÍty rock unit is not established. The large exposure of
Mudnauatana Granite near the north-east end of the gravity lou Ís
accompanied only by minor flexures in the contours. The data ane in-
adequate to be certain that this is part of the top of the proposed
batholith. It is poesible that the exposure is thin, ùirus causing
Iittle Desponse.
Detailed gravity lines and density measurements on rocks in the
area uill be necessary to resolve the problem.
e.6@¿
Anomaly 2 is an intense gravity loul similar in Breat shapo and
amplitude to Anomalies 1I and 14. It l-j-es over an area of Recent to
Palaeozoíc aged sediments of the Great Artesian Basin. Lonsdale and
IngaII (fSOS), in an unpubtished qualitative report on a Bouguer gravÍty
suDVBy of much of the north-east of South Australi.a, consj.dered that the
anomaly might be caused either by a thickening of Palaeozoic sediments
in a deep localized basin or by a lotu density batholith, possibly of
granitic eomposition " The author favours the latter suggestion based
on the follouling inflormation.
I The aeromagnetic contour map for the area shotus three strong
magnetic highs on the east and north sides of the gravity anomaly
in the area of steepest gravity gradients (refer Figs. 1,4 & 9.1).
The peaks of the magnetic highs lie inside the -I5 mg gravity
contou¡ (the regional level fo¡ the gravity anomaly ís close to
0 rq). preliminary depth estimates índicate that depth to the
sources is no more than 2 km.
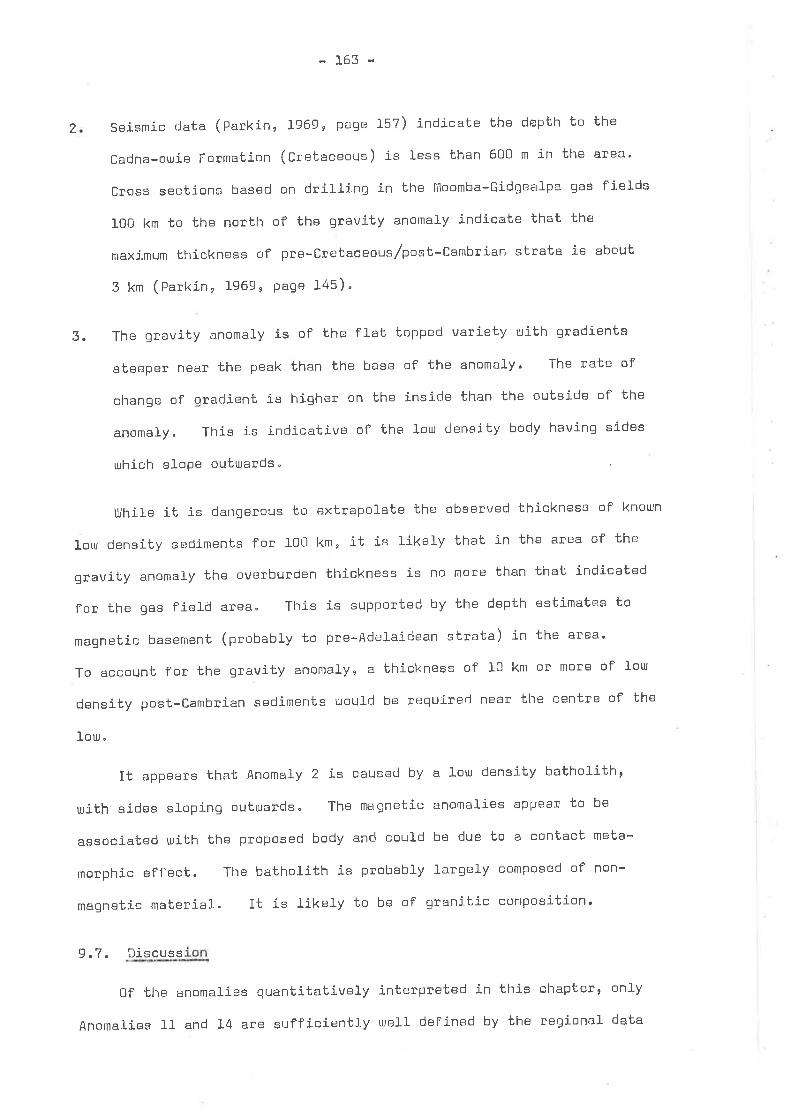
2
-163-
Seismic cJaùa (Parkin, 1969ç page 15?) indicate the depth to the
Cadna-ogie Formation (Cretaceous) is less than 600 m in the area'
cross sections based on dril-ling in the tlìoomba-Gidgealpa gas fields
100 km to the nonth of ths gravity anomaly indicate that the
maximum thickness of pre-Cretaceous/post-Cambrian strata is about
3 km (Parkin' 1969r Page 145).
3. The gravity anomaly is of the flat topped variety ¡rith gradient's
steeper near bhe peak than the L¡ase of the anomaly. The rate of
change of gradient is higher on the inside than the outside of the
anomaly. This is indicative of the lour density body having sides
ulhich slope outu.rards
ujhile it is dangerous to extrapolate the observed thickness of knoun
loLu density sediments for I00 km, it is likely that in the area of the
gravity anomaly the overburden thickness is no more than that indicated
for the gas fietd area. This is supported by the depth estimates to
rnagnetÍc basement (probably to pre-Adelaidean strata) in the area.
To account for the gravity anomaly, a thickneos of 10 km or mol.e of loul
density post-Cambrian sediments uould be ¡.equired nea¡ the centre of the
lou.
It appears that Anomaly 2 is caused by a lou density batholitht
uith sides sloping outulards. The magnetic anomalies appear to be
associated uith the proposed body and could be due to a contact meta-
morphic effect. The batholith is probably largely composed of non-
magnetic materl-al. It is tikety to be of granitic composition.
9.7 . Discuss
0f the anomalíes quantitatively interpreted in this chapterr only
Anomalies LL and 14 are sufficientJ-y uell defined by the regional data

-L64-
to ba reagonably oertain of the shape of the sources. Further field
uork' is required on Anomaly 5 "
Anomalies 11 and 14, and possibly Anomaly 5, are probably caused by
batholiths of considerable size and depth extent. If the densÍüy con-
trasts chosen for the modelling are close to the true values and exist
throughout the granÍtic bodies, then it appears that the depth to the
bottom of the Anabama Granite batholith is 23 km, to the bottom of the
Glenorchy batholith is 13 km and to the bottom of the lYlt" Painter batho-
lith is 13 km.
It is likely that AnomaLy 2 is caused by an unexposed lour density
batholith probably of granitic compositLon.

-165-
Chapter 10
CONCLUS ION
The main aims of the thesis have been to discuss magnetic anomalies
uhich a¡'e caused by near surface sources associated uiith Adel-aide Systenr
sedimentsr añd Bouguer anomaly l-ous associated u.rith granite bodies. The
research produced important neu, geophysical information on the Adelaide
Geosynclineg to find the full significance of the geophysical results
requires further geological -studies.
Neu irrformation uas flouncl on Precambrian sedimentary beds in the
Adelaide Geosyncline. To the authorrs knouledge no equivalently detailed
information has been published for other areas of Precambrian sediments in
Australia. Thus the results are important ncrt only for the Adelaide
Geosynclineu but al.so fcr other simil-ar areas, because they serve as an
example ofl uhat can be done. It is nou knoun that magnetic beds occur
at discrete levels in the stratiqraphic succession of AdeLaide System
sediments, and some of the special properties of the beds axe knou.rn.
Houever, the geological significance of the magnetic beds is stil-l not
fully understoocl, and it is to be hoped that geologists tuill- take up the
problem. Future studies of the Adelaidean stratlgraphy cannot ignore
investigation of the iron minerals"
In the area of the AdeLaide Geosyncline, it r-uas found that sediments
in Cainozoic basins ulitlrin the mountain ranges are strongly rnagnetic.
The geological significance of the concentration of iron minerals in
these strata is yet to be establ-isheci.
Interpretation of the existing aeromagnetic data urith a vieur to
finding magnetic intrusives is very difficult. This is mainly because
of thc¡ likely smal.l- size of the bodies, but also because of the dominating

- 1,66
ínfluence of anornalies rlUe to rnaqnetic AdelaicJe System becls and maqnetic
cainozoic sediments. Houever, it is knoun that various smafl int¡usíve
bodies , viz" the tllallouay Diapir carbonatiLes, are magnetíc. Thus,
despite Lhe dilficulties of detecting small intrusives, the magnetic
method must be consicered as a useful primary tool for future exploration
in the arr-la. surveys to lind small intrusives in areas of magnetic
sediments urill require a closer line spacing and lou'rer qround clearance
than the exÍsting data.
The value of detail-ed stucly of original aeromagnetic fliqht charts,
and grouncl follou-up uorke is demonstrat'ed by the thesis. To get the
futl benefits ofl the available geophysical data for other areas requires
similarly detailed analysis; a study of contour maps of i;otat maqnetic
intensitY is not enough.
InterpretationofBougueranomalylotusonLheeastsideofthe
Adelaide Geosyncline produced neu information on areas of granites'
Despite possible criticisms on geological grounds of the geophysical
mocjels produced in the research uotk, the important feature is that- the
gravity Ious are caused by larga loul density rock nasses of batholithic
form and not bodies of limited depth extent. For example, previous
geological studies in the tYlt. Painter area have indicated that most of
thegranitesintheareaarethinsheets¡thegravityresultsindicate
that a lou density mass of consiclerab.l-e depth extent occurs in the core
ofthesouthernpartofthetYlt.PainterBlock.Futureuorkont,he
geology of the tYìt. Painter aIBae the Anabama Granite and the Glenorchy
area must take the geophysical information into account"
¿
È
iI
!
I
I
&
fl
Difficulties ulere found in
bodies. This uas Particularl-Y
estimating the average density of rock
true flor ones as lithologícally complex

-167-
as the Adelaids SyStem sedÍmente, but Uaa also the casa for bodies of
essentially one llthology, viz. granite. Although the gravity data
yielded useful informatLon in areas of granites, it does not appear to
be of help on the problem of finding the thickness of Adelaide System
sediments in the Adelaide Geosyncline.
Although not clÍscussed 1n detaÍI in the thesis, the long gravity
gradients¡ and deep sorJfce magnetic ahomaly lineaments, are features
important to an overall understânding of the Adelaide Geoeyncline. In
ot,her parts of the Ulorld, Iihèaments on gravity and magnetic maps have
been found to haVe speoial associations ulith mineral provinces. Future
studies of the regional geology of the Adelaide Geosyncline must fake
these features into account.
iùþ
It'
I
t't
D
i1,
l.
¡I
lI
L
I

ATHY, L. F., t93o s
A.A.p.G.,
t6B
B TB L ]OGRA PHY
Density and porosity of sedimentary rocks. Bull'
Vol.14r pP.L-25,
a
t
È¡
,l¡
.t
d,
t;
rlI
i
I
ì
I
BANCROFT, A. ffi.,1960 s Gfavity anomalies over a buried step. Jour'
Geophys. Res.¡ Vol-.65, No.5, pp'1630-163I'
BATll, G. D. , Lg62 : tYlagnetic anomalies and magnetizations of
Iron*FornlaLion, llesabi Area, fflinnesota. Geophys ' ,
No.5, PP.627-650.
the Biuabik
\loI.2?,
BENNETT, C. J., 1968 : Aeromagnetíc studies of diaplrs in the Flinders
Rahges, South Australia " Geol. Surv. S. Aust. [Yl1n. Resour. Rev. e
No.128r PP.81-85.
BINKS, p. J., 1968 :0RR0R00 sheet. Geological atlas of South Australiat
1:250r000 Series, GebI" SrJrv. S. Aust'
BrNKs, p J., 1971 e The geology of t,he 0RRilR00 1:250t000 map aroa'
GeoI" Surv. S. Aust' Rept" Invest., No.36, 114pp"
BÛTT, tn. H. P.¡ 1955 : A geophysical. study of the gran.ite problem.
Quart. J' Geol. Soo. Lond., VoI'ILz, pp'45-67"
B0TT, [ì1. H. P., 1960 : The use of rapid digital- computing methods for
direct gravity interpretation of sedimentary basins. Geophys.
Jour. Roy. Astron. Soc., Vol.3e No.1¡ p¡:'63-67'
B0TT, t,|1. Fl. P., ]:962: A simple oriterion for interpreting negative
gravity anomalies. Geophys., \1oL,27, No.3, pp'376-38l'
B0Tl, tY|. H. P; & mASS0N-SmITH, D., I95? : The geological inLerpretation
of a,gravíby survey of the Atrston Blook and the Durham Coalfíe1d.
Quart. J. Geol". Soc. Lond., Vol.1I3r PP'95-117'
B0TT, f'|1. H. p. & sfYlITH, R.4.,1958: The estimation of the limiting
depth of gravitating bodies. Geophys, Prosp., vol.6, No.1,
pp. I-10.
B0TT, fil. H. P. & SÍYIITHS0N, S. 8., :-:967 : Gravity investigations of sub-
surface shape and mass distributions of graníte batholiths.
BulI. Geol. Soc. Amer.¡ Vol-.78r 'pp.859-878.
I
F

- 169
BRIDENe J. c., Lg64 c Pal-aeolatitudes and palaeonagnetic studies, uith
special reference to pre-carboniferous tocks in Australia.
ph.D'thesis¡AustralianNationalUniversity(unpub.).
BRoTHERT0N, R. A. , Lg67 e A metamorphic study of the [Ylarino Group phyllites '
Defamere and sell-ick Hill sections uith special reference to
the iron oxides. Hons. thesis, University of Adelaicie (unpub.).
BRIDENe J. C,e Lg67 : Preliminary palaeomagnetic
System and Cambrian of South Australia'
Aust., VoI.91, PP,I7'25'
results from the Adelaide
Trans. RoY. Soc. S.
1963 : The interpretation of magnetic
Geophys. ProsP., Vo1.11, No.4,
A preliminary note on kimberlite occurrences
J. GeoI. Soc. Aust.
CHISIIJELL, B. & GRIGG' E. C. ffì., ]:}TL: SI units' Jol-rn lljiley & Sons A/asia
PtY. Ltd., SYdneY¡ Aust", 116PP'
COATS, R. P., Lg64 e The geotogy and mineralisation of the Blinman Dome
Diapir' Geol. Surv. S' Aust' Rept' Invest" No'26' 53pp'
C0ATS, F(. P. & BLISSETT, Ao H., IgT:-: Regional and economic geology of
thetYlountPainterProvince.Geot.Surv.S.Aust.BUlf.'No.43 t 426PP"
BRUCKSHAUJ, J. ffi. & KUNARATNAtYl, K.,
anomafies due to dYkes'
PP.509-522.
C0LCHESTER e D. [Yl. e in Press !
in South Australia'
c0LLINSoN, D. U., CREER, K. tYl
in Palaeomaqnetism'
D0oK, J. C. & CARTS, S. L.ttYPical toPsoils.pp
" 815-828.
t(. (eds") tgn : fYlethods
Co. e Amsberdam, 609PP.
& RUNCORN, S.
El-sevier Pub.
Lg62 : l'{lagnetic effect and properties of
Jout. GeoPhYs. Res., Vol.67, No.2,
cOOpER, J.4., ifr press : Tectonic age determinaùions and stratigraphic
problems. tYlartin Glaessner symposium. university of Adelaide'
Centre for precambrian Research" Occasional publication.

-1?0-
DA]t.Y, 8., 1963 e The fossilifetous Cambrian successlon on Fleurieu
Peninsula, South Australia. Records of the south Australian
lYluseum. Vo1.14, No'3, pp'579-601'
DALGARNO, C. R. & J0HN50N, J. E.r 1965 I Diapiric stnuôtures and late
P¡:ecambrian-earIy Cambrian sedimentation in the Flinders
Ranges, South Australia" A 'A 'p'G ' fflem'B I PP'30I-3I4'
DALGARN0, C. R. & J0HNSON, J. E.r 1966 : PARACHILNA sheet' Geological
atlasofsouthAustra]-ialI:250,000Series.Geo1"Surv.S.Aust '
DALY' J.r 1957 : fflagnetic prospecting at Tennant Creek, Northern Terri-
tory,1935-37.Bur.fYliner.Resour.Aust.Bull.,No.4/t¡pp. I-50 .
DOCKERY, B. A. & TIPPER, D. 8., 1965
survey, Queensland, 1963'
1965/25.
Isa det'ail-ed aeromagnetic
tÏliner. Resour. Aust. þlec. e
s tÏt.Bur.
D0ÊLL, R. R. & COx, A., l:96? 3 lYleasurement of natural f,emanent magnetisa-
tion at the outcrop $ lílethods in palaeomagnetism (Coltinson?
Creer & Runcorn, eds.)" Elsevier Pub. Co", Amsterdarnt
pp.159-162.
D0YLE, H. A. & EUERINGHAI/Ie J' B'¡ Lg64 I Seísmic velocities
structure in Southern Austrafia' J' GeoI' Soc'
VoI.Ilr Pt.Ie PP.141-150'
F0RSYTHE' UJ. E. (*.1.) 1959 : Smithsonian physical tabl-es'
lfliscell-eneousCollections,VoI'l.2O'smithsonian
EADIE, E. N., I9?0: fflagnetic euDvey of the savage River and Long Plains
irondeposibs,NorthuestTasmania.Bur.lYlíner.Resour.Aust.BuII", No.120, 69PP'
FORBESe B. G.e LITL: A table of Adelaidean and cambrian stratigraphic
names.Geol.Surv.S.Aust.Quart.GeoI.Notes,No.38,pP.l.6.
and crusfalAust.,
Smithsonian
Institution.

-]-?L-
FRO|flfYl, K., 1967: tYleasurement of N'R'lIl' urith a fluxgate unit in
tylethods in palaeomagnetism ( Col-l-inson u Creer & Runcorn, eds ' ) '
Elsevier Pub , Co " , Amsterdam I PP ' 157-158 "
GAYrS.P.r1963:standardcurvesforint'e¡pretationofmagnetÍcanomal-ies over long tabular bodíes. Gaophys., vol.28e No.2¡
PP.161-200.
GAY'S.P.9Lg72:Fundamentalcharacterj-sticsofaeromagneticlinea-mentgtheirgeologicalslgnilicance:aodtheirsignificanceto geology. American Steneo lYlap Co" SaLt Lake City' Utaht
94PP'
GERRYTS, 8., Lg6? : Dianond prospecting by geophysical methods . a revieu¡
ofcurrentpracÈiceþtYliningandgrounduatergeophysics(tflor1ey, L. ll, ., ed.), Geo]-' Surv' Canad" Queenrs Printer'
0ttau¡a, Canadav PP' 439-446"
GRAHA|íIe J. tll. e Lg4g c The stability and significance of magnetism in
sedimentary rocks' Jour' Geophys" Res'' Vol'54' No'2'
pp. 131-167 "
GRANTTF"S.&ilJESTrG.F.r1965:Interpnetationtheoryinappliedgeophysics. fYlcGrarl-HÍll Book Co ' ' Neu York ' 584pp '
GUNN, P. J., Lg67 c Gravitational and magnetic interpretation of the
ffllddlebackRangearÊâySouthAustralia.[Yl.5c.thesis,University of Melbourne (unpub' ) '
GUPTA, V. K. & FTTZPATRICK' tYl.
in magnetic survaYs '
Evaluation of temain effects
Vo1.36, No.3, PP.582-589.
t\l. , I9?I :
Geophys. t
HALL, D. H.r 1959 : Direction of polarization det'ermined from magnetic
anomalies. Jour. Geophys. Res.e VoI.64, No.Ilr PP.1945-1959'
llAsTIEe L. tYl. & UJALKER, D. G.' Lg62 i Turo rnethods of gnavity traversing
urith helicopters . Bur . tYliner. Resout. Aust. Rec , L962h34.
HEALEY,D.L.,Lg66;GravityandseismicstudyofYuccaFlat,Nevadatest sit.e, Nye County, Nevacla in fYlining Geophysics (Hansen,
D. A. & others, eds.), Soc' Expl' Geophys', Vol'fr PP'84-93'

-r72-
HEDB[RGe H,, L936: The gravitational compaction of clays and shal-es.
Amer. Jou¡. Sci., Vo1.3l-, No.IB4' pp.24I-287.
HENDERSON, R. G.,1960 e A comprehensive system ofl automatic computation
in magnetic and gravity interpnetation. Geophys.r VoI.25'
No.3, pp.569-585.
HOSKING, A. J., 1970 : S.t\l .L.262¡ Anabama Hil], Proqress Report to
31st tYlay , I7TO lor S. Aust. Dept. lllines by Asarco (Aust. ) Pty.
Ltd.
HUNTINGS SURVTYS LTD., 1962 s Airborne geophysical survey of three
regions in Uganda" 5pec, Rept. No.5, Geol-. Surv. [Jganda.
HUTCHI50N, R. D.e 1958 ; fflagnetic analysi-s by logarithmic curves.
Geophys., Vo-1.23, No.4, pp.749-769 "
IRViNG, 8,, L964 : Palaeomagnetism and its application to geological
problems. John UJiley & Sons lnc., U"S.A., 399pp.
IRVING, E. & OPDYI(E, N. D", 1965 : The ¡:alaeomagnetism of the Bl-oomsburcl
Red Beds and its possibJ-er a¡rplication to the tectonic histoly of
the Appalachians. Geophys. Jour. Roy. Astron" Soc. o Vo1.9,
pp. 153-167.
JACOBY, [J. R.e I97t s Gravj.ty diagrams for thickness determination of
exposed rock bodies. Geophys., \/ol-.35, No.3, pp.4'lI-475.
JAK0SI(Y, J. J.e 1950 : Exploration geophysics" Trija Pub, Co.2 Los
Angeles e 1195PP.
JOF|NS, Rn l(.e 1969 : fxploration for copper in the Oraparinna and Enorama
Diapirs. Geol. Surv" S. Aust. IYlin" Resour. Rev., No.L3.lr PF"104-114.
KANE, lll. F., YELLIN, ¡'il. J., BILL, K. Gn & 7-IEÏZ, I., 1972 : Gravity and
magnetic evidence of lithology and structure in the Gulf of
lflain region. U " S. G " S. Prof . Pap.726-8, 22pP "
KOUL0|IZINE, T. e LAM0NTAGNE, Y" & NADIAU, 4., l-970 : New methods for the
direct intorpretat-i.on of magnetic anomafies caueed by inclineddykes oi= infinite length. Geophys., Vo1.35e No.5, pp.812-830.
KRAHmAN, R., 1936 : The geophysical magnetometric investigations on the
Ujest l,lJituatersrand areas betueen Randfontein and Potchef-
stroom, Transvaal. TranÊ. Geol-. Soc" S. Africa' Vo1.39e pp.1-44.

-r?3-
LENEY, G. llJ.,1966 : Field studies in iron ore geophysics in Mining
Geophysics (Hansen, D. A. & otherse eds.)y 3oc. Expf. Geophys.,
VoJ.l-r PP.39L'4I7.
LEVORSEN, A. I, 1954 e Geology of petroleum. [ll' H. Freeman & Co.t San
Franciscor 703PP.
LINDSLEYe D. H.e ANDREASEN, G. E. & BALSLEY, l. R.r 1966 : flagnetic
properties of rocks and mínerals in llandbook of physical
constantso fYlem. Geol. Soc. Amel. e No.97s PP.543'552'
LINSSERe H.,1965 : A generalized forn of Nettletonts density determina-
tion. Geophys. Plosp., Vol.13, No.2, PP.247-258.
LONSDALE, G. F. & TNGALLe L. N.¡ 1965
helicopter gravity surveys,
Petrol-eum Ltd. e Bur. [Yline¡.
: Strezelecki Creek and Lake Gregony
South Australia for Delhi AusLralian
Resour. Aust. P.S.S.A. 64/4812
ÍY|ABEY, D. R.e f966 : RegÍonal gravity and magnetic anomal:Les in part of
Ëureka County, Nevada in tllinÍng Geophysics (Hansen, D. A. & othens,
eds.)r Soc. Expl. Geophys., Vo1"I, pp.77-83.
IYIcGRATH, P. H., l-9?0 a Aeromagnetic interpretation Appalachiat NerLr
BrunsuÍck and Nova scotia. Geol. surv. canadar Report of
Actiuities, Part A t 1969. Paper ?0-1' pp'79-82'
IYIoGRATHe P, H. & H00De p. J., 1970 : The dippinq dyke case:
curve-matching method of magnetic interpretation'Vo1.35, No.5r PP.83I-848.
A computer
Geophys. ,
1961 s Field relationships of the Anabama GranÍts. Trans"
Soe. S. Aust., Vo1.B5, PP.121-131.
sheet. Geological atlas of South Australia,Geol. Surv, S. Aust.
fY|ILSOtYl, J. S., 1965 : Interpretation ofl the contract aeromagnetic surveyt
K0ppERAt\lANNA FR0lflE âDEEr r Souùh Austraf ia r 1963. Bur. fYliner.
Resour. Aust. Rec. I965/L.
fYlIRAfYIS, R. C.,
Roy "
Il1IRAfYlS, R. C., L964 s BURRA
Ic250r000 Senies'
-r74-
t{|u|lltilE, I.4.,1961; Geophysical investigation of the Blinman Dome.
Trarrs . Roy. Soc . S. Aust. , Vo1.85 , pp ' 7-1I '
NAGATA, T., !962: NoLes on detrital remanent maqnetization of sediment.
J.Geomagneti-sm&GeoeIec'bricity,Vol.I4rNo'2rpp'99--106'
NAIDU, P. S.r 1968 : An example of linear filtering in aeromagnetic
interpretation. Geophys., Vol'33¡ No./+, pp.602-612'
OFFLIRe R. & FLEmING, p. D., 1968 : A synthesis of folding and metamorphÍsm
in the tYìt " Lof ty Ranges , south Australia. J. Gt-'ol- " soc. Aust. ,
Vol-.l-5 , Pt.z ' PP .245-266 "
PARASNIS, D. S., 1952
fflonth. Nat,
pp.252-27L.
rocl< density in the English tYìidl-ands"
Soc., Geophys. Supp1., Vo1.6, No.5,r A study of
Roy. Astron.
PARASNIS, D. S., 1966 3
356pp.
PARKIN e L. ü,. ("d. )
S. Aust.,
fflining geophysics. EJsevier Pub. Co., Neu York¡
1969 : Handbook of South Australian Geology. GeoI. Surv.
258pp "
pETERS, L. J. , Lg4g ¡ The direct approach to rnagnotic interpreLation and
its practical applicatÍon" Geo¡:trys., Vo1.14, No.3, pp,29D-32tt
p¡UJELL, D. [iJ., 1965 : A rapid method of determining dip of magnetizaüion
inclination frorn magnetic anomalies due to dyke like bodies.
Geophys. Prosp., Vo1".13, No.2, pp.I97-2O2.
p0UJELL, D.'ü., Lg67; Fitting observed profiles to a magneliized dyke or
fault-step model. Geophys. Prosp., vol.15, No.2r PP.2DB-22O"
pREISS, t|J. V.,1971 c The biostratigraphy and palaeoecology of south
Australlan Precambrian stromatolites. Ph"D" thesis, University
of AdelairJe ( unPub. ) "
R0|YIBERG, F. &, BAR{\JES, V. E.¡ l:g4g: Correlation of gravity observatLons
u,ith the geology of the Smoothing fron Eranite mass r L1ano
Countyr Texas. Geophys., Vo1.9, No.1, pp.79-93.

RQUX, A. T., Lg67 s The applicaition of geophysics to gold exptroration
in South Africa in fYlining & groundurater geophysics (morley
L. UJ., ed.), Geol. Surv. Canad.¡ QUeenrs Printerr gttaura,
Canadar PP.425-438,
SHELLEY, E. P., 1969 : DaIY
TerritorY ' L966,
sfYlITHSoN, 5. 8., 1971 :
Uo1.36, No.4¡
-175'
River detailed aeromagnetic survey, Northern
Bur. Miner. Resour. Aust. Rept., No-139, 13pp.
Densities of metamorphic rocks. Geophys.t
pp .690-694.
SKEELS, D. C.r 1963 : An aPproximate solution of the problem of maximum
depth in gravity interpretation. Geophys., VoI.28¡ No.5¡ PP.724-735.
SmELLIE, D. ll,., 1956 ¡ Efementary approximations in aeromagnetic interpre-
tation. Geophys., Vol.21, No.4, pp.1021-1040'
SPRIGG, R. C,, J:g52: Sedimentation in the Adelaide Geosyncline and the
fo¡mation of the continental terrace. Sir Douglas fTlauson
Anniv. vol., Ed. tn. F. Glaessner & E. A. Rudd, universit,y of
Adelaide¡ PP.153-159.
sPRISG, R. C.,1953 : Geological mapo south Australia" Geol" surv. S, Aust.
STEIIJART, I. C. F., in pDess : Seismic interpretation of crustal structure
in the Ftinders-fYlt. Lofty Ranges and Gulf regions, south
Australia. J. Geol-. Soc. Aust.
STEIIJART, I. C. F. & m0UNT' T. J.e 1972: Earthquake mechanisms in South
Australia in reLatíon to plate tectonics. J. Geol. Soc. Aust.t
Vol.19r Pt.lr PP,4L-52.
STRANGìlJAY, D., 1965 : InterpretatÍon of the magnetic anomalies over
some Precambrian dykes. Geophys., vo1.30¡ No.5, pp.783-796.
SUTT0N, D. J. & fì1u[YlfIE, U,. G.r 195? : The effect ofl remanent magnetisation
on aeromagnetic interpretation. Aust. J. Phys., vo].I0t
No.4, PP.547-557.
TALIIJANI, ffi., 1965 : Computation urith the help of a digital computer ofl
magnetic anomalies caused by bodies of arbitrary shape.
Geophys., Vo1.30; No.5r PP.797-8L7.

-176-
TAYLIR, C. P.e Lg62 : Geophysical prospecting, ffliddleback Range a¡.eat
souur Austral-ia. The Broken HiIl Pty. Co" Ltd. e [l'ìelbourneo
Vic. geological rePort (unPub. ) .
TAYL0R, C. P.r J:964: Geophysical exploration for j-ron ore in the
Midclleback Range area. Aust. Inst. fYìin. ftlet . Proc. , No.209 t
pp.!9-42 "
TH0ffi50N, B. P., l-965 : Geology and mineralization of South Australia in
Geology of Australian ore deposits (mcAndre,, J', ed'), Bth
Domnonuealth l'ilin. & ffìet. Congr. Aust. & N . Z . Aust. Inst. fYlin 'ftlet. e Parl<vill-e, Uic., pp,27O-284.
TH0mSONe B. p.¡ 1966 : The l-ouer boundary of the Adelaide System and older
basement relationships in South Australia. J. Geof. Soc. Aust. t
Vol-.13, Pt.1, PP.2O3-228 "
THOtIsONe B. Pnr l9?0 : A revieur of the Precambrian and Louer
tectonics of South Australia. Trans" Roy' Soc' S'
VoJ..94, PP.I93-22L.
Proterozoic
Aust.,
Reconnaissance helicoPt,er
Ranges, South Australia, I97O.
THOfYlsON, B. P., COATS, R" P., tllÏRAtlls, R. C., FORBES, B. G., DALGARN0e C. R.
fr JSHN.S¡N, J. E., 1964 : Precambrian rock groups in the Adel-aide
Geosyncline: A neu subdiVision. Geol-. surv. s. Aust. Quart.
Geol-. Notes , No.9 , PP.l--19.
TIppER, D. B. & FIt\NEy, uJ. A., 1966 :0RR0R00-PARACHILNA airborne magnetic
and raciiometric survey , South Australia r 1965 . Bur. lfliner.
Resoun. Aust. Rec. L966/L26, 1?PP.
TUCKERT D. H. & BRUIUN, F. llJ., in press 3
g¡avity turveY ín the Flinders
Bur. []iner. Resour. Aust. Rec.
TUCKER, D. l-1. & CÛLLEnS0Ne K. D. ¡ in press : Lamprophyric intrusíons
of probable carbonatitic afflinity from south Australia.
J. Geo1. Soc. Aust.
liiATTS, IY|. D. I Lg?2 : Geological- interpretation of the Cootamqndra
gravity high, NSUJ South tlJales. J. Geo.]-. Soc. Aust., VoI.18,
Pt.3, PP.229-234.

L77 -
U,EASTe Rr C. ("d.) LgAq; Handbook of chemistry and physics. Dhemical
Rubber Co., Dlevelandr Ohio'
UIEBB, J. E.r 1966 3 The search for inon ore, Eyre Peniñsu1a, South
Australia in fYlining Geophysics (Hansen, D. A, & othsrs, eds.)
Soc. Exp1. Geophys., Vo1.1r PP.379-390'
,
YIUNG, G. A. & GERDES, Rrr Lg66: Central South Australia airborne
magnetic and radj-ometric survey, south Austrafia, 1966.
Bur. fYliner. Resour" Aust. Rec. 1966/224'
YOUNG, G. A. & SHELLEY, E. P., Lg66 c Amadegs Basin airborne magnetic and
radiometric survey, Northern Tenritoryr 1965. BUr. MÍner.
Resout. Aust. Rec. L966/23O.
ul00LLARD, G. P., 1959 :
measurements.
ZURFLUEH, E. G{ ],967
filtering.
Crustal structure frgm qravity and çeísmic
Jour. Geophys. Res., Vo1.64, No.l0, pp.1521-1544'
e Applioations of tulo-dimensional linear uavelength
Geophys.¡ VoL.32, No.6r PP.1015-1035.