universitÄt potsdam - uni-wuppertal.de
TRANSCRIPT

UNIVERSITÄT POTSDAM
EUROPÄISCHE WIRTSCHAFT UND
INTERNATIONALE WIRTSCHAFTSBEZIEHUNGEN
Natalja von Westernhagen
The Role of FDI in the Transition Process of Selected CIS and Eastern European Countries
Diskussionsbeitrag 73 Discussion Paper 73
Europäisches Institut für internationale Wirtschaftsbeziehungen (EIIW), Potsdam European Institute for International Economic Relations, Potsdam

Diskussionsbeitrag Nr. 73 Discussion Paper No. 73
Europäische Wirtschaft und Internationale
Wirtschaftsbeziehungen European Economy und International Economic Relations
Natalja von Westernhagen
The Role of FDI in the Transition Process of
Selected CIS and Eastern European Countries
September 2000
Editor: Prof. Dr. Paul J.J. Welfens University of Potsdam, European Economy and International Economic Relations August-Bebel-Str. 89, D-14482 Potsdam, Germany, Tel.: (0)331-9774614, Fax: (0)331-9774631 EUROPÄISCHES INSTITUT FÜR INTERNATIONALE WIRTSCHAFTSBEZIEHUNGEN (EIIW) ISSN 1430-5445 JEL classification: P33, P52, F21, F23, O57, C51 Key words: Foreign Direct Investment, Economic Growth, Transition Economies, GUS, Gravity Model

Summary
This paper analyses the role of FDI in a transition process. FDI is expected to play an important role in transformation. But the inflows of FDI into transition economies in general, and to CIS countries in particular, still remain very low and show a considerable potential to be exhausted in the future. In the paper the FDI experience of three CIS countries, Russia, Ukraine and Belarus is compared to that of the more advanced transition economies of Hungary and Poland. Based on the gravity model, estimates on FDI potential in these countries were made. According to the gravity model Hungary and Poland have already nearly exhausted their potential. By contrast, the results for CIS countries point to a large unexhausted potential. With respect to contribution of FDI to gross fixed capital formation the analysis shows that FDI in the long run is only supposed to play a moderate role and the saving rate of a country is expected to play a major role. In the transition process FDI might play an important role in the restructuring of the economy. Much depends on FDI policy and privatization policy of the respective country.
Zusammenfassung
Dieser Beitrag untersucht die Rolle von Direktinvestitionen im Transformationsprozess. Von Direktinvestitionen wird erwartet, daß sie eine wichtige Rolle für die Transformation spielen. Die Zuflüsse in die Transformationsländer im allgemeinen und insbesondere in die GUS-Staaten sind noch relative niedrig bzw. zeigen ein unausgeschöpftes Potential für die Zukunft. In diesem Beitrag werden die Direktinvestitionsentwicklungen dieser Länder dargestellt und verglichen mit im Transformationsprozess weiter vorangeschrittener Länder, Ungarn und Polen. Basierend auf dem Gravitationsmodel wird das Direktinvestitionspotential dieser Länder geschätzt. Gemäß Gravitationsmodell haben Ungarn und Polen ihr Potential in etwa ausgeschöpft. Die Resultate für die GUS-Staaten zeigen je doch ein großes unausgeschöpftes Potential. Bezogen auf den Beitrag von Direktinvestitionen zu Bruttokapitalbildung zeigt die Analyse, daß die Direktinvestitionen langfristig vermutlich nur eine begrenzte Rolle spielen werden, während die Hauptrolle die gesamtwirtschaftlichen Sparquote zukommt. Im Transformationsprozess könnten Direktinvestitionen eine recht wichtige Rolle für die Restrukturierung der Wirtschaft spielen-viel hängt hier von der Direktinvestitionspolitik und der Privatisierungspolitik im jeweiligen Land ab.

Natalja von Westernhagen, Lehrstuhl für Wirtschaftspolitik/ Internationale Wirtschaftsbeziehungen, Universität Potsdam, August-Bebel-Straße 89 14482 Potsdam
The Role of FDI in the Transition Process of Selected CIS and Eastern European Countries1
Natalja von Westernhagen
1. Introduction 12. Theoretical Considerations of the Impact of FDI on Transition Economies 2
2.1. The Positive Relationship Between FDI and Economic Growth 22.2. Negative Impact of FDI on the Economies of Host Countries 7
3. FDI Trends and Fluctuations in the Investigated Economies 83.1. The Impact of the Russian Financial Crisis on FDI in Investigated
Economies 8
3.2. Comparison of Country’s FDI 113.2.1 Measurement Problems 113.2.2 Countries FDI 13
3.3 Privatization and FDI 163.4. Sectoral Aspects 18
4. Empirical Investigation of the FDI Potential 214.1. Specification of the Gravity Model for FDI 224.2. Gravity Model Results 244.3. FDI and Capital Formation 28
4.3.1 Investment and Growth 284.3.2 The Contribution of FDI to Gross Fixed Capital Formation 31
5. Conclusions 366. Appendix 387. Literature 40
1 I am grateful for discussions with Roland Doehrn, RWI. The usual disclaimer applies.

1
1. Introduction
Transformation from a centrally planned to a market-based economy brings about considerable changes in external relations with the rest of the world. In this context structural adjustment and opening up to foreign direct investment (FDI) is necessary in order to achieve a new world-competitive level.
The Eastern European countries (EEC) and CIS have inherited a rather distorted economic system after the collapse of the command economy and the CMEA, respectively. The main distortions, which influenced these countries’ external relations, were concerned with special distribution networks of foreign trade; foreign trade took place only in the framework of CMEA block-countries. There was a high level of specialization and integration among the countries of the former U.S.S.R. There was a distorted pattern of sectoral structure with an oversized industry sector and underdeveloped services as well as a large CMEA military-industrial sector. CMEA trade in combination with poor integration with market economies led to the development of the distortional regional distribution of foreign trade without taking into account economic, geographical (and cultural) aspects. Specialization and integration occurred not according to comparative advantages, but more for political reasons. The former U.S.S.R. created a biased domestic and foreign trade pattern. The U.S.S.R., richly endowed with natural resources, took advantage of this situation by exporting raw materials to a large extent which is a contrast to trade among Western economies, where the most trade between OECD countries is intra- and not inter-industry trade. The other CIS countries were strongly dependent on natural resources from Russia. Moreover the production in CIS countries was predominately oriented towards the CIS (to a large extent Russian market) and did not correspond to international standards which made these countries uncompetitive in the world markets after the collapse of the Soviet Union. Thus, the collapse of the Soviet Union and the break-up of the former economic relations partly led to the necessity of foreign trade reorientation towards the West, changes in specialization patterns and looking for new opportunities of financing the emerging production.
In regards to modernization of production and the tradable sector, respectively, foreign direct investment should play a decisive role. FDI is important as it brings not only additional capital but also technology transfer and knowledge spillovers. Mostly negligible for political reasons in the past, FDI patterns, similar to foreign trade follow economic, geographic and cultural principles. This paper consists of three sections. In the first section the positive impact of FDI on economic growth in transition economies is analyzed. Additionally, possible negative affects of FDI are also taken into account. The second section analyses trends and fluctuations of FDI in five selected transition countries, where three CIS countries including Russia, the Ukraine and Belarus are compared with more advanced transition economies, namely Poland and Hungary. The conditions for FDI created through privatization are also covered by this section as well as the

2
impact of FDI on structural adjustment. The third section is an empirical investigation of potential FDI inflows for the selected countries, where analysis carried out is based on the gravity model. At the end some conclusions are made with respect to the role of FDI in the restructuring of the economy during the process of transformation and in the long run.
2. Theoretical Considerations of the Impact of FDI on Transition Economies
FDI is associated with many positive effects on economic growth in transition economies but especially in the case of insufficient competition in domestic markets. This, of course, provided that no monopoly positions of MNC subsidiaries are allowed by policymakers in the host country. Multinational Corporation (MNCs) sometimes take advantage of their economic power and create distortional conditions in which domestic firms are not able to compete. Thus, there could be some negative or ”courteous” FDI effects.
2.1. The Positive Relationship Between FDI and Economic Growth
The effect of FDI on economic growth was described in the theoretical literature and analyzed empirically with the evidence of positive results. One should divide between greenfield investment, which directly adds to the capital stock and M&E, where positive productive effects are mainly related to knowledge transfer.
FDI can contribute to growth in CIS and in investigated Visegrad countries through the following channels relevant in particular for low income host countries: • FDI contributes to the capital stock in the host countries and increases
employment. The upgrading possibilities of countries depend on their local factors such as stock of human and physical capital. FDI helps in increasing and modernizing physical capital and creating new working places to parallel the increase of production (BELLAK, 1998). Investments in physical capital and increase in employment in turn create positive real income effect, which raises demand for the products of domestic firms.
• FDI is a channel of technology transfer. An important contribution of FDI to the economic growth consists in the characteristic of FDI as vehicle for knowledge and technology transfer. From the one side, FDI through knowledge and technology transfer as well as through better managerial skills makes foreign investment enterprises (FIEs) more productive than domestic firms. In other words FDI is more productive than domestic investment. From the other side, it contributes to the expansion of domestic firms through positive spillover-effects and externalities, which arise from the nonrival nature of

3
technology and presence of FIEs at the local market thus increasing the total level of investment in the host country. The increase of total capital accumulation assumes that FDI does not “crowd out” an equal amount of investment made by domestic firms by competing on product markets and financial markets (BORENSZTEIN etc., 1995).
• FDI raises the productivity of the FIEs. Productivity which means more efficient use of inputs will increase the catching-up process. More efficient use of inputs by FIEs in comparison to domestic firms will be reached through the combination of advanced managerial skills and technology with domestic labor and inputs. As a result higher productive efficiency allows FIEs to produce products at lower costs than domestic firms. Thus FIEs are more productive than domestic firms. But FIEs can only be more productive in comparison to domestic firms if the host country possess over a minimum threshold stock of human capital. FDI interacts with the stock of human capital to influence economic growth (BELLAK, 1998, and BORENSZTEIN etc., 1995).
• Intra-firm spillover efficiency. MNCs in order to avoid leakages are eager to transfer modern and complex technologies only through the wholly- or majority-owned subsidiaries and less willing to accept any other arrangements. Transfer of technologies on an intra-firm basis is the fastest way of know-how transfer across borders. In other words, it allows host countries to get new technologies within a considerably shorter period of time than the other ways of technology transfer (BLOMSTROEM, 1991).
• Restructuring effect. Integration into the MNCs’ networks is an important impulse for the restructuring of the enterprises which enforces the competitiveness of the enterprises on the world markets and makes them stronger against domestic firms (BELLAK, 1998). The restructuring effect also plays a role when FDI means just a change of ownership and not connected with the transfer of capital. The importance of the restructuring effect for transformation economies is especially meaningful in the context of privatization since state enterprises during the Soviet era were oversized and characterized by the insufficient structures with weak control possibilities (WELFENS, 1999).
• Economies of scale. FIEs are normally larger than domestic firms and have higher R&D intensity that allows them to exploit economies of scale in host markets (BELLAK, 1998).
• FDI intensifies competition versus local firms. Introduction of new management, increased specialization and restructuring as well as new knowledge and technologies give FIEs competitive advantages against local firms. The question is whether MNCs displace domestic firms from the local market? There is evidence that FDI does not “crowd out” domestic investment but instead makes domestic firms more competitive and productive (BORENSZTEIN etc., 1995; BLOMSTROEM, 1991).

4
• FDI increases the productivity of local firms. Borensztein found empirical evidence that FDI increases total investment in the economy more than one for one, which speaks in favor of complementary effect of FDI with domestic investment2. FDI increases the total investment in the economy through complementary effects in production and through spillover-effects and externalities from knowledge and technology transfer, which raises the productivity of domestic firms thus providing their expansion.
The most important spillover-effects, which bring productivity gains to local firms are (BLOMSTROEM, 1991): - The increased competition between FIEs and local firms. Competition
between FIEs and domestic firms forces inefficient local firms to become more productive by investing in physical and human capital. The increased competition also allows for reallocation of resources from insufficient to competitively stronger domestic firms.
- Spillovers from labor and management training. MNCs often provide labor and management training that represents spillovers, which spread throughout the whole economy. Many managerial people who started their careers at the FIEs may later change to locally-owned firms or establish their own firms. Host countries receive important spillovers in this way. Such spillovers are especially crucial in the case of developing countries.
- “Supplier” spillover-effect. MNCs tend to upgrade the local facilities and enforce local suppliers of intermediate products to improve quality standards, reduce delivery time and exhibit stricter quality control in order to meet the requirements of the technology or operating methods of the FIEs. Therefore, MNCs increase the competition among suppliers which enforce them to introduce lower costs in order to compete for MNC’s market. Thus “supplier” spillover-effect improves the functioning of the whole economy.
• MNCs tend to speed up technological upgrading of domestic firms. Considering transfer of technology as a main activity of MNCs, domestic firms would in turn speed up the access to particular technologies, the existence and profitability of which are demonstrated by the MNCs. Productivity has exhibited approximately the same effect on new products introduced by MNCs and purchased by local firms. Technological gains appear here through technological spillovers inferred in new products (BLOMSTROEM, 1991).
• FDI changes the specialization pattern. With the further development the share of intra-industry FDI as well as intra-industry trade would increase like it is in highly developed countries which represent competitors of similar differentiated products. The network channels of MNCs and the intra-firm trade are likely to
2 Borensztein, E. (1995): ”One dollar increase in the net inflow of FDI is associated with an increase
in total investment in the host economy of more than one dollar”.

5
provide these changes. By contrast, domestic firms are too technologically and financially weak to initiate structural changes (BELLAK, 1998).
• FDI increases trade. FDI carried out first of all by MNCs serves as a conduit for exports from the host country. FDI creates secondary flows in the form of exports of machinery and other capital goods, also creates demand for manufactured production imports as well as for imports of services (expertise, finance, accounting and so on). FDI provides a positive effect on the balance of payments in the long run: each dollar of outward FDI is associated with $2 of additional exports and with a bilateral trade surplus of $1.7 dollars. Since FDI is associated with industrialization and change of the specialization pattern it hastens the expansion of the ”increasingly technologically-sophisticated manufactured exports” (OECD, 1998). However, FDI inflows can go along with net imports-mainly capital goods-in the medium term.
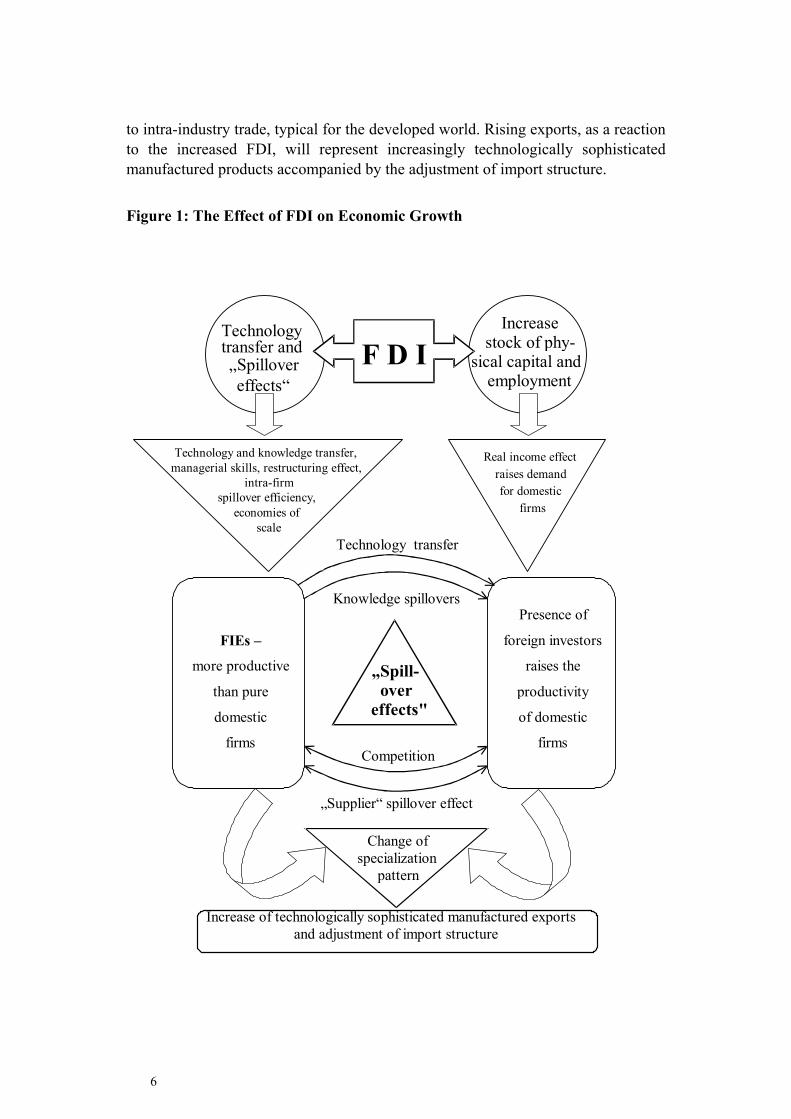
Figure 1 summarizes once again the impacts of FDI on growth. FDI contributes to the economic growth through the two main channels. First, by adding to the stock of physical capital and increasing employment in the host country with positive real income effect that raises demand for the products of domestic firms thus promoting their expansion. Second, by the productivity gains attained from the technology transfer and ”spillovers” that bring technological gains to the whole economy. Knowledge and technology transfer, higher managerial skills, restructuring effect as well as intra-firm spillover efficiency make FIEs more productive in comparison to domestic firms. Higher productivity and economies of scale give FIEs additional competitive advantages at the host market. But there is evidence that FIEs do not ”crowd out” domestic firms from the local market. Spillover effects such as increased competition, knowledge spillovers and technology transfer as well as ”supplier” spillover effect raise, in turn, the productivity of domestic firms. Increased competition provides for the reallocation of resources from insufficient to more sufficient firms, stimulates firms to be more productive, and furthermore invest in physical and human capital. Through labor training and transfer of managerial skills domestic firms ”import” significant for them organizational knowledge and labor skills which have a positive effect on productivity of domestic firms. Technological upgrading is also reinforced by domestic firms’s desire to switch from the available to the MNCs technologies. Buying new products developed by FIEs also allows for technology transfer incorporated in these products. ”Supplier” spillover effect improves the ”business environment” not only for MNCs but also for domestic firms. ”Business environment” includes lower costs, higher requirements to the quality standards, shorter time of delivery introduced by suppliers as a result of stronger competition. All these factors together raise the productivity of FIEs and domestic firms, provide technological catching up, increase both foreign and domestic investment and hence promote economic growth.
FDI initiates changes of the specialization pattern. In the long term-assuming per capita income growth-the transition countries will switch from inter-
6
to intra-industry trade, typical for the developed world. Rising exports, as a reaction to the increased FDI, will represent increasingly technologically sophisticated manufactured products accompanied by the adjustment of import structure.
Figure 1: The Effect of FDI on Economic Growth
Real income effect raises demand for domestic
firms
Technology transfer and „Spillover
effects“
Increase stock of phy-
sical capital and employment
Technology and knowledge transfer,managerial skills, restructuring effect,
intra-firm spillover efficiency,
economies of scale
FIEs –
more productive
than pure
domestic
firms
Presence of
foreign investors
raises the
productivity
of domestic
firms
„Spill- over
effects"
Technology transfer
Knowledge spillovers
Competition
„Supplier“ spillover effect
Change of specialization
pattern
Increase of technologically sophisticated manufactured exports and adjustment of import structure
F D I

7
2.2. Negative Impact of FDI on the Economies of Host Countries
Alongside with the possible positive effects of FDI on economic growth in the host countries, FDI may also be a reason for distortions in the host countries. This side of FDI does not always receive much attention in the literature. Here there are some critical or ”courteous” points: • FDI may reduce competition. Due to the intense desire of the FIEs to get gains
from the oligopolistic imperfections FIEs tend to use their market power in a way that distorts competition and thus leads to the welfare losses (BELLAK, 1998).
• FIEs get tax privileges and subsidies. FIEs get favorable opportunities from FDI tax regimes and subsidies schemes in the transition economies that give them additional competitive advantages (BELLAK, 1998).
• MNCs may restrict market access for domestic firms. MNCs may restrict access to the market through economies of scale and technological requirements because they prefer to act at oligopolistic markets (HUNYA, 1999; BURGER, 1999).
• Insufficient factor markets may limit competitive advantages of local firms. Distortions at factor markets (insufficient allocation of financial capital, human capital and infrustructural goods) make domestic firms weak in competition with FIEs as the later can use resources available through the networks of MNCs (BURGER, 1999).
• Weak competition may reduce technological spillovers. Small number of market participants and weak price competition may make spillover-effects from FDI factually impossible (BURGER, 1999).
• Restructuring effect at the initial period of FDI is not a guarantee for further success. Future success of foreign owned enterprises depends first of all on the decisions of MNCs as a reaction on changes in domestic and foreign demand and can limit ”the choice of future company strategies” (HUNYA, 1999; BELLAK, 1998).
• FDI affects only a small sector of the economy. In transition economies FDI is concentrated only on a part of the economy which represents mostly the ”best-of” privatized firms and foreign investors seem to be not motivated to make further investments in the host economy (BELLAK, 1998).
• FIEs may ignore domestic suppliers. FIEs may only use already existing supplier ”schemes” in their activities for example exporting intermediate products from neighboring and more advanced transition economies and does not involve domestic suppliers in their activities. Although it could have technological advantages for MNCs, from the other side, it restricts ”supplier” effect on the economy with it’s price and quality effects on the intermediate products in the host country and may kill domestic supplier (BELLAK, 1998).

8
• FDI reinforces polarization between high and low-income regions. As FDI is directed to the regions with abundant factor endowments, human capital and technologies, spillover effects in these regions strengthen their economic growth. From the other side the limited diffusion of knowledge and unwillingness of MNCs to invest into regions with poor factor endowments will lead to further lagging behind of poor regions (HUNYA, 1999).
• FIEs may limit local R&D activity. FIEs limit local R&D activity as the highly skilled human resources reallocated towards MNCs and competition for high-standard products within MNCs is much stronger relative to domestic firms (HUNYA, 1999).
• Local companies may not be able to adsorb and imitate technologies. Local companies that don’t invest in learning are not able to get opportunities from externalities and spillover effects. In this case MNCs should not be afraid of technological leakages and ”borrow” more than ”give” to the host markets (BURGER, 1999).
• The conflict of interests between MNCs and domestic firms. MNCs try to prevent positive technology spillovers and externalities to domestic firms (BELLAK, 1998).
3. FDI Trends and Fluctuations in the Investigated Economies
In the 1990s EEC accounted for the majority of FDI in comparison to CIS with the situation slightly changing recently. FDI were directed to the economies with a successful record in market reforms. Privatization and improvements in property rights as well as adequate economic policy encouraged this process. Channeling FDI to the ”right” sectors of the economy reinforced the positive effect of FDI: those with considerable backward and forward linkages. From the other side, financial crisis, e.g. Asian and Russian Crises in 1998 enhanced the risk of new investment into the region.
3.1. The Impact of the Russian Financial Crisis on FDI in Investigated Economies.
In Russia there was a decline in FDI during 1998 when Russia faced a major crisis. The countries with large GDP exposure in trade with Russia were especially affected by the Russian crisis (WELFENS/GANUSCHTSCHENKO, 1999). This refers to Belarus and the Ukraine with GDP exposure equal to 41% and 8% respectively (see Table A1). Although the Ukraine’s GDP exposure in trade with Russia does not seem to be that large, the trade linkages between Ukraine and

9
Russia still remain large enough (share of exports of goods from Ukraine to Russia consists 22% and 27% to both Russia and Belarus). The share of exports from Belarus to Russia is 59% representing the second highest share in trade with Russia among CIS countries after Moldova. Although Hungary and Poland, during the period of transformation, have reoriented their economies for trade primarily with the West, the impact of the Russian crisis through trade linkages on these countries was still remarkable (GDP exposure for Hungary 3% and for Poland 2% with the total share of exports of goods to Russia, Belarus and Ukraine-7% and 10% respectively). One should notice that the data represented in the table only refers to merchandize trade exposure not capturing service trade which includes, above all, transport of energy so essential for Belarus and Ukraine. In Poland there is substantial trade exposure through cross-border trade which is not reflected in the trade statistics. For Hungary indirect trade exposure through intermediary markets was estimated at 30 per cent of total exports (EBRD, 1998). The other channels of impact from the Russian crisis such as banking sector exposure, capital markets and a potential world economic slowdown are discussed in the literature.
The Russian financial crisis also had a negative effect on the exchange rate movements in many transition economies. The sharp devaluation of the Russian ruble caused a parallel depreciation in exchange rates against dollar in the most investigated countries (see Table 1). Thus in 1998, as compared to 1997, with exchange rates taken for the end of the period the depreciation of Belorussian ruble was higher than that of Russian with 86% and 71% respectively followed by the Ukrainian hryvnia with 44%. The impact was more modest in more advanced market economies. Thus, Hungary proclaimed depreciation on only 7% while in Poland there was no large negative impact on the exchange rate other than a 0,46% revaluation.
Table 1: Depreciation of Exchange Rate Against Dollar
Exchange rate - end of period % (98/97) 1997 1998 % Russia 5,96 20,65 -71 Belarus 30740 220000 -86 Ukraine 1,899 3,427 -45 Poland 3,52 3,504 0,46 Hungary 203,5 219,03 -7
Source: International Financial Statistic, August 1999; own calculations
Exchange rate movements are important as FDI stocks reported in dollar terms at the end of the year include depreciation of the exchange rate and lead to capital losses according to the official stock statistics.

10
In the Table 2 one could clearly see the impact of the Russian crisis on FDI inflows. In 1998 FDI inflows to Russia accounted for $2183 mill. in comparison with 1997, where FDI accounted for $6243 mill. meaning a fall of 65%. One should, however, mention that in 1997 FDI in Russia had reached a peak level and in previous years the amount of FDI was close to $2 bill.. Therefore one could say it returned to the previous value in 1998. The fall in FDI inflows in 1998 was also observed in Belarus and reached 28%. In Ukraine FDI continued to grow. The same was relevant for Poland. One should mention that Poland is the only country with very stable FDI growth. Hungary experienced a small drop of 7% in 1998. The peak of FDI inflows in Hungary was observed in 1995.
3.2. Comparison of Country’s FDI
To compare FDI inflows in transition economies one should take into account that statistical systems of these countries also undergo transformation and that the countries use various approaches to measure FDI. In some cases there is tendency to overestimate FDI inflows as an indicator of successful reforms.
3.2.1 Measurement Problems
To measure FDI is a difficult task. In transition economies these difficulties are also reinforced by the transformation of their statistical systems. The term FDI is defined for balance of payment purposes. According to the IMF definition FDI represents capital flows that create ”a lasting interest of an entity resident in one economy (direct investor) in an entity resident in another economy (direct investment enterprise)”. To secure the control of the investor over the company the share of the investor should be more than 10 percent–guarantee for a voice in the company decisions.
As DOEHRN (1999) points out, measuring FDI is also difficult in a technical sense. Thus even in developed countries the actual FDI can be substantially misrepresented in the official statistics. In the Germany’s case, incoming FDI is underreported by a factor of 4 to 6 and outflows seem to be overestimated to some extent. For transformation countries the incentive to overstate the incoming FDI is stronger as FDI serves as an indicator of successful transformation process.
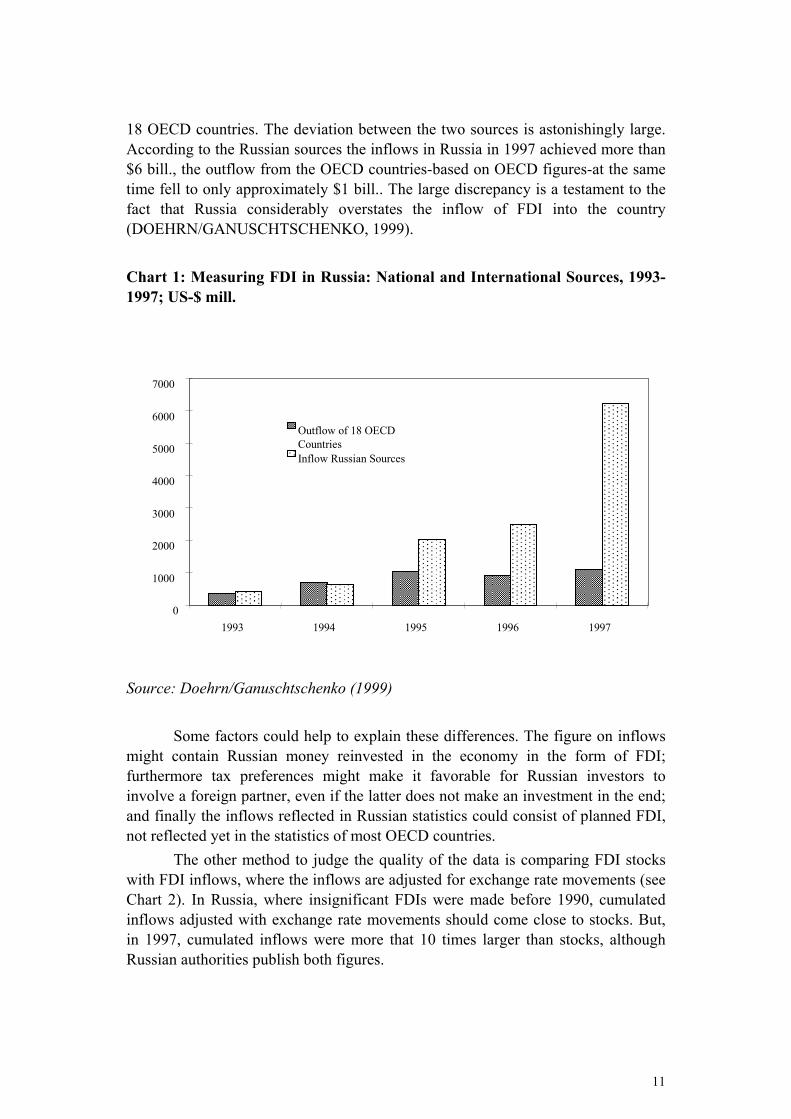
The Russian example shows the disparity of the data on FDI according to the official Russian sources and the data of OECD countries (see Chart 1). The common approach to find out the error is to compare inward investment in the recipient country with the data on outward investment in the investor’s countries. The information on Russia’s inward FDI is taken from IMF source and corresponds to the data of Russian central bank. The figures on outflow to Russia are taken from
11
18 OECD countries. The deviation between the two sources is astonishingly large. According to the Russian sources the inflows in Russia in 1997 achieved more than $6 bill., the outflow from the OECD countries-based on OECD figures-at the same time fell to only approximately $1 bill.. The large discrepancy is a testament to the fact that Russia considerably overstates the inflow of FDI into the country (DOEHRN/GANUSCHTSCHENKO, 1999).
Chart 1: Measuring FDI in Russia: National and International Sources, 1993-1997; US-$ mill.
Source: Doehrn/Ganuschtschenko (1999) Some factors could help to explain these differences. The figure on inflows
might contain Russian money reinvested in the economy in the form of FDI; furthermore tax preferences might make it favorable for Russian investors to involve a foreign partner, even if the latter does not make an investment in the end; and finally the inflows reflected in Russian statistics could consist of planned FDI, not reflected yet in the statistics of most OECD countries.
The other method to judge the quality of the data is comparing FDI stocks with FDI inflows, where the inflows are adjusted for exchange rate movements (see Chart 2). In Russia, where insignificant FDIs were made before 1990, cumulated inflows adjusted with exchange rate movements should come close to stocks. But, in 1997, cumulated inflows were more that 10 times larger than stocks, although Russian authorities publish both figures.
0
1000
2000
3000
4000
5000
6000
7000
1993 1994 1995 1996 1997
Outflow of 18 OECDCountriesInflow Russian Sources

12
Chart 2: Comparison of Stock of FDI in Russia and Cumulative Inflows, 1994-1998, US-$ mill.
Source: Doehrn/Ganuschtschenko (1999) This calculations shows another problem, especially relevant for the country
that exhibited considerable exchange rate movements in the past. As a result of market devaluation of the ruble in 1998, FDI stock measured in dollars dropped down to almost one third of the 1997 value. As no substantial outflows of FDI took place, the changes in stock reflected exchange rate movements rather than changes in foreign held equities (DOEHRN/GANUSCHTSCHENKO, 1999).
3.2.2 Country’s FDI
Before 1989 FDI into EEC and CIS countries was almost negligible. During the period of transformation to the market economy the amount of FDI to EEC and CIS has considerably increased since 1989 from ca. 10% to 28% in 1996 of the world’s total FDI. Thus in the period from 1989 to 1998 FDI into this region accounted for $74.5 mill. (WESTIN, 1999). The distribution of FDI directed to EEC and CIS did not equally occur among the economies so that a considerable part of these FDI flowed to Hungary ($16.9 mill.) and Poland ($12.4 mill.) followed by the Czech Republic ($8.5 mill.) (see Table A 2).
0
2000
4000
6000
8000
10000
12000
1994 1995 1996 1997 1998
Stocks
Cumulated Inflows (exchange-rateadjusted)

13
Table 2: Foreign Direct Investment, (US-$ mill.)
1989 1990 1991 1992 1993 1994 1995 1996 1997 1998Hungary FDI Inflows 184 311 1462 1480 2350 1144 4519 1982 2079 1936FDI Inflows per capita 18 30 141 144 228 112 443 196 206 192FDI Cum. Inflows 184 495 1957 3437 5787 6931 11450 13432 15511 17447FDI per capita 18 48 188 334 562 680 1123 1330 1536 1727FDI Cum. Inflows, adjusted 174 497 1849 3057 4695 5357 8324 8873 9099 10350FDI per capita, adjusted 17 48 178 297 456 525 816 879 901 1025Population 10,4 10,4 10,4 10,3 10,3 10,2 10,2 10,1 10,1 10,1
Poland FDI Inflows 11 89 291 678 1715 1875 3659 4498 4908 5217FDI Inflows per capita 0,3 2 8 18 45 49 95 117 127 135FDI Cum. Inflows 11 100 391 1069 2784 4659 8318 12816 17724 22941FDI per capita 0,3 2,6 10 28 72 121 215 332 458 593FDI Cum. Inflows, adjusted 2 90 359 833 2077 3560 7108 10307 13005 18239FDI per capita, adjusted 0,1 2,4 9,4 22 54 92 184 267 336 471Population 38 38,2 38,3 38,4 38,5 38,6 38,6 38,6 38,7 38,7Russia FDI Inflows 400 637 2017 2479 6243 2183FDI Inflows per capita 3 4 14 17 42 15FDI Cum. Inflows 400 1037 3054 5533 11776 13959FDI per capita 3 7 21 38 80 95FDI Cum. Inflows, adjusted 311 505 2368 4259 10033 3922FDI per capita, adjusted 2 3 16 29 68 27Population 148 148 148 147,5 147,2 146,7Ukraine FDI Inflows 159 267 521 623 743FDI Inflows per capita 3 5 10 12 15FDI Cum. Inflows 159 426 947 1570 2313FDI per capita 3 8 18 31 46FDI Cum. Inflows, adjusted 159 312 800 1407 1311FDI per capita, adjusted 3 6 16 28 26Population 51,9 51,7 51,3 50,9 50,1Belarus FDI Inflows 18 11 15 73 200 144FDI Inflows per capita 2 1 1 7 20 14FDI Cum. Inflows 18 28 43 115 315 459FDI per capita 2 3 4 11 31 45FDI Cum. Inflows, adjusted 9 6 23 81 41 92FDI per capita, adjusted 1 1 2 8 4 9Population 10,4 10,3 10,2 10,2 10,2 10,2
Source: United Nations (1998): Economic Survey of Europe, No. 3, p. 124; United Nations (1999): Economic Survey of Europe, No. 1, p. 170; International Financial Statistics, August 1999; IMF; National Bank of Poland; own calculations.

14
Table 2 represents FDI figures for the five investigated countries. It is structured in a way that reflects FDI inflows during the period of 1989-98 into these countries, cumulative FDI, with exchange rate movements adjusted cumulative FDI which functions as a proxy for the data on FDI stocks and FDI in per capita terms. The FDI stocks in dollar terms are reflected as it is used later in the gravity model. The only difference from the cumulative FDI are the incorporated exchange rate movements3. In the 1990s Hungary and Poland were the prior destinations of FDI inflows among the most advanced transition economies. At the first stage of transformation till the year 1995 Hungary held the leading position in attracting FDI reaching it’s peak of $4.5 mill. in 1995. After 1995, Poland accumulated the most of FDI including 1998 were $5.2 mill. was accounted for. In 1997 Russia even surpassed Poland with FDI reaching $6.2 mill. which declined considerably after the Russian crisis in 1998 to a mere $2.1 mill.. FDI inflows to the Ukraine remained small but increased continuously while the FDI inflows to Belarus also went back in the crisis year 1998. Cumulative FDI inflows in Hungary accounted for $17.4 mill. in 1998, in Poland for $22,9 mill.. In the three CIS countries cumulative FDI inflows reached $13.9 mill. in Russia, it was $2.3 mill. in the Ukraine and only $459 mill. in Belarus. The FDI stocks in $ (cum. FDI inflows adjusted with exchange rate) reflect exchange rate movements and therefore lead to considerable capital losses in the countries that experienced depreciation in their exchange rates. Thus, 1998 FDI stocks in Hungary accounted for $10.3 mill. instead of $17.4 mill., in Russia FDI stocks equaled only $3.9 mill. instead of $13.9 mill. and FDI stocks in Belarus equaled only 45 mill. instead of 459 mill.. Although these figures do not really reflect the loss of FDI in real terms it is still plays the role with respect to comparing the data among transition economies; one should use the data on FDI stocks in $ terms with incorporated exchange rate movements.
Hungary still held the leading position in per capita terms in 1998 with $1.7 mill. FDI per capita. Poland reported $593 mill. in per capita terms while Russian FDI per capita did not correspond the size and demand of the Russian market. The Ukraine and especially Belarus are far behind in per capita terms. Thus Russia accounted for only $95 mill. FDI per capita, Ukraine-$46 mill. and Belarus-$45 mill., respectively. If one compares Ukraine with Poland and Belarus with Hungary in terms of population then Ukraine accounted for only ca. 7,7% of Polish FDI per capita and Belarus only 2,6% of Hungarian.
3 To make FDI stocks data comparable among transition economies one should take FDI stocks in
one common currency, say in $. From the one side, FDI stocks reflect the data on FDI inflows which while collected by national authorities is expressed in national currency and should be transferred to $ at the average exchange rate for the used period. From the other side, FDI stocks reflect the share of foreign investors in FIEs and should be reported at the end of a calendar year. As the balances of enterprises are given in national currency, the data should be converted into $ with the exchange rate at the end of the calendar year. Thus, data on FDI stocks in $ has also incorporated influence of exchange rate movements and does not always correspond to the data on FDI inflows (DOEHRN/GANUSCHTSCHENKO, 1999).

15
As has already partly been discussed above, there are several problems in measuring FDI. One more problem is that not all transition economies capture in the balance of payments statistics on FDI reinvested earnings and capital loans. Most transition economies record only the equity capital component of FDI (see Table A 2). Some countries in the region have begun to alter the FDI statistics. For example, Poland (since 1990) recorded reinvested earnings and inter-company debt. Calculating the data, we followed the definition of IMF so that the data for Poland might appear to be overestimated in comparison to other countries, which in turn represent lower figures4.
3.3. Privatization and FDI
Based on the definition of FDI it is definitely in the interest of foreign investors to have long-term cooperation with substantial influence on the management of enterprises. Long-term cooperation is an attractive factor for an investor for other reasons as well, where the incentive to earn management fees and other sorts of income is especially strong as enterprises often represent units of multinational corporations where profitability depends strongly on performance of a particular enterprises. Therefore privatization and property rights play a distinguishing role for FDI.
In many transformation countries investment related to privatization accounted for a bulk in the overall amount of investment. The reason for the privatization related FDI lies in the fact that FDI were first of all attracted by the possibility of participating in the privatization of state-owned enterprises rather than by the existing GDP growth. Thus, e.g., in Russia FDI inflows increased steadily from 1994 to the crisis 1997 year, while GDP did not recover until 1997. By contrast, the restructuring and upgrading of inefficient state-owned enterprises associated with the privatization process contributes to the GDP growth in transition economies. Thus there was a boom of FDI in Hungary in 1995, while GDP growth was considerable only in 1997.
4 Direct investment is the category of international investment that reflects the objective of obtaining
a lasting interest by a resident entity in one economy in an enterprise resident in another economy. (The resident entity is the direct investor and the enterprise is the direct investment enterprise.) The lasting interest implies the existence of a long-term relationship between the direct investor and the enterprise and a significant degree of influence by the investor on the management of the enterprise. Direct investment comprises not only the initial transaction establishing the relationship between the investor and the enterprise but also all subsequent transactions between them and among affiliated enterprises, both incorporated and unincorporated (IMF, 1993). Furthermore, according to the IMF definition, there are three main components to FDI: (i) equity capital - the purchase of shares of the investor in a foreign country; (ii) reinvested earnings; and (iii) capital loans - the borrowing and lending of funds between direct investors and affiliates (EBRD Transition Report 1998).

16
The extreme example of privatization related FDI is Hungary, which in 1999 had already almost exhausted its potential for privatization related investment. The privatization of both small and large enterprises as well as infrastructure privatization was nearly completed in Hungary in 1999. The share of privatization related FDI in Hungary decreased from 68 per cent in 1995 to 13 per cent in 1997, giving space for the other FDI inflows (WIR, 1998). The majority of FDI inflows-more than 60%- realized in Hungary FDI were green-field investments and reinvested profits; not payments for privatized assets (GYÖRGY CSAKI, 1998). The amount of foreign capital represented 70% of privatization revenues in 1990-97. In Poland in the period from 1990 to 1996 foreign investors bought 45,1% of the total number of state-owned enterprises. The privatization process in Poland is not yet fully completed. It was planned to reinforce the privatization in 1999, where many sales should represent strategic stakes for foreign investors. At the same time, Poland made at large progress in the sense of creating favorable conditions for foreign investors to participate in the privatization of state-owned enterprises. Thus in Poland there are no limitations on the foreign capital stake. Non-residents may acquire or purchase up to 100% of the company’s assets. Along with that, the principle of national treatment is valid which provides equal conditions for companies with foreign investment and local firms (WARESA, 1998).
The investigated CIS countries experienced considerable difficulties in attracting foreign strategic investors. In Russia the privatization of large oil companies according to the privatization program of the 1998 has been postponed. The major privatization event at the end of 1998 was the sale of 2,5% of Gasprom. Given low dollar asset prices, the sale of state companies is not a top priority in Russia. In the Ukraine, large scale privatization was realized only to some extent, where 53 of the 200 largest enterprises were privatized. Attracting strategic foreign investors was difficult because of relatively high share prices and the lack of transparency in the procedure. In Belarus the progress in small as well as large privatization is still incomplete and hence there was only little possibility for strategic foreign investors. The lack of market oriented land code and constraints on the sale of land prevented the privatization in the agricultural sector and represented an obstacle on the urban and the rural land markets (EBRD, 1999).

17
3.4. Sectoral Aspects
The success in transformation depends heavily upon in which sectors FDI is directed. FDI should be allocated to the ”right” sectors. It is a difficult task to find comparable data on sectoral reallocation of FDI in investigated countries. As a reference one could take UNCTAD source although it differs in the definition of FDI from IMF approach as also portfolio investment and bank credits are covered to some extent.
Table 3 represents sectoral and industrial distribution of inward FDI stock in five transformation countries. The data for Belarus is a special case as it refers to the percentage of total foreign investing firms (BELARUS ECONOMIC TRENDS, 1999).
In regard to the ”right” sectors, the term ”right” is changing along with the transformation process (BELLAK, 1988). Thus FDI tends to play a different role at different stages of transformation. During the early stage, it contributes to the stabilization of the economy by supporting existing firms and modernizing their capital stock. The early stage is characterized by investments in typical sectors but provides little input to the restructuring of the economy in the form of moving from resource and labor intensive industries to R&D and capital intensive industries. In the second stage, investment will focus on restructuring and will later be directed predominately towards growing industries.
The more advanced transformation economies such as Hungary and Poland have already overcome the first stage and moved up to the next ”restructuring” ladder. The data on reallocation of FDI in Hungary and Poland confirms this suggestion. Such former targets as food industry and textiles were consequently replaced by investment in machinery and equipment industry as well as the chemical industry which are the most skill- and technology- intensive, and are the major contributors to economic growth in some transition economies. The investment in machinery and equipment industry, chemical industry was simultaneously followed by investment in services: wholesale and distributive trade, finance (banking and insurance) sector, transport and telecommunications sector which are initially supposed to support restructuring process.
The tendencies for the three CIS countries are less dynamic and show that FDI is primarily directed into traditional sectors. 16 % of FDI in Russia in 1997 were made in fuel industry, a considerably high figure in comparison to the other transition economies (this figure will be even higher if we consider FDI without banking credits). FDI in machinery and equipment still remains very low what is a serious obstacle on the way towards restructuring and sustainable growth. An astonishing amount of FDIs were made in the finance sector which shows an existing misbalance between real and monetary sectors in Russia. FDI as a whole and distributive trade are also considerable. Some large projects were started in infrastructure coinciding with the interest of investors in infrastructure potential in basic telecommunications.

18
Table 3: Central and Eastern Europe: Sectoral and Industrial Distribution of Inward FDI Stock in Selected Countries, 1997 (Percentage)
Sector/Industry Hungary Polanda Russia Ukraine Belarus* Primary sector 2 2 16 2 2 Agriculture, hunting, forestry & fishing 1 0 .. 2 2 Mining, quarrying & petroleum 1 2 16b .. 0 Secondary sector 39 61 23 50 34 Food, beverages & tobacco 9 21 9 20 7 Textiles, leather & clothing 2 3d .. 2d 4 Wood, paper, publishing & printing 3 5 4 3 11 Chemicals, chemical products 6 coke &, petroleum products
8 5 3 7 3
Non-metallic mineral products (cement & building materials)
3 6 .. 7 1
Basic metals & metal products 2 1 3 3 2 Machinery and equipment 12e 17e 4f 9 4 Electrical machinery & apparatus .. .. .. .. 2 Automotive .. .. .. .. 0 Unspecified secondary 0 3 .. .. 0 Tertiary sector 59 38 51 40 65 Electricity & water distribution 14 .. .. .. 0 Construction 4 5 .. .. 3 Wholesale trade & distributive trade 12 6 11 19 45 Hotels &restructuring (tourism) 2 .. 5 .. 1 Transport, storage & telecommunications 8 5 2 5 6 Finance (& banking & insurance) 9 21 32 9 0 Real estate, rental activities & business services
8 .. .. 2 6
Public administration, health & social services
2 0 1 5 3
Unspecified - - 10 8 0 a End 1996. b Fuel industry. c Includes ”consumer goods” d Includes other light industries e Includes electrical machinery & automotive industries. f Includes basic metals & metal products. g Includes trade in vehicles and gases. * the data for Belarus is taken as % of total foreign investing firms. Source: UNCTAD, based on national reports and Helmstedt, 1998. These estimates are based on national statistical surveys and are not necessarily comparable with FDI data based on balance-of-payments figures; Belarus Economic Trends, April-June 1999

19
Ukraine shows some slight signs of change with 9% of FDI made in the machinery and equipment industry and 7% in chemical industry (Table 3). But from the other side, the food industry is still the major recipient of FDI in the Ukraine. From the service side considerable FDI were directed towards the whole and distributive trade followed by banking, transport and telecommunications sectors. In Belarus the FDI were based on the amount of firms in the sectors food industry, textiles, wood industry, where the latter accounts for 11% of FDI. The contribution of FDI remains small in Belarus when it comes to the machinery, equipment and chemical industries. A large share consists of whole trade and the distributive trade sector. Some FDIs were made in the transport and telecommunications as well as in business services (including engineering and information services) which are supposed to support successful transition.
Except for Russia, where FDI in the primary sector accounts for a large share, FDI in other investigated countries in equal importance were made predominately in the secondary and tertiary sectors. The tertiary sector accounts for a leading position in Hungary, Russia and Belarus. Manufacturing dominates FDI in Poland and Ukraine.
The FDI made up to now in the investigated CIS were predominately directed towards traditional sectors which were developed very well before and are also further called to play an important role in the economy. A shift towards new industries and above all towards manufacturing is not observed at the present (except for the Ukraine to some extent). There is a slight improvement tendency in the service sector in the Ukraine and Belarus (in banking sector in Ukraine; in transport and telecommunications sector in both Ukraine and Belarus). High FDI in Russia into banking sector were not supported by FDI in manufacturing, chemicals and other services necessary for a balanced development. By contrast, Hungary and Poland showed first steps in restructuring by increasing investment in machinery and equipment, chemicals and at the same time in service sectors.
4. Empirical Investigation of the FDI Potential
This paper estimates potential FDI stocks for the investigated transition economies in order to determine the backlog the countries have in attracting FDI. The next step is to examine the role FDI could play in gross fixed capital formation in the long run and its contribution to the restructuring of the economy in the process of transition.

20
4.1. Specification of the Gravity Model for FDI
The estimates for potential FDI stocks in more advanced EEC-Hungary, Poland as well as in CIS countries with little market experience - Russia, Ukraine and Belarus are based on the work of DOEHRN (1999). Doehrn derives coefficients from investment of 15 OECD countries in 25 industrialized and emerging economies. He uses data on FDI-stocks abroad in 1995 that are taken from OECD sources. The coefficients from his estimation of the “normal” pattern are used to make statements on FDI stocks in investigated economies.
The regression of DOEHRN includes following parameters: FDIij = F(Yi, Yj, DISTij, R&Di, WAGEi, WAGEj, LANG, ENGLANGj) where: FDIij = FDI from country i into country j Yi and Yj = GDP in the source country and the host country, respectively DISTij = The distance between the country i and the country j R&Di = Expenditure on R&D in investing country WAGEi and WAGEj = Wage level in investor and host country, respectively LANG = Dummy variable for common language ENGLANGj = Dummy variable for English language spoken in recipient country
GDP as a proxy for the “size” of the market and R&D intensity in the investor country are considered as the main “push” factors responsible for investment activities abroad. Thus R&D would allow multinational corporations to use their ownerspecific advantages which encourage them to produce abroad. GDP in a recipient country is a main “pull” factor for FDI emphasizing therefore market penetrating as a major incentive for making FDI. The impact of wage levels in investor and host countries on FDI was argued in the literature. It is commonly expected that low wages in host county is a stimulating factor for reallocation of production and hence for FDI flows. Dummy variable of common language is a cultural stimulating factor responsible for better understanding in conducting business. DOEHRN also includes a dummy variable for the English language in his estimation. English language spoken in recipient country should also promote FDI.
DOEHRN introduced new estimation techniques in his gravity model approach. He uses a nonlinear estimator as an alternative to OLS procedure. OLS estimates, through the attempt to linearize the specification of the model by means of logarithms aggregates multiplicative error-term. The minimization of multiplicative error-term in OLS procedure is the same as the minimization of a percentage error. From this it follows that small figures in a sample exhibit could have an enormous impact on the coefficients associated with large percentage errors. An alternative to OLS procedure could be to introduce an additive error term in the gravity equation and to carry out estimation applying non-linear estimation techniques.

21
The other problem to be discussed is connected with the estimation procedure used in the case of an insufficient database. In having to estimate FDI Doehrn was confronted with the problem of lack of information in some cases in the data matrix. Under the assumption that the data is missing in the cases of very small FDI records in the recipient county he estimates the equation with a minimal possible values for FDI in every particular case what is possible with Tobit-estimator in the linear model framework. Available software only allows for the application of the Tobit-estimator in linear but not in non-linear models.
The coefficients of both linear and non-linear estimations are shown in Table 4. The R2 in the non-linear estimation is 83% and the R2 in the linear estimation is 69%. Although both estimators have common features there are some differences in the impact of such variables as WAGE and DIST. Non-linear estimation shows no evidence that wages in investor and host countries play any significant role for FDI. The impact of wage level in the host country on FDI according to the linear estimation also exhibits very low results. It shows however that low wages are not really a primer incentive for FDI but the market penetration (market size, market share) plays the major role. The variable DIST also becomes a different importance according to both estimators.
Table 4: Estimates of a Gravity Model of FDI Stock
estimation 1: Non-linear
estimation 2: Tobit
Constant 0,025 (2,1)
-4,850 (3,6)
GDP of Investor’s country ($ bln.) 0,833 (18.4)
1,064 (12,4)
GDP of Host country ($ bln.) 0,868 (25,4)
1,302 (14,6)
Distance (km) -0,178 (6,3)
-1,353 (14,6)
Expenses on Research and Development, investors country (% of GDP)
1.492 (5,8)
1,336 (4,1)
Wages investors’ country ($ 1000 per worker)
- 1,504 (4,9)
Wages host country ($ 1000 per worker) - 0,078 (0,6)
Common language (Dummy-variable) 0,979 (12,2)
1,164 (3,6)
Official language English in host country (Dummy-variable)
1,007 (12,0)
2,161 (8,7)
R2 adj. number of observations
0,830 395
0,696 464
In brackets: t-values Source: Doehrn (1999)

22
Thus non-linear estimator depicts smaller influence of distance on FDI as linear estimator. The differences in influence are also observable for other elasticities where elasticity with respect to market size in the host country is less then unity in equation 1 but above in equation 2. However, these differences refer to different methods. There is not enough empirical evidence to say which estimator provides better estimation results so both estimators are used to predict “normal” FDI pattern between Hungary, Poland, CIS countries-Russia, the Ukraine, Belarus and OECD countries. Since, Hungary and Poland represent more sophisticated transition economies it is worth comparing them to the situation in CIS countries in terms of FDI.
4.2. Gravity Model Results
The gravity model results for five countries are represented in Table 5. The table is structured in a way that shows the potential FDI pattern under the assumption the transformation countries would follow the “normal” sample characteristic for developed market economies-the no change scenario. It also represents two more scenarios where it is assumed that these countries would exhibit a light catching up process during following ten years with the GDP growth in the scenario 2005 I of 2%-points above OECD growth equal to 2,5%-points; and in the scenario 2005 II of 4%-points above the OECD. The catching up scenarios, however, look too optimistic for some countries and too pessimistic for the other. Thus the growth rate of Hungary in 1997 was 4,4%, for Poland 6,9% while for Russia it was only 0,8%, the Ukraine-3,2% and Belarus 10% where the situation for the CIS countries has changed drastically lately. The same catching up scenario is chosen for all five countries in order to provide a better comparison basis. The next part of the table shows FDI inflows per year necessarily to compensate for the lag in FDI stocks (cum. inflows) 5 and reach the potential level according to the three scenarios.
The obtained results for Hungary proclaim an interesting picture which, however, is not surprising if we take into account unequal distribution of FDI among the EEC and CIS as mentioned above, where Hungary was a “champion” in the amount of attracted FDI. The gravity model results for Hungary show that the accumulated FDI pattern is far above its potential level. It is so large that it overcomes the predicted level for the scenario 2005 II of 42% according to the estimator 1, and of an even 108% according to the estimator 2 (see Table 6). One could guess that ample FDI inflows into Hungarian economy are primarily related to the transformation process in this country and in the long run would come down to its “normal” level what is also relevant as the catching up gap between Hungary and OECD countries diminishes. In other words, the FDI inflows during the initial
5 We use cum. inflows as a proxy for FDI stocks since there are no available data on stocks for all
investigated countries.
23
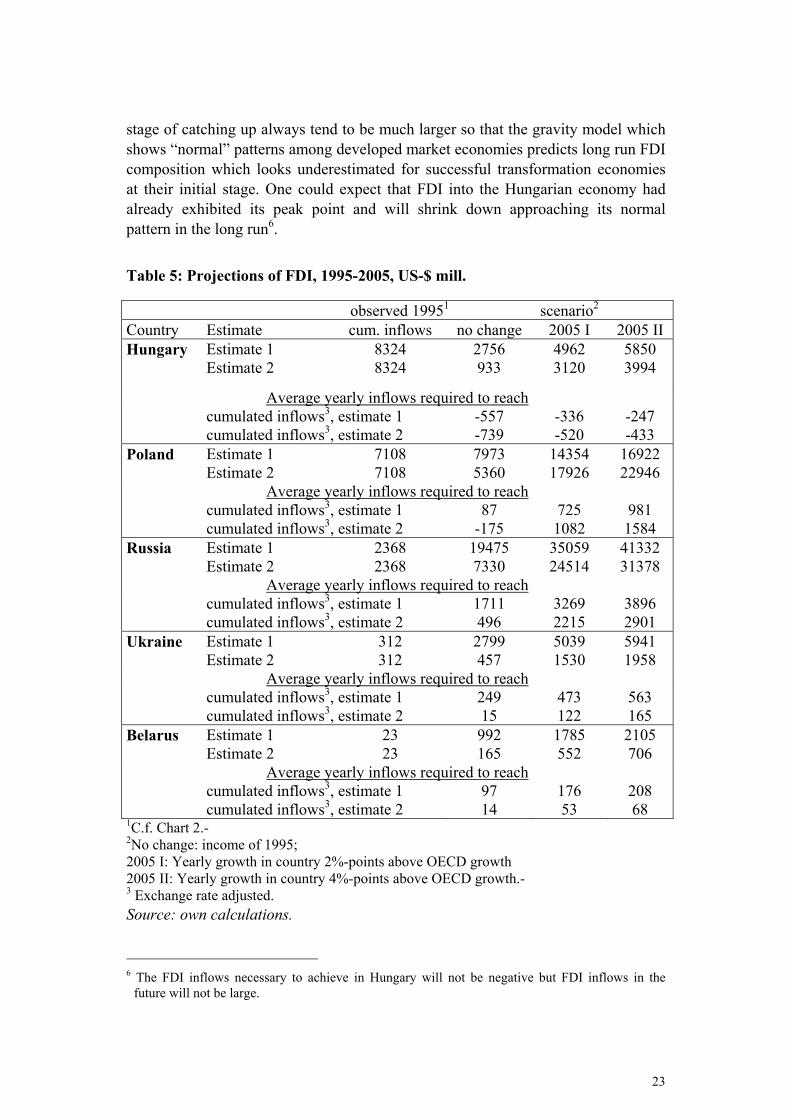
stage of catching up always tend to be much larger so that the gravity model which shows “normal” patterns among developed market economies predicts long run FDI composition which looks underestimated for successful transformation economies at their initial stage. One could expect that FDI into the Hungarian economy had already exhibited its peak point and will shrink down approaching its normal pattern in the long run6.
Table 5: Projections of FDI, 1995-2005, US-$ mill.
observed 19951 scenario2 Country Estimate cum. inflows no change 2005 I 2005 II Hungary Estimate 1
Estimate 2 8324 8324
2756 933
4962 3120
5850 3994
Average yearly inflows required to reach cumulated inflows3, estimate 1
cumulated inflows3, estimate 2 -557 -739
-336 -520
-247 -433
Poland
Estimate 1 Estimate 2
7108 7108
7973 5360
14354 17926
16922 22946
Average yearly inflows required to reach cumulated inflows3, estimate 1
cumulated inflows3, estimate 2 87
-175 725 1082
981 1584
Russia Estimate 1 Estimate 2
2368 2368
19475 7330
35059 24514
41332 31378
Average yearly inflows required to reach cumulated inflows3, estimate 1
cumulated inflows3, estimate 2 1711 496
3269 2215
3896 2901
Ukraine Estimate 1 Estimate 2
312 312
2799 457
5039 1530
5941 1958
Average yearly inflows required to reach cumulated inflows3, estimate 1
cumulated inflows3, estimate 2 249 15
473 122
563 165
Belarus
Estimate 1 Estimate 2
23 23
992 165
1785 552
2105 706
Average yearly inflows required to reach cumulated inflows3, estimate 1
cumulated inflows3, estimate 2 97 14
176 53
208 68
1C.f. Chart 2.- 2No change: income of 1995; 2005 I: Yearly growth in country 2%-points above OECD growth 2005 II: Yearly growth in country 4%-points above OECD growth.- 3 Exchange rate adjusted. Source: own calculations.
6 The FDI inflows necessary to achieve in Hungary will not be negative but FDI inflows in the
future will not be large.

24
Table 6: Deviation of County’s Cumulated Inflows from it’s Potential
Russia % Ukraine % Belarus % Poland % Hungary % observed 1995
2368 312 23 7108 8324
no change Estimate 1 19475 12 2799 11 922 2,5 7973 89 2756 302Estimate 2 7330 32 457 68 165 13,9 5360 133 933 8922005 I Estimate 1 35059 7 5039 6 1785 1 14354 50 4962 168Estimate2 24514 10 1530 20 552 4 17926 40 3120 2672005 II Estimate 1 41332 6 5941 5 2105 1 16922 42 5850 142Estimate 2 31378 8 1958 16 706 3 22946 31 3994 208Source: own calculations
The results for Poland tend to be close to that of Hungary but still predict considerable unused potential. Note that Poland represents substantially larger market than Hungary and consequently might be a more attractive goal for FDI. Part of differences between these two countries can be explained above all by the relative progress in privatization in these countries. The level of FDI observed in 1995 looks higher than the potential in the no change scenario according to estimator 2 but accounts for only 50% and 40% from the estimated potential level in the scenario 2005 I due to estimators 1 and 2 respectively. The scenario 2005 II is closer to the real situation for Poland now. To preserve the situation, higher GDP would lead to more potential FDI whereas actual FDI accounts for only 42% and 31% from the predicted by the scenario 2005 II level. Thus, the gravity model results for Poland still show considerable potential. In order to reach this potential, Poland should accumulate between $87 mill. to $981 mill. per year according to the estimator 1 and between $1082 mill. to $1584 mill. according to the estimator 2.
Russia’s 1995 actual FDI accounts for 12% or 32% from potential FDI in no change scenario, for 7% or 10% in the 2005 I scenario and for 6% or 8% in the 2005 II scenario according to the estimators 1 and 2 respectively therefore indicating a rather substantial lag from the potential level.
According to the estimator 1 the necessary volume of FDI per year consists of $1711 mill. in the no change scenario and goes up to $3896 mill. in the 2005 II scenario. However, the estimate 2 represents lower figures from $496 mill. to $2901 mill. necessary to invest per year to reach “normal” stocks (cum. inflows).
Ukraine’s cumulated inflows in 1995 account for 11% or 68% of the potential pattern in the no change scenario, 6% or 20% in the 2005 I scenario and 5% or 16% in the 2005 II scenario according to the estimator 1 and 2 respectively. To compensate for the lag Ukraine should accumulate between $249 mill. to $563 mill. per year due to estimator 1 and from $15 mill. to $165 mill. due to estimator 2.

25
Belarus shows the most largest lag. It’s cumulative FDI in 1995 is only 2,5% or 14% of that in the no change scenario, and 1% or 4% in the 2005 I scenario, 1% or 3% in the 2005 II scenario. The FDI necessary to reach “ natural” FDI stock varies from $97 mill. to $208 mill. according to the estimator 1 and from $14 mill. to $68 mill. according to the estimator 2.
4.3. FDI and Capital Formation
Analyzing the impact of FDI on capital formation and thus on the restructuring of the economies in investigated countries several aspects have to be taken into account. First of all, the size of gross fixed capital formation necessary to bring the investigated countries forward in transformation should be discussed. Secondly, the contribution of FDI to gross fixed capital formation has to be examined. A comparative perspective is useful.
4.3.1 Investment and Growth
The growth rate is mainly influenced by the investment/GDP ratio and the marginal product of capital. The ratio of GFCF to GDP and marginal capital for selected countries is indicated in Table 7. The marginal capital for Hungary and Poland is close to that of South Korea and Malaysia. High marginal capital for Belarus is doubtful as the official figures on economic growth in Belarus are not reliable. The figures for Russia and Ukraine are difficult to interpret since they are negative.
There is no reliable information concerning the size and structure of capital stocks in the investigated countries. Therefore the suggestions about the size of capital formation can not be derived from considerations about the difference between existing and necessary capital stock. One could guess only about the necessary investment ratio in the countries taking as a reference the investment ratios from other emerging economies.
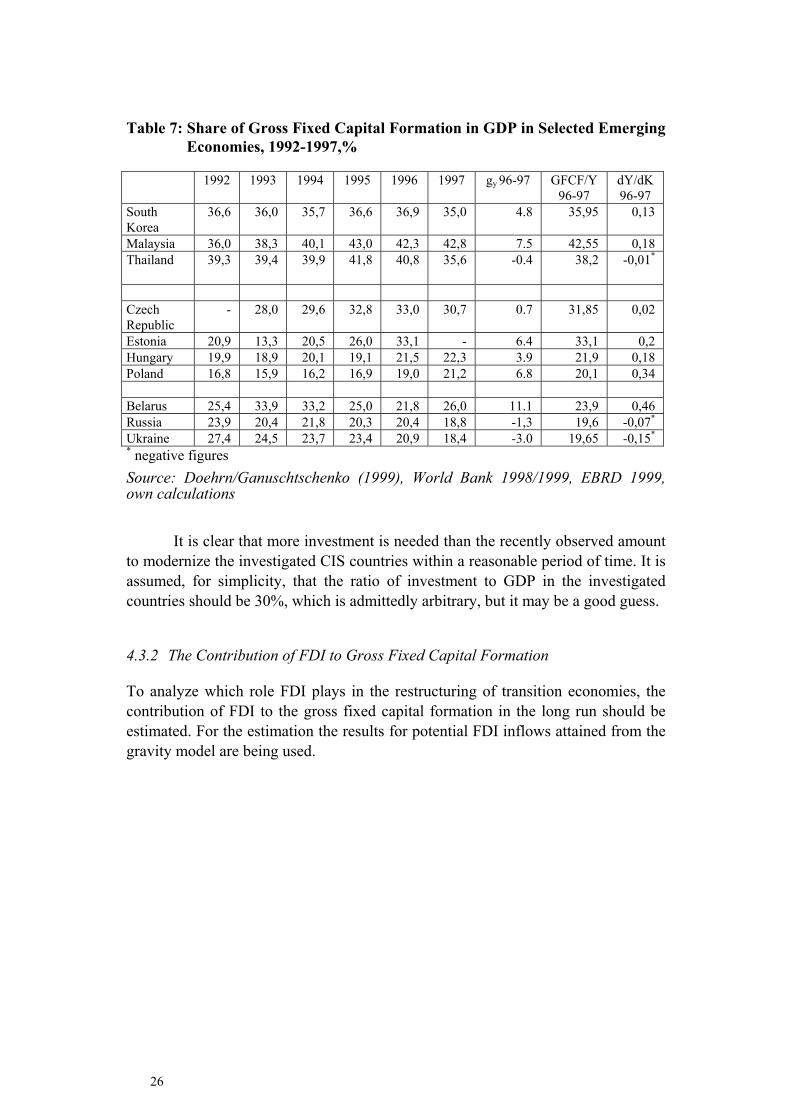
Table 7 shows the share of gross fixed capital formation (GFCF) in several Asian emerging economies and in some European transition countries. The data for these two regions is considerably different. The Asian countries exhibit GFCF between 35% and 42% of GDP, whereas the ratio in EEC is between 15% and slightly more that 30%, with Russia approaching a ratio similar to that in Hungary and Poland. However, the development in Russia was rather different from other European countries. While the above considered EEC experienced upwards tendencies, only Russia had a relative fall in investment from nearly 24% in 1992 to less than 19% in 1997, and 1998 data indicates a further decline (DOEHRN/GANUSCHTSCHENKO, 1999).
26
Table 7: Share of Gross Fixed Capital Formation in GDP in Selected Emerging Economies, 1992-1997,%
1992 1993 1994 1995 1996 1997 gy 96-97 GFCF/Y 96-97
dY/dK 96-97
South Korea
36,6 36,0 35,7 36,6 36,9 35,0 4.8 35,95 0,13
Malaysia 36,0 38,3 40,1 43,0 42,3 42,8 7.5 42,55 0,18 Thailand 39,3 39,4 39,9 41,8 40,8 35,6 -0.4 38,2 -0,01*
Czech Republic
- 28,0 29,6 32,8 33,0 30,7 0.7 31,85 0,02
Estonia 20,9 13,3 20,5 26,0 33,1 - 6.4 33,1 0,2 Hungary 19,9 18,9 20,1 19,1 21,5 22,3 3.9 21,9 0,18 Poland 16,8 15,9 16,2 16,9 19,0 21,2 6.8 20,1 0,34 Belarus 25,4 33,9 33,2 25,0 21,8 26,0 11.1 23,9 0,46 Russia 23,9 20,4 21,8 20,3 20,4 18,8 -1,3 19,6 -0,07*
Ukraine 27,4 24,5 23,7 23,4 20,9 18,4 -3.0 19,65 -0,15*
* negative figures Source: Doehrn/Ganuschtschenko (1999), World Bank 1998/1999, EBRD 1999, own calculations
It is clear that more investment is needed than the recently observed amount
to modernize the investigated CIS countries within a reasonable period of time. It is assumed, for simplicity, that the ratio of investment to GDP in the investigated countries should be 30%, which is admittedly arbitrary, but it may be a good guess.
4.3.2 The Contribution of FDI to Gross Fixed Capital Formation
To analyze which role FDI plays in the restructuring of transition economies, the contribution of FDI to the gross fixed capital formation in the long run should be estimated. For the estimation the results for potential FDI inflows attained from the gravity model are being used.

27
Table 8: Central and Eastern Europe: Selected Indicators of the Importance of Inward FDI, by Country
Country FDI inward stock over GDP, 1996
(Per cent)
FDI inward stock per capita, 1996
(Dollars)
FDI inflows over gross fixed capital formation, 1994-1996 (Per cent)
Central and Eastern Europe averagea
6b 151b 8b
Hungary 34 1490 30
Estonia 19 551 23
Latvia 17 335
Albania 11 84
Czech Republic 11 537 11
Poland 11 339 18
Moldova, Republic of 9 34 36
Slovakia 5 161 4
Bulgaria 4 51 5
Lithuania 4 80
Romania 4 55 6
Croatia 4 185
Slovenia 4 366 5
Ukraine 3 26 4
Russian Federation 1 45 2
TFYR Macedonia 1 20
Belarus - 6 1

28
Table 9: Central and Eastern Europe: Selected Indicators of the Importance of Inward FDI, by Country (cont.)
Reference groupc Trinidad and Tobago 77 2996 46
Grenada 71 2016 22 Malaysia 49 2014 12
Fiji 39 925 21 Costa Rica 36 915 22 Botswana 33 942 31
Chili 27 1356 17 Mexico 22 783 15 Panama 22 646 13 Tunisia 22 470 7 Belize 15 762 15 Peru 15 374 23
Thailand 12 328 3 Colombia 11 261 16 Mauritius 7 252 2 Turkey 3 92 2
Syrian Arab Republic 2 74 1 Lebanon 2 61 2
Average, reference group
26 848 15
a Including Croatia, Slovenia and TFYR Macedonia. b Unweighted averages (ratios for the region or group taken as a whole). c This group, selected for comparison, includes countries with GDP per capita ranging from
$2,000 to $5, 000 per anuum. Source: UNCTAD, FDI/TNC database.

29
Table 10: Contribution of FDI to Gross Fixed Capital Formation, 1995 to 2005 averages,%
scenario Country assumptions no change 2005 I 2005 II Hungary c1
c2 -5,3 -7,0
-2,5 -3,9
-1,6 -2,9
Poland c1 c2
0,2 -0,5
1,6 2,4
1,9 3,1
Russia c1 c2
1,6 0,5
2,4 1,7
2,6 1,9
Ukraine c1 c2
2,2 0,1
3,3 0,9
3,5 1,0
Belarus c1 c2
3,2 0,5
4,6 1,4
4,8 1,6
Source: own calculations. For abbreviations c.f. Table 4.
Under the assumption that a ratio of investment to GDP showed to be close to 30% for successful transformation, the results for investigated countries were attained, which show that long run FDI play a moderate role in gross fixed capital formation, where the ratio tends to be higher for smaller economies.
If one refers to the data represented in the Table 8 one would find substantially higher results for Hungary and Poland for the data period from 1994 to 1996 where for Russia, Ukraine and Belarus the data according to the gravity model results could be under the “normal” long run level.
Thus Hungary’s FDI inflows indicator on gross fixed capital formation in the period of 1994-1996 is the highest among all Central and Eastern European countries, far above average (8%) and equals 30%. The same indicator for Poland is 18% what is also a considerable value. The figures for Russia, the Ukraine and Belarus are 2%, 4% and 1% respectively.
Gravity model results for Poland show that FDI in the gross fixed capital formation could vary from 0,2% to 3,1% in the long run. For Russia-from 0,5% till 2,6%, for the Ukraine-from 0,1% till 3,5% and for Belarus from 0,5% till 4,8%. The results for Hungary do not have any economic information but it is plausible to assume that further FDI inflows into the Hungarian economy will be much less than before and the contribution of FDI to gross fixed capital formation will become moderate.
The interpretation of these figures depends on a number of factors. First of all, the gravity model represents the “normal” pattern characteristic for the long run so that this data could be, however, bad compared with the data representing a specific period of time. The high ratios for Hungary and Poland are to be explained through the catching up process of these countries where there was a bump of FDI in the given period and GDP did not grow yet enough to compensate growth of FDI. The actual share of gross fixed capital formation in GDP for these countries is also considerably lower as admitted in the gravity model. High ratios of FDI in gross fixed capital formation for Hungary and Poland could also be an effect of overall

30
increasing importance of FDI in the global economy. The share of FDI in gross fixed capital formation is not high for CIS countries for the reasons that legal and regulatory problems, long situation of recession, connected with political instability as well as prolonged privatization process are factors restricting FDI inflows into these CIS countries. In general in the economic history there are very different country experiences in importance of FDI for transformation and restructuring of the economy. The Asian countries such as China, Malaysia and Singapore reported high figures reaching even 60% for Singapore in the period from the mid eighties to the begin of nineties. On the other hand, Austria’s catching up after World War II was successfully carried out without attracting much FDI. The ratio of FDI in gross fixed capital formation in Austria still remains rather low-only 1,8% in the mid nineties. The experience with FDI seems to vary strongly from country to country where the incentives to invest from one side and the ability of the country to attract investments from the other side play a decisive role. High ratios of FDI over gross fixed capital formation are more typical for the countries in the early stage of their transformation where the countries possess over attractive incentives at the same time, which are able to cause high FDI inflows. In this period of transformation the countries have low saving rates and do not have enough capital needed for the restructuring of the economy This tendency seems to change in the long run where FDI play only a moderate role in gross fixed capital formation and country’s savings come to play the primary role. The experience shows also that the importance of FDI seems to be larger for small countries than for large countries on their transformation stage as well as in the long run.
5. Conclusions
FDI is associated with the positive impact on economic growth in terms of additional capital but foremost in consideration of technology transfer and knowledge spillovers, which bring productivity gains to the economy as a whole. From the other side economic growth would in turn lead to more FDI as one of the major factors distinguishing FDI inflows between countries. FDI may, under circumstances of insufficient competition policy, lead to negative effects on domestic firms where it limits, first of all, access to the domestic market, reduces competition and hence possibilities for technology transfer. Thus domestic countries should look for a balanced competition policy between MNCs and domestic firms.
FDI patterns vary considerably between more advanced transition economies like Hungary and Poland and the investigated CIS countries. Cumulative FDI inflows in CIS countries do not correspond to the size and demand of these markets, although official statistics tend to even overestimate actual FDI inflows. To create favorable conditions for attracting FDI, privatization is expected to play a decisive role. In this respect, it is especially important to make privatization-objects

31
available to strategic foreign investors since the evidence shows that FIEs are more productive and efficient than domestic firms. In order to make FDI successful it should be directed to the ”right” sectors of the economy. Sectoral analysis for more advanced transition economies witnesses that they have already surpassed the first stage associated with the investments in the traditional sectors of the economy and moved up to the sectors that contribute considerably to the restructuring of the economy. Thus in Hungary the FDI grows in machinery, equipment industry and chemical industry which are the most skill- and technology intensive ones. FDI made in CIS up until now is predominately directed towards traditional sectors. Little remains of the FDI share in machinery and equipment while food, textile industries and, in particularly in Russia’s case, fuel industry still prevail.
This paper also examines potential of FDI inflows into investigated transition economies with the gravity model. The gravity model results for Hungary and Poland reflect unequal distribution of FDI between EE countries. Thus, Hungary according to the gravity model has already exhibited it’s potential. Gravity model results point to a considerable potential in FDI inflows for the CIS countries. But the contribution of FDI to gross fixed capital formation in the long run according to the gravity model tends to be moderate.
One should take into account the static character of the model, which does not cover policy decisions of the country to attract FDI. Thus, the intense need of the country to attract more FDI e.g. though privatization policy can considerably stimulate FDI inflows; the opposite is valid for restrictive policy. Thus the contribution of FDI to gross fixed capital formation and hence to the restructuring of the economy during the period of transition can be high once the countries create attractive conditions for foreign investors but in the long run the contribution of FDI to the gross fixed capital formation will be moderate and the saving rate of a country is supposed to play a more decisive role. Even with very optimistic projections for GDP growth, the role of FDI, although important, can not initiate a process of sustained growth in the long run and the considerable share of capital formation should still be financed through domestic savings.

32
Appendix
Table A 1: Trade Exposure to Russia (in per cent)
Central and eastern Europe and the Baltic states1
Share of exports of goods to Russia2
Share of exports of goods to Ukraine2
Share of ex-ports of goods
to Belarus2
Total Share of exports in
GDP2
GDP exposure3
Bulgaria 7 3 0 10 47 5 Croatia 4 0 0 4 22 1 Czech Republic 2 1 - 4 43 2 Estonia 6 5 2 13 49 6 FYR Macedonia 2 8 1 11 36 4 Hungary 5 1 0 7 43 3 Latvia 21 4 3 28 32 9 Lithuania 7 9 12 28 44 12 Poland 4 5 1 10 20 2 Romania 3 1 0 4 28 1 Slovak Republic 3 3 - 6 45 3 Slovenia 4 1 - 5 47 2 Average 6 4 2 11 38 4 Commonwealth of independent States
Armenia 23 2 1 26 14 4 Azerbaijan 23 4 0 28 21 6 Belarus 59 15 - 74 55 41 Georgia 30 4 0 34 9 3 Kazakhstan 39 3 - 42 30 13 Kyrgyzstan 21 1 1 23 37 9 Moldova 63 5 2 70 38 26 Russia - 9 6 15 20 3 Tajikistan 8 1 1 10 60 6 Turkmenistan 5 - - 5 41 2 Ukraine 22 - 5 27 31 8 Uzbekistan 31 6 2 39 26 10 Average 29 5 2 33 32 11 1 Data for Albania and Bosnia and Herzegovina were not available from the IMF. National
sources for Albania indicate only minor trade exposure to Russia. 2 Exports of merchandise only. Figures from national authorities for total exports give
considerably higher figures for all three Baltic countries. 3 Calculated as the total share of exports of goods to Russia, Belarus and Ukraine multiplied
with the share of exports of goods in GDP. Source: IMF. Direction of Trade Statistics Yearbook, 1997: and EBRD staff calculations

33
Table A 2: Foreign Direct Investment (net inflows of equity capital recorded in the balance of payments)
(in millions of US dollars) (in US dollars) 1993 1994 1995 1996 1997
(revised)1998
(projected)Cumul-
ative FDI-
inflows 1989-98
Cumulative FDI-inflows 1989-97 per
capita
FDI-inflows
per capita in
1997
FDI-inflows as % of GDP in
1997 Albania 45 65 89 97 42 95 473 148 13 1.9 Bulgaria 40 105 82 100 497 300 1,222 147 60 4.8 Croatia 77 95 83 509 196 450 1,422 297 41 1.0 Czech Republic
552 749 2,526 1,388 1,275 1,000 8,473 823 124 2.4
Estonia 157 215 199 111 128 200 1,010 695 88 2.7 Hungary 2339 1,097 4,453 1,986 2,100 1,500 16,903 1,667 207 4.6 Latvia 40 238 180 210 347 300 1,358 543 139 6.3 Lithuania 30 31 65 127 218 800 1,271 344 59 2.3 FYR Macedonia
na 24 13 12 30 45 124 59 14 0.9
Poland 580 542 1,134 2,741 3,044 4,000 12,442 321 79 2.2 Romania 97 341 417 263 1,224 900 3,370 149 54 3.5 Slovak Republic
107 236 194 199 51 220 1,223 227 9 0.3
Slovenia 111 128 176 186 321 200 1,274 639 161 1.8
CEEC and Baltic states
4,175 3,866 9,610 7,928 9,473 10,010 50,566 439 82 2.4
Armenia na 3 19 22 51 170 265 72 14 3.1 Azerbaijan 20 22 282 661 1,093 1,155 3,233 425 144 28.4 Belarus 18 11 7 70 190 50 346 34 19 1.4 Georgia na 8 6 54 189 255 512 95 35 3.6 Kazakhstan 473 635 964 1,137 1,320 1,200 5,729 365 84 5.9 Kyrgyzstan 10 45 96 46 83 29 309 67 18 4.9 Moldova 14 18 73 56 64 100 342 80 15 2.9 Russia na 539 1,710 1,700 3,752 1,500 9,201 63 25 0.8 Tajikistan 9 12 17 20 11 18 87 15 2 1.0 Turkmenistan 79 103 233 129 108 110 762 162 23 5.9 Ukraine 200 100 400 526 600 700 2,696 53 12 1.2 Uzbekistan 48 73 -24 90 167 60 423 18 7 1.2 CIS 871 1,569 3,783 4,511 7,628 5,347 23,905 84 27 1.3 Total 5,046 5,435 13,39
3 12,43
9 17,101 15,357 74,471 187 43 1.8
Note: For most countries, figures cover only investment in equity capital and in some cases contributions-in-kind. For those countries where net investment into equity capital was not easily available (e.g. Estonia and the Slovak Republic), more recent data include reinvested earnings as well as inter-company debt transactions. Source: IMF, central bank and EBRD estimates

34
Literature
BELARUS ECONOMIC TRENDS (1999), April-June 1999, Minsk. BELLAK, C. (1998), Lessons from Austria’s Postwar Pattern of Inward FDI for
CEECs, WIIW Research Reports, No. 251, Vienna. BLOMSTROEM, M. (1991), Host Country Benefits of Foreign Investment, in:
MCFETRIDGE, D., ed., Foreign Investment, Technology and Economic Growth, Calgory, Mass.: University of Galgary Press.
BORENSZTEIN, E. etc. (1995), How Does Foreign Direct Investment Affect Economic Growth?, NBER Working Paper No. 5057, Cambridge.
CSAKI, G. (1998), Foreign Direct Investment in Hungary, in: Foreign Direct Investment in the CEFTA Countries, Economic Trends and Research Summaries No. 1, Budapest.
DOEHRN, R. (1999), Foreign Direct Investment in Russia-An Engine of Structural Adjustment?, prepared for the Workshop in Bonn: Restructuring, Stabilizing and Modernizing the New Russia: Theoretical, Institutional and Empirical Issues, June, 25-27, Bonn.
DOEHRN, R. and GANUSCHTSCHENKO, N. (1999), Foreign Direct Investment in Selected CIS Countries-An Engine of Structural Changes?, prepared for the Conference: Overcoming the Russian Transformation Crisis, the Higher School of Economics, December, 3-4, Moscow.
EBRD (1999), Transition Report, April 1999, London. HUNYA, G. (1999), Central Europe Catching Up Through FDI?, The Vienna
Institute for International Economic Studies, Vienna. INTERNATIONAL MONETARY FUND (1993), Balance of Payments Manual,
Fifth Edition. OECD (1998), The Benefits of Trade and Investment Liberalization, Paris. UNCTAD (1998), World Investment Report, Geneva. WARESA, M. (1998), Foreign Direct Investment in Poland in the 19990’s, in:
Foreign Direct Investment in the CEFTA Countries, Economic Trends and Research Summaries No. 1, Budapest.
WELFENS, P.J.J. (1999), Institutions and Transition: On the Way to a Market Economy-Theory and Application to Russia, prepared for the Conference: Overcoming the Russian Transformation Crisis, the Higher School of Economics, December, 3-4, Moscow.
WELFENS, P.J.J. and GANUSCHTSCHENKO, N. (1999), Eastern EU Enlargement and the Russian Transformation Crisis, prepared for 2nd EACES

35
Paris Workshop: The European Union Enlargement to the East, but at what speed?, March, 22-23, Paris.
WESTIN, P. (1999), Foreign Direct Investments in Russia, Russian Economic Trends, March 1999.