universities as drivers of regional and national
TRANSCRIPT

Note: This paper has been published as Betts, Julian R. and Carolyn W.B. Lee, “Universities as Drivers of Regional and National Innovation: An Assessment of the Linkages from Universities to Innovation and Economic Growth”, in Charles M. Beach, Robin W. Boadway and R. Marvin McInnis (Eds.) HIGHER EDUCATION IN CANADA, Kingston, Ontario: Queen’s University: John Deutsch Institute, pp. 113-‐157. 2005.
Universities as Drivers of Regional and National Innovation: An Assessment of the Linkages from Universities to Innovation and Economic Growth
Julian R. Betts† and Carolyn W.B. Lee‡ University of California, San Diego
This paper was prepared for the John Deutsch Institute conference on “Higher Education in Canada”, held Feb. 13-‐14, 2004 at Queen’s University. The authors would like to acknowledge the able assistance of Solace Shen and Rick Switzer. Funding for this work was provided in part by the University of California’s Industry-‐University Cooperative Research Program and the California Council on Science and Technology. †Professor of Economics at UCSD ‡Director of Research, Global CONNECT, UCSD’s Division of Extended Studies and Public Programs Comments are most welcome: [email protected] and [email protected].

1
1. Introduction
Job growth, innovation, and an abundance of well-paying high tech jobs -- is there
a politician anywhere who would want less of these things in his or her region? It is not
surprising, then, that regional planners worldwide have tried to develop a recipe for
replicating the economic success of Silicon Valley in their home region.1 Many
commentators have speculated that one of the key ingredients in this recipe is the
presence of a strong university system.2
This paper will selectively review the literature on universities as determinants of
regional and national innovation, focusing first on potential pathways through which
universities might act as drivers of innovation, and then on the empirical evidence. We
find circumstantial evidence from around the world that universities can and do play an
important role. These individual pieces of evidence collectively become more
compelling than any piece of evidence viewed on its own. But perhaps the most
important message from the literature is that there are many ways to boost scientific
innovation locally, and universities can play dominant or subsidiary roles in that process.
What seems most clear is that a university acting entirely on its own cannot do much to
boost regional innovation unless a multifaceted entrepreneurial infrastructure is in place
locally. This includes a complex and subtle set of complementary physical, political and
organizational inputs. In short, universities appear to matter importantly, but there is no
single recipe for success.
The next section outlines the theoretical pathways through which the presence of
universities could boost the rate of innovation locally, followed by an examination of the 1 See for instance Kenney (2000), Lee, Miller and Hancock (2000) and Rosenberg (2002). 2 See for example Smilor, Kozmetsky and Gibson (1998) and Etzkowitz, Webster, and Healey (1998).

2
conceptual problems that confront research in this area. Subsequent sections examine the
importance of the supply of skills generated by university graduates, direct evidence of
the impact of universities on innovative activity itself, and less direct evidence from the
burgeoning literature on high tech clusters. We make frequent references to research on
“what makes Silicon Valley tick”, and in addition provide a case study of the rapid rise of
San Diego as a cluster for biotech and wireless communications technology.
2. Basic Mechanisms and Problems of Interpretation
There are at least five mechanisms through which the presence of a university
could boost the amount of Research and Development (R&D) or the creation of high tech
jobs more generally:
1) University as Trainer
This mechanism refers to the university’s role in providing to the local economy a
steady and ample supply of skilled young university graduates.
2) University as Innovator
This mechanism refers to direct generation and commercialization of knowledge
by universities working fairly independently of the private sector.
3) University as Partner
The university as partner provides technical know-how to local or national firms
through fee-for-service agreements, less formal consulting on the part of university
professors, and more formal joint ventures which often involve a private concern helping
university researchers to commercialize the product of a university-owned patent. In
addition, there is the possibility that a private firm licenses an existing patent owned by a

3
university and pays royalties, but does this at arm’s length rather than working
collaboratively with university personnel.
4) University as a Regional Talent Magnet
By “talent magnet” we mean any way in which the presence of a university in a
region increases the attractiveness of the region as a whole to talented innovative
entrepreneurs, scientists and engineers. For example, in the hopes of establishing
working relationships with professors, a high tech firm may decide to open an office in a
city that boasts a strong team of university researchers. More subtly, a top university
often recruits skilled senior scientists and engineers from other regions, only to have
these individuals leave after some time to work locally in the private sector. The
university may have acted as a magnet to attract such workers to a region in the first
place, and so can claim some of the credit for subsequent innovations made by its former
employees who remain in the local labor market.
5) University as Facilitator
Another role that universities can play is to create a venue to facilitate networking
among those involved in the high tech community from the private and public sector.
While acting as a convener is not an obvious comparative advantage of the university, we
will document evidence that both Stanford University and the University of California
San Diego (UCSD) have facilitated networking with visible and positive effects on the
local high tech private sectors.

4
Problems of Interpretation
Our definitions of the university as trainer, innovator, partner, regional talent
magnet and facilitator of networking are in themselves somewhat vague. But these
problems of definition are dwarfed relative to the problems inherent in observing these
patterns in the real world. Accordingly, in this paper, the best we can do is to create a
collage of evidence from many countries. A third difficulty, and perhaps the greatest of
all, is that of assigning causation. The existing literature takes two broad approaches.
The first is to focus on one aspect of innovation, say, patenting, and to estimate
statistically the impact of universities on local patent rates. These studies are very useful
but are limited in the sense that the “economic production function” that maps the many
inputs that go into innovative activity into the “output”, in this case patents, is not clearly
measurable. Many inputs into the process, such as the quality of personnel and the
purchase of consulting time, will often be poorly measured or completely unmeasured.
A second approach that has gained much currency in the last decade and a half is
qualitative analysis of high tech clusters.3 This approach seeks to find cause and effect
by looking for a common set of factors that underlies successful regional clusters. This
more informal analysis that relies on spatial correlations is obviously even more prone to
errors of interpretation. The most dangerous risk is that it becomes quite easy to
overstate the role of the university. If high tech clusters tend to exist only in major cities
where universities exist, then can we claim that universities cause high tech clusters to
arise? If proximity is the sole criterion then perhaps we should also conclude that
universities “cause” the creation of international airports, professional sports teams, drug
abuse, homelessness and inner city decay more generally! We believe that cluster 3 Council on Competitiveness (2001).

5
analysis has much to tell us about causation, but only when it is backed up by evidence
about the thickness of local high tech networks, and the extent to which universities are
embedded in those networks.
3. Evidence on the Link between a Local Supply of College Graduates and
Innovation
The University as Trainer
The role of “university as trainer” seems obvious. Industries that experience rapid
technological change require highly educated workers to implement these changes, and
universities and community colleges provide these workers to the economy. Econometric
studies have shown that technological change is skill-biased (that is, skill-using). (See
e.g. Berman, Bound and Griliches (1994) for the United States, Betts (1997) for Canada
and Berman, Bound and Machin (1998) for evidence from a wide array of countries.)
More concretely, Bartel and Lichtenberg (1987) document that in the United States
industries with newer capital stocks (and hence newer technologies) tend to employ
greater shares of highly educated workers. Further afield, studies in developing countries
establish that farmers with greater levels of education are likely to adopt new
technologies before other farmers (e.g. Binswanger, Ruttan et al., 1978).
Cross-country studies such as that by Bils and Klenow (2000) show that countries
that have experienced more rapid output growth tend to have more highly educated labor
forces. However, levels of education can explain only about one third of the variation
across countries. Hanushek and Kimko (2000) find a strong link across countries
between output growth and test scores on international tests of student achievement. This

6
sort of evidence is perhaps less persuasive than within-country studies because the former
could be contaminated by unobserved differences among countries, but the evidence is
nonetheless suggestive.
Direct evidence on the link between the supply of university graduates and rates
of innovation at the national level seems to be more scarce, but does point in the same
direction. For instance, Arora, Gambardalla and Torrisi (2004) study the rise of
successful high tech clusters in Ireland and India and conclude that a key facilitating
factor was an ample supply of well educated workers with a science and engineering
background. Further, they argue that an overabundance of such workers relative to
demand from non-high-tech sectors spurred the creation of high tech clusters in these
countries.
None of this evidence, of course, establishes that a thick network of universities is
either necessary or sufficient for a country to experience rapid innovation and
productivity growth. Some countries might easily obtain ample supplies of skilled labour
through immigration. De Fontenay and Erran Carmel (2004) contend that immigration of
Russian scientists and engineers to Israel has done much to foster high tech clusters in
that country, and that the military in Israel does much to generate supplies of well trained
technicians.
What about at the regional level within a country: is it sensible to claim that the
individual region must have one or more strong universities in order to innovate?
Gibbons (2000), from his vantage point as a dean of engineering at Stanford, argues that
local educational infrastructure in the Bay Area has been one of the key elements in the
Silicon Valley success story. He cites not only the graduate training provided by research

7
powerhouses such as Stanford and Berkeley, but the other local universities that provide
the lion’s share of baccalaureate engineers, the technical programs within community
colleges and the entrepreneurship programs provided by the business schools at several
local universities. Indeed, virtually every analysis that we have read about the sources of
vigour in Silicon Valley mention the importance of the supply of skilled workers
generated locally.
Another benefit provided by the postsecondary education sector not mentioned by
Gibbons is coursework provided by universities’ “Extension” or “Extended Study”
systems. By responding to the needs of local employers, such systems can provide short
courses that allow already skilled workers to update and extend their knowledge. Our
case study of San Diego will show that in San Diego at least, extended studies offers
technical courses to surprisingly large numbers of individuals each year.
And yet, in spite of the large numbers of workers who gain technical skills at local
universities, if some countries such as Israel can succeed by importing skilled workers
from other countries, then surely individual regions within countries can play the same
game. In addition to attracting immigrants, individual regions can import skilled workers
from other regions within the same country. In some ways, as Betts (2000) points out,
this approach can benefit local government coffers because importation of university
graduates from other regions and countries in essence allows the local government to
“free ride” on the subsidies that governments elsewhere have provided to students while
they pursued their studies. This is not necessarily a wise policy, as it places the
individual region at the mercy of far flung labor markets. But it does raise important

8
questions about the extent to which local universities are truly a prerequisite to local high
tech success.
Indeed, there is now ample evidence that Silicon Valley, and California more
generally, have relied heavily on importing workers from elsewhere. Saxenian (1999)
documents the prominent role that foreign-born immigrant entrepreneurs have played in
creating some of the leading high tech companies in the San Francisco/San Jose area.
More broadly, Betts (2000) has estimated that between 1970 and 1990 California’s
community colleges and universities produced only about one half of the net observed
increase in the number of working-age adults in California holding postsecondary
degrees. California has been a massive importer of talent from elsewhere.
The fact that university graduates are free to migrate loosens the reliance of net
importer regions on the supply of graduates from their local universities. The flip side of
the coin, of course, is that regions that habitually lose graduates to other areas must
recognize that only a fraction of local graduates will remain available to local employers.
These migration effects can be significant. Groen and White (forthcoming) use a
panel dataset of university students to estimate interstate mobility in the United States. In
1996, sixteen years after graduation, the probability that a student from in-state remains
in the same state is 55% for public colleges and 51% for private colleges on average. 4
In Canada, inter-provincial mobility of university graduates is quite large as well,
especially when considering the more sparsely populated provinces. Burbidge and Finnie
(2000) examine the mobility of samples of bachelor’s graduates from the time they enter
university to the fifth year after graduation. The main focus of this paper is net mobility
4 The authors provide these calculations for ‘marginal’ students who would probably not be admitted if the universities increased their admission requirements.

9
from the “pre-university” province, but we can still infer that in some provinces large
percentages of graduates move to different provinces after graduation. For instance, for
Canada as a whole, of graduates in 1990 who graduated from university in their home
province, 9.1% moved to another province within five years of graduation. This masks
some much bigger numbers for some provinces. As Figure 1 shows, both Saskatchewan
and Nova Scotia lost about one third of their “homegrown” university graduates within
five years.
As large as they are, these figures on interprovincial and interstate migration
understate the risk that a region will lose graduates from its local postsecondary
institutions because typically we think of regions as small portions of provinces or states.
In other words, a University of Toronto graduate may well stay in Ontario but move away
from Toronto, weakening the link between the university and the skill set of workers in
the Toronto region.
Conversely, if we are interested primarily in the impact of universities on the
supply of skilled workers nationally, regional migration within the country is of less
concern. But then we need to consider the possibility that a country as a whole is a net
exporter of technically trained workers. Arora, Gambardalla and Torrisi (2004) report
that emigration of scientists and engineers from India to other countries, primarily the
United States, potentially threatens the growth of high-tech clusters in India.
Similarly, in Canada, many observers have raised concerns about the brain drain
to the United States that appears to have accelerated in the last ten to fifteen years. Card
(2003) shows that between 1940 and 2000, Canadians who had emigrated to the United
States were more highly educated than native-born Americans. Over the last two decades

10
it has also been the case that Canadian emigrants to the United States have been
substantially more highly educated than Canadians remaining in Canada. For instance,
Card estimates that in 2000, 44.3% of Canadians in the United States held a university
degree and 8.1% held an advanced degree, compared to just 16.0% and 1.1% of
Canadians in Canada. In addition, he shows that between 1980 and 2000 the earnings
premium earned by Canadian emigrants to the United States relative to Americans has
risen even after controlling for observable characteristics, which could mean that
Canadian emigrants have become increasingly self-selected with respect to unobserved
skills. Clearly, emigration of highly educated Canadians has become a real issue.
A second cautionary note: we cannot think of the university and community
college systems as the only providers of skilled workers. The educational pipeline begins
in each region’s elementary and secondary school systems, and these local school
systems typically provide the majority of students for the local public universities. A
public university that seeks students mainly from its own region has no hope of
producing large numbers of qualified engineers and scientists if the local school system
fails to prepare high school students adequately.
Ironically, California is a hub of innovative activity in spite of its K-12 system. A
recent study by the California Council on Science and Technology (2002) identified
problems in the state’s schools as a key limiting factor to high tech growth in the state.
One report prepared for this project found that the percentage of grade 9 students who
ultimately graduate from high school having taken the required number of courses in the
“a-f” subjects needed for admission to the University of California or the California State
University System is surprisingly low. (Betts, 2002). Table 1 illustrates the leakages

11
quite clearly. For instance, in 1999-2000 high school graduates who had fulfilled the
course requirements needed for public university eligibility represented only 24.5% of
enrollment in grade 9 three years earlier. Dropouts during the high school years
combined with the low percentage of graduates who have taken sufficiently rigorous
courses explain this disappointingly low figure. With problems like this in a state’s
public schools, universities will be limited in the supply of qualified graduates that they
can produce.
Overall, what are we to conclude? There is considerable evidence that innovative
activity requires skilled labour, including university graduates, and that universities are a
key provider. But we need to be skeptical about claims that a region with a weak local
supply of university graduates can never succeed at innovation. The quality of local
schools that act as feeders to universities also matters. Even more important, the private
sector can and often does draw university graduates from outside the local region, from
other parts of the country and from other countries as well. Ultimately, some of the
largest high-tech clusters, often in the United States, appear to have such an advantage
through agglomeration effects that they can reliably attract skilled workers from around
the world.
The University as “Talent Magnet”
Some of the most compelling evidence for our “talent magnet” hypothesis comes
from stories of the development of clusters in individual cities. Not only are these places
talent magnets for young, high tech workers, but they are also magnets for senior level
scientists and engineering pioneers, the stars of their field. If Frederick Terman hadn’t

12
encouraged his students William Hewlett and David Packard to start their own company
in Palo Alto in 1938, instead of joining established firms on the East Coast, Hewlett-
Packard would never have come into being. Hewlett-Packard is widely regarded as the
pioneer company that gave rise to Silicon Valley (Saxenian, 1994). Furthermore, if
William Shockley, father of the transistor, hadn’t been encouraged by Fred Terman, Dean
of Stanford’s engineering school, to start up Shockley Semiconductor Laboratories in
1955, in Palo Alto, next to Stanford’s campus, the young physicists and engineers that
Shockley recruited would never have been lured to the region from the East Coast and
Europe. Eight of the most talented young recruits subsequently defected to start Fairchild
Semiconductor, which then begat all the “Fairchildren” firms (including Intel) which
gave rise to what is now to Silicon Valley (Chong-Moon Lee et al, 2000).5
Two other similar examples relate to the meteoric rise of San Diego’s biotech and
wireless communication sectors. Ivor Royston, founder of Hybritech, San Diego’s first
biotech firm and the original firm that spawned San Diego’s biotech industry, was lured
to UCSD as a professor, but left the university to found the firm. Irwin Jacobs, Chairman
of Qualcomm, was also a UCSD professor who left UCSD to found Linkabit, the
precursor to Qualcomm and the original firm that gave rise to San Diego’s wireless
communications industry.6 It has been well documented that both these pioneering firms
have spawned more than 40 firms each in the past two decades. Begetting charts reveal
fourth and fifth generation “children” firms in the San Diego area that have been started
5 There are others who argue that the rise of Silicon Valley can be traced even further back to the turn of the century. See Timothy Sturgeon’s contribution to Martin Kenney’s edited volume, Understanding Silicon Valley (2000). 6 In the 1970’s, UCSD did not encourage entrepreneurial faculty to stay. Both Royston and Jacobs left UCSD when told by university administration that their consulting commitments conflicted with their university appointments.

13
by founders of Hybritech and Linkabit.7 The presence of Hybritech and Qualcomm
subsequently led other major biotech and wireless technology companies such as Johnson
& Johnson, Nokia and Ericsson to open up substantial R&D operations in San Diego. In
a very real sense, it is hard to imagine any of this happening had Ivor Royston and Irwin
Jacobs not been lured to UCSD in the first place. This view has been reinforced in
interviews with key players in San Diego’s high tech industries: 8
“One interviewee told us that San Diego attracted pioneers. Faculty who left places such as Harvard, Penn, and NIH were attracted to UCSD because they were scientific entrepreneurs. (Project interview #12) Others told us in informal conversations that people came to UCSD, Scripps, and Salk not just because of the research money offered but also because of the freedom to work on what interested in them, including interdisciplinary work or research in fields outside their original fields. We also heard that a large number of the early faculty were divorced and looking for new beginnings, although we know of no easy way to confirm or disconfirm these anecdotes.”
Additionally a small but growing body of evidence suggests that universities can
also serve as magnets to attract younger workers to the region as students who then stay
after graduating.
For instance, Betts (2000) shows using 1990 Census data for California that a
significantly higher share of young college enrollees in California were born in other
states or are immigrants, compared to a slightly younger cohort. People originating out
of state comprise 42.4 percent of the young college-attending population, compared to
just 34.4 percent of the age group 13-17. He interprets this as a “college magnet effect”.
Groen and White (forthcoming) show that students who graduate from a
university in a given state are more likely to live in that state sixteen years after
graduation. Some of this effect, they argue, is self-selection. In other words, a high- 7 Source: UCSD CONNECT 8 Walshok et al, 2001.

14
school student from Minnesota who yearns to live in California is likely to apply to many
universities in California, and we cannot necessarily think of the fact that he or she does
graduate from a California university as causing the graduate to remain in California for
his career. But even after attempting to control for this self selection, the authors find
that for both public and private universities attendance increases the chance that the
student will remain in the same state by about 10%, an estimate quite close to that of
Betts for California.
In Canada, data in Burbidge and Finnie (Table 4, 2000) suggest that of all 1990
bachelor’s graduates in their sample, 3.5% leave their home province to attend a
university in another province and have not returned home to work by five years after
graduation. For smaller provinces, the outflows are significantly greater. The four
highest rates of outflows are 24.7% for Prince Edward Island, 9.8% for New Brunswick,
8.7% for Nova Scotia and 8.2% for Manitoba. Not surprisingly, the largest provinces
have the lowest rates of “permanent” outflows to universities elsewhere: 1.7% for
Ontario and 2.8% for Quebec. 9
9 All these studies beg the question, besides the university, are there other factors else that help attract and keep university graduates in a region? The most talented graduates, especially PhD graduates from a top university, are the most mobile workforce in the world. Richard Florida (2002) would argue that “creative workers” are drawn to “creative centers [that] provide an integrated eco-system or habitat where all forms of creativity—artistic and cultural, technological and economic—can take root and flourish.” However, in the case of Palo Alto in the 1950’s or San Diego in the 1970’s, neither locale presented an urban, sophisticated environment teeming with nightlife and culture that would attract members of “the creative class.” Other than good weather and the presence of a university, several decades ago neither locale would have registered high on Florida’s list of “creative class” attractions. This fact should be of some comfort to technologically “have-not” regions.

15
4. Evidence on the Direct Impact of Universities on Private Sector Innovation
The University as Innovator and Partner to the Private Sector
Two of the university’s roles that we identified earlier are as an innovator and a
partner to private sector innovation. In practice, the boundary between these two roles is
quite blurry, and in this section we present evidence on both aspects of universities’
direct role in innovation.
Researchers have used quantitative measures of the impact of universities on
innovation including patent counts, patent royalties, and the number of firms created as
spin-offs or start-ups. Much of the U.S. evidence based on this sort of data suggests a
sobering truth: transferring technology from the university to the private sector is a very
difficult task.
Feldman’s (2003) review of data related to Technology Transfer Offices (TTO’s)
at American universities is quite revealing. These organizations exist to facilitate a
variety of means of technology transfer, including patenting and licensing of patents in
return for fees or royalties, and administering sponsored research. Feldman reports that
in 1999 only 140 American universities had established TTO’s, up from only about 25 in
1980. She also summarizes evidence that “for every one hundred invention disclosures,
ten patents and one commercially successful product result”. Although TTO’s executed
3,295 technology licenses in 1999 this is highly skewed towards a handful of universities.
Most TTO’s seek to be self-funding through the royalties and fees that they garner for
their universities, but the majority of TTO’s still lose money.
What about licensing from the point of view of industry executives? Feldman
cites a survey showing that 66% of industry respondents had not yet licensed technology

16
from a university. The two most common reasons for not licensing were the beliefs that
university research is typically at too early a stage of development and that it is not
related to the respondent’s industry.
Further evidence on the importance of universities to innovation comes from
university-awarded patents in the United States. The data in table 2 show that the number
of patents awarded to universities has greatly increased in recent years, and that the share
of universities in overall U.S. origin patents awarded in the United States has also risen.
But overall universities account for only about 3-4% of U.S. patents awarded per year to
inventors in the United States. (Public universities typically account for slightly over half
of these university patents.) The final column of the table shows that the top 100
universities account for roughly 80-90% of all patents earned by American universities.
This skewed pattern suggests that many universities do not participate much in the patent
game if at all. Again, this provides an indication of how difficult it can be to create what
Rosenberg (2003) refers to as the “entrepreneurial university”.
Data on the number of firms created as university spin-offs or start-ups is more
encouraging, but again suggests that technology transfer occurs only slowly over time.
Feldman cites a survey showing that 275 university-related start-ups opened in 1999, an
average of about two companies per university. Again, Feldman reports, the data are
right-skewed, indicating that a small number of universities accounts for a
disproportionate share of these start-ups.
A third type of technology transfer is sponsored research, through which a firm
subsidizes or wholly finances university research in return for preferential access to the
results of the research. In absolute terms, the flow of funds is large, at $2 billion in 2000,

17
but this represents only about 7% of all university research funding. (Feldman 2003)
The $2 billion in sponsored research is also small relative to total R&D and investments
made by “angel” investors and venture capitalists in the private sector, estimated by
Auerswald and Branscomb (2003) to have totaled $266 billion in 1998.
Why don’t we see more transfer of technology from American universities?
Auerswald and Branscomb (2003) develop the following line of argument: there is a
wide gulf between basic research and a marketable product. The intermediate stages
include proof of concept, early stage product specifications, and actual product
development, followed by production and marketing. They argue that a university
professor alone is unlikely to possess more than a few of the many skills needed to bring
to fruition the idea for a new product based on research. The need for teams to bring an
idea to market creates all sorts of informational asymmetries between the many parties
involved, including the original research team, angel investors who typically fund early
research and provide mentoring based on their own entrepreneurial experience, and
venture capitalists who typically fund the later stages of product design and development.
Compounding the difficulties are the intrinsic risks facing innovators. Auerswald and
Branscomb (2003) estimate that of the roughly 200,000 “technology ventures” in the
United States, in a given year only about 10% receive funding from angel investors, only
about 0.25% of technology ventures receive heftier venture capital investments, and a
similar or smaller percentage make initial public offerings on the stock market.
One reason why our above literature review suggests a fairly limited impact of
universities on innovation is that our focus on innovations directly linked to universities
(through university-owned patents and so on) seriously undercounts the impact of

18
university scientists and engineers. Faculty often consult with firms, and this may
produce innovations that are not directly measurable as coming from the university.
However, it is notoriously difficult to measure university collaboration with the private
sector because faculty consulting is not tracked by formal university means. A study by
Boyd and Bero (2000) of University of California San Francisco (UCSF) faculty
consulting uses Conflict of Interest forms. These data suggest that not much consulting
occurs. The discrepancy probably results from massive under-reporting by professors of
these activities. Between 1980 and 1999, there were only 488 positive disclosures from
225 UCSF researchers.10 Only 37% of researchers had more than 1 positive disclosure
but the variance is huge: 1 researcher had 28 positive disclosures but most had less than
4. A third of these disclosures related to speaking honoraria received from speaking
engagements, another third arose from consulting arrangements, and the final third from
participation in company scientific advisory boards or on company board of directors.
University as Facilitator
A fifth potential role of universities is to act as a facilitator for private sector
innovators in the region. This can include creation of science parks, which often are
associated with local universities. Wallsten (2004) reports that between 1980 and 1998
the number of science parks in the United States soared from 16 to 135. Often these
parks are subsidiaries of universities or at least have an affiliation with one or more local
universities. Two of the most famous and highly regarded examples are the Stanford
Research Park and the Research Triangle Park in North Carolina, the latter of which is
near to numerous leading universities. However, Wallsten shows that in general counties 10 UCSF has over 17,000 faculty and staff with 1,137 principal investigators.

19
with a science park have not shown greater growth in either high tech employment or in
venture capital funding than have a comparison group of similar counties without science
parks. Clearly, science parks succeed to varying degrees.
A more subtle but perhaps more important way in which universities can facilitate
local innovation in the private sector is to create a meeting ground in which seasoned
professionals from the high tech industry can rub shoulders as well as mentor less
experienced scientists and entrepreneurs as they attempt to create thriving startups of
their own. A number of organizations like this have sprung up in the United States. The
case study of San Diego below will provide a detailed discussion of UCSD CONNECT, a
program that acts as a catalyst for local high tech entrepreneurship.
5. Indirect Evidence from the Literature on High Tech Clusters
Over the last 15 years, the idea that industries tend to agglomerate in certain
regions has come to the forefront of regional planning. Michael Porter has spearheaded
much of this research, arguing that the availability of certain inputs, including skilled
labour, can help to explain why industries agglomerate in some countries and within
certain regions of a given country. (See for instance Porter, 1990 and 1998.)
In the context of the present paper, this leads us to a central question: is the main
impact of a university on innovation felt locally or at a national level? Put differently,
does the presence of universities lead to local agglomeration of high tech innovation?
This question parallels our earlier analysis in which we concluded that a
substantial fraction of graduates from a university in a given region are likely to be “lost”
to other regions or even other countries. However, our conclusions regarding the direct

20
contributions of universities to regional innovation through patenting, spin-offs and
licensing are quite different. The evidence tentatively suggests that the local area may
gain much of the direct impact of universities on innovative activity. If the university
actively chooses to engage in activities to boost regional economic development, then
this effect can be greatly augmented.11
There are a number of reasons for this. Inventors typically need to team up with
networks of funders who can provide a variety of technical, financial and marketing
services. This reliance on others for business expertise appears to concentrate product
development work fairly close to the location of the initial investor. Auerswald and
Branscomb (2003) cite studies by Sohl (1999) and Wong (2003) who establish that in the
U.S. more than half of angel investors surveyed reported that they restricted their
investments to locations within 50 miles, ostensibly in order to keep tabs on the receiving
organization and to avail it of the angel’s network of business partners.
Related evidence based on citations establishes that local innovations spill over to
other entities in the same area, so that a university’s innovative activity is likely to boost
the local private sector in indirect ways. Jaffe (1989) models the location of U.S.
inventors who are granted patents and finds that the amount of both university R&D and
industrial R&D are strong predictors of private sector patents granted by state. The
implication is that university research stimulates local innovation. Supporting evidence
comes from his finding that university research appears to stimulate industrial research in
the same state. Jaffe, Trajtenberg and Henderson (1993) show more generally that the
applications for new U.S. patents tend to cite other patents issued to entities in the same
state and even metropolitan area to a high degree. Again, this suggests that local 11 Tornatzky et al, 2002.

21
knowledge, once generated, sends ripple effects through the local R&D community that
are far larger than the ripples felt in distant regions.
Supporting these statistical analyses is a wealth of evidence from case studies of
high tech clusters.
First and foremost, recent observations about Silicon Valley back up the notions
that high tech product development will occur in geographically concentrated areas, and,
more importantly, that these areas will often center on major research universities.
Gibbons (2000) argues that in 1996 the 100 companies initiated with Stanford “teams and
technology” accounted for 65% of Silicon Valley revenues, or about $65 billion.
Not only has Stanford directly created many successful spinoffs locally, but it
continues to sustain high tech companies in the immediate area. Gibbons (2000) quotes
Ed McCracken, Chairman and CEO of Silicon Graphics as follows: “We drew a ten-
minute commute circle around Hoover Tower [on the Stanford campus] to define
acceptable locations for our company”. McCracken cites the company’s reliance on
Stanford’s research, faculty and graduate students as the reasons for locating so close to
Stanford.
Gibbons also quotes Gordon Moore, chairman emeritus of Intel, as follows: “The
most important contribution Stanford makes to Silicon Valley is to replenish the
intellectual pool every year with new graduate students”.
Our case study of San Diego in the next section will document a similar and
particularly remarkable clustering of high tech startups around the campus of UCSD and
nearby research institutes.

22
A recent study by Lee and Walshok (2003) attempted to analyze a confidential
data set of California Small Business Innovation Research (SBIR) applicants for links to
local research universities in the company’s vicinity. 12 SBIR applications contain
extremely detailed information about a company’s business plans. From these plans, it is
possible to document a variety of what Lee and Walshok call Know-How/Know-Who
linkages. These linkages range from university researchers as founders, to local alumni
as senior managers, to local industry executives and local investors serving as board
members. These links also influence funding decisions; there is a positive correlation
between the total number of links between companies and university academics and the
funding received. Collectively, these indicators represent statistically significant
relationships between teams of local academic researchers and local industrial scientists
and engineers working jointly on product development activities. Firms are leveraging
local university expertise through more than research collaborations and faculty
consulting activities. They also benefit from local university resources through
equipment rental and access to specialized facilities. Companies utilizing university
facilities and tapping into faculty expertise are also likely to be more reluctant to locate
corporate facilities far from the academic research center as travel time between the sites
could cut down on the productivity of scientific/engineering personnel. None of these
activities are quantifiable transactions that can be easily measured because these are
frequently transactions with no formal reporting requirements. Hence, the results
reported in the Lee and Walshok study provided a first, quantitative look at how
12 The federally funded Small Business Innovation Research (SBIR) Program provides funding for the commercialization of new technology by small firms. SBIR funds feasibility studies and prototype development, not basic R&D. This public venture capital is vital to small technology firms as it provides critical gap funding to develop an innovative technology to the point where a company can attract private venture funding.

23
California’s high tech firms and research universities are embedded in a local milieu that
shapes their interactions, their co-location and multiple individual relationships between
university and industry counterparts.
Evidence from clusters in other countries tends to corroborate the idea that
universities tend to anchor innovative regions. In their examination of Israel high tech,
de Fontenay and Carmel (2004) produce a map that illustrates quite vividly that
multinational high tech companies and homegrown high tech companies alike tend to
locate nearby some of the country’s leading universities. Arora, Gambardalla and Torrisi
(2004) argue that part of the agglomeration of high tech firms in India reflects the pre-
existing location of universities. They conclude that: “The distribution of engineering
colleges, concentrated in the western and southern regions, closely mirrors the
distribution of the software industry”. The same authors cite examples of Irish high-tech
firms that were formed by university professors and which are located near their
universities. In addition, they summarize results from surveys they performed of 28
domestic firms and 13 foreign-owned high tech firms. Both surveys showed that the
availability of skilled Irish workers was by far the most important factor leading the firms
to locate operations in Ireland.
6. San Diego as a Case Study
This section has three goals: a) to provide an overview of San Diego’s rapid rise
to prominence in biotech and wireless communications, b) to examine the links between
local universities and San Diego’s high tech growth, and c) to showcase some new

24
methods for studying the diverse ways in which universities can support the development
of a local high tech private sector.
In the past two decades, the San Diego region has transformed itself into one of
the most innovative regions in the United States.13 The University of California at San
Diego (UCSD), together with other major research centers such as The Salk Institute for
Biological Studies, The Scripps Research Institute (TSRI), The Neurosciences Institute
and the US Navy’s Space and Naval Warfare Systems R&D Center (SPAWAR)14 among
others, garners close to a billion dollars in basic research annually, with nearly half of
that coming from the Department of Health and Human Services (mostly National
Institutes of Health (NIH) funding) for basic research in the life sciences (See Figure 2).
While UCSD is the largest recipient of federal research dollars,15 San Diego’s other
research institutions also add significantly to the regional funding picture. In addition to
this federal funding, San Diego high tech firms receive on the order of $1 billion annually
in private venture funding (See Figure 3).16
A first striking pattern that emerges from our analysis of San Diego is the
remarkable extent of geographical clustering. Location appears to matter pivotally for
high tech and biotech startups in San Diego, with most of them situated less than 3 miles
from world class centers of academic research which are all located within a mile of each
13 See Palmintera (2000). 14 SPAWAR’s San Diego Center (SSC San Diego) is the U.S. Navy's research, development, test and evaluation, engineering and fleet support center for command, control and communication systems and ocean surveillance. SSC San Diego provides information resources to support the joint warfighter in mission execution and force protection. 15 In FY2001, UCSD received over $485 million from federal funding sources, on an annual basis, and ranks 6th in the nation for federal funding in 2001 according to NSF. According to UCSD’s Annual Report, UCSD outranked all other campuses of UC in terms of federal support for programs. For 2003, the campus received $627 million in federal funding in 2003, the latest year for which figures are available. Federal support has been growing at over 14% per year, and has doubled over the past decade. 16 PWC’s Moneytree Report indicated that San Diego received a total of 107 venture funded deals worth $964 Million in 2002, down from a high of $2.32 Billion in 2000, at the height of the Dot-Com bubble.

25
other. More than 1,000 high technology and biotechnology companies have sprung up in
Torrey Pines Mesa and Sorrento Valley, areas neighbouring UCSD, The Scripps
Research Institute and The Salk Institute, over the past two decades. As one illustration
of this clustering, Figure 4 provides a map of San Diego’s Small Business Innovation
Research (SBIR) funded emerging high tech firms--these are the newest firms in the
cluster. We believe that firms’ desire to locate close to the aforementioned research
institutions is the primary explanation of the clustering of activity around
UCSD/Salk/Scripps. At the same time, it is important to acknowledge that two important
facilitating factors were the availability of land to the north and northeast of UCSD in the
1980s and early 1990s and the fact that these areas were zoned appropriately for light
industrial development decades earlier. Indeed, in other studies of SBIR funded firms in
Greater Philadelphia and Indiana, we have shown that urban geography can be key to the
lack of agglomeration.
Philadelphia: In the absence of planned zoning, Philadelphia’s SBIR-funded emerging
biotech firms are located in a elongated 60 mile long stretch of Philadelphia suburbs and
exburbs, anchored solely by an interstate freeway that runs through the area, and not by
the University of Pennsylvania, which has a world class medical center in downtown
Philadelphia.17 Rush hour traffic jams on area freeways would preclude these suburban
biotech firms from having the close ties to Philadelphia’s world class universities which
are all located downtown.
Indiana: Indiana and Purdue Universities are major research institutions in Indiana, but
the main campuses for both university systems are located in small, college towns
(Bloomington and Lafayette respectively) outside of Indianapolis, the state’s main 17Switzer, Walshok and Lee, 2003.

26
metropolitan center. Yet, the schools’ main medical campus18 is located in downtown
Indianapolis. While Purdue University has created a science park next door to the
university and Indiana University is encouraging the development of a biotech sector, the
number of SBIR-funded biotech firms near both Bloomington and Lafayette campuses
have been extremely small. The number of SBIR funded biotech firms in Indianapolis is
larger than either Bloomington or Lafayette but again, there is no agglomeration near the
main healthcare campus (IUPUI) because the campus is located in downtown
Indianapolis while the emerging firms are located around the major freeways that ring
Indianapolis’ suburbs.19
A second striking pattern is that in San Diego, private sector high tech investment
and employment have both grown very quickly from low initial levels. Figure 3 shows
that private venture capital investments in San Diego were virtually zero in 1980 but have
grown quickly since then, with steady growth in the 1980’s giving way to much more
rapid, if volatile, growth in the 1990’s. Over the course of a decade (1990-2000), San
Diego created over 37,000 jobs in high tech industries, which more than made up for the
decline in the defense industry sector which declined by nearly 27,000 jobs after the end
of the Cold War. See Figure 5.
How has San Diego engineered such a transformation? Little more than fifteen
years ago, the region was still dominated by three major industries: a) defense
contracting, b) tourism and visitor services, and c) real estate development. The various
economic crises in the late-1970s to mid-1980s necessitated a regional shift in direction.
Regional civic and business leadership, in collaboration with local research institutions
18 Indiana University and Purdue University share one campus in Indianapolis (IUPUI). The campus grants mostly professional degrees in the medical sciences. 19 Lee, Walshok and Switzer, 2002.

27
including UCSD, sought means to assist the region’s economy to diversify into
knowledge-based industries. Prompted by the end of the Cold War, the downturn in the
defense contracting sector hit San Diego’s regional economy particularly hard in the early
1990s; that sector’s employment has never recovered to Cold War highs. Because the
region had already put into place mechanisms to assist high tech entrepreneurs, San
Diego’s economy rebounded shortly afterwards and rose to new heights during the late
1990’s.
While many observers view the creation of Silicon Valley as a happy accident
that cannot be recreated, there is a perception that San Diego engineered its current
success through planning, with UCSD and the CONNECT program playing central roles
in revitalizing a moribund regional economy (See the Appendix for a description of
CONNECT). Indeed, extensive interviews with key business, government and academic
leaders involved with San Diego’s high tech transformation reinforce this view.20
If one were to probe into the data presented above and ask what is the direct role
of UCSD in spinning off new technology companies, the picture becomes murkier.
According to the US Patent and Trademark Office (USPTO), patent counts for the San
Diego metropolitan statistical area (San Diego MSA) have risen steadily over the late
1990s (see Table 3). Yet, only 149 patents or 2% of all patents awarded in the San Diego
County during this period originated with inventors at UCSD. Nor is it clear that UCSD
affects mainly local innovation. Of the 162 companies currently listed on UCSD’s
Technology Transfer & Intellectual Property Services (TechTIPS) web site as having
licensed technology from UCSD, only 58 (or 36%) are San Diego companies.21 Yet
20 Walshok, Lee, Furtek and Windham (2001). 21 http://invent.ucsd.edu

28
UCSD’s technology transfer track record makes it a star among UC campuses. (See
Table 4)
What is less understood is how the university interacts with the surrounding
region to prime the innovation pump. Much of this activity is not captured on national
data sets either because it involves informal transactions that are not easily rendered into
quantitative data and/or they arise out of self-funded, self-supporting outreach activities
that the university undertakes, with no formal reporting requirements. Some of these will
be detailed below, along with first attempts to measure the impact that each can have on
the regional innovation process that is on-going in San Diego.
Technology Commercialization Through CONNECT, UCSD’s “Incubator Without
Walls”
Founded in 1985 at the urging of San Diego’s business community, San Diego’s
version of high technology business incubation is embodied in a program called UCSD
CONNECT. CONNECT’s private model of incubation differs significantly from that of
most public incubators. There is no physical incubation space provided at a subsidized
cost to the firm, nor is there public funding from local, regional, state or national
governments. Instead, CONNECT’s success in building high tech industry clusters come
from the numerous and frequent networking activities that are underwritten by
memberships, sponsorships, and event registration fees. CONNECT acts as a resource to
assist entrepreneurs throughout the San Diego region, not just for university spin-off
companies and faculty entrepreneurs.

29
Without a clear understanding of how CONNECT builds quality business
networks in a learning community, it is tough to see how CONNECT has come to play
such a pivotal role in driving firm agglomeration into industry clusters in San Diego.
Yet, how does one quantitatively measure a social phenomenon such as “networking” or
the formation of a “learning community” and what does one mean by “quality”? To the
casual observer, it appears that all CONNECT does is to put on events that do not differ
from many industry sponsored investor forums. Delegations from around the world have
asked repeatedly to see the CONNECT facilities only to be disappointed by the odd
collection of standard cubicles clustered in rented office space located just off UCSD’s
main campus. Here then, is a first attempt to quantify some of the factors that lie behind
CONNECT’s model of virtual incubation.
One of CONNECT’s signature programs is Springboard which assists high tech
entrepreneurs with business formation (see the Appendix for a more detailed description
of this program). Between 1995 and 2002, over 202 San Diego companies have
graduated from this program. Sixty percent of these companies are still going concerns
in 2002. Forty percent of these companies raised capital within 2 years of Springboard
graduation. Of the companies raising capital within 2 years of Springboard graduation,
88% are still alive. Together, these 202 Springboard companies have raised cumulatively
in excess of $581 Million, with nearly $325 Million within the first two years of
graduation. See Tables 5 and 6 and Figure 6.
The evidence above suggests that Springboard is quite effective at mentoring
entrepreneurs. Hidden from these statistics is how senior business leaders are networking
with each other before and after the event, and evaluating their peers during the question

30
and answer part of the event. We would argue that this peer evaluation is just as
important for building and maintaining the strength of regional networks as the feedback
and mentoring assistance provided to the entrepreneurs because this “donation” of
volunteer time by local executives to the common goal of boosting startup firms in San
Diego builds trust among the major players in the region.
When negotiating a deal, it is of paramount importance to the deal makers that
there be a certain level of trust established. If trust between the players has already been
established, then this can lend speed and ease to the process of concluding a deal. If the
major actors in a region have built up this trust repeatedly, then over time the overall
speed with which deals can be concluded increases and this can lead to the regional
competitive advantage observed by Porter and others. Springboard and other CONNECT
events are designed to foster repeated peer to peer networking with substantive feedback
in a forum where nothing more than reputations are at stake. The social capital
accumulated by the panelists comes into play after a CONNECT event when they
conduct business with each other, refer each other’s clients to trusted members of this
network and introduce new members to the network. None of these activities can be
captured by conventional measures of transactions. Yet, anecdotally, interviewees tell us
time and again, that without CONNECT’s fostering of social networks, San Diego’s high
tech industries would never have taken off.22
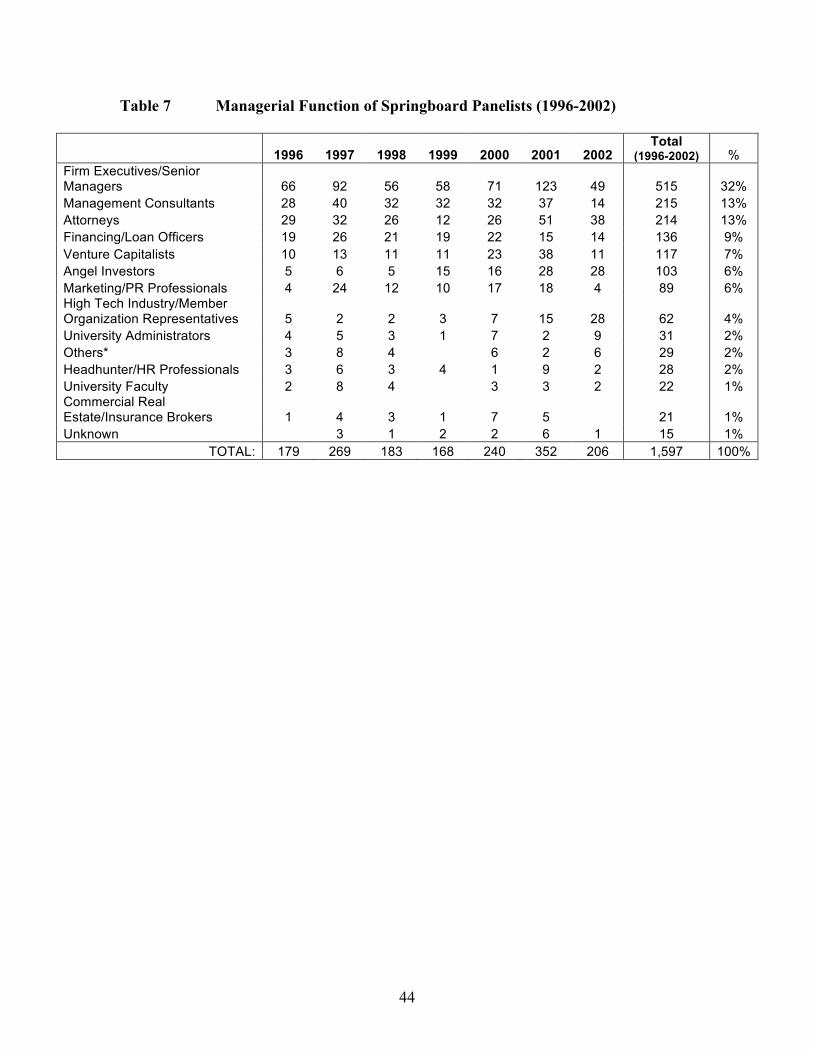
Even if one cannot quantify what happens during or after a networking event such
as a Springboard panel presentation, one could quantify the number of interactions
between key players in an industry cluster. An examination of the attendance roster of all
Springboard presentations between 1996 and 2002 yields a total of 1,597 panelists 22 Walshok et al, 2001.

31
representing a variety of senior managers at local firms (See Table 7). This total count of
1,597 panelists consists of 807 individuals who attended between 1 and as many as 19
Springboard presentations each. Approximately two thirds of these 807 individuals
served on a panel once, but another third served two or more times. (See Table 8). If as
we postulate, peer evaluation, the development of trust among key business players and
fostering the growth of a common community are important, then the high percentage of
panelists who served more than once on a Springboard panel is a revealed preference for
the value ascribed to serving on a Springboard panel.
Suppose, one were to ascribe a conservative estimate that each of these 807
individuals who served as Springboard panelists each knew 5 other peers of the same
managerial function, and could refer each other’s clients to these 5 other peers, if
occasion arose, then the number of people in this network who are indirectly affected by
CONNECT would quickly snowball. If one were to ask, in a “Six Degree of
Separations” fashion, how many members of San Diego’s current high tech business
leaders were personal friends of Bill Otterson, CONNECT’s now deceased founding
Executive Director, there would be few members of this club who would be more than a
degree or two separated from a “friend of Bill.” Indeed, one of the interview findings
from San Diego’s high tech leaders23 reveal that doing business in San Diego these days
is like operating in a small town—everyone knows everyone else—hence, technology
and deals get “shopped around” very quickly. Without this dense, informal business
network nurtured through CONNECT, early technology entrepreneurs found the process
of accessing capital and expertise a “hit or miss” process. In other words, the social
networks” that have grown up in San Diego’s high tech industries over the past two 23 Walshok et al, 2001.

32
decades have conveyed a competitive advantage for doing business in the region, but we
are just beginning to understand how this process works and how it can be recreated
elsewhere.
High Tech Workforce Training Through UCSD Extension
As San Diego’s high tech industries have been growing and maturing, there has
been a continuing need to train and re-train the workforce required by these growing
companies. In San Diego, both UCSD and San Diego State University (SDSU)24,25 have
been dominant institutions in providing the Bachelors’, Masters’ and PhD degree
credentialing for the high tech workforce. Less well known is the role that UCSD
Division of Extended Studies (UCSD Extension) and SDSU’s College of Continuing
Education have played in providing workforce training for San Diego’s burgeoning high
tech industries and how this affects regional competitive advantage. These self-funded
programs “fly under the radar screen” of most national and state policy-makers because
there are few reporting requirements. Yet, without a full accounting of the numbers of
students who participate in relevant continuing education programs, one would not obtain
a true accounting of the amount of education and training that is taking place in a region.
A recent study by Lee and Walshok (2002) examined UC’s Extension Divisions and
CSU’s Colleges Extended Studies to determine populations served and the types of
training provided. See Table 9 for a comparison of regular degree enrollments and
24 San Diego State University is the largest and one of the oldest campuses of the California State University (CSU) system. 25 The California public university system consists of a three-tiered system. The nine campuses of UC confer advanced degrees such as MA/MS and PhD while the 23 campuses of the California State University (CSU) system confer BA/BS and Masters but no PhD degrees, except in conjunction with a UC campus. There also 108 community colleges that confer two year Associates’ Degrees.

33
Extension/Continuing Education enrollments.26 Extension enrollments are large and at
UC in particular, far larger than even regular degree enrollments.
Given that UC Extension courses do not carry college credit and serve a post-
baccalaureate working adult population, one could ask a) what kinds of courses are
offered, and b) why are working adults taking these courses in such droves? A more
detailed survey of UCSD Extension students in San Diego (a “high tech” regional
economy) versus UC Riverside Extension students in Riverside/San Bernardino counties
(a “low tech” regional economy) revealed that fully 75% of Extension enrollees in San
Diego held post-baccalaureate degrees with a significant minor fraction holding PhD’s;
two-thirds of students were employed in high tech sectors and two-thirds of students were
reimbursed for their course taking by their employers. In comparison, only 56% of UC
Riverside Extension students held baccalaureate degrees or higher; only a quarter of
students were employed in high tech sectors and half of students were reimbursed by
employers. See Figure 7.27
Furthermore, UC Extension has demonstrated that continuing education programs
can be very effective workforce training programs for a region that has aspirations to
become a high tech hotspot, if these programs are implemented as that region’s high tech
companies are in rapid expansion stage. UCSD’s Extension enrollments have more than
doubled over the course of the 1990’s from approximately 20,000 enrollees to the current
level of over 40,000 enrollees. The nature of the course offerings has evolved over time
26 Lee and Walshok, 2002. 27 UC and CSU’s Continuing Education efforts have slightly different thrusts. UC’s programs concentrate on providing non-credit, professional development courses to a post-baccalaureate working adult population. CSU’s programs concentrate on providing regular college credit courses to a working adult population lacking degree credentials. The survey probed regional efforts on high tech workforce training and therefore highlighted UC Extension students over those at CSU.

34
as well. The current catalog lists nearly 60 courses in bioscience, and nearly 100 courses
in CDMA and related engineering, all geared to post-graduate level scientists and
engineers in the biotech and wireless communications industries.28 These courses did not
exist 5-10 years ago and were developed in response to specific industry needs for trained
workers.29
Finally, because UCSD Extension’s student population consists of working adults
in the local community who are pursuing course taking activities on a part-time, evening
basis, the turnover in UCSD Extension enrollees from one academic year to the next is
almost 100%. Contrast this with the low turnover rates in UCSD’s regular,
undergraduate student population who are on campus for 4 or more years on average; a
significant fraction of these students come from outside the region and may not settle in
the San Diego, after graduation. Over a decade, a strong, regional continuing education
program such as UCSD Extension can impact a significant fraction of the post-
baccalaureate, working population in San Diego County. Without a full understanding of
the extent of these university-based workforce training programs, one would be grossly
underestimating the full impact of a major research university in any region.
7. Concluding Thoughts
Our goal in this paper has been to document the extent to which universities spur
both local and national innovation through their multiple roles as trainer, innovator,
partner, regional talent magnet and facilitator of networking. Evidence on all counts is
28 http://extension.ucsd.edu/Courses/ 29 While this study has highlighted UCSD Extension role in high tech workforce training in San Diego, UC Santa Cruz serves a similar function for workers in Silicon Valley. UC Santa Cruz has over 50,000 enrollees pursuing non-college credit professional development courses in a variety of campuses throughout Santa Clara County and the East Bay.

35
mostly circumstantial, but collectively suggests that universities can and do play major
roles in all of these ways. Although the last two of these roles are the least studied, the
“talent magnet” and “facilitator” effects are potentially as important as the more obvious
roles for the university that we have studied.
So what is the bottom line? How important are universities to the creation of
innovative economies? Even in the best of all worlds, in which all of the claims that we
have documented are true, a “have-not” region could invest in universities in each of our
five domains, only to find that local high tech growth remains dismally low. Broadly
speaking, there are two reasons for potential failure. The first reason is simply that a
university could produce outstanding graduates, only to see them leave for more thriving
areas. Spatial agglomeration is very real, and we have documented how this works to the
benefit of the “technology-have” regions and to the detriment of the “technology-have-
not” regions in both the United States and Canada.
But there is a second and more fundamental reason why it is probably wrong to
think of universities in isolation as a magic key to high tech growth. Universities can
function as the knowledge creation anchor for a region, but the university is not sufficient
in and of itself to drive the creation of a knowledge intensive industry cluster. There are
other vital pieces that need to be connected such as smart sources of financing that
understand the needs of emerging high tech firms, managerial talent savvy in these
industries, as well as the scientists and engineers who innovate in these firms.
Technology commercialization is a very different beast than knowledge creation; a region
needs both to thrive. To be blunt, if anything, there is a tendency in the literature to

36
perhaps overplay the role of universities and underplay the role of the private sector in
generating innovative technology clusters.
Increasingly, in knowledge intensive industries such as biotech, it is not firms
competing in a global marketplace, it is also regions competing with each other for the
attraction of major corporate research establishments and promising start up firms.
Whether a region tries to grow its own powerhouse firms from scratch or tries to lure
branch plants and R&D centers to its region, success on these regional strategies is
couched on truly understanding a region’s competitive advantage and then being able to
sell this advantage to entrepreneurs, corporate execs and financiers of these knowledge
intensive industries. The university is but one of several actors that help to determine the
competitive advantage of the region.
Predictably, we end this paper with the usual call for “more and better data”. Our
own analysis and summary of that of others based on national measures of R&D or
skilled labour are an important first step, but don’t reveal the subtleties at work on the
regional level. In this paper we have highlighted some recent attempts to gather and
interpret data on actual linkages between universities and firms. This approach, while
time consuming and costly, promises to tell us much that is new about the full extent of
university-industry interactions and the resulting impact on innovation in both settings.
We also need to develop new data sets that track new indicators of success, e.g. the
agglomeration of intellectual property lawyers in a region over time, the development of
indigenous venture capital funding in a region that had none, and the agglomeration of
scientists and engineers of particular sub-specialities (e.g. neuroscientists in San Diego).
Armed with better data, preferably at the city, metropolitan or county levels, there is

37
greater hope that we can perform studies that carefully delineate between cause and
effect.

38
Table 1
Enrollment and Graduates as % of Grade 9 Students Three Years Earlier in California Year Grade 12 Graduates Graduates Fulfilling Enrollment a-f with Grade of C or better 1991/1992 88.4% 79.6% 26.5% 1994/1995 82.6% 73.9% 23.9% 1995/1996 81.7% 73.1% 25.6% 1996/1997 81.0% 71.0% 25.3% 1997/1998 79.8% 68.7% 24.9% 1998/1999 81.3% 68.7% 25.1% 1999/2000 79.9% 68.8% 24.5%
Source: Betts (2002).
Note: “a-f” refers to the course requirements that high school students must fulfill in order to be eligible for admission to the University of California and the California State University System.

39
Table 2 Statistics on Importance of U.S. Universities in Patent Awards
Year # Patents Awarded to % from Public University Patents as % % of University
Patents U.S. Universities Universities Total U.S. Origin Patents Claimed by Top 100
1982 464 51.9 N/A 83.2 1983 437 51.3 N/A 81.7 1984 552 46.9 N/A 82.8 1985 589 52.3 N/A 81.8 1986 670 53.3 1.8 81.8 1987 820 48.4 1.9 84.9 1988 814 49.9 2.0 86.5 1989 1228 53.4 2.4 88.8 1990 1184 56.8 2.5 91.0 1991 1340 59.3 2.6 90.4 1992 1542 58.9 3.0 92.1 1993 1620 58.0 3.0 91.7 1994 1780 60.0 3.2 91.8 1995 1879 63.3 3.4 91.2 1996 2155 62.1 3.5 91.4 1997 2436 61.7 3.9 92.2 1998 3151 57.9 3.9 92.7
Source: Authors' calculations based on National Science Board (2002), Appendix Tables 5-56 and 6-12. N/A indicates data not available.

40
Table 3 Patents Awarded in San Diego County, by Organization (1995-1999)
Rank Organization 1995 1996 1997 1998 1999 Total
(1995-99) 1 Hewlett-Packard Co. 56 51 66 71 92 336 2 Qualcomm, Inc. 19 43 35 69 90 256 3 Isis Pharmaceuticals, Inc. 8 27 36 37 68 176 4 The Scripps Research Institute 31 25 25 54 40 175 5 UCSD 20 24 28 39 38 149 6 US Navy 26 30 31 27 30 144 7 The Salk Institute of Biological Studies 8 17 27 27 20 99 8 Gen-Probe, Inc. 6 9 30 32 21 98 9 La Jolla Cancer Research Foundation 3 16 26 27 23 95
10 Eastman Kodak Co. 16 27 22 19 10 94 11 Solar Turbines, Inc. 17 15 12 8 5 57 12 General Instruments Corp. 9 10 11 12 13 55 13 Mycogen Corp. 9 5 19 8 10 51 14 Sony Corp. - 9 7 15 20 51 15 Cymer, Inc. - - 4 13 24 41 16 Corvas International, Inc. - 4 11 10 15 40 17 Medtronic Inc. 6 6 7 10 11 40 18 Agouron Pharmaceuticals, Inc. 1 3 9 13 12 38 19 Hughes Aircraft Co. 18 12 5 3 - 38 20 SIBIA Neurosciences Inc. - 2 8 15 11 36
All Others 398 490 573 848 850 3,159 Individuals 257 290 243 316 345 1,451 TOTAL: 908 1,115 1,235 1,673 1,748 6,679

41
Table 4 UCSD’s Technology Transfer Activities30
UCSD’s Technology
Transfer Activity
Rank Among the 9 Campuses of UC31
2002 Invention Disclosures 255 1 Total Invention Portfolio 1,274 1 Total Patents Portfolio 392 3 2002 Licenses Executed 181 2 2002 Licensing Revenue $12,690,000 3
30 University of California’s Office of Technology Transfer Annual Report (2002). 31 The nine campuses of the University of California (UC) System include: UC Berkeley, UC Davis, UC Irvine, UC Los Angeles (UCLA), UC Riverside, UC San Diego, UC San Francisco, UC Santa Barbara, and UC Santa Cruz.

42
Table 5 Tracking UCSD CONNECT’s Springboard Graduates (1995-2002)32
a. All Springboard Graduates (1995-2002) No. of Firms % of Firms In Business 120 59% Acquired 18 9% Out of Business 66 33%
TOTAL: 202 100% b. Springboard Firm Survival Rates
Survival Time No. of Firms (Total=202)
Survival Rate
1 year or more 161 80% 2 years or more 120 62% 3 years or more 93 57% 4 years or more 73 54% 5 years or more 49 42%
c. Springboard Firms' Ability to Raise Capital
No. of Firms (Total=81)
% of Firms (Total=81)
Still Alive 71 88% Out of Business 10 12% Raised capital and survived 3+ years 48 59% Raised capital and survived 5+ years 31 38%
Out of 202 graduates, 81 firms (40% of all graduates) were able to raise capital within 2 years.
32 Data in this table are right censored. That is, the table measures survival rates as of 2003. Some of the firms in the sample participated in Springboard as late as 2002, so cannot have had a survival duration of more than one year as of 2003. Therefore in panel b survival rates for x or more years are calculated as the number of firms alive in 2003 divided by the number of firms that presented at Springboard x or more years before 2003.

43
Table 6 Capital Raised by CONNECT’s Springboard Graduates (1995-2002)
a. Total Capital Raised by Springboard Graduates (Total=202 cos.) Springboard Graduation $ Million
Pre-1995 & 1995 128.1 1996 62.2 1997 76.7 1998 89.4 1999 102.4 2000 91.7 2001 30.4 2002 0.6
TOTAL: 581.5 b. Capital Raised by All Companies Within 2 years of Graduation (Total=81 cos.)
Springboard Graduation $ Million 1995 34.8 1996 14.7 1997 49.9 1998 19.8 1999 82.7 2000 91.7 2001 30.4 2002 0.6
TOTAL: 324.6
44
Table 7 Managerial Function of Springboard Panelists (1996-2002)
1996 1997 1998 1999 2000 2001 2002 Total
(1996-2002) % Firm Executives/Senior Managers 66 92 56 58 71 123 49 515 32% Management Consultants 28 40 32 32 32 37 14 215 13% Attorneys 29 32 26 12 26 51 38 214 13% Financing/Loan Officers 19 26 21 19 22 15 14 136 9% Venture Capitalists 10 13 11 11 23 38 11 117 7% Angel Investors 5 6 5 15 16 28 28 103 6% Marketing/PR Professionals 4 24 12 10 17 18 4 89 6% High Tech Industry/Member Organization Representatives 5 2 2 3 7 15 28 62 4% University Administrators 4 5 3 1 7 2 9 31 2% Others* 3 8 4 6 2 6 29 2% Headhunter/HR Professionals 3 6 3 4 1 9 2 28 2% University Faculty 2 8 4 3 3 2 22 1% Commercial Real Estate/Insurance Brokers 1 4 3 1 7 5 21 1% Unknown 3 1 2 2 6 1 15 1%
TOTAL: 179 269 183 168 240 352 206 1,597 100%

45
Table 8. Frequency of Participation as Springboard Panelists (1996-2002)
Frequency of Springboard Panel Participation
No. of Springboard Panelists Who Participated at This Frequency
Level 1 539 2 117 3 49 4 32 5 19
>5 51 TOTAL: 807

46
Table 9 UC and CSU Regular Full Time Enrollment Compared to Extension Program Enrollments
a. University of California
UC Regular Full-Time Enrollment33 UC Continuing Education34,35 Year Under-
Graduate Graduate Total FT
Enrollment Extension Enrollees
Concurrent Enrollment
Total Enrollment
1996 120,198 26,328 146,526 431,231 12,145 443,376 1997 122,453 26,267 148,720 441,331 11,997 453,328 1998 125,040 26,595 151,635 451,738 11,724 463,462 1999 128,883 26,607 155,490 433,301 11,191 444,492 2000 132,712 27,008 159,720 409,011 10,470 442,631
b. California State University System CSU Regular FT Enrollment36 CSU Continuing Education37
Fiscal Year
Under- Graduate Graduate
Total FT Enrollment
Extension Enrollment
Open University
Special Session
Total Enrollment
1995-96 264,968 62,747 327,715 98,074 44,272 57,478 199,824 1996-97 272,480 65,695 338,175 124,417 43,552 61,101 229,070 1997-98 275,164 69,438 344,602 133,230 44,041 70,262 247,533 1998-99 279,656 73,219 352,875 125,155 44,021 66,670 235,846 1999-00 286,176 76,570 362,746 143,922 48,394 70,332 262,648
33 1995-2000 UCOP Statistical Summary of Students and Staff, UC Office of the President, Budget Office. Post-baccalaureate students are students pursuing education/teaching credentials. These enrollments are typically small, less than 200 students per year per campus. 34 1999-2000 UCOP Annual Statistical and Financial Report on University of California Extension and Statewide Programs. 35 UC Extension courses serve a post-baccalaureate working adult population and are non-college credit professional development courses that carry continuing education credit units. These credits are non-transferrable to degree granting programs. Concurrent enrollment refer to members of the local community who occasionally register in degree-granting courses, without pursuing a degree, but on a space availability basis and with the permission of the instructor. There are restrictions on how many courses a student can take under concurrent enrollment before s/he must apply to for regular admissions into the university. 36 1995-2000 CSU Annual Statistical Reports, CSU Chancellor’s Office, Analytical Statistics Division 37 CSU’s Continuing Education serves a working adult population seeking a mix of degree credentialing and workforce training. Extension courses consists of professional development courses that provide continuing education credit units only. Open University provides access to CSU regular degree courses without formal admission to the university (same as UC’s Concurrent Enrollments). Non-admitted residents and those who have been disqualified and/or denied admission at CSU may participate in Open University. Special Session courses are approved courses offered by the university’s academic departments. Special Session courses meet residence requirements and may be applied toward a degree program. Admission to the university is not required.

47
Figure 1
Percentage of 1990 Bachelor's Graduates Who Remain in Home Province for University but Who
Move Within Five Years of Graduation
0.05.0
10.015.020.025.030.035.040.0
NFLD PEINS NB
QUEONT
MANSASK
ALTABC
ALL
Province
%
Source: Calculated from Table 4 of Burbidge and Finnie 20XX.

48
Figure 2
San Diego County’s Unrestricted Federal Funding for R&D, in FY2001.38
Acronyms for the US federal agencies in the left-hand pie chart are:
HHS—Department of Health and Human Services, mostly funding from the National Institutes of Health (NIH)
DOD—Department of Defense DVA—Department of Veteran’s Affairs NSF—National Science Foundation DOE—Department of Energy NASA—National Aeronautical and Space Administration
38 Source: The Rand Corporation’s RaDiUS database.
By Technology Sector
DOD$341.6MHHS
$390.7M
DVA$53.0M
NSF$46.5MDOE
$43.9M
NASA$26.2M
Other$24.0M
Defense$304.7M
Adv. Computing
$41.9MEnergy$20.2M
Aerospace$14.4M
Other$34.8M
Envir. Tech.
$53.5M
Life Sci. & Biotech$456.6M

49
Figure 3
Private Venture Capital to San Diego, by Industry Sector39
39 Source: Thomson Financial/Venture One
0
100
200
300
400
500
600
700
1975 1980 1985 1990 1995 2000 2005
Year
$Million
B iotechnolog y B us iness S erv. C ommunications and Media C omputer Hardware
C omputer S oftware C onstruction C onsumer R elated F inancial S ervices
Industrial/Energ y Internet S pecific Manufact. Medical/Health
Other S emiconductors/Other E lect. T ransportation
Internet Specific
Biotech
Medical/Health
Computer Software

50
Figure 4
1999-2001 SBIR funded companies in San Diego County Cluster Around UCSD, on
Torrey Pines Mesa and Sorrento Valley40
40 Source: Rand RaDiUS

51
Figure 5
San Diego’s high tech employment, by industry cluster41
41 Source: San Diego Association of Governments (SANDAG).
San Diego Cluster Employment Trends(1990-2000)
0
20,000
40,000
60,000
80,000
100,000
120,000
1990 1991 1992 1993 1994 1995 1996 1997 1998 1999 2000
Year
Empl
oym
ent
Hig h Tech & B iotech B us . S vc. V is itor Indus . S vc.
Defense M fg F inancial S vc. Non-‐Hig h Tech Other

52
Figure 6
Firm Survival After Springboard Graduation

53
Figure 7 Extension Students Employed in High Tech Industry Clusters
San Diego County Riverside/San Bernardino Counties “High Tech” Region (A “Low Tech” Region)
UCSD
All others
Not stated
IT
CommunicationsBiotech/Biomed
UCR
Biotech/BiomedCommunications
IT
Not stated
All others

54
References Arora, Ashish, Alfonso Gambardalla and Salvatore Torrisi, “In the Footsteps of Silicon Valley? India and Irish Software in the International Division of Labor”, in Bresnahan, Timothy and Alfonso Gambardella (Eds.), Building High Tech Clusters: Silicon Valley and Beyond, Cambridge: Cambridge University Press, pp. 78-120, (2004). Athreye, Suma, “Agglomeration and Growth: A Study of the Cambridge High-Tech Cluster,” in Bresnahan, Timothy and Alfonso Gambardella (Eds.), Building High Tech Clusters: Silicon Valley and Beyond, Cambridge: Cambridge University Press, pp. 121-159, (2004). Auerswald, Philip E., and Lewis M. Branscomb, “Start-ups and Spin-offs: Collective Entrepreneurship between Invention and Innovation,” in Hart, David M. (Ed.), The Emergence of Entrepreneurship Policy: Governance, Start-ups, and Growth in the U.S Knowledge Economy, Cambridge: Cambridge University Press, pp. 61-91, (2003). Bartel, Ann P., and Frank R. Lichtenberg, “The Comparative Advantage of Educated Workers in Implementing New Technology”. Review of Economics and Statistics 69:1-11 (1987). Berman, Eli, John Bound and Zvi Griliches, “Changes in the Demand for Skilled Labor within U.S. Manufacturing Industries: Evidence from the Annual Survey of Manufactures,” Quarterly Journal of Economics, May (1994). Berman, Eli, John Bound and Stephen Machin, “Implications of Skill-Biased Technological Change: International Evidence,” Quarterly Journal of Economics (113:4), pp. 1245-1280, (1998). Betts, Julian R., "The Skill Bias of Technological Change in Canadian Manufacturing Industries", Review of Economics and Statistics (February), (79:1), pp. 146-150, (1997). Betts, Julian R., The Changing Role of Education in California, San Francisco: Public Policy Institute of California, (2000). Betts, Julian R. Critical Path Analysis of California’s S&T System: California’s K-12 Sector, Riverside: California Council on Science and Technology, (2002). Binswanger, H. P., and V. W. Ruttan et al., Induced Innovation: Technology, Institutions and Development. Baltimore: Johns Hopkins University Press, (1978). Bils, Mark and Peter J. Klenow, “Does Schooling Cause Growth?’ American Economic Review, (90:5), pp. 1160-1183, 2000. Boyd, Elizabeth A. and Lisa A. Bero, “Assessing Faculty Financial Relationships with Industry: A Case Study,” Journal of the American Medical Association, v. 284 (17), pp. 2209-2214, (2000).

55
Bresnahan, Timothy and Alfonso Gambardella, “Old-Economy Inputs for New-Economy Outcomes: What Have We Learned?” in Bresnahan, Timothy and Alfonso Gambardella (Eds.), Building High Tech Clusters: Silicon Valley and Beyond, Cambridge: Cambridge University Press, pp. 331-358, (2004). Burbidge, John and Ross Finnie, “The Geographical Mobility of Baccalaureate Graduates: Evidence From Three Cohorts of the National Graduates Survey, 1982, 1986, 1990,” Canadian Journal of Regional Science, (23:3), pp. 377-401, (Fall 2000). California Council on Science and Technology, Critical Path Analysis of California’s S&T System: California’s K-12 Sector, Irvine: California Council on Science and Technology, (2002). Card, David, “Canadian Emigration to the United States”, in Beach, Charles M., Alan G. Green and Jeffrey G. Reitz (Eds.), Canadian Immigration Policy for the 21st Century, Kingston, Ontario: John Deutsch Institute for the Study of Economic Policy, pp. 295-312, (2003). Council on Competitiveness, Clusters of Innovation Initiative, http://www.compete.org, (2001). de Fontenay, Catherine, and Erran Carmel, “Israel’s Silicon Wadi: The Forces behind Cluster Formation”, in Bresnahan, Timothy and Alfonso Gambardella (Eds.), Building High Tech Clusters: Silicon Valley and Beyond, Cambridge: Cambridge University Press, pp. 40-77, (2004). Etzkowitz, H. A. Webster, P. Healey (Eds.), Capitalizing Knowledge: University Intersections of Industry and Academia, SUNY Press, (1998). Feldman, Maryann P., “Entrepreneurship and American Research Universities: Evolution in Technology Transfer,” in Hart, David M. (Ed.), The Emergence of Entrepreneurship Policy: Governance, Start-ups, and Growth in the U.S Knowledge Economy, Cambridge: Cambridge University Press, pp. 92-112 , (2003). Richard Florida, The Rise of the Creative Class: And How It’s Transforming Work, Leisure, Community and Everyday Life, Basic Books, (2002). Gibbons, James F., “The Role of Stanford University: A Dean’s Reflections,” in Lee, Chong-Moon Lee, Willam F. Miller, Marguerite G. Hancock (Eds.), The Silicon Valley Edge: A Habitat for Innovation & Entrepreneurship, Stanford Univ. Press, pp. 200-217, (2000). Hanushek, Eric A. and Dennis D. Kimko, “Schooling, Labor-Force Quality, and the Growth of Nations,” American Economic Review, (90:5), pp. 1184-1208, 2000.

56
Jaffe, Adam B., “The Real Effects of Academic Research,” American Economic Review, (79), pp. 957-970, (1989). Jaffe, Adam B., Manuel Trajtenberg, and Rebecca Henderson, “Geographic Localization of Knowledge Spillovers as Evidenced by Patent Citations,” Quarterly Journal of Economics, (108:3), pp. 577-98, August (1993). Kenney, Martin (Ed.), Understanding Silicon Valley: The Anatomy of an Entrepreneurial Region, Stanford Univ. Press, (2000). Lee, Carolyn W.B. and Mary L. Walshok, Critical Path Analysis of California’s S&T System: Alternative Paths to Competency Through Continuing Education and Lifelong Learning, Riverside: California Council on Science and Technology, (2002). Lee, Carolyn W.B., Mary L. Walshok, and B. Richard Switzer, “An Overview of the R&D Capacity of Indiana’s Top Six Metropolitan Statistical Areas.” A report for New Economy Strategies and Central Indiana's Life Science Initiative, (2002). Lee, Carolyn W.B. and Mary L. Walshok, Total Links Matter: The Direct and Indirect Effects of Research Universities on Regional Economies, a report for the University of California’s Industry-University Cooperative Research Program, (2003). Lee, Chong-Moon, Willam F. Miller, Marguerite G. Hancock (Eds.), The Silicon Valley Edge: A Habitat for Innovation & Entrepreneurship, Stanford Univ. Press, (2000). Lewis, David A., “Does Technology Incubation Work? A Critical Review,” a report to the US Economic Development Administration, (2001). Moore, Gordon and Kevin Davis, “Learning the Silicon Valley Way,” in Bresnahan, Timothy and Alfonso Gambardella (Eds.), Building High Tech Clusters: Silicon Valley and Beyond, Cambridge: Cambridge University Press, pp. 7-39, (2004). National Science Board, Science and Engineering Indicators, Volume Two: Appendix Tables, Arlington, VA: National Science Foundation, (2002). Palmintera, Diane, Developing High-Technology Communities: San Diego, a report to the US Small Business Administration’s Office of Advocacy, (2000). Porter, Michael, The Competitive Advantage of Nations, New York: The Free Press, 1990. Porter, Michael, “Clusters and the New Economics of Competition,” Harvard Business Review, pp. 77-90, (November-December 1998). Rosenberg, David, Cloning Silicon Valley: The Next Generation High-Tech Hotspots, Pearson Education Ltd., London, (2002).

57
Rosenberg, Nathan, “America’s Entrepreneurial Universities,” in Hart, David M. (Ed.), The Emergence of Entrepreneurship Policy: Governance, Start-ups, and Growth in the U.S Knowledge Economy, Cambridge: Cambridge University Press, pp. 113-137, (2003). Saxenian, AnnaLee, Silicon Valley’s New Immigrant Entrepreneurs, San Francisco: Public Policy Institute of California, (1999). Saxenian, AnnaLee, “Taiwan’s Hsinchu Region: Imitator and Partner for Silicon Valley,” in Bresnahan, Timothy and Alfonso Gambardella (Eds.), Building High Tech Clusters: Silicon Valley and Beyond, Cambridge: Cambridge University Press, pp. 190-228, (2004). Smilor, Ray W., George Kozmetsky, and David V. Gibson, Creating the Technopolis: Linking Technology Commercialization and Economic Development, Harper Collins, New York, (1988). Sohl, Jeffrey E. “The Early-Stage Equity Market in the U.S.A.,” Venture Capital, (1) pp. 101-120, (1999). Switzer, B. Richard, Mary L. Walshok, Carolyn W.B. Lee, “Greater Philadelphia’s Research Capacity and Dynamism.” A report prepared for New Economy Strategies and Innovation Philadelphia, 2003. Tornatzky, Louis, Hugh Sherman and Dinah Adkins, A National Benchmarking Analysis of Technology Business Incubator Performance and Practices, a report by the National Business Incubation Association to the US Department of Commerce, Technology Administration, (2003). Tornatzky, Louis G., Paul G. Waugaman, and Denis O. Gray, Innovation U: New University Roles in a Knowledge Economy, A Southern Policies Growth Board Report, Research Triangle Park, NC (2002). University of California, Office of Technology Transfer Annual Report, Oakland: University of California, (2002). Wallsten, Scott, “The Role of Government in Regional Technology Development: The Effects of Public Venture Capital and Science Parks,” in Bresnahan, Timothy and Alfonso Gambardella (Eds.), Building High Tech Clusters: Silicon Valley and Beyond, Cambridge: Cambridge University Press, pp. 229-279, (2004). Walshok, Mary, Carolyn Lee, Ed Furtek, and Patrick Windham, Networks of Innovation: Contributions to San Diego’s Telecommunications and Biotech Clusters, a report for the University of California’s Industry-University Cooperative Research Program, (2001).

58
Wong, Andrew, “Angel Finance: The Other Venture Capital,” Unpublished manuscript, Chicago: University of Chicago Graduate School of Business, (2002). Zucker, Lynne G. and Michael R. Darby, “Capturing Technological Opportunity via Japan’s Star Scientists: Evidence from Japanese Firms’ Biotech Patents and Products,” Cambridge: National Bureau of Economic Research, Working Paper 6360, (January 1998).

59
Appendix
UCSD CONNECT, San Diego’s Program for High Technology
Entrepreneurship
CONNECT Program History and Mission Founded in 1985 at the urging of San Diego’s business community, San Diego’s version of high technology business incubation is embodied in a program called UCSD CONNECT. CONNECT’s private model of incubation differs significantly from that of most public incubators. There is no physical incubation space provided at a subsidized cost to the firm, nor is there public funding from local, regional, state or national governments. Instead, CONNECT’s success in building high tech industry clusters come from the numerous and frequent networking activities that are underwritten by memberships, sponsorships, and event registration fees. The university provides some administrative overhead by hosting the program in the Division of Extended Studies and Public Programs (UCSD Extension), the academic unit for continuing education studies.42 CONNECT acts as resource to assist entrepreneurs throughout the San Diego region, not just for university spin-off companies and faculty entrepreneurs. CONNECT also relies heavily on volunteers from the local business service provider community. These business service providers not only sponsor CONNECT’s activities, the senior partners of local law firms, management consulting companies, venture capitalists and angel investors also serve on numerous committees to mentor entrepreneurs, review business plans, select candidate companies for CONNECT’s investment forums, and to choose the winners for the region’s Most Innovative Products of the Year Award. Besides assisting a larger number of companies than a typical physical incubator, CONNECT’s programs also serve to build and strengthen a growing network of savvy business service providers who understand the needs of the emerging high tech firms in their midst. The privately funded model allows CONNECT to remain close to its regional membership in tailoring its events and activities. The dense and multiple levels of networking that occur in this “learning community” fuel San Diego’s competitive advantage as a region where technology deals are concluded quickly and efficiently, experienced management teams can be put in place fast, and the local service providers are specialized and knowledgeable about high tech issues. CONNECT’s Role in Technology Commercialization Spinning off technology from a university academic setting involves two different processes, technology transfer of intellectual property (IP) ownership from the university and subsequent commercialization of this IP by a private entity other than the university.
42 The Division of Extended Studies and Public Programs (UCSD Extension) operates at the interface between the university and the community. All of its programs are self-supporting, in that there is no federal, state or local support for any of its activities. UCSD Extension operates on a tuition-fee-based, cost-recovery basis. CONNECT is one of several public programs housed in Extension; others include a TV station (UCSD TV), San Diego Dialogue, the San Diego Civic Collaborative, UCSD Summer Session, Academic Connections and the Cross-Border Health Initiative.

60
After transferring the intellectual property (IP) rights from the university to a start up company, the company’s founders must still seek funding to further the development of the technology into a product that sells. University technology transfer offices typically do not engage in these technology commercialization and business incubation activities that lie downstream from the technology transfer process. Some universities have built physical incubators to assist with technology commercialization activities but the success of these incubators are debatable as the throughput of companies being incubated is not high enough to jumpstart the agglomeration of firms in a particular industry that gives rise to regional industry clusters.43 CONNECT, on the other hand, acts downstream of the Technology Transfer Office, and is concentrated solely on assisting high tech entrepreneurs on capital formation, management team building and workforce issues. The lack of physical incubation space was not an issue at the program’s inception, as San Diego’s regional economy in 1985 was reeling from the fallout of the Savings and Loans Crisis. In retrospect, this also gave CONNECT an advantage, as the number of companies that it could assist was not limited by CONNECT’s own office space, as would be the case for a physical incubator. CONNECT’s throughput remains much higher than that of physical incubators. CONNECT’s Springboard Program Assists Emerging Firms CONNECT’s Springboard program mentors entrepreneurs with business plan writing and strategic planning. After 8-12 weeks of one-on-one coaching by CONNECT staff, graduation consists of a presentation of the polished business plan by the entrepreneurs to a review panel of business service providers, seasoned entrepreneurs, and potential angel and venture capital investors. The panelists,44 serve on a volunteer basis and provide honest feedback to the entrepreneurs during a 2 hour breakfast meeting. If a panelist wishes to pursue further discussions with an entrepreneur, that is solely at the two parties’ discretion. CONNECT, having served the role of an honest broker in convening the Springboard panel, steps aside. While there are anecdotes of companies being directly funded out of a Springboard panel, this is not the norm. Rather, the program is designed to introduce promising entrepreneurs to San Diego’s business networks while providing business leaders an opportunity to network with each other while they are mentoring the next generation of business leaders in their midst.
43 Lewis, 2001, Tornatzky, Sherman & Adkins, 2003. 44 Panelists are typically senior partners in law and accounting firms, CEO’s, and senior decision-makers in the firms they serve. Junior staff from these firms are never tapped to be volunteers for CONNECT events although they may be invited by the senior partner to observe, on an occasional basis.