universita degli studi di bologna dottorato di ricerca in ... · many thanks to drs: manuel iori,...
TRANSCRIPT

UNIVERSITA DEGLI STUDI DI BOLOGNA
Dottorato di Ricerca in
Automatica e Ricerca Operativa
MAT/09
XXII Ciclo
Formulations and Algorithms for Routing Problems
Majid Salari
Il Coordinatore Il Tutor
Prof. Claudio Melchiorri Prof. Paolo Toth
A.A. 2007-2010
i

Keywords
Integer Linear Programming
Vehicle Routing Problem
Network Optimization
Column Generation
Metaheuristics
Local Search
Heuristics
ii
Contents
Acknowledgments . . . . . . . . . . . . . . . . . . . . . . . . . . . . . . . . . v
List of figures . . . . . . . . . . . . . . . . . . . . . . . . . . . . . . . . . . . . vi
List of tables . . . . . . . . . . . . . . . . . . . . . . . . . . . . . . . . . . . . viii
Preface . . . . . . . . . . . . . . . . . . . . . . . . . . . . . . . . . . . . . . . . ix
1 An ILP Improvement Procedure for the Open Vehicle Routing Problem 1
1.1 Introduction . . . . . . . . . . . . . . . . . . . . . . . . . . . . . . . . . . . 1
1.2 Literature review . . . . . . . . . . . . . . . . . . . . . . . . . . . . . . . . 3
1.3 Reallocation Model . . . . . . . . . . . . . . . . . . . . . . . . . . . . . . . 4
1.3.1 Column generation for the Reallocation Model . . . . . . . . . . . . 6
1.4 Heuristic Improvement Procedure . . . . . . . . . . . . . . . . . . . . . . . 8
1.5 Computational Results . . . . . . . . . . . . . . . . . . . . . . . . . . . . . 9
1.6 Conclusions and Future Directions . . . . . . . . . . . . . . . . . . . . . . 19
2 An Integer Linear Programming Based Heuristic Approach for the Ca-
pacitated m-Ring-Star Problem 20
2.1 Introduction . . . . . . . . . . . . . . . . . . . . . . . . . . . . . . . . . . . 20
2.2 Description of the proposed algorithm . . . . . . . . . . . . . . . . . . . . . 22
2.2.1 Initialization Procedure . . . . . . . . . . . . . . . . . . . . . . . . 24
2.2.2 Local Search Procedure . . . . . . . . . . . . . . . . . . . . . . . . . 24
2.2.3 Shaking Procedure . . . . . . . . . . . . . . . . . . . . . . . . . . . 29
2.3 Computational Results . . . . . . . . . . . . . . . . . . . . . . . . . . . . . 29
2.4 Conclusion . . . . . . . . . . . . . . . . . . . . . . . . . . . . . . . . . . . . 32
3 Variable Neighborhood Search for the Label Constrained Minimum
Spanning Tree Problem 36
3.1 Introduction . . . . . . . . . . . . . . . . . . . . . . . . . . . . . . . . . . . 36
3.2 Mathematical Formulation . . . . . . . . . . . . . . . . . . . . . . . . . . . 37
3.3 Variable Neighborhood Search for the LCMST Problem . . . . . . . . . . . 40
3.3.1 Initial Solution . . . . . . . . . . . . . . . . . . . . . . . . . . . . . 41
iii

3.3.2 Shaking Phase . . . . . . . . . . . . . . . . . . . . . . . . . . . . . . 42
3.3.3 Local Search Phase . . . . . . . . . . . . . . . . . . . . . . . . . . . 42
3.4 Computational Results . . . . . . . . . . . . . . . . . . . . . . . . . . . . . 44
3.4.1 Datasets . . . . . . . . . . . . . . . . . . . . . . . . . . . . . . . . . 44
3.4.2 Results . . . . . . . . . . . . . . . . . . . . . . . . . . . . . . . . . . 46
3.5 Conclusion . . . . . . . . . . . . . . . . . . . . . . . . . . . . . . . . . . . . 46
4 The Generalized Covering Salesman Problem 49
4.1 Introduction . . . . . . . . . . . . . . . . . . . . . . . . . . . . . . . . . . . 49
4.2 Problem Definition . . . . . . . . . . . . . . . . . . . . . . . . . . . . . . . 52
4.3 Local Search Algorithms . . . . . . . . . . . . . . . . . . . . . . . . . . . . 55
4.3.1 LS1 . . . . . . . . . . . . . . . . . . . . . . . . . . . . . . . . . . . 56
4.3.2 LS2 . . . . . . . . . . . . . . . . . . . . . . . . . . . . . . . . . . . 57
4.4 Computational Experiments . . . . . . . . . . . . . . . . . . . . . . . . . . 58
4.4.1 Test Problems . . . . . . . . . . . . . . . . . . . . . . . . . . . . . . 58
4.4.2 Comparison of LS1, LS2 and Current and Schilling’s Heuristic for
the CSP . . . . . . . . . . . . . . . . . . . . . . . . . . . . . . . . . 62
4.4.3 Comparison of LS1 and LS2 on GCSP Variants . . . . . . . . . . . 65
4.4.4 GCSP with Steiner Nodes . . . . . . . . . . . . . . . . . . . . . . . 65
4.4.5 Analyzing the Quality of LS2 on the Generalized TSP . . . . . . . . 69
4.5 Summary and Conclusions . . . . . . . . . . . . . . . . . . . . . . . . . . . 71
Bibliography 74
iv

Acknowledgments
First of all, I would like to express the deepest appreciation to my supervisor, Professor
Paolo Toth, for giving me the great opportunaty of working with him. Without his
guidance and persistent help this dissertation would not have been possible.
I would also to thank the professors of Operations Research group at the University of
Bologna. Special thanks to Professors: Silvano Martello, Daniele Vigo, Alberto Caprara,
Andrea Lodi and Roberto Baldacci.
Some parts of this work has been done where I was visiting the Business School,
University of Maryland (USA). Special thanks go to Professors Bruce Golden and S.
Raghavan for giving me the opportunity of working with them.
Many thanks to Drs: Manuel Iori, Enrico Malaguti, Andrea Tramontani, Laura Galli,
Valentina Cacchiani, Michele Monaci and Claudia D’Ambrosio.
Also I express my best appreciation to PhD students, Victor Vera Valdes and Felipe
Navarro, who helped me so much during the first days of my arrival in Bologna.
Finally, special thanks to my wife, Zahra Naji-Azimi. Without her I was not able to
reach this step. Words cannot adequately express my gratitude.
Bologna, March 15, 2010
Majid Salari
v

List of Figures
3.1 An example illustrating the selection of labels for the initial connected
subgraph. . . . . . . . . . . . . . . . . . . . . . . . . . . . . . . . . . . . . 43
3.2 An example for the swap of used and unused labels. . . . . . . . . . . . . 44
4.1 An example of decreasing the tour length by increasing the number of
nodes in Rat99 (NC=7). . . . . . . . . . . . . . . . . . . . . . . . . . . . . 64
4.2 An example of decreasing the tour length by increasing the number of
nodes in KroA200 (NC=7). . . . . . . . . . . . . . . . . . . . . . . . . . . 64
vi

List of Tables
1.1 Computational results on the “classical” 16 benchmark instances starting from
the solutions by Fu et al. [31, 32]. CPU times are expressed in seconds. . . . . . 13
1.2 Computational results on the “classical” 16 benchmark instances starting from
the best available solutions. CPU times are expressed in seconds. . . . . . . . . 14
1.3 Computational results on the 8 large scale benchmark instances starting from
the solutions by Derigs and Reuter [21]. CPU times are expressed in seconds. . . 15
1.4 Computational results on the “classical” 16 benchmark instances starting from
“bad initial solutions”. CPU times are expressed in seconds. . . . . . . . . . . 17
1.5 Current best known solution costs for the tested OVRP benchmark instances. . 18
2.1 Comparison of different solution procedures for the CmRSP problem on small
instances (Class A). . . . . . . . . . . . . . . . . . . . . . . . . . . . . . . . 33
2.2 Comparison of different solution procedures for the CmRSP problem on small
instances (Class B). . . . . . . . . . . . . . . . . . . . . . . . . . . . . . . . 34
2.3 Comparison of different solution procedures for the CmRSP problem on large
datasets. . . . . . . . . . . . . . . . . . . . . . . . . . . . . . . . . . . . . . 35
3.1 VNS, GA, LS1, and LS2 for the LCMST problem on small datasets. . . . . . . 47
3.2 VNS, GA, LS1, and LS2 for the LCMST problem on medium-sized datasets. . 47
3.3 VNS, GA, LS1, and LS2 for the LCMST problem on large datasets. . . . . . . 48
4.1 Parameters for LS1. . . . . . . . . . . . . . . . . . . . . . . . . . . . . . . . 62
4.2 Parameters for LS2. . . . . . . . . . . . . . . . . . . . . . . . . . . . . . . . 62
4.3 Comparison of Current and Schilling’s method with LS1 and LS2 for CSP. . . 63
4.4 Comparison of LS1 and LS2 on Binary GCSP. . . . . . . . . . . . . . . . . . 66
4.5 Comparison of LS1 and LS2 on Integer GCSP without overnight. . . . . . . . 67
4.6 Comparison of LS1 and LS2 on Integer GCSP with overnight. . . . . . . . . . 68
4.7 Comparison of LS1 and LS2 on Steiner CSP. . . . . . . . . . . . . . . . . . . 70
4.8 Comparison of computing times of GTSP methods. . . . . . . . . . . . . . . 71
vii

4.9 Comparison of LS2 against 8 other heuristics on benchmark GTSP instances
in the literature. . . . . . . . . . . . . . . . . . . . . . . . . . . . . . . . . . 72
viii

Preface
This thesis contains most of my works during my Ph.D. study at the Operations Research
Group, University of Bologna, and serves as documentation of my work done during the
years from 2007 until 2010. This work has been partially supported by MIUR (Ministero
Istruzione, Universita e Ricerca), Italy. This support is gratefully acknowledged.
Combinatorial Optimization is a branch of optimization that deals with the problems
where the set of feasible solutions is discrete. Routing problem is a well studied branch
of Combinatorial Optimization that concerns the process of deciding the best way of
visiting the nodes (customers) in a network. Routing problems appear in many real world
applications including: Transportation, Telephone or Electronic data Networks.
During the years, many solution procedures have been introduced for the solution of
different Routing problems. Some of them are based on exact approaches to solve the
problems to optimality and some others are based on heuristic or metaheuristic search
to find optimal or near optimal solutions. There is also a less studied method, which
combines both heuristic and exact approaches to face different problems including those
in the Combinatorial Optimization area.
The aim of this dissertation is to develop some solution procedures based on the combi-
nation of heuristic and Integer Linear Programming (ILP) techniques for some important
problems in Routing Optimization. In this approach, given an initial feasible solution
to be possibly improved, the method follows a destruct-and-repair paradigm, where the
given solution is randomly destroyed (i.e., customers are removed in a random way) and
repaired by solving an ILP model, in an attempt to find a new improved solution.
This thesis contains four chapters. There are two other chapters and since the works
of these chapters are in progress, we have not reported them in this dissertation. The
results of this thesis have been presented in five research papers submitted or published
in International journals.
In the first chapter we focus on the Open Vehicle Routing Problem. This problem is a
variant of the “classical” (Capacitated and Distance Constrained) Vehicle Routing Prob-
lem (VRP) in which the vehicles are not required to return to the depot after completing
their service. We present an ILP-based improvement procedure for the OVRP based on
ILP techniques.
In Chapter 2 we apply the latter mentioned ILP-based improvement technique to the
solution of the Capacitated m-Ring Star Problem. We have also used this approach for the
solution of the Covering Salesman Problem and of the Median Cycle Problem successfully,
but, since they are Works-in-Progress, the results have not been reported in this thesis.
ix
Chapter 3 concerns the Label Constrained Minimum Labelling Spanning Tree Problem
that occurs in Telephone Networks and is motivated from applications in the communi-
cations sector.
Finally in Chapter 4 we study the Covering Salesman Problem and some of its gener-
alizations occurring in the routing of Transportation Networks.
x

Chapter 1
An ILP Improvement Procedure for
the Open Vehicle Routing Problem
1.1 Introduction
In this chapter1 we address the Open Vehicle Routing Problem (OVRP), a variant of the
“classical” (Capacitated and Distance Constrained) Vehicle Routing Problem (VRP) in
which the vehicles are not required to return to the depot after completing their service.
OVRP can be formally stated as follows. We are given a central depot and a set of n
customers, which are associated with the nodes of a complete undirected graph G = (V,E)
(where V = {0, 1, . . . , n}, node 0 represents the depot and V \{0} is the set of customers).
Each edge e ∈ E has an associated finite cost ce ≥ 0 and each customer v ∈ V \ {0} has
a demand qv > 0 (with q0 = 0). A fleet of m identical vehicles is located at the depot,
each one with a fixed cost F , a capacity Q and a total distance-traveled (duration) limit D.
The customers must be served by at most m Hamiltonian paths (open routes), each path
associated with one vehicle, starting at the depot and ending at one of the customers.
Each route must have a duration (computed as the sum of the edge costs in the route)
not exceeding the given limit D of the vehicles, and can visit a subset S of customers
whose total demand∑
v∈S qv does not exceed the given capacity Q. The problem consists
of finding a feasible solution covering (i.e., visiting) exactly once all the customers and
having a minimum overall cost, computed as the sum of the traveled edge costs plus the
fixed costs associated with the vehicles used to serve the customers. OVRP is known
to be NP-hard in the strong sense, as it generalizes the Bin Packing Problem and the
Hamiltonian Path Problem.
1The results of this chapter appear in: Salari M., Toth P., and Tramontani A.: “An ILP improvementprocedure for the open vehicle routing problem”. Computers & Operations Research, To appear [68].
1

In this paper we present a heuristic improvement procedure for OVRP based on Integer
Linear Programming (ILP) techniques. Given an initial feasible solution to be possibly
improved, the procedure iteratively performs the following steps: (a) randomly select sev-
eral customers from the current solution, and build the restricted solution obtained from
the current one by extracting (i.e., short-cutting) the selected customers; (b) reallocate
the extracted customers to the restricted solution by solving an ILP problem, in the at-
tempt of finding a new improved feasible solution. This method has been proposed by De
Franceschi et al. [20] and deeply investigated by Toth and Tramontani [77] in the context
of the classical VRP. The method follows a destruct-and-repair paradigm, where the cur-
rent solution is randomly destroyed (i.e., customers are removed in a random way) and
repaired by following ILP techniques. Hence, the overall procedure can be considered as
a general framework which could be extended to cover other variants of Vehicle Routing
Problems.
The notion of using ILP techniques to improve a feasible solution of a combinatorial
optimization problem has emerged in several papers in the last few years. Addressing the
split delivery VRP, Archetti et al. [2] developed a heuristic algorithm that integrates tabu
search with ILP by solving integer programs to explore promising parts of the solution
space identified by a tabu search heuristic. A similar approach has been presented by
Archetti et al. [1] for an inventory routing problem. Hewitt et al. [37] proposed to solve
the capacitated fixed charge network flow problem by combining exact and heuristic ap-
proaches. In this case as well a key ingredient of the method is to use ILP to improve
feasible solutions found during the search. Finally, the idea of exploiting ILP to explore
promising neighborhoods of feasible solutions has been also investigated in the context of
general purpose integer programs; see, e.g., Fischetti and Lodi [26] and Danna et al. [18].
The methods presented in [18] and in [26] are currently embedded in the commercial
mixed integer programming solver Cplex [39].
The chapter is organized as follows. Section 1.2 recalls the main works proposed in the
literature for OVRP. In Section 1.3 we describe a neighborhood for OVRP and the ILP
model which allows to implicitly define and explore the presented neighborhood. The im-
plementation of the heuristic improvement procedure is given in Section 1.4, while Section
1.5 reports the computational experiments on benchmark capacitated OVRP instances
from the literature (with/without distance constraints), comparing the presented method
with the most effective metaheuristic techniques proposed for OVRP. Some conclusions
are finally drawn in Section 1.6.
2

1.2 Literature review
The classical VRP is a fundamental combinatorial optimization problem which has been
widely studied in the literature (see, e.g., Toth and Vigo [78] and Cordeau et al. [15]).
At first glance, having open routes instead of closed ones looks like a minor change, and
in fact OVRP can be also formulated as a VRP on a directed graph, by fixing to 0 the
cost of each arc entering the depot. However, if the undirected case is considered, the
open version turns out to be more general than the closed one. Indeed, as shown by
Letchford et al. [45], any closed VRP on n customers in a complete undirected graph
can be transformed into an OVRP on n customers, but there is no transformation in the
reverse direction. Further, there are many practical applications in which OVRP naturally
arises. This happens, of course, when a company does not own a vehicle fleet, and hence
customers are served by hired vehicles which are not required to come back to the depot
(see, e.g., Tarantilis et al. [75]). But the open model also arises in pick-up and delivery
applications, where each vehicle starts at the depot, delivers to a set of customers and
then it is required to visit the same customers in reverse order, picking up items that have
to be backhauled to the depot. An application of this type is described in Schrage [70].
Further areas of application, involving the planning of train services and of school bus
routes, are reported by Fu et al. [31].
OVRP has recently received an increasing attention in the literature. Exact branch-
and-cut and branch-cut-and-price approaches have been proposed, respectively, by Letch-
ford et al. [45] and Pessoa et al. [56], addressing the capacitated problem with no distance
constraints and no empty routes allowed (i.e., D = ∞ and exactly m vehicles must be
used). Heuristic and metaheuristic algorithms usually take into account both capacity
and distance constraints, and consider the number of routes as a decision variable. In
particular, an unlimited number of vehicles is supposed to be available (i.e., m =∞) and
the objective function is generally to minimize the number of used vehicles first and the
traveling cost second, assuming that the fixed cost of an additional vehicle always exceeds
any traveling cost that could be saved by its use (i.e., considering F =∞). However, sev-
eral authors address as well the variant in which there are no fixed costs associated with
the vehicles (i.e., F = 0) and hence the objective function is to minimize the total traveling
cost with no attention to the number of used vehicles (see, e.g., Tarantilis et al. [75]). Con-
sidering capacity constraints only (i.e., taking D = ∞), Sariklis and Powell [69] propose
a two-phase heuristic which first assigns customers to clusters and then builds a Hamil-
tonian path for each cluster, Tarantilis et al. [73] describe a population-based heuristic,
while Tarantilis et al. [74, 75] present threshold accepting metaheuristics. Taking into
account both capacity and distance constraints, Brandao [7], Fu et al. [31,32] and Derigs
3

and Reuter [21] propose tabu search heuristics, Li et al. [46] describe a record-to-record
travel heuristic, Pisinger and Ropke [58] present an adaptive large neighborhood search
heuristic which follows a destruct-and-repair paradigm, while Fleszar et al. [30] propose
a variable neighborhood search heuristic.
1.3 Reallocation Model
Let z be a feasible solution of the OVRP defined on G. For any given node subset
F ⊂ V \ {0}, we define z(F) as the restricted solution obtained from z by extracting (i.e.,
by short-cutting) all the nodes v ∈ F . LetR be the set of routes in the restricted solution,
I = I(z,F) the set of all the edges in z(F), and S = S(F) the set of all the sequences
which can be obtained through the recombination of nodes in F (i.e., the set of all the
elementary paths in F). Each edge i ∈ I is viewed as a potential insertion point which
can allocate one or more nodes in F through at most one sequence s ∈ S. We say that
the insertion point i = (a, b) ∈ I allocates the nodes {vj ∈ F : j = 1, . . . , h} through the
sequence s = (v1, v2, . . . , vh) ∈ S, if the edge (a, b) in the restricted solution is replaced
by the edges (a, v1), (v1, v2), . . . , (vh, b) in the new feasible solution. Since the restricted
routes, as well as the final ones, are open paths starting at the depot, in addition to the
edges of the restricted solution we also consider the insertion points (called appending
insertion points in the following) i = (pr, 0), where pr denotes the last customer visited by
route r ∈ R, which allow to append any sequence to the last customer of any restricted
route. Further, empty routes in the restricted solution are associated with insertion points
(0, 0).
For each sequence s ∈ S, c(s) and q(s) denote, respectively, the cost of the elementary
path corresponding to s and the sum of the demands of the nodes in s. For each insertion
point i = (a, b) ∈ I and for each sequence s = (v1, v2, . . . , vh) ∈ S, γsi denotes the
extra-cost (i.e., the extra-distance) for assigning sequence s to insertion point i in its best
possible orientation (i.e., γsi := c(s) − cab + min{cav1 + cvhb, cavh+ cv1b}). Note that, for
the appending insertion points i = (pr, 0), γsi is computed as c(s) + min{cprv1 , cprvh}. The
extra-cost for assigning the sequence s to the insertion point i = (0, 0) associated with an
empty route is simply c(s) + min{c0v1 , c0vh}. For each route r ∈ R, I(r) denotes the set
of insertion points associated with r, while q(r) and c(r) denote, respectively, the total
demand and the total distance computed for route r, still in the restricted solution.
For each i ∈ I, Si ⊆ S denotes a sequence subset containing the sequences which can
be allocated to the specific insertion point i. The definition of Si will be discussed later
in this section. Then, a neighborhood of the given solution z can be formulated (and
explored) by solving an ILP problem (denoted as the Reallocation Model) based on the
4

decision variables
xsi =
{1 if sequence s ∈ Si is allocated to insertion point i ∈ I,0 otherwise
(1.1)
which reads as follows: ∑r∈R
c(r) + min∑i∈I
∑s∈Si
γsixsi (1.2)
subject to: ∑i∈I
∑s∈Si(v)
xsi = 1 v ∈ F , (1.3)
∑s∈Si
xsi ≤ 1 i ∈ I, (1.4)∑i∈I(r)
∑s∈Si
q(s)xsi ≤ Q− q(r) r ∈ R, (1.5)
∑i∈I(r)
∑s∈Si
γsixsi ≤ D − c(r) r ∈ R, (1.6)
xsi ∈ {0, 1} i ∈ I, s ∈ Si, (1.7)
where, for any i ∈ I and v ∈ F , Si(v) ⊆ Si denotes the set of sequences covering
customer v which can be allocated to insertion point i. The objective function (1.2),
to be minimized, gives the traveling cost of the final OVRP solution. Constraints (1.3)
impose that each extracted node belongs to exactly one of the selected sequences, i.e.,
that it is covered exactly once in the final solution. Constraints (1.4) avoid to allocate
two or more sequences to the same insertion point. Finally, constraints (1.5) and (1.6)
impose that each route in the final solution fulfills the capacity and distance restrictions,
respectively. Note that, if there is a non-null fixed cost F associated with the vehicles,
it can be taken into account by simply adding F to the cost of the edges incident at the
depot node.
The Reallocation Model (1.2)–(1.7) defines a neighborhood of a given solution z which
depends on the extracted nodes F and on the subsets Si (i ∈ I). In particular, for
any given F , the choice of Si is a key factor in order to allow an effective exploration
of the solution space in the neighborhood of the given solution. The subsets Si are
built by following a column generation approach: we initialize the Linear Programming
(LP) relaxation of the Reallocation Model (LP-RM) with a subsets of variables with
small insertion cost, and afterwards we iteratively solve the column generation problem
5

associated with LP-RM, adding other variables with small reduced cost. The overall
procedure for building the subsets Si can be described as follows.
1. (Initialization) For each insertion point i = (ai, bi) ∈ I, initialize subset Si with
the basic sequence extracted from i (i.e., the, possibly empty, sequence of nodes
connecting node ai and bi in the given solution z) plus the feasible singleton sequence
with the minimum insertion cost (i.e., the sequence (v), with v ∈ F , with the
minimum extra-cost among all the singleton sequences which can be allocated to
i without violating the capacity and distance restrictions for the restricted route
containing i). Initialize LP-RM with the initial set of variables corresponding to the
current subsets Si, and solve LP-RM.
2. (Column generation) For each insertion point i ∈ I, solve the column generation
problem associated with i, adding to Si all the sequences s corresponding to ele-
mentary paths in F , whose associated variables xsi have a reduced cost rcsi under
a given threshold RCmax (i.e., variables xsi such that rcsi ≤ RCmax). If at least
one sequence/variable has been added, solve the new LP-RM and repeat step 2.
Otherwise terminate.
For any fixed insertion point i ∈ I, the column generation problem associated with i in
LP-RM is a Resource Constrained Elementary Shortest Path Problem (RCESPP), which
usually arises in the Set Partitioning formulation of the classical VRP (see, e.g., Feillet
et al. [24] and Righini and Salani [62]). Here, for each insertion point i ∈ I, we solve
the corresponding RCESPP through a simple greedy heuristic, with the aim of finding as
many variables with small reduced cost as possible. Hashing techniques are used to avoid
the generation of duplicated variables.
Note that each subset Si contains the basic sequence extracted from insertion point i,
and hence the current solution can always be obtained as a new feasible solution of the
Reallocation Model.
1.3.1 Column generation for the Reallocation Model
Let π1v , π
2i , π
3r and π4
r be the dual variables associated, respectively, with constraints
(1.3), (1.4), (1.5) and (1.6) in LP-RM, where v ∈ F , i ∈ I and r ∈ R, and denote with
π = (π1v , π
2i , π
3r , π
4r) the optimal dual solution of LP-RM. For any fixed i = (ai, bi) ∈ I,
consider the directed graph G(i, π) = (Vi, Ai), with Vi := {ai, bi} ∪ F and Ai := {(v, w) :
v ∈ Vi, w ∈ Vi}\{(ai, bi), (bi, ai)}. Associate with each arc a = (v, w) ∈ Ai, w 6= 0, a weight
θa equal to the cost of the corresponding edge e = (v, w) in the graph G, while set θa := 0
for each arc a = (v, 0) ∈ Ai, if 0 ∈ Vi. Associate with each arc a ∈ Ai a cost c′a = θa(1−π4ri
),
6

and associate with each node v ∈ F a weight qv and a cost q′v = −(π1v + qvπ
3ri
). Then,
let P = (VP , AP ) be an elementary path (ai, v1, . . . , vh, bi) connecting nodes ai and bi in
G(i, π), where VP := {v1, . . . , vh} ⊆ Vi and AP := {(ai, v1), . . . , (vh, bi)} ⊆ Ai. We say
that P is a feasible path if ∑v∈VP
qv ≤ Q− d(ri),
∑a∈AP
θa ≤ D − c(ri) + ci,
where ci denotes the cost of insertion point i = (ai, bi), while the cost of the path is
c′(P ) =∑a∈AP
c′a +∑v∈VP
q′v.
Any sequence s = (v1, . . . , vh) ∈ S is clearly associated with the elementary path
(ai, v1, . . . , vh, bi) in G(i, π). The reduced cost rcsi of variable xsi in LP-RM is defined by
rcsi := γsi −∑v∈VP
π1v − π2
i − q(s)π3ri− γsiπ4
ri
and can easily be rewritten as
rcsi := −π2i − ci(1− π4
ri) +
∑a∈AP
c′a +∑v∈VP
q′v.
Hence, the following proposition holds:
Proposition 1 For any i = (ai, bi) ∈ I, the column generation problem associated with i
in LP-RM is the problem of finding an elementary feasible path P from ai to bi in G(i, π),
with cost c′(P ) < π2i + ci(1− π4
ri).
As described above, the column generation problem for LP-RM associated with any inser-
tion point i ∈ I is a Resource Constrained Elementary Shortest Path Problem (RCESPP)
defined on graph G(i, π), whose size strictly depends on |F|. The orientation of G(i, π) is
required only when the considered i = (ai, bi) ∈ I is an appending insertion point (i.e., bi
is the depot node). Even in this case, the column generation problem could be addressed
on a mixed graph, where only the edges incident at the depot are replaced by directed
arcs (of different cost and weight) entering and leaving the depot. In the general case,
G(i, π) contains negative cycles (i.e., cycles in which the sum of the costs c′a associated
with the arcs and the costs q′v associated with the nodes is negative): indeed, while dual
variables π2i , π
3r , π
4r are non positive, dual variables π1
v are free and usually assume positive
values. Positive values of variables π1v can lead to negative node costs q′v and to negative
7

cycles in graph G(i, π). Therefore, the column generation problem in LP-RM is strongly
NP-hard.
In order to find a promising set of variables for the Reallocation Model in a short
computing time, we solve the RCESPP associated with each insertion point through a
simple heuristic. We say that a node v ∈ F is feasible for i ∈ I if the singleton sequence
(v) can be allocated to i without violating the capacity and distance restrictions on the
restricted route ri. For any given insertion point i = (ai, bi) ∈ I, we first build a reduced
graph G(i, π), obtained by considering only nodes ai, bi and the nf feasible nodes of
F with smallest insertion cost (i.e., the nf feasible nodes vk ∈ F , k = 1, . . . , nf , whose
associated singleton sequences (vk) have the smallest extra-cost for i). At each iteration of
the column generation step described in Section 1.3, nf is uniformly randomly generated
in [nfmin, nfmax]. Then, on the reduced graph G(i, π), we apply the following simple
heuristic:
1. Find an initial feasible path P = (ai, v, bi), in G(i, π).
2. Evaluate all the 1-1 feasible exchanges between each node w ∈ Vi \ VP and each
node v ∈ VP , and select the best one (with respect to the cost of the corresponding
path); if this exchange leads to an improvement, perform it and repeat step 2.
3. Evaluate all the feasible insertions of each node w ∈ Vi \VP in each arc (v1, v2) ∈ APand select the best one; if no feasible insertion exists, terminate; otherwise, force
such an insertion even if it leads to a worse path and repeat step 2.
Whenever a new path in G(i, π) is generated , the corresponding sequence is added to
Si if the reduced cost of xsi is smaller than a given threshold RCmax.
1.4 Heuristic Improvement Procedure
The Reallocation Model described in the previous section allows for exploring a neigh-
borhood of a given feasible solution, depending on the choice of the extracted customers
in F . We propose a heuristic improvement procedure for OVRP, based on model (1.2)–
(1.7), which iteratively explores different neighborhoods of the current solution. Given an
initial feasible solution z0 for OVRP (taken from the literature or found by any heuristic
method), the procedure works as follows.
1. (Initialization) Set kt := 0 and kp := 0. Take z0 as the incumbent solution and
initialize the current solution zc as zc := z0.
2. (Node selection) Build set F by selecting each customer with a probability p.
8

3. (Node extraction) Extract the nodes selected in the previous step from the cur-
rent solution zc and construct the corresponding restricted OVRP solution zc(F),
obtained by short-cutting the extracted nodes.
4. (Reallocation) Define the subsets Si (i ∈ I(zc,F)) as described in Section 1.3. Build
the corresponding Reallocation Model (1.2)–(1.7) and solve the model by using a
general-purpose ILP solver. Once an optimal ILP solution has been found, construct
the corresponding new OVRP solution and possibly update zc and z0.
5. (Termination) Set kt := kt+ 1. If kt = KTmax, terminate.
6. (Perturbation) If zc has been improved in the last iteration, set kp := 0; otherwise
set kp := kp+ 1. If kp = KPmax, “perturb” the current solution zc and set kp := 0.
In any case, repeat step 2.
The procedure performs KTmax iterations and at each iteration explores a randomly
generated neighborhood of the current solution zc. However, if zc is not improved for
KPmax consecutive iterations, we introduce a random perturbation (see Step 6) in order
to move to a different area of the solution space, so as to enforce the diversification of
the search. In particular, when performing a Perturbation Step, we randomly extract
np customers from zc (with np uniformly randomly chosen in [npmin, npmax] and with
each customer having the same probability to be extracted), and reinsert each extracted
customer, in turn, in its best feasible position. If a customer cannot be inserted in any
currently non-empty route (due to the capacity and/or distance restrictions), a new route
is created to allocate the customer. In general, when performing the Perturbation Step,
several customers cannot be inserted in the non-empty routes of the current solution, and
hence the new perturbed solution can use more vehicles than the current one.
1.5 Computational Results
The performance of the Heuristic Improvement Procedure (HIP) described in the previous
sections was evaluated on the 16 benchmark instances usually addressed in the literature,
taken from Christofides et al. [12] (instances C1–C14) and from Fisher [29] (instances
F11–F12), and on the 8 large scale benchmark instances proposed by Li et al. [46], and
also addressed by Derigs and Reuter [21] (instances O1–O8). The number of customers
of C1–C14 and F11–F12 ranges from 50 to 199. C1–C5, C11–C12 and F11–F12 have only
capacity constraints, while C6–C10 and C13–C14 are the same instances as C1–C5 and
C11–C12, respectively, but with both capacity and distance constraints. Instances O1–O8
have no distance restrictions and a number of customers varying from 200 to 480. As
9
usual, for the problems with distance constraints, the route duration limit D is taken as
the original value for the classical VRP multiplied by 0.9.
HIP needs an initial solution to be given, which in principle could be computed through
any available constructive heuristic algorithm. We decided to run HIP starting from an
extremely-good feasible solution available from the literature (in several cases, the best
known solution reported in the literature), with the aim of attempting to improve it (this
is of course impossible if the initial solution is provably optimal, as it is the case for some
of them). In particular, we considered as initial solutions the ones obtained by Fu et
al. [31, 32], Pisinger and Ropke [58], Derigs and Reuter [21] and Fleszar et al. [30].
HIP has been tested on a Pentium IV 3.4 GHz with 1 GByte RAM, running under
Microsoft Windows XP Operative System, and has been coded in C++ with Microsoft
Visual C++ 6.0 compiler. The ILP solver used in the experiments is ILOG Cplex 10.0
[39]. HIP setting depends on the parameters RCmax, p, nfmin, nfmax, npmin, npmax,
and on the number of iterations KPmax and KTmax. Although these parameters could be
tuned considering the edge costs and the particular characteristics of each tested instance,
we preferred to run all the experiments with a fixed set of parameters: RCmax = 1,
p = 0.5 (i.e., 50% of the customers are selected on average), nfmin = 15, nfmax = 25,
npmin = 15, npmax = 25, KPmax = 50 and KTmax = 5, 000 (i.e., we perform globally
5,000 iterations, and the current solution is perturbed if it cannot be improved for 50
consecutive iterations). Further, since several authors address the problem considering as
objective function the minimization of the number of vehicles first and of the traveling cost
second (i.e., assuming F = ∞), while other authors considered as objective function the
minimization of the traveling cost (i.e., F = 0), we decided to run HIP without allowing
to change the number of vehicles used in the initial solution. However, as stated in Section
1.4, the Perturbation Step often requires additional routes to be created (to preserve the
feasibility of the solution). In such cases, we add a small penalty θ to the cost of the edges
incident at the depot, in order to force HIP to “recover” the solution in the following
iterations. After some preliminary tests, we decided to fix θ = 12 for the considered
instances. Finally, HIP is a randomized algorithm and hence the computational results
may depend on the randomization. For each tested instance (and each initial solution),
we considered 5 runs of the algorithm corresponding to 5 different seeds for generating
the random numbers.
The computational results are reported in Tables 1.1–1.3. All the CPU times are
expressed in seconds, and all the solution costs have been computed in double precision.
Table 1.1 reports the computational results on the 16 instances C1–C14 and F11–F12
obtained by starting from the solutions provided by Fu, Eglese and Li and obtained
through the algorithm proposed in [31]. In some cases, several solutions are provided for
10

the same instance, obtained by using slightly different versions of their algorithm, with
the same number of routes and different traveling cost. Among the different solutions
for the same instance, we considered as initial solution for HIP the best one provided.
For instances C1 and F11, all the solutions available from [31, 32] are provably optimal
(see, e.g., Letchford et al. [45]) and cannot be further improved. Thus, these instances
were not considered in this set of experiments. The upper part of the table reports the
solutions found by HIP. The first column gives the instance name (Pb). Columns 2–3
report the number of vehicles used in the initial solution (m) and the cost of the best
known solution using the same number of vehicles (P.best). Columns 4–5 report the cost
of the initial solution (cost) and the corresponding percentage deviation w.r.t. the best
known value (%dev), computed as 100*(cost-P.best)/P.best. Then, for each of the 5 runs
of the algorithm, we report the final solution cost provided by HIP and the corresponding
percentage deviation (again computed w.r.t. the best known value). When HIP was not
able to improve on the initial solution, we mark with a “—” the final solution cost. Finally,
we report the best, the worst and the average result out of the 5 different runs. Final
solution costs equal to the previously best known ones are underlined, new best solutions
are in bold face, while provably optimal solutions, taken from Letchford et al. [45], are
marked with an ∗. The lower part of the table gives the computing times. First, we report
the overall CPU time of the algorithm corresponding to the initial solution, obtained on
a Pentium IV 3 GHz. These times have been taken from [32]. However, the cost of the
initial solution for instance C8 is better than the ones reported in [32], and hence for this
initial solution we did not report the corresponding computing time. Then, for each run
of the algorithm, we report the overall computing time required to perform all the 5,000
iterations (t.time) and the CPU time required to reach the final solution (b.time). For a
“fair” calculation of the average values, when HIP was not able to improve on the initial
solution we considered b.time equal to the overall computing time. Finally, the last two
columns give the average CPU times (i.e., average t.time and average b.time) out of the
5 different runs.
Table 1.2 reports the computational results on the same instances by starting from
the best available solutions among the ones obtained by Fu et al. [31, 32], Pisinger and
Ropke [58], Derigs and Reuter [21] and Fleszar et al. [30]. The table has the same
structure as Table 1.1, but column 2 in the lower part of the table reports the source of
the initial solution used in the experiments. For instances C5, C7, C9, C13 and C14, the
best available solutions for the case F = ∞ and the case F = 0 are different. In such
cases, we considered both the solutions as initial solutions for HIP. For instances C1, C3,
C12 and F11, all the solutions available from [21], [30] and [58] are provably optimal and
hence these instances were not considered in this set of experiments.
11
Finally, Table 1.3 reports the computational results on the 8 large scale instances O1–
O8 by starting from the solutions provided by Derigs and Reuter [21]. The table has the
same structure as Table 1.1, but the CPU time related to the initial solution (column 2
in the lower part of the table) was obtained on a Pentium IV 2.8 GHz.
The tables show that HIP is able to improve even extremely-good quality solutions,
obtained by some of the most effective metaheuristic techniques proposed for OVRP. It is
worth noting that the solutions and the CPU times provided by Fu et al. [31,32] and re-
ported in Table 1.1 are the best ones from among 20 runs of the corresponding randomized
algorithm with different seeds. Hence, taking into account the different performance of the
processors used for testing the different algorithms, the overall computing time required
by HIP is comparable with the others reported in the tables, and in several cases the final
improved solution is found very quickly. Our test-bed concerns in practice 35 different,
non provably optimal, initial solutions which could be possibly improved, corresponding
to 22 different instances. By considering the best result from among the 5 different runs
executed for each of these 35 initial solutions, HIP improves on the initial solution in 22
cases. For these cases, HIP reaches 6 times the previously best known solution (provably
optimal in 2 cases), while finds 12 times a new best solution. Considering the 13 initial
solutions which HIP does not improve, it is worth noting that all these solutions are the
best known ones in the literature (for the case F =∞ or F = 0). Looking at the different
runs executed for each initial solution, we can note that in some cases the results depend
on the seed used for the random generator. However, the method is overall quite consis-
tent since, by considering all the tested initial solutions, the average computing time and
the average final percentage deviation are only slightly affected by the choice of the seed.
In order to look for possible better solutions, we performed some additional experi-
ments. In particular, after the first 5,000 iterations, we ran HIP for 2,000 more iterations
with a slightly different parameter setting. Starting from the solutions provided by Fu
et al. [32], for instance C5 with 17 vehicles, after 5220 iterations and 237.4 seconds HIP
found a solution of cost 868.44 that corresponds to a further improvement on the previous
best known solution. Finally, still starting from the solutions by Fu et al. [32], we ran
HIP with a different tuning of parameter p, to investigate how the neighborhood size
affects the overall performance of the method, both in terms of quality of the solutions
found and of CPU time. Let zavg(p) be the average final solution cost obtained on the 14
instances C2–C14 and F12 with p = p, and let ttimeavg(p) be the corresponding average
CPU time in seconds. With p = 0.3, p = 0.5 and p = 0.7 we obtained the following results:
zavg(0.3) = 684.55 and ttimeavg(0.3) = 71.9, zavg(0.5) = 681.94 and ttimeavg(0.5) = 262.8,
zavg(0.7) = 683.32 and ttimeavg(0.7) = 460.0. As expected, the average CPU time consis-
tently increases with the number of extracted customers, while the best solution costs are
12

Tab
le1.
1:C
ompu
tati
onal
resu
lts
onth
e“c
lass
ical
”16
benc
hmar
kin
stan
ces
star
ting
from
the
solu
tion
sby
Fuet
al.
[31,
32].
CP
Uti
mes
are
expr
esse
din
seco
nds. In
itia
lR
un
1R
un
2R
un
3R
un
4R
un
5B
est
Wors
tA
ver
age
Pb
mP
.bes
tco
st%
dev
cost
%d
evco
st%
dev
cost
%d
evco
st%
dev
cost
%d
evco
st%
dev
cost
%d
evco
st%
dev
C2
10
567.1
4567.1
40.0
0—
0.0
0—
0.0
0—
0.0
0—
0.0
0—
0.0
0567.1
40.0
0567.1
40.0
0567.1
40.0
0C
38∗639.7
4641.8
80.3
3∗639.7
40.0
0640.4
20.1
1640.4
20.1
1640.4
20.1
1640.4
20.1
1∗639.7
40.0
0640.4
20.1
1640.2
80.0
8C
412
733.1
3738.9
40.7
9733.1
30.0
0733.1
30.0
0733.1
30.0
0733.1
30.0
0733.1
30.0
0733.1
30.0
0733.1
30.0
0733.1
30.0
0C
517
869.2
5878.9
51.1
2868.8
1-0
.05
868.8
1-0
.05
868.8
1-0
.05
868.8
1-0
.05
868.8
1-0
.05
868.8
1-0
.05
868.8
1-0
.05
868.8
1-0
.05
C6
6412.9
6412.9
60.0
0—
0.0
0—
0.0
0—
0.0
0—
0.0
0—
0.0
0412.9
60.0
0412.9
60.0
0412.9
60.0
0C
711
568.4
9568.4
90.0
0—
0.0
0—
0.0
0—
0.0
0—
0.0
0—
0.0
0568.4
90.0
0568.4
90.0
0568.4
90.0
0C
89
644.6
3646.3
10.2
6644.6
30.0
0644.6
30.0
0644.6
30.0
0644.6
30.0
0644.6
30.0
0644.6
30.0
0644.6
30.0
0644.6
30.0
0C
914
756.1
4761.2
80.6
8756.1
40.0
0756.1
40.0
0756.3
80.0
3756.3
80.0
3756.1
40.0
0756.1
40.0
0756.3
80.0
3756.2
40.0
1C
10
17
875.0
7903.1
03.2
0878.5
40.4
0879.1
30.4
6877.4
70.2
7880.2
50.5
9879.6
80.5
3877.4
70.2
7880.2
50.5
9879.0
10.4
5C
11
7682.1
2717.1
55.1
4683.6
40.2
2685.2
00.4
5685.2
00.4
5682.8
30.1
0682.8
30.1
0682.8
30.1
0685.2
00.4
5683.9
40.2
7C
12
10∗534.2
4534.7
10.0
9∗534.2
40.0
0∗534.2
40.0
0∗534.2
40.0
0∗534.2
40.0
0∗534.2
40.0
0∗534.2
40.0
0∗534.2
40.0
0∗534.2
40.0
0C
13
12
896.5
0917.9
02.3
9894.1
9-0
.26
897.3
70.1
0896.6
60.0
2897.3
70.1
0896.1
4-0
.04
894.1
9-0
.26
897.3
70.1
0896.3
5-0
.02
C14
11
591.8
7600.6
61.4
9591.8
70.0
0591.8
70.0
0591.8
70.0
0591.8
70.0
0591.8
70.0
0591.8
70.0
0591.8
70.0
0591.8
70.0
0F
12
7769.6
6777.0
70.9
6769.5
5-0
.01
770.3
80.0
9769.5
5-0
.01
770.3
80.0
9770.3
80.0
9769.5
5-0
.01
770.3
80.0
9770.0
50.0
5
avg.
1.1
80.0
20.0
80.0
60.0
70.0
50.0
00.0
90.0
6
Pb
t.ti
me
t.ti
me
b.t
ime
t.ti
me
b.t
ime
t.ti
me
b.t
ime
t.ti
me
b.t
ime
t.ti
me
b.t
ime
t.ti
me
b.t
ime
C2
7.8
84.2
84
.286.5
86
.580.2
80
.281.9
81
.989.6
89
.684.5
84.5
C3
23.2
119.9
106.0
110.9
74.7
117.9
56.8
139.9
132.0
118.8
88.3
121.5
91.6
C4
6.8
156.6
21.2
157.8
0.6
154.7
0.4
198.1
0.8
164.1
0.7
166.3
4.7
C5
61.9
220.3
10.3
220.0
11.6
228.5
32.7
277.8
12.9
225.5
12.5
234.4
16.0
C6
0.6
45.1
45
.143.2
43
.249.0
49
.044.7
44
.742.2
42
.244.8
44.8
C7
6.0
83.1
83
.187.7
87
.783.2
83
.279.8
79
.879.5
79
.582.7
82.7
C8
136.2
0.1
135.9
0.1
144.9
3.2
177.7
2.6
144.7
0.1
147.9
1.2
C9
46.6
255.5
102.7
265.5
7.9
247.7
195.7
312.1
299.6
259.2
18.3
268.0
124.8
C10
51.9
460.2
323.9
477.7
35.9
513.0
453.1
505.9
474.5
497.8
366.5
490.9
330.8
C11
23.1
198.8
165.8
199.8
40.4
229.8
225.7
329.6
204.2
201.4
200.0
231.9
167.2
C12
4.2
94.0
1.6
98.2
73.2
99.1
89.5
106.2
16.6
107.8
92.1
101.1
54.6
C13
82.1
1165.3
475.0
1004.9
201.4
1180.5
685.0
1146.5
725.2
1396.5
1230.9
1178.7
663.5
C14
2.5
354.7
293.8
339.2
88.6
321.3
33.7
366.6
337.3
453.9
435.8
367.1
237.8
F12
28.4
148.2
77.8
158.0
74.9
154.8
70.7
169.3
30.9
168.2
67.5
159.7
64.4
avg.
24.7
251.6
127.9
241.8
59.1
257.5
147.1
281.2
174.5
282.1
194.6
262.8
140.6
13

Tab
le1.
2:C
ompu
tati
onal
resu
lts
onth
e“c
lass
ical
”16
benc
hmar
kin
stan
ces
star
ting
from
the
best
avai
labl
eso
luti
ons.
CP
Uti
mes
are
expr
esse
din
seco
nds.
Init
ial
Ru
n1
Ru
n2
Ru
n3
Ru
n4
Ru
n5
Bes
tW
ors
tA
ver
age
Pb
mP
.bes
tco
st%
dev
cost
%d
evco
st%
dev
cost
%d
evco
st%
dev
cost
%d
evco
st%
dev
cost
%d
evco
st%
dev
C2
10
567.1
4567.1
40.0
0—
0.0
0—
0.0
0—
0.0
0—
0.0
0—
0.0
0567.1
40.0
0567.1
40.0
0567.1
40.0
0C
412
733.1
3733.1
30.0
0—
0.0
0—
0.0
0—
0.0
0—
0.0
0—
0.0
0733.1
30.0
0733.1
30.0
0733.1
30.0
0C
516
879.3
7896.0
81.9
0892.3
71.4
8892.3
71.4
8892.3
71.4
8892.3
71.4
8892.3
71.4
8892.3
71.4
8892.3
71.4
8892.3
71.4
8C
517
869.2
4869.2
40.0
0868.9
3-0
.04
868.9
3-0
.04
869.0
0-0
.03
868.9
3-0
.04
868.9
3-0
.04
868.9
3-0
.04
869.0
0-0
.03
868.9
4-0
.03
C6
6412.9
6412.9
60.0
0—
0.0
0—
0.0
0—
0.0
0—
0.0
0—
0.0
0412.9
60.0
0412.9
60.0
0412.9
60.0
0C
710
583.1
9583.1
90.0
0—
0.0
0—
0.0
0—
0.0
0—
0.0
0—
0.0
0583.1
90.0
0583.1
90.0
0583.1
90.0
0C
711
568.4
9568.4
90.0
0—
0.0
0—
0.0
0—
0.0
0—
0.0
0—
0.0
0568.4
90.0
0568.4
90.0
0568.4
90.0
0C
89
644.6
3644.6
30.0
0—
0.0
0—
0.0
0—
0.0
0—
0.0
0—
0.0
0644.6
30.0
0644.6
30.0
0644.6
30.0
0C
913
757.8
4757.8
40.0
0757.7
3-0
.01
757.6
9-0
.02
757.7
0-0
.02
757.7
3-0
.01
757.7
3-0
.01
757.6
9-0
.02
757.7
3-0
.01
757.7
2-0
.02
C9
14
756.1
4756.1
40.0
0—
0.0
0—
0.0
0—
0.0
0—
0.0
0—
0.0
0756.1
40.0
0756.1
40.0
0756.1
40.0
0C
10
17
875.0
7875.0
70.0
0874.7
1-0
.04
874.7
1-0
.04
874.7
1-0
.04
874.7
1-0
.04
874.7
1-0
.04
874.7
1-0
.04
874.7
1-0
.04
874.7
1-0
.04
C11
7682.1
2682.1
20.0
0—
0.0
0—
0.0
0—
0.0
0—
0.0
0—
0.0
0682.1
20.0
0682.1
20.0
0682.1
20.0
0C
13
11
904.0
4904.0
40.0
0899.1
6-0
.54
899.1
6-0
.54
899.1
6-0
.54
899.1
6-0
.54
899.1
6-0
.54
899.1
6-0
.54
899.1
6-0
.54
899.1
6-0
.54
C13
12
896.5
0917.9
02.3
9894.1
9-0
.26
897.3
70.1
0896.6
60.0
2897.3
70.1
0896.1
4-0
.04
894.1
9-0
.26
897.3
70.1
0896.3
5-0
.02
C14
11
591.8
7591.8
70.0
0—
0.0
0—
0.0
0—
0.0
0—
0.0
0—
0.0
0591.8
70.0
0591.8
70.0
0591.8
70.0
0C
14
12
581.8
1581.8
10.0
0—
0.0
0—
0.0
0—
0.0
0—
0.0
0—
0.0
0581.8
10.0
0581.8
10.0
0581.8
10.0
0F
12
7769.6
6769.6
60.0
0769.5
5-0
.01
769.5
5-0
.01
—0.0
0769.5
5-0
.01
—0.0
0769.5
5-0
.01
769.6
60.0
0769.5
9-0
.01
avg.
0.2
50.0
30.0
50.0
50.0
60.0
50.0
30.0
60.0
5
Pb
sou
rce
t.ti
me
b.t
ime
t.ti
me
b.t
ime
t.ti
me
b.t
ime
t.ti
me
b.t
ime
t.ti
me
b.t
ime
t.ti
me
b.t
ime
C2
[30,3
2,5
8]
84.2
84
.286.5
86
.580.2
80
.281.9
81
.989.6
89
.684.5
84.5
C4
[30,5
8]
151.2
15
1.2
137.5
13
7.5
123.2
12
3.2
164.5
16
4.5
153.5
15
3.5
146.0
146.0
C5
[58]
450.2
276.5
480.4
237.5
463.4
237.5
434.0
237.5
518.3
237.5
469.3
245.3
C5
[21]
275.2
130.2
247.5
195.4
278.1
21.4
260.5
205.0
255.8
166.9
263.4
143.8
C6
[30,3
2,5
8]
45.1
45
.143.2
43
.249.0
49
.044.7
44
.742.2
42
.244.8
44.8
C7
[58]
80.6
80
.686.1
86
.173.1
73
.181.2
81
.285.2
85
.281.2
81.2
C7
[32]
83.1
83
.187.7
87
.783.2
83
.279.8
79
.879.5
79
.582.7
82.7
C8
[30]
136.8
13
6.8
142.2
14
2.2
137.2
13
7.2
130.0
13
0.0
143.9
14
3.9
138.0
138.0
C9
[58]
412.5
33.9
404.6
330.6
372.9
0.2
355.4
11.0
413.0
6.9
391.7
76.5
C9
[21]
243.4
24
3.4
213.9
21
3.9
221.9
22
1.9
227.6
22
7.6
267.1
26
7.1
234.8
234.8
C10
[21]
454.7
2.6
390.1
2.4
344.0
1.7
395.6
4.2
387.6
0.7
394.4
2.3
C11
[30,5
8]
178.3
17
8.3
183.4
18
3.4
181.0
18
1.0
183.4
18
3.4
165.3
16
5.3
178.3
178.3
C13
[30]
959.3
6.3
1022.0
133.3
1030.3
6.6
1027.2
4.6
980.5
78.6
1003.9
45.9
C13
[32]
1165.3
475.0
1004.9
201.4
1180.5
685.0
1146.5
725.2
1396.5
1230.9
1178.7
663.5
C14
[30,5
8]
276.3
27
6.3
293.8
29
3.8
263.6
26
3.6
294.4
29
4.4
301.1
30
1.1
285.8
285.8
C14
[21]
364.2
36
4.2
304.0
30
4.0
310.5
31
0.5
290.4
29
0.4
354.1
35
4.1
324.6
324.6
F12
[30]
142.2
56.6
157.2
103.4
143.9
14
3.9
137.2
64.2
129.7
12
9.7
142.0
99.6
avg.
323.7
154.4
310.9
163.7
313.9
154.1
313.8
166.4
339.0
207.8
320.2
169.3
14

Tab
le1.
3:C
ompu
tati
onal
resu
lts
onth
e8
larg
esc
ale
benc
hmar
kin
stan
ces
star
ting
from
the
solu
tion
sby
Der
igs
and
Reu
ter
[21]
.C
PU
tim
esar
eex
pres
sed
inse
cond
s.
Init
ial
Ru
n1
Ru
n2
Ru
n3
Ru
n4
Ru
n5
Bes
tW
ors
tA
ver
age
Pb
mP
.bes
tco
st%
dev
cost
%d
evco
st%
dev
cost
%d
evco
st%
dev
cost
%d
evco
st%
dev
cost
%d
evco
st%
dev
O1
56018.5
26018.5
20.0
0—
0.0
0—
0.0
0—
0.0
0—
0.0
0—
0.0
06018.5
20.0
06018.5
20.0
06018.5
20.0
0O
29
4584.5
54584.6
90.0
04573.5
3-0
.24
4573.5
3-0
.24
4573.5
3-0
.24
4573.5
3-0
.24
4573.5
3-0
.24
4573.5
3-0
.24
4573.5
3-0
.24
4573.5
3-0
.24
O3
77731.4
67731.4
60.0
0—
0.0
0—
0.0
0—
0.0
0—
0.0
0—
0.0
07731.4
60.0
07731.4
60.0
07731.4
60.0
0O
410
7260.5
97260.5
90.0
07259.8
1-0
.01
7253.9
1-0
.09
7253.9
1-0
.09
7253.2
0-0
.10
7251.7
4-0
.12
7251.7
4-0
.12
7259.8
1-0
.01
7254.5
1-0
.08
O5
99167.1
99167.1
90.0
09165.4
0-0
.02
9156.7
4-0
.11
9157.4
2-0
.11
9159.2
2-0
.09
9159.2
2-0
.09
9156.7
4-0
.11
9165.4
0-0
.02
9159.6
-0.0
8O
69
9803.8
09805.4
50.0
2—
0.0
2—
0.0
2—
0.0
2—
0.0
29804.2
50.0
09804.2
50.0
09805.4
50.0
29805.2
10.0
1O
710
10348.5
710348.5
70.0
010344.3
7-0
.04
10344.3
7-0
.04
10344.3
7-0
.04
10344.3
7-0
.04
10344.3
7-0
.04
10344.3
7-0
.04
10344.3
7-0
.04
10344.3
7-0
.04
O8
10
12420.1
612420.1
60.0
0—
0.0
0—
0.0
0—
0.0
0—
0.0
0—
0.0
012420.1
60.0
012420.1
60.0
012420.1
60.0
0
avg.
0.0
0-0
.04
-0.0
6-0
.06
-0.0
6-0
.06
-0.0
6-0
.04
-0.0
5
Pb
t.ti
me
t.ti
me
b.t
ime
t.ti
me
b.t
ime
t.ti
me
b.t
ime
t.ti
me
b.t
ime
t.ti
me
b.t
ime
t.ti
me
b.t
ime
O1
467.0
182.2
18
2.2
191.5
19
1.5
174.0
17
4.0
168.5
16
8.5
175.9
17
5.9
178.4
178.4
O2
467.0
284.0
34.6
298.6
233.0
302.8
89.2
313.0
63.3
395.5
360.6
318.8
156.1
O3
4047.0
304.6
30
4.6
279.6
27
9.6
300.6
30
0.6
295.5
29
5.5
296.8
29
6.8
295.4
295.4
O4
927.0
438.9
34.4
405.5
387.5
437.6
72.6
421.7
219.9
406.3
385.4
422.0
220.0
O5
1186.0
499.6
41.4
479.1
270.8
513.9
496.5
550.3
173.6
479.5
210.5
504.5
238.6
O6
1231.0
581.3
58
1.3
590.4
59
0.4
637.4
63
7.4
620.1
62
0.1
590.8
361.1
604.0
558.1
O7
3190.0
653.0
8.6
631.8
23.8
661.6
420.9
743.5
306.6
619.7
387.2
661.9
229.4
O8
1969.0
623.6
62
3.6
635.2
63
5.2
668.9
66
8.9
653.7
65
3.7
647.9
64
7.9
645.9
645.9
avg.
1685.5
445.9
226.3
438.9
326.5
462.1
357.5
470.8
312.7
451.6
353.2
453.9
315.2
15
obtained with the default setting of p (i.e., p = 0.5), thus indicating that extracting too
many customers leads in general to worse solutions (i.e., zavg(0.7) > zavg(0.5)). This is not
completely surprising, and it is essentially due to the column generation heuristic, which
falls in troubles in finding good variables for the Reallocation Model when the current
solution has been almost completely “destroyed” by the removal of too many customers.
As previously seen, the proposed algorithm is able to improve on high-quality initial solu-
tions. However, a natural question concerns the effectiveness of the method if the initial
solution is instead a “bad-quality” solution. To answer this question, we implemented
a modified version of the tabu search algorithm proposed by Fu et al. [31] (we refer the
reader to [31] for a detailed description of this algorithm). More precisely, we first com-
puted an initial random (and typically infeasible) solution, and then we applied only 200
iterations of the tabu search algorithm, with the aim of quickly finding a feasible solution,
possibly “far” from the good ones. The computational results provided by HIP on the 16
instances C1–C14 and F11–F12 when starting from such initial solutions are reported in
Table 1.4.
The table has the same structure as Table 1.1 and shows that HIP is quite effective
even when the initial solution is not a good-quality solution. First, we can note that all the
solutions are improved by all the 5 different runs. Further, even in this case the method
is quite consistent, as all the 5 different runs provide on average very similar results, both
in terms of quality of the solutions found and of CPU time. Finally, considering all the
instances and all the different runs, the average behavior of the algorithm is satisfactory:
starting from a set of initial solutions with an average percentage deviation (w.r.t. the
best known value) of 19.67, HIP finds a set of final solutions with an average percentage
deviation of 0.70 in an average overall computing time of 257.4 seconds.
The current best known solution costs for the tested instances are given in summary
in Table 1.5, where we also report the number of customers n and the route duration limit
D associated with the vehicles. Solution costs are given both for the case F = ∞ (i.e.,
when the objective is to minimize the number of used vehicles first and the traveling cost
second) and the case F = 0 (i.e., when the objective is to minimize the traveling cost).
As usual, the best known solution cost for the case F = 0 is reported only if the traveling
cost is smaller than the corresponding one for the case F =∞. For each instance whose
best known solution was not improved by HIP we report the algorithms providing the
corresponding best known costs. Previously best known solution costs reached also by
HIP (starting from a worse solution) are underlined, while new best solution costs found
by HIP are in bold face. For the capacitated instances, in the case F =∞, we also report
the best known lower bound LB taken from [45] and [56].
16

Tab
le1.
4:C
ompu
tati
onal
resu
lts
onth
e“c
lass
ical
”16
benc
hmar
kin
stan
ces
star
ting
from
“bad
init
ials
olut
ions
”.C
PU
tim
esar
eex
pres
sed
inse
cond
s.
Init
ial
Ru
n1
Ru
n2
Ru
n3
Ru
n4
Ru
n5
Bes
tW
ors
tA
ver
age
Pb
mP
.bes
tco
st%
dev
cost
%d
evco
st%
dev
cost
%d
evco
st%
dev
cost
%d
evco
st%
dev
cost
%d
evco
st%
dev
C1
5∗416.0
6467.8
012.4
4417.3
70.3
1417.3
60.3
1∗416.0
60.0
0∗416.0
60.0
0417.3
70.3
1∗416.0
60.0
0417.3
70.3
1416.8
40.1
9C
211
564.0
6657.0
716.4
9564.0
60.0
0564.0
60.0
0564.0
60.0
0564.0
60.0
0564.0
60.0
0564.0
60.0
0564.0
60.0
0564.0
60.0
0C
38∗639.7
4768.9
320.1
9642.1
40.3
8642.1
40.3
8642.9
80.5
1642.1
40.3
8643.7
50.6
3642.1
40.3
8643.7
50.6
3642.6
30.4
5C
412
733.1
31069.3
845.8
6738.0
50.6
7741.7
51.1
8748.6
32.1
1742.1
11.2
2744.1
51.5
0738.0
50.6
7748.6
32.1
1742.9
41.3
4C
517
869.2
41449.2
066.7
2887.4
02.0
9879.8
91.2
3882.1
21.4
8887.4
82.1
0887.8
52.1
4879.8
91.2
3887.8
52.1
4884.9
51.8
1C
66
412.9
6444.9
87.7
5416.8
40.9
4412.9
60.0
0416.8
50.9
4416.8
40.9
4412.9
60.0
0412.9
60.0
0416.8
50.9
4415.2
90.5
6C
711
568.4
9654.2
715.0
9568.4
90.0
0568.4
90.0
0568.4
90.0
0568.4
90.0
0569.5
10.1
8568.4
90.0
0569.5
10.1
8568.6
90.0
4C
89
644.6
3752.9
816.8
1647.5
60.4
5645.1
60.0
8645.1
60.0
8645.1
60.0
8645.1
60.0
8645.1
60.0
8647.5
60.4
5645.6
40.1
6C
914
756.1
4896.6
118.5
8756.8
10.0
9756.8
10.0
9757.7
80.2
2756.3
80.0
3759.6
00.4
6756.3
80.0
3759.6
00.4
6757.4
80.1
8C
10
17
875.0
7983.9
712.4
4901.1
82.9
8898.1
62.6
4897.9
92.6
2886.7
51.3
3887.6
91.4
4886.7
51.3
3901.1
82.9
8894.3
52.2
0C
11
7682.1
2835.9
322.5
5690.8
31.2
8689.2
41.0
4691.1
01.3
2692.6
31.5
4691.3
61.3
5689.2
41.0
4692.6
31.5
4691.0
31.3
1C
12
10∗534.2
4545.2
52.0
6∗534.2
40.0
0∗534.2
40.0
0∗534.2
40.0
0∗534.2
40.0
0∗534.2
40.0
0∗534.2
40.0
0∗534.2
40.0
0∗534.2
40.0
0C
13
12
896.5
01025.1
114.3
5902.8
70.7
1912.5
31.7
9904.1
70.8
6905.1
40.9
6905.7
91.0
4902.8
70.7
1912.5
31.7
9906.1
01.0
7C
14
12
581.8
1641.6
610.2
9581.9
20.0
2581.9
20.0
2581.9
20.0
2581.9
20.0
2581.9
20.0
2581.9
20.0
2581.9
20.0
2581.9
20.0
2F
11
4∗177.0
0201.2
713.7
1∗177.0
00.0
0∗177.0
00.0
0∗177.0
00.0
0∗177.0
00.0
0∗177.0
00.0
0∗177.0
00.0
0∗177.0
00.0
0∗177.0
00.0
0F
12
7769.6
6919.2
219.4
3783.4
11.7
9784.1
21.8
8782.6
61.6
9785.3
52.0
4784.1
21.8
8782.6
61.6
9785.3
52.0
4783.9
31.8
5
avg.
19.6
70.7
30.6
60.7
40.6
70.6
90.4
50.9
80.7
0
Pb
t.ti
me
t.ti
me
b.t
ime
t.ti
me
b.t
ime
t.ti
me
b.t
ime
t.ti
me
b.t
ime
t.ti
me
b.t
ime
t.ti
me
b.t
ime
C1
0.0
70.2
20.6
72.3
14.9
65.8
33.6
61.9
14.8
61.4
25.0
66.3
21.8
C2
0.1
86.2
62.2
78.2
28.7
94.3
32.0
83.0
58.5
77.2
52.1
83.8
46.7
C3
0.1
136.4
69.1
110.7
98.4
110.3
37.6
119.8
68.3
112.0
36.0
117.8
61.9
C4
0.2
177.8
127.5
159.2
88.3
188.9
148.5
186.4
64.3
177.5
79.1
178.0
101.5
C5
0.4
271.1
269.7
269.1
224.8
291.6
173.5
262.1
152.7
268.2
238.2
272.4
211.8
C6
0.0
48.5
0.6
44.0
26.8
51.1
0.6
50.6
0.5
45.9
10.7
48.0
7.8
C7
0.1
85.0
68.3
75.6
15.5
81.3
13.7
75.3
43.2
75.7
23.0
78.6
32.7
C8
0.1
153.1
87.3
160.8
123.6
169.6
29.2
153.3
51.3
151.7
110.5
157.7
80.4
C9
0.2
295.2
138.5
298.2
200.5
317.3
250.9
281.9
258.4
304.3
260.2
299.4
221.7
C10
0.4
705.2
665.0
721.8
524.1
729.1
719.1
828.4
678.8
584.2
556.8
713.7
628.8
C11
0.1
219.8
145.9
176.5
45.1
248.5
217.7
227.1
145.8
227.3
194.7
219.8
149.8
C12
0.1
99.6
23.0
89.8
61.3
96.2
12.5
102.2
74.2
96.6
27.9
96.9
39.8
C13
0.1
1113.8
393.4
1359.0
1270.8
1105.3
787.1
845.0
603.9
1244.1
562.0
1133.4
723.4
C14
0.1
363.1
213.6
327.1
124.8
486.7
421.3
305.6
159.2
452.1
325.2
386.9
248.8
F11
0.1
97.9
59.1
79.8
74.7
88.9
25.7
91.1
53.0
88.2
31.6
89.2
48.8
F12
0.2
190.9
36.4
176.7
80.3
152.2
43.5
178.8
140.4
181.7
43.9
176.1
68.9
avg.
0.1
257.1
148.8
262.4
187.7
267.3
184.2
240.8
160.5
259.3
161.1
257.4
168.4
17

Table 1.5: Current best known solution costs for the tested OVRP benchmark instances.
Inst. n D Best known solution
F =∞ F = 0
m LB cost best heuristics m cost best heursitiscs
C1 50 5 416.1 ∗416.06 [7], [21], [30], [31, 32], [46], [58] 6 412.96 [73], [74], [75]C2 75 10 559.62 567.14 [21], [30], [31, 32], [46], [58] 11 564.06 [73], [74], [75]C3 100 8 639.7 ∗639.74 [21], [30], [46] 9 639.57 [75]C4 150 12 730.2 733.13 [21], [30], [46], [58]C5 199 16 848.5 879.37 [74] 17 868.44C6 50 180 6 412.96 [7], [21], [30], [31, 32], [46], [58]C7 75 144 10 583.19 [58] 11 568.49 [21], [31, 32], [46]C8 100 207 9 644.63 [7], [21], [30], [46]C9 150 180 13 757.69 14 756.14 [21]C10 199 180 17 874.71C11 120 7 657.1 682.12 [21], [30], [58] 10 678.54 [75]C12 100 10 534.2 ∗534.24 [21], [30], [46], [58], [73], [74], [75]C13 120 648 11 899.16 12 894.19C14 100 936 11 591.87 [21], [30], [46], [58] 12 581.81 [21]F11 71 4 177.0 ∗177.00 [21], [31, 32], [46], [58]F12 134 7 762.9 769.55
O1 200 5 6018.52 [21], [46]O2 240 9 4573.53O3 280 7 7731.46 [21]O4 320 10 7251.74O5 360 8 9197.61 [46] 9 9156.74O6 400 9 9803.80 [46]O7 440 10 10344.37O8 480 10 12420.16 [21]
18

1.6 Conclusions and Future Directions
We addressed the Open Vehicle Routing Problem (OVRP), a variant of the “classical”
Vehicle Routing Problem (VRP) in which the vehicles are not required to return to the
depot after completing their service. OVRP has recently received an increasing attention
in the literature, and several heuristic and metaheuristic algorithms have been proposed
for this problem, as well as exact approaches.
We presented a heuristic improvement procedure for OVRP based on Integer Linear
Programming (ILP) techniques. Given an initial solution to be possibly improved, the
method follows a destruct-and-repair paradigm, where the given solution is randomly
destroyed (i.e., customers are removed in a random way) and repaired by solving an ILP
model, in the attempt of finding a new improved solution.
Computational results on 24 benchmark instances from the literature showed that
the proposed improvement method can be used as a profitable tool for finding good-
quality OVRP solutions, and that even extremely-good quality solutions found by the
most effective metaheuristic techniques proposed for OVRP can be improved. Out of 30
best known solutions which are not provably optimal, in 10 cases the proposed method
was able to improve on the best known solution reported in the literature.
Future directions of work could involve more sophisticated criteria for removing cus-
tomers from the current solution, as well as more sophisticated algorithms for solving
the column generation problem related to the ILP model. On the other side, the overall
procedure can be considered as a general framework and it could be extended to cover
other variants of Vehicle Routing Problems, as, for example, Vehicle Routing Problems
with heterogenous vehicles and multi-depot Vehicle Routing Problems.
19

Chapter 2
An Integer Linear Programming
Based Heuristic Approach for the
Capacitated m-Ring-Star Problem
2.1 Introduction
Introduced by Baldacci et al. [6] in 2007, the Capacitated m-Ring-Star Problem (CmRSP),
has many applications in telecommunication networks, in particular in the fiber optic
communication networks (see, e.g. Baldacci et al. [6])1.
The CmRSP can be described as follows: a mixed graph G = (V,E ∪ A) is given,
where V is the set of nodes, E = {{i, j} : i, j ∈ V, i 6= j} is the set of edges (undirected
arcs) and A is the set of arcs. The node set V is defined as V = {0}∪U ∪W , where node
0, U and W represent, respectively, the central depot, the set of customers and the set of
Steiner nodes and for each customer i ∈ U , Ci ⊂ U ∪W denotes the subset of nodes to
which customer i can be connected. The arc set A is defined as A = {(i, j) : i ∈ U, j ∈ Ci}.Each edge e ∈ E has a non negative visiting cost ce and a non negative allocation cost
dij.
We refer to a simple cycle consisting of a subset of nodes and the depot as a ring and
if a customer is visited by the ring or allocated to a node of the ring, it is assigned to that
ring. Two input parameters m and Q are the number of rings and the capacity of each
ring, respectively, and we have mQ ≥ |U |.A solution of the CmRSP is feasible if each customer is assigned to exactly one ring,
no Steiner node is used more than once, and the number of customers assigned to a ring
1The results of this chapter appear in: Naji-Azimi Z., Salari M., and Toth P.: “An Integer LinearProgramming Based Heuristic Approach for the Capacitated m-Ring-Star Problem”. Technical Report.DEIS, University of Bologna, 2010 [53].
20

is less than or equal to the capacity Q. The goal of the CmRSP is to find m rings with
the minimum global visiting and allocation costs. The CmRSP is known to be NP-hard
since it is the generalization of the Symmetric Traveling Salesman Problem (TSP), arising
when m = 1, Q = |U |, W = φ, A = φ.
Two Integer Linear Programming (ILP) formulations and a Branch-and-Cut (BC) ap-
proach have been proposed by Baldacci et al. [6] in 2007, but only the small-size instances
were solved to optimality within a reasonable time. Moreover, Baldacci et al. [6] proposed
two heuristic procedures (H1 and H2), for the solution of the CmRSP. The first heuristic,
H1, is based on the algorithm proposed for the multi-depot CmRSP [5] and executed
at the root node. The other heuristic, H2, is based on the information obtained by the
solution of the Linear Programming (LP) relaxation of the proposed ILP formulations to
construct a CmRSP solution and is executed on a given set of nodes of the enumeration
tree.
A hybrid metaheuristic approach, which combines GRASP and Tabu Search algo-
rithms, has been proposed by Mauttone et al. [49] in 2007.
An ILP formulation, based on a Set Covering model, and a Branch-and-Price (BP)
algorithm have been developed for the CmRSP by Hoshino and de Souza [38] in 2008.
Comparing the Branch-and-Cut (BC) and the Branch-and-Price (BP) approaches, shows
that their performance are approximately the same and both of these methods fail, in
many cases, in finding the optimal solutions, within two hours of computing time, for
instances with more than 50 nodes.
Finally in 2009, Salari et al. [65] proposed a heuristic approach for the solution of the
CmRSP. The proposed algorithm, after a construction phase, applies iteratively a series
of different local search procedures. A comparison of this heuristic with algorithms H1
and H2 proposed by Baldacci et al. [6] and the hybrid metaheuristic approach proposed
by Mauttone et al. [49] indicates that the heuristic outperforms the latter methods.
Studies on different variants of CmRSP, arising in telecommunication networks, have
been published in the literature and described in Baldacci et al. [6] and Labbe et al. [42,43].
In this work, considering the general scheme of the Variable Neighborhood Search
(VNS) approach, we incorporate an ILP based improvement method to enhance the qual-
ity of the current solution. The proposed algorithm is able to obtain, within reasonable
times, most of the optimal solutions and to improve some of the best known results
proposed in the literature for the CmRSP.
The utilization of using ILP techniques to improve a feasible solution of a combinatorial
optimization problem has been considered in recent years. Fischetti and Lodi [26] and
Danna et al. [18] used the idea of exploiting ILP to explore promising neighborhoods of
feasible solutions in Mixed Integer Programs. The methods presented in [18] and [26]
21

are currently embedded in the commercial mixed integer programming solver Cplex [39].
This approach has been also used by De Franceschi et al. [20] and investigated by Toth
and Tramontani [77] in the context of the classical VRP. Archetti et al. [2] developed a
heuristic algorithm for the Split Delivery Vehicle Routing Problem that integrates Tabu
Search with ILP to explore promising parts of the solution space identified by the Tabu
Search. They also used a similar approach for an Inventory Routing Problem [1]. Hewitt
et al. [37] combined exact and heuristic approaches to solve the Capacitated Fixed Charge
Network Flow Problem by using ILP to improve feasible solutions found during the search.
Finally, Salari et al. [68] used ILP techniques to improve the solution of the Open Vehicle
Routing Problem.
The reminder of this paper is organized as follows. Section 2.2 describes the pro-
posed ILP embedded VNS method for the CmRSP. Experimental results on benchmark
instances from the literature and on a new set of large instances are provided in Section
2.3. Section 2.4 contains concluding remarks.
A preliminary version of this paper was presented at the International Symposium on
Combinatorial Optimization in Hammamet, Tunesia [64].
2.2 Description of the proposed algorithm
In this section, we develop a VNS algorithm, called NST, strengthened with an ILP based
improvement method to the solution of CmRSP. VNS is a metaheuristic approach, pro-
posed by Mladenovic and Hansen [50], which applies a strategy based on the dynamic
change of the neighborhood structures. The basic idea of the VNS approach is to choose
a set of neighborhood structures that vary in size. After constructing an initial solution,
the algorithm iterates through different neighborhood structures to improve the solution,
until a stopping criterion is met [50]. Considering the VNS approach as our basic frame-
work, we start by constructing an initial solution. We then improve upon this initial
solution, using a Local Search Procedure. Inside the VNS scheme, the improvement of this
solution continues in a loop until a termination criterion is reached. This loop contains a
Shaking Procedure and a Local Search Procedure. The Shaking Procedure follows the VNS
paradigm. It considers a specifically designed neighborhood and makes random changes
to the current solution so as to explore neighborhoods farther away from the current so-
lution. The Local Search Procedure considers a more restricted neighborhood and tries
to improve upon the quality of a given solution. Following the VNS scheme, in case of
having an improvement in the solution cost we return to the first neighborhood size; oth-
erwise we increase the size of the neighborhood to try to find a possible better solution by
calling the Local Search Procedure. Moreover, we have found useful the utilization of the
22

threshold accepting criterion in updating the current solution at the end of each iteration
of the VNS algorithm. In particular, we accept a worse solution as the current one if
its cost is not greater than a given percentage P of the cost of the best known solution
or if the number J of consecutive iterations without any improvement does not exceed a
given value JMAX (where P and JMAX are two input parameters). The framework of
the proposed method is given in Algorithm 1, while in the following sections we describe
each procedure separately.
Beside some minor changes in the Shaking Procedure and threshold accepting idea,
the main differences of this approach with respect to the method proposed by Salari et
al. [65], are the ideas of using ILP techniques to improve the solutions and applying all of
these procedures in a VNS framework that leads to the better results.
CurrentSolution:=Initialization();
BestCost :=Cost(CurrentSolution) and BestSolution:=CurrentSolution;
Local Search Procedure(CurrentSolution);
Update CurrentSolution, BestSolution and BestCost ;
J :=0;
while the time limit is not reached doK :=Initial K ;
while K ≤ |U | /2 doShakingProcedure(CurrentSolution,K );
Local Search Procedure(CurrentSolution);
if Cost(CurrentSolution) < BestCost thenK :=Initial K ;
J :=0;end
elseK :=K+1;
J :=J+1;end
end
if (Cost(CurrentSolution) > P∗BestCost) or (J > JMAX) thenSet the best known solution as the current one;
end
endAlgorithm 1: The general framework of the proposed heuristic for CmRSP
23

2.2.1 Initialization Procedure
Similar to what has been done for the heuristic method proposed by Salari et al. [65],
the initial solution is created by using the clustering algorithm proposed by Fischetti et
al. [27] for the Generalized Traveling Salesman Problem (GTSP). In this procedure, the
goal is to construct a feasible solution that only uses customers in the structure of the
rings. To do so, we pick the depot and m customers as far as possible one from each other.
Following this step we have m rings by connecting the customers to the depot. Then each
of the remaining customers are allocated or visited in their best feasible position, i.e., the
position that results in the minimum visiting or allocation cost.
2.2.2 Local Search Procedure
The Local Search Procedure consists of four major parts: Improvement Procedure, ILP-
based Procedure, solving the Generalized Assignement Problem over the star part of the
solution, i.e. for the customers assigned to the nodes of the rings, and finally, using the
Lin-Kernighan TSP solver (see Lin and Kernighan [47] and Helsgaum [36]).
The Improvement Procedure follows the major ideas of the analogous procedure con-
sidered in the heuristic proposed by Salari et al. [65] and includes the Swap and the
Extraction-Assignment procedures. The ILP-based Procedure, which is one of the major
differences between this method and the heuristic proposed in [65], has been designed
to further improve the solution and is based on Integer Linear Programming (ILP) tech-
niques. Moreover, since the objective function consists of minimizing two different costs,
i.e. allocation and visiting costs, we use the Generalized Assignement Problem and Lin-
Kernighan TSP procedure [36, 47], to check any possible improvement in the allocation
and visiting costs, respectively. Algorithm 2 describes the outline of the Local Search
Procedure.
In this procedure we start by calling the Improvement Procedure and as long as the
solution can be improved, we iterate to enhance the quality of the solution. After calling
the Improvement Procedure and in the case of having an improvement in the solution
cost, we apply the ILP-Improvement Procedure, for a given number of iterations, to try
to improve the current solution. Followed by the ILP-based Procedure, in the case of
having an improvement in the solution cost, the algorithm looks for possible further
improvement of the solution by solving the Generalized Assignement problem. To do
so, we extract all the customers allocated to visited nodes in the current solution and
reallocate them in their best feasible positions by solving the Generalized Assignement
problem. Following these steps, we call the Lin-Kernighan procedure to find a possible
better order of visited nodes in the rings. Whenever applying the ILP-based Procedure
24

followed by the Generalized Assignement problem and Lin-Kernighan procedure results in
a better solution, we update the best known solution and call the Improvement Procedure
as long as the solution can be improved. All of these steps continues in a loop until the
solution cannot be improved any more.
while CurrentSolution can be improved doImprovementProcedure(CurrentSolution);
end
if Cost(CurrentSolution) < BestCost then
while Cost(CurrentSolution) < BestCost doUpdate BestCost and BestSolution;
for i=1,· · · , ILP-Iter doILP based Procedure(CurrentSolution);
if i=1 or the CurrentSolution has been improved by calling the ILP based
Procedure thenExtract all the allocated customers to those visited in the tours and
reallocate them by solving the Generalized Assignment Problem to
optimality;end
end
For each ring, call the Lin-Kernighan procedure to improve the CurrentSolution;
if Cost(CurrentSolution) < BestCost thenUpdate BestCost and BestSolution;
while CurrentSolution can be improved doImprovementProcedure(CurrentSolution);
end
end
end
endAlgorithm 2: Local Search Procedure
Improvement Procedure
The improvement of the current solution starts with the Swap Procedure. As soon as
the solution cannot be further improved by using the moves of the Swap Procedure, the
Improvement Procedure continues by calling the Extraction-Assignment Procedure. In
this section we briefly describe these procedures. For more details on the Swap and
Extraction-Assignment procedures, one can refer to Salari et al. [65].
25

Swap Procedure In this procedure, for each customer in the current solution and in
a random order, we test all the possible ways to swap this customer with another visited
or allocated node which is near to the selected one, starting from the first nearest node
up to the T th nearest one (where T is an input parameter).
Extraction-Assignment Procedure In this procedure, we extract, in a random order,
each customer from its current position, and reassign it to a possibly better feasible
position. To this aim, we consider T nodes nearest to the extracted customer and check all
the possibilities for allocating the customer to one of these nodes or visiting the customer
in a ring, consecuently before or after one of the T nearest nodes. We then select the best
feasible movement, i.e. the one that results in the least cost solution.
ILP-based Procedure
In this section we present a heuristic improvement procedure based on ILP techniques.
Given an initial feasible solution to be possibly improved, the method follows a destruct-
and-repair paradigm, where the given solution is destroyed (i.e., some nodes are removed
from the solution) and repaired by solving an ILP model (called Reallocation Model), in
an attempt to find an improved feasible solution. A similar approach has been used by De
Franceschi et al. [20] and Toth and Tramontani [77] in the context of the classical Vehicle
Routing Problem (VRP), and by Salari et al. [68] for the solution of the Open Vehicle
Routing Problem.
Let z be the current feasible solution of the CmRSP and F a subset of customers or
Steiner nodes visited in the current solution. We define z(F ) as the restricted solution
obtained from z by extracting (i.e., by shortcutting) all the nodes in F . We then add to
F all the customers allocated to the nodes in F and the Steiner nodes not visited by z.
We can partition F into two subsets, i.e. F = F1 ∪ F2, where F1 and F2 are the set of
customers and the set of Steiner nodes, respectively. Now, let R = R(z, F ) be the set of
rings in the restricted solution. An insertion point is a potential location in the restricted
solution which can be used to insert a sequence or a node subset or to allocate one or
more customers. We have to notice that a sequence consists of a set of customers which
can be inserted between two visited nodes and a node subset consists of a single customer
which can be allocated to the nodes visited by the rings or it is a customer or Steiner
node with at least one customer allocated to that.
We use the notations I = I(z, F ) to define the set of insertion points corresponding
to edges in the restricted solution that can be used to insert a sequence or a node subset,
and J = J(z, F ) to define the set of customers or Steiner nodes visited in the restricted
solution, which can be considered as insertion points to allocate one or more customers.
26

Moreover, we define I(r) and J(r) as the set of those insertion points belonging to ring
r ∈ R. Let S = S(F ) be the set of all the feasible sequences or node subsets which can
be obtained by recombining the nodes in F plus all the singleton customers in F that
can be allocated to the insertion points in J . We define q(s) as the number of customers
of the sequence or node subset s ∈ S. For each insertion point i ∈ I let Si ⊆ S be the
set of all feasible sequences or node subsets which can be inserted into i, and for each
insertion point j ∈ J let S ′j ⊆ S be the set of singleton customers that can be allocated
to j. Moreover, for each i ∈ I and w ∈ F we define Si(w) ⊆ Si as the set of sequences or
node subsets including node w which can be inserted into insertion point i. Let γsi be the
visiting or allocation cost for inserting sequence or node subset s ∈ S into insertion point
i ∈ I, and dvj the allocation cost for allocating customer v ∈ S′j to the insertion point
j ∈ J . We also define q(r) and c(r) as the number of customers and the cost of ring r
in the restricted solution z(F ), respectively. The Reallocation Model (RM) corresponding
to z and F can be defined as follows:
∑r∈R
c(r) + min∑i∈I
∑s∈Si
γsixsi +∑j∈J
∑v∈S′j
dvjyvj (2.1)
subject to: ∑i∈I
∑s∈Si(v)
xsi +∑j∈J
yvj = 1 v ∈ F1, (2.2)
∑i∈I
∑s∈Si(w)
xsi ≤ 1 w ∈ F2, (2.3)
∑s∈Si
xsi ≤ 1 i ∈ I, (2.4)∑i∈I(r)
∑s∈Si
q(s)xsi +∑j∈J(r)
∑v∈S′j
yvj ≤ Q− q(r) r ∈ R, (2.5)
xsi, yvj ∈ {0, 1} i ∈ I, j ∈ J, s ∈ Si, v ∈ F1. (2.6)
where the decision variables xsi and yvj are defined as follows:
xsi =
{1 if sequence or node subset s ∈ Si is inserted into insertion point i ∈ I,0 otherwise
(2.7)
27

and
yvj =
{1 if customer v ∈ F1 is allocated to insertion point j ∈ J,0 otherwise
(2.8)
The objective function (2.1), to be minimized, gives the total cost of the rings which
consists of both visiting and allocation costs. Constraints (2.2) impose that each ex-
tracted customer v to be visited or allocated exactly once, while constraints (2.3) force
each Steiner node to be used at most once. Constraints (2.4) impose that for each in-
sertion point i ∈ I we can insert at most one sequence or node subset. We have to
note that for the insertion points j ∈ J , we do not impose such a restriction. Finally,
constraints (2.5) impose that each ring in the final solution fulfills the capacity constraint.
Now, the main steps of the ILP-based Procedure can be expressed as follows:
• Selection Phase: Build set F by selecting from each ring of the current solution
z, with the same probability, all the visited nodes in odd or even positions.
• Extraction Phase: Extract from z the nodes selected in the previous step and
build the restricted solution z(F ). Add also to F all the customers currently allo-
cated to nodes in F and all the Steiner nodes not visited by z.
• Initialization Phase: For each insertion point i ∈ I, initialize Si with the possible
basic sequence or node subset extracted from i in the Extraction Phase, plus the
singleton sequence (consisting of one customer belonging to F ) having the mini-
mum visiting cost. For each insertion point i ∈ J , initialize S ′j with the customer
belonging to F having the minimum allocation cost. Initialize the Linear Program-
ming (LP) relaxation of the Reallocation Model (LP-RM) by considering the initial
subsets Si(i ∈ I) and S ′j(j ∈ J) and solve it.
• Column Generation Phase: For each insertion point i ∈ I (or j ∈ J), solve
the corresponding column generation problem by means of the Heuristic Column
Generation Procedure, described in the next section, and add to Si (or to S ′j) all the
sequences or node subsets (or customers belonging to F1) such that the associated
variables xsi (or yvj) have a reduced cost under a given threshold RCmax.
• Reallocation Phase: Using the sequences and node subsets generated up to this
step, build the corresponding reallocation model and solve it to optimality by using
an ILP solver.
28

Heuristic Column Generation Procedure For each insertion point we use a heuris-
tic approach to solve the corresponding column generation phase. In particular, for each
insertion point j ∈ J and for each customer v ∈ F1, we consider the possible allocation
of {v} to j. If the reduced cost corresponding to this allocation (i.e., s = {v} to j) is
less than the given threshold, RCmax, we add v to S ′j. For each insertion point i ∈ I, say
i = (a, b), we first generate all the sequences s consisting of one or two customers belong-
ing to F1 and if the reduced cost corresponding to the insertion of s into i (obtained by
substituting (a, b) with (a, s, b)), is less than the given threshold, RCmax, we add sequence
s to Si. In the next step, we generate all the node subsets s obtained by allocating from
one to five customers belonging to F1 to a node belonging to F . Then if the resulted
reduced cost, obtained by substituting (a, b) with (a, s, b), is less than the given threshold,
we add the node subset s to Si. We note that for each insertion point of type I or J , we
just work with a limited percentage of the nodes (RP) nearest to that insertion point to
generate the sequences or node subsets.
2.2.3 Shaking Procedure
Following the Local Search Procedure, discussed in the previous section, we use Shak-
ing Procedure. The Shaking Procedure follows the VNS paradigm and dynamically ex-
pands the neighborhood search area. In this step, we produce a solution that is in the
neighborhood size K of the Current Solution, i.e. NK(CurrentSolution). Specifically,
NK(CurrentSolution) is defined as the set of solutions that can be obtained from the
Current Solution by removing K random nodes, along with their possible allocated cus-
tomers, from the Current Solution and then by assigning each of them, in a random order
and once at a time, to its best feasible position (i.e. the position that generates the
minimum visiting or allocation cost). In this procedure, we do not reinsert the possible
extracted Steiner nodes to the solution.
2.3 Computational Results
In this section we report on our computational results. To test the performance of the
proposed heuristic, we have used the datasets proposed by Baldacci et al. [6] as well as a
set of large instances that we have developed for this problem. The instances proposed
in [6], are varying in size from 26 to 101 nodes. There are two classes of instances (A
and B). The topology of the underlying graphs, i.e. the coordinates of the nodes and
the number of customer or Steiner nodes, in both classes are exactly the same and the
difference is in the structure of the distance matrices. In particular, in the first class of
29

instances, class A, the visiting and the allocation costs (cij and dij) are the same as the
euclidean distance between the considered nodes while in the second class of instances,
class B, the visiting and allocation costs are cij = d7eije and dij = d3eije, respectively,
where eij is the Euclidean distance between the pair of nodes i and j.
Beside considering classes A and B, we have also designed a set of 48 larger datasets,
derived from two instances of TSPLIB library [60], KroA150 and KroA200, containing
150 and 200 nodes, respectively. To design these instances, we have followed the rules
proposed by Baldacci et al. [6] for the smaller instances (i.e. instances from 26 to 101
nodes). Also, there are 6 additional real world instances used in the paper by Baldacci et
al. [6], which are not available.
The proposed heuristic, NST, has been implemented in C and tested on a Pentium IV
PC running at 3.4 GHz with 1 GB of RAM.
The list of parameters which should be determined for the proposed method includes
P , Initial K, JMAX, ILP Iter, T , RP and RC max (see section 2.2). The termination
criterion of the overall algorithm is considered as a given number of iterations of the
main loop without any improvement. After testing different values for the parameters
we fixed them as follows: P = 1.05, Initial K = 5, JMAX = 100, ILP Iter = 10,
T = 0.20 ∗ NoV ertices, RP = 0.30 ∗ NoV ertices and RCmax = 0.005 ∗ BestCost, in
which NoV ertices and BestCost are the number of vertices and the cost of the best
known solution for each tested instance, respectively. Finally, the termination criterion
used to run the experiments is 150 consecutive iterations of the main VNS loop (see
Algorithm 1), without an improvement.
The results of the proposed algorithm in comparison to heuristics H1 and H2 [6],
HP [65], and the exact algorithm BC [6], are given in Tables 2.1 to 2.3. For each instance
we have performed 5 independent executions of the proposed algorithm using 5 different
seeds for initializing the random number generator. The best (B.Cost) and the average
solution cost (Avg.Cost) among these runs have been reported in the tables. For each
instance the reported total time (T.T) is related to the total execution time corresponding
to different runs. All computing times are expressed in seconds.
Since the results of the large instances, reported in Table 2.3, can be improved by
increasing the number of runs, we have also reported the results of the NST and HP
[65] with 20 independent runs. It should be mentioned that increasing the number of
independent executions, more than 5 in the small instances and more than 20 in large
ones, would not cause any significant improvement in the solutions cost, so we ignored to
report more results.
In each table, the name of each instance (Data), the number of nodes (n), the number
of rings (m), the number of customers (|U|) and the capacity of each ring (Q) are given in
30

columns 1 to 5, respectively. The results of heuristics H1 and H2 proposed by Baldacci et
al. [6] together with their computing time are given in columns 6-7 and 8-9, respectively,
while the results of BC algorithm [6] are reported in column 10. The time limit for the BC
algorithm is two hours of CPU time and for those instances whose optimal solutions can
not be obtained during this time, the best solutions found during the BC process have been
reported. The corresponding computing times of the BC algorithm are given in column
11. In columns 12 to 14, the best and the average solution costs obtained during 5 different
runs of HP [65] and the corresponding total computing time are reported, respectively.
In Table 2.3, the results of the execution of heuristic HP [65] with 20 independent runs
are given as well. In the last 3 columns of each table the best, the average cost and the
total time required for 5 and/or 20 independent runs of the NST algorithm are reported,
respectively. To provide the results reported in Tables 2.1 to 2.3, we have used the original
code of H1, H2 and BC algorithms (provided by Roberto Baldacci) and the original code
of HP [65]. In all tables, in each row the best solutions are written in bold and the average
values of each column (Avg) and the number of best solutions found by each algorithm
(NB) are reported in the last two rows of the tables.
Tables 2.1 and 2.2 show that for 63 out of 90 small instances, solved to optimality,
using the BC algorithm, NST could find all of the optimal solutions, while H1, H2 and HP
obtained 35, 38 and 62 of the optimal solutions, respectively. For the other 27 instances
whose optimal solutions are not available, NST achieved the best solution for 27 instances,
while H1, H2, BC and HP generated the best solutions 0, 0, 2 and 23 times, respectively.
As it can be seen from Tables 2.1 and 2.2, considering the best performance of the
heuristics, and the number of times that the proposed methods are able to reach the
best known results, NST algorithm is the best by obtaining all of the best known results
in both classes A and B. Moreover, the average computing time of NST algorithm in
small instances of classes A and B are 10.08 and 11.42 seconds, while H1, H2, BC [6] and
HP [65] take 5.4, 29.7, 2098.3 and 6.22 seconds in class A, and 5.89, 28.90, 2952.90 and
11.14 seconds in class B, respectively.
A comparison of NST algorithm with the methods H1, H2, BC and HP on the large
instances is reported in Table 2.3. For the large instances, clearly the proposed NST
method outperforms all the other algorithms. In these data sets since the proposed
heuristic is faster than H2 and BC, beside running NST and HP algorithms with 5 runs,
we prefered to execute them with 20 seeds as well. Considering only 5 independent runs of
the algorithm, the average of the best solution cost obtained by NST algorithm, is clearly
better than heuristic algorithms H1, H2 [6] and HP [65] and the exact algorithm BC [6].
Increasing the quality of the solutions by increasing the number of independent executions
of the algorithm can be seen in this table apparently. By considering 20 different runs,
31

the proposed algorithm can obtain the best solutions for 40 out of 48 instances. This is in
comparison to H1, H2, BC [6] and HP [65] (with the same number of runs) which generate
3, 3, 11 and 17 best solutions, respectively. In terms of the computing time, H1 [6] is
a bit faster than totally 5 independent runs of NST algorithm, while the speed of the
proposed method is approximately equivalent with HP [65]. In any case by running the
NST algorithm even for 20 times, the method is still faster than H2 and BC algorithms [6].
2.4 Conclusion
We have proposed an ILP based VNS approach for the Capacitated m-Ring-Star Problem
(CmRSP). Considering the general scheme of the VNS, this method incorporates an ILP
improvement method whenever the Improvement Procedure is not able to enhance the
quality of the solution. We compared the proposed method with the available heuristic
and exact methods for CmRSP in the literature. The results clearly show the superiority
of the proposed method, especially as the instances get larger. The proposed method,
within a short computing time, can obtain 66 out of 67 optimal solutions and in the
remaining instances whose optimal solutions are not known, it can obtain 36 best known
solutions and improve 28 of the best results obtained by other heuristics and exact method.
32

Table 2.1: Comparison of different solution procedures for the CmRSP problem on smallinstances (Class A).
Data n m |U| Q H1 H2 BC HP NSTCost T.T Cost T.T Cost T.T B.Cost Avg.Cost T.T B.Cost Avg.Cost T.T
A01 26 3 12 5 242 0.3 242 0.1 242 0.1 242 242.00 0.5 242 242.00 0.9A02 26 4 12 4 261 0.3 261 0.0 261 0.0 261 261.00 0.5 261 261.00 0.8A03 26 5 12 3 292 0.3 292 0.0 292 0.0 292 292.00 0.4 292 292.00 0.7A04 26 3 18 7 301 0.4 301 0.7 301 0.5 301 301.00 0.8 301 301.00 1.2A05 26 4 18 5 339 0.4 339 0.4 339 0.3 339 339.00 1.0 339 339.00 1.9A06 26 5 18 4 375 0.4 375 1.4 375 0.7 375 375.00 1.6 375 375.00 1.3A07 26 3 25 10 333 0.8 333 1.7 325 3.8 325 325.00 1.5 325 325.00 1.4A08 26 4 25 7 362 0.7 362 0.9 362 0.3 362 362.00 1.2 362 362.00 1.1A09 26 5 25 6 382 0.6 382 0.6 382 0.2 382 382.00 2.3 382 382.00 2.0A10 51 3 12 5 242 0.3 242 0.1 242 0.2 242 242.00 0.6 242 242.00 0.7A11 51 4 12 4 261 0.2 261 0.1 261 0.4 261 261.00 0.7 261 261.00 0.7A12 51 5 12 3 286 0.3 286 0.1 286 0.1 286 286.00 0.6 286 286.00 0.6A13 51 3 25 10 331 0.8 322 1.0 322 2.1 322 322.00 1.7 322 322.00 2.0A14 51 4 25 7 360 0.7 360 1.1 360 2.1 360 360.00 1.9 360 360.00 2.2A15 51 5 25 6 379 0.6 379 1.7 379 2.3 379 379.00 2.4 379 379.00 2.6A16 51 3 37 14 373 2.3 373 6.7 373 8.4 373 373.00 3.2 373 373.00 2.5A17 51 4 37 11 408 1.6 408 7.6 405 41.7 405 405.00 3.5 405 405.00 3.6A18 51 5 37 9 441 2.2 435 11.8 432 52.2 432 432.80 3.8 432 432.00 4.7A19 51 3 50 19 459 4.8 469 14.1 458 182.8 458 458.20 5.0 458 458.00 8.1A20 51 4 50 14 501 3.0 493 20.8 490 220.4 490 490.00 5.4 490 490.00 7.2A21 51 5 50 12 521 5.3 521 19.2 520 6334.2 520 520.80 6.2 520 520.80 8.2A22 76 3 18 7 330 0.7 330 2.9 330 48.3 330 330.00 1.7 330 330.00 1.3A23 76 4 18 5 385 0.6 385 2.7 385 30.6 385 385.00 1.6 385 385.00 0.7A24 76 5 18 4 448 0.8 448 4.2 448 63.7 448 448.00 2.5 448 448.00 2.1A25 76 3 37 14 407 2.2 409 9.5 402 567.7 402 402.00 4.6 402 402.00 4.7A26 76 4 37 11 462 2.3 461 16.5 460 7200.0 457 457.80 4.8 457 458.00 5.6A27 76 5 37 9 479 3.1 484 21.4 479 509.3 479 479.00 5.2 479 479.00 6.4A28 76 3 56 21 475 7.3 478 38.9 471 1584.4 471 471.00 8.0 471 471.00 14.4A29 76 4 56 16 523 7.1 524 50.5 523 7200.0 519 519.80 8.0 519 519.60 9.8A30 76 5 56 13 552 6.3 552 40.2 545 3221.3 545 548.00 8.8 545 547.40 11.5A31 76 3 75 28 570 14.8 565 45.0 564 479.5 564 565.00 12.5 564 566.20 18.8A32 76 4 75 21 617 15.3 628 57.4 606 7200.0 602 604.20 12.0 602 602.50 23.6A33 76 5 75 17 659 13.6 654 81.7 654 7200.0 640 648.80 12.5 640 642.00 33.0A34 101 3 25 10 363 0.9 363 3.2 363 8.7 363 363.00 2.9 363 363.00 2.0A35 101 4 25 7 415 1.1 415 9.2 415 91.8 415 415.00 3.0 415 415.00 1.6A36 101 5 25 6 448 1.5 448 10.8 448 680.4 448 448.00 4.5 448 448.00 4.9A37 101 3 50 18 503 6.5 501 58.8 500 7200.0 500 500.00 7.0 500 500.00 7.4A38 101 4 50 14 532 3.9 533 44.5 532 7200.0 528 528.00 8.3 528 528.00 10.5A39 101 5 50 12 571 4.0 568 48.4 568 7200.0 567 567.00 7.7 567 567.00 8.8A40 101 3 75 28 605 18.6 622 115.6 595 6690.1 595 595.00 14.3 595 595.20 22.5A41 101 4 75 21 629 13.3 635 74.5 625 7200.0 623 623.20 15.8 623 623.60 32.1A42 101 5 75 17 663 11.5 665 120.5 662 7200.0 657 658.60 13.7 657 657.80 24.0A43 101 3 100 38 672 31.7 672 134.3 646 283.0 648 651.00 26.5 646 649.80 52.6A44 101 4 100 28 702 26.5 704 109.0 680 7200.0 679 680.20 25.9 679 679.80 50.3A45 101 5 100 23 719 24.5 717 148.7 700 1310.8 700 700.00 23.8 700 700.40 50.9Avg. 448.40 5.4 448.82 29.7 444.62 2098.3 443.82 444.36 6.2 443.78 444.14 10.1NB 21 – 21 – 36 – 44 – – 45 – –
33

Table 2.2: Comparison of different solution procedures for the CmRSP problem on smallinstances (Class B).
Data n m |U| Q H1 H2 BC HP NSTCost T.T Cost T.T Cost T.T B.Cost Avg.Cost T.T B.Cost Avg.Cost T.T
B01 26 3 12 5 1684 0.3 1684 0.1 1684 0.1 1684 1684.00 0.6 1684 1684.00 0.3B02 26 4 12 4 1827 0.2 1827 0.1 1827 0.1 1827 1827.00 0.5 1827 1827.00 0.8B03 26 5 12 3 2041 0.3 2041 0.0 2041 0.0 2041 2041.00 0.5 2041 2041.00 0.6B04 26 3 18 7 2104 0.4 2104 0.6 2104 0.5 2104 2104.00 0.9 2104 2104.00 1.1B05 26 4 18 5 2370 0.4 2370 1.5 2370 0.5 2370 2370.00 1.3 2370 2370.00 2.0B06 26 5 18 4 2615 0.5 2615 2.2 2615 0.7 2615 2615.00 2.3 2615 2615.00 1.2B07 26 3 25 10 2314 0.8 2251 1.6 2251 0.4 2251 2251.00 1.2 2251 2251.00 2.4B08 26 4 25 7 2510 1.1 2510 1.2 2510 0.5 2510 2510.00 1.4 2510 2510.00 1.4B09 26 5 25 6 2674 0.8 2674 2.9 2674 0.8 2674 2674.00 1.9 2674 2674.00 2.1B10 51 3 12 5 1681 0.3 1681 0.4 1681 0.8 1681 1681.00 0.9 1681 1681.00 0.7B11 51 4 12 4 1821 0.2 1821 0.6 1821 1.5 1821 1821.00 0.9 1821 1821.00 0.8B12 51 5 12 3 1972 0.3 1972 0.2 1972 0.3 1972 1972.00 1.0 1972 1972.00 0.9B13 51 3 25 10 2176 1.5 2176 1.6 2176 1.1 2176 2176.00 1.8 2176 2176.00 1.5B14 51 4 25 7 2476 1.1 2495 4.1 2470 7.2 2470 2470.00 2.1 2470 2470.00 2.1B15 51 5 25 6 2596 1.0 2579 2.4 2579 4.1 2579 2579.00 2.6 2579 2579.00 2.6B16 51 3 37 14 2507 2.3 2599 9.4 2490 17.9 2490 2490.00 4.2 2490 2496.80 2.9B17 51 4 37 11 2772 1.9 2811 10.5 2721 74.9 2721 2721.00 3.9 2721 2721.00 4.1B18 51 5 37 9 2938 2.2 2937 14.2 2908 145.0 2908 2914.60 4.8 2908 2908.00 4.9B19 51 3 50 19 3095 4.0 3071 17.4 3015 296.7 3015 3015.00 9.0 3015 3015.00 8.6B20 51 4 50 14 3365 3.6 3298 18.1 3260 336.6 3260 3260.00 8.4 3260 3260.00 7.0B21 51 5 50 12 3525 5.7 3516 18.9 3404 6470.7 3404 3404.00 9.1 3404 3420.60 11.1B22 76 3 18 7 2260 0.7 2259 2.6 2253 105.5 2253 2253.00 2.2 2253 2256.60 1.8B23 76 4 18 5 2625 0.5 2620 3.3 2620 29.5 2620 2620.00 2.1 2620 2620.00 1.2B24 76 5 18 4 3059 0.9 3059 3.4 3059 85.3 3059 3059.00 2.4 3059 3059.00 1.9B25 76 3 37 14 2742 3.1 2720 14.3 2720 1897.6 2720 2720.00 4.9 2720 2720.00 5.3B26 76 4 37 11 3176 2.7 3138 17.5 3138 7200.0 3100 3115.20 6.8 3100 3113.80 6.7B27 76 5 37 9 3339 3.0 3364 23.8 3311 7200.0 3284 3284.00 5.8 3284 3284.00 5.3B28 76 3 56 21 3112 7.1 3146 31.4 3088 7200.0 3044 3060.00 14.8 3044 3049.40 14.1B29 76 4 56 16 3447 5.1 3496 50.3 3447 7200.0 3415 3438.60 16.2 3415 3440.80 12.0B30 76 5 56 13 3652 4.6 3703 35.5 3648 7200.0 3636 3642.20 15.0 3632 3643.20 15.2B31 76 3 75 28 3786 14.1 3820 69.1 3740 7200.0 3652 3687.20 26.9 3652 3670.20 27.3B32 76 4 75 21 4057 13.9 4084 78.8 4026 7200.0 4003 4006.40 23.9 3964 4002.80 31.6B33 76 5 75 17 4442 15.9 4288 54.5 4288 7200.0 4217 4217.00 23.5 4217 4217.00 31.4B34 101 3 25 10 2437 0.7 2439 4.3 2434 24.2 2434 2434.00 3.5 2434 2434.00 2.3B35 101 4 25 7 2782 1.2 2819 9.5 2782 115.4 2782 2782.00 3.4 2782 2782.00 1.4B36 101 5 25 6 3043 1.0 3012 4.8 3009 862.4 3009 3009.00 5.1 3009 3009.00 5.2B37 101 3 50 18 3404 6.3 3387 37.2 3332 7200.0 3322 3322.00 9.4 3322 3322.00 9.9B38 101 4 50 14 3593 4.3 3586 32.1 3533 7200.0 3533 3533.00 10.2 3533 3533.00 10.7B39 101 5 50 12 3880 4.4 3872 33.2 3872 7200.0 3834 3839.60 12.1 3834 3839.20 13.8B40 101 3 75 28 3935 26.0 3923 260.7 3923 7200.0 3887 3887.80 25.9 3887 3888.00 35.6B41 101 4 75 21 4190 16.0 4202 63.5 4125 7200.0 4082 4088.40 25.2 4082 4091.40 31.0B42 101 5 75 17 4486 14.2 4458 47.9 4458 7200.0 4358 4358.00 21.9 4358 4358.00 35.2B43 101 3 100 38 4275 35.9 4155 103.0 4110 7200.0 4135 4150.40 74.7 4110 4126.00 52.0B44 101 4 100 28 4583 28.0 4608 97.4 4506 7200.0 4358 4377.60 56.4 4355 4379.80 58.0B45 101 5 100 23 4671 26.7 4639 114.6 4632 7200.0 4565 4568.40 50.4 4565 4566.40 46.4Avg. 3023.09 5.89 3018.42 28.90 2991.71 2952.90 2975.00 2978.50 11.1 2973.42 2977.82 11.4NB 13 – 17 – 30 – 41 – – 45 – –
34

Tab
le2.
3:C
ompa
riso
nof
diffe
rent
solu
tion
proc
edur
esfo
rth
eC
mR
SPpr
oble
mon
larg
eda
tase
ts.
Data
nm|U|
QH
1H
2B
CH
PN
ST
5ru
ns
20
runs
5ru
ns
20
runs
Cost
T.T
Cost
T.T
Cost
T.T
B.C
ost
Avg.C
ost
T.T
B.C
ost
Avg.C
ost
T.T
B.C
ost
Avg.C
ost
T.T
B.C
ost
Avg.C
ost
T.T
C01
150
337
14
17191
4.3
17341
42.9
17163
7200.0
17138
17138.0
11.1
17138
17138.0
045.3
17138
17138.0
5.9
17138
17138
21.2
C02
150
437
11
18793
5.3
18793
39.3
18782
7200.0
18782
18782.0
11.0
18782
18782.0
045.6
18782
18782.0
4.3
18782
18782
17.3
C03
150
537
920220
3.6
20135
33.5
20135
6534.5
20135
20169.2
17.0
20135
20186.3
063.9
20135
20237.6
7.1
20135
20237.6
029.7
C04
150
374
28
20741
30.9
20902
194.1
20741
7200.0
20741
20741.0
34.3
20741
20741.0
0134.3
20741
20741.0
30.8
20741
20741
128.6
C05
150
474
21
22810
16.9
23304
164.5
22810
7200.0
22525
22525.0
34.7
22525
22566.2
5146.8
22525
22525.0
43.6
22525
22525
196.3
C06
150
574
17
24970
20.0
25557
193.6
24955
7200.0
24949
24957.4
32.4
24949
24954.5
0139.1
24949
24957.4
34.9
24949
24953.2
0132.4
C07
150
3111
42
23532
57.3
23615
519.9
23259
2914.7
23259
23259.0
69.2
23259
23259.0
0292.9
23259
23259.0
69.8
23259
23314.8
0300.1
C08
150
4111
31
25809
59.8
25887
373.2
25121
7200.0
25006
25006.0
60.8
25006
25006.0
0246.1
25006
25006.0
82.5
25006
25006
285.7
C09
150
5111
25
27749
50.7
27992
505.1
27605
7200.0
27277
27277.0
63.7
27277
27288.7
5268.5
27277
27277.0
79.6
27277
27284.1
5347.4
C10
150
3149
56
28041
173.5
28190
740.7
27250
7200.0
27283
27314.4
154.0
27233
27311.9
5625.0
27274
27339.4
200.3
27273
27326.5
5725.2
C11
150
4149
42
28665
121.5
29013
716.1
28536
2400.2
28536
28538.2
150.0
28536
28573.6
0613.6
28536
28543.8
168.2
28536
28551.5
5602.4
C12
150
5149
34
31492
104.9
31286
752.3
31286
7200.0
30823
30844.8
136.3
30811
30857.1
5563.2
30788
30824.0
191.6
30669
30832.9
5760.0
C13
200
349
19
18651
8.2
18651
108.7
18614
7200.0
18567
18567.0
26.8
18567
18567.0
0111.2
18567
18567.0
16.4
18567
18567
64.6
C14
200
449
14
20875
12.6
21099
90.7
20834
7200.0
20650
20680.0
31.9
20650
20687.5
0133.8
20650
20737.0
28.6
20650
20709.2
594.0
C15
200
549
11
23556
9.1
24021
119.2
23510
7200.0
23496
23563.8
35.4
23496
23502.2
5145.9
23496
23518.6
28.2
23496
23501.6
5104.5
C16
200
399
37
22919
39.7
23047
371.5
22919
7200.0
22882
22882.0
76.0
22882
22882.0
0311.4
22882
22882.0
119.1
22882
22882
524.9
C17
200
499
28
25671
56.2
25957
950.5
25660
7200.0
25485
25621.2
80.1
25485
25627.2
0341.0
25472
25545.8
179.7
25472
25559.3
5552.4
C18
200
599
22
28438
53.3
28500
677.0
28413
7200.0
28388
28363.2
89.7
28300
28365.2
0367.2
28333
28376.4
125.0
28333
28364.6
5490.9
C19
200
3149
56
27419
154.1
27704
1292.9
27325
7200.0
26990
27097.0
182.4
26987
27054.7
0766.7
26990
27057.8
323.7
26971
26999.8
51240.7
C20
200
4149
42
29802
157.4
30355
2152.7
29778
7200.0
29361
29686.0
182.4
29333
29649.4
5737.8
29268
29446.8
444.7
29268
29586.8
51503.2
C21
200
5149
34
32401
138.4
33407
2368.4
32243
7200.0
31965
32079.2
167.5
31944
32054.8
5706.5
31947
31986.0
381.5
31946
31993.7
01463.2
C22
200
3199
74
30462
455.0
30574
3411.5
30462
7200.0
30323
30424.2
352.4
30256
30591.8
01345.4
30204
30373.6
698.7
30181
30351.0
02613.8
C23
200
4199
56
32719
403.4
33052
3374.1
32463
7200.0
32318
32405.2
309.9
32233
32404.1
51285.2
32203
32397.8
528.9
32152
32362.2
52195.2
C24
200
5199
45
35607
267.2
35497
3082.6
34969
7200.0
34507
34580.0
277.3
34502
34590.1
51136.0
34472
34537.4
569.5
34455
34524.2
02191.6
D01
150
337
14
111491
2.7
110350
30.7
110350
3193.5
111342
111342.0
18.6
111185
111360.7
569.9
110607
110607.0
5.3
110607
110618.0
021.1
D02
150
437
11
122840
3.4
122574
26.2
121569
7200.0
122852
122852.0
22.4
122415
122855.0
089.4
122138
123064.4
6.6
122066
123211.9
023.4
D03
150
537
9130298
3.8
129882
27.0
129540
7200.0
130144
130237.6
26.7
129882
130224.6
5108.6
129540
130248.0
12.4
129540
130045.8
542.2
D04
150
374
28
130349
36.9
130349
292.3
130349
7200.0
130937
131539.6
57.7
130117
130832.9
0225.9
128736
129568.4
54.3
128736
130106.4
5162.8
D05
150
474
21
144646
24.4
144646
545.8
144646
7200.0
142756
142920.8
59.0
142675
142922.1
0239.2
141716
141728.6
39.3
141680
141796.8
0152.9
D06
150
574
17
161128
22.5
162327
382.6
161128
7200.0
161508
161753.2
52.9
160988
161570.0
0218.9
159938
160972.8
29.5
159938
161178.4
1118.1
D07
150
3111
42
144756
128.5
144934
2392.7
144756
7200.0
146479
147261.8
140.3
146479
147509.5
5573.4
145257
145434.2
94.0
145257
145786.9
5331.7
D08
150
4111
31
159330
68.8
161151
913.9
159197
7200.0
159593
160281.4
118.2
159368
159951.1
5491.2
157287
158122.2
81.6
157193
158128.7
5305.4
D09
150
5111
25
180170
61.9
181394
530.4
179727
7200.0
179341
179501.2
102.1
178790
179511.7
5422.3
176899
178088.0
59.8
176635
177704.3
6255.1
D10
150
3149
56
171548
305.0
168893
1809.8
163932
7200.0
168780
169205.8
333.2
167825
169422.1
51333.3
167733
168288.6
85.6
164864
167790.3
0377.1
D11
150
4149
42
175931
156.8
180213
1362.2
174667
7200.0
176300
176595.2
249.2
175777
176683.2
51032.6
173162
175699.6
139.4
172716
175427.1
1487.4
D12
150
5149
34
196712
171.9
195838
1112.7
195838
7200.0
196167
196752.8
221.5
196133
197087.5
0903.4
192425
193578.0
146.3
192298
194374.8
6429.0
D13
200
349
19
120704
9.9
120704
292.4
120704
7200.0
121763
121824.2
38.3
121684
121812.2
0157.9
121101
121269.0
19.0
120913
121306.1
076.3
D14
200
449
14
138037
9.0
138607
133.0
134630
7200.0
135652
135854.0
40.6
135276
135754.7
5171.7
134602
134954.4
19.0
134215
134947.7
0107.1
D15
200
549
11
153027
8.6
156385
102.3
151439
7200.0
152015
152841.4
45.7
152012
152779.3
5195.8
151128
151856.2
26.2
151125
151772.2
0103.6
D16
200
399
37
145308
44.3
145308
1105.9
145308
7200.0
145766
145888.2
142.4
145241
145764.4
5588.0
144962
145282.2
132.8
144895
145513.4
1516.8
D17
200
499
28
164322
80.9
168750
698.8
163581
7200.0
164370
164747.0
136.2
163935
165012.7
0556.6
162493
164553.6
156.1
162363
164571.4
5487.9
D18
200
599
22
184939
66.8
187889
975.6
183284
7200.0
184839
185418.4
131.7
183190
185295.2
0539.4
181182
184627.2
121.3
181182
184612.6
1535.7
D19
200
3149
56
166409
199.2
169483
3657.3
165666
7200.0
165972
166955.8
474.3
165878
166905.5
01922.8
164654
165081.0
277.3
164306
165591.6
11070.9
D20
200
4149
42
188439
261.5
186529
2586.2
185886
7200.0
186242
187632.8
347.8
185855
188008.5
01421.7
182709
184802.0
253.1
182707
185268.9
11001.6
D21
200
5149
34
206528
189.2
207092
2058.1
201848
7200.0
203294
204669.0
304.4
203294
204684.1
51258.6
201648
203817.2
255.6
201134
203505.0
01193.7
D22
200
3199
74
189121
573.6
188262
5577.1
183547
7200.0
186802
187390.8
902.9
186031
271502.4
53725.6
182266
184038.2
612.8
181049
183388.3
02007.0
D23
200
4199
56
204024
569.7
199621
5275.0
199621
7200.0
202978
204643.6
721.9
202332
205043.6
52924.6
198516
201464.0
513.3
197673
201010.7
02321.4
D24
200
5199
45
222973
453.5
221042
4678.5
218610
7200.0
223609
224061.8
294.9
221917
223632.5
02000.0
218075
220549.4
329.4
216993
220696.6
61265.6
Avg.
94407.5
6122.0
94710.4
61225.9
93430.3
36913.4
93976.8
194264.0
157.7
93735.5
496015.9
8661.3
92909.7
593536.5
163.2
92723.9
193551.0
1624.6
NB
3–
3–
11
–14
––
17
––
20
––
40
––
35

Chapter 3
Variable Neighborhood Search for
the Label Constrained Minimum
Spanning Tree Problem
3.1 Introduction
The Minimum Label Spanning Tree (MLST) problem was introduced by Chang and
Leu [10]. In this problem, we are given an undirected graph G = (V,E) with labeled
edges; each edge has a single label from the set of labels L and different edges can have
the same label. The objective is to find a spanning tree with the minimum number of
distinct labels. The MLST is motivated from applications in the communications sector.
Since communication networks sometimes include numerous different media such as fiber
optics, cable, microwave or telephone lines and communication along each edge requires
a specific media type, decreasing the number of different media types in the spanning
tree reduces the complexity of the communication process. The MLST problem is known
to be NP-complete [10]. Several researchers have studied the MLST problem including
Bruggemann et al. [8], Cerulli et al. [13], Consoli et al. [14], Krumke and Wirth [40], Wan
et al. [80], and Xiong et al. [83–85].
Recently Xiong et al. [82] introduced a more realistic version of the MLST problem
called the Label Constrained Minimum Spanning Tree (LCMST) problem. In contrast to
the MLST problem, which completely ignores edge costs, the LCMST problem takes into
account the cost or weight of edges in the network (we use the term cost and weight in-
terchangeably in this paper). The objective of the LCMST problem is to find a minimum
weight spanning tree that uses at most K labels (i.e., different types of communications
media). Xiong et al. [82] describe two simple local search heuristics and a genetic algo-
36
rithm for solving the LCMST problem. They also describe a Mixed Integer Programming
(MIP) model to solve the problem exactly. However, the MIP models were unable to find
solutions for problems with greater than 50 nodes due to excessive memory requirements.
The Cost Constrained Minimum Label Spanning Tree (CCMLST) problem is another
realistic version of the MLST problem. The CCMLST problem was introduced by Xiong
et al. [82]. In contrast to the LCMST problem, there is a threshold on the cost of the
minimum spanning tree (MST) while minimizing the number of labels. Thus, given a
graph G = (V, E ), where each edge (i, j ) has a label from the set L and an edge weight
cij, and a positive budget B, the goal of the CCMLST problem is to find a spanning tree
with the fewest number of labels whose weight does not exceed the budget B. The notion
is to design a tree with the fewest number of labels while ensuring that the budget for the
network design is not exceeded. Xiong et al. [82] showed that both the LCMST and the
CCMLST are NP-complete. Thus, the resolution of these problems requires heuristics.
In this chapter1, we focus on the LCMST problem. We propose a Variable Neigh-
borhood Search (VNS) method for this problem. We then compare the VNS method to
the heuristics described by Xiong et al. [82]. To do so, we consider existing data sets
and also design a set of nine Euclidean large-scale datasets, derived from TSPLIB in-
stances [60]. The VNS method performs extremely well on the LCMST problem, with
respect to solution quality and computational running time.
The rest of this chapter is organized as follows. Section 3.2 describes the mathematical
formulation proposed for the LCMST problem. Section 3.3 describes the VNS method
that we have proposed to solve the problem. Section 3.4 reports on our computational
experiments. Finally, Section 3.5 provides concluding remarks.
3.2 Mathematical Formulation
In this section, we provide two mixed integer programming (MIP) models for the LCMST
problem. They are based on a singlecommodity and multicommodity network flow for-
mulations [82].
eij =
{1 if edge (i, j) is used,
0 otherwise(3.1)
1The results of this chapter appear in: Naji-Azimi Z., Salari M., Golden B., S. Raghacan, and TothP.: “Variable Neighborhood Search for the Cost Constrained Minimum Label Spanning Tree and LabelConstrained Minimum Spanning Tree Problems”. Computers & Operations Research, To appear [52].
37

yk =
{1 if label k is used,
0 otherwise(3.2)
fij = flow on edge (i,j ) from i to j . (3.3)
The MIP formulation based on the single commodity flow (scf) model is as follows:
min∑
(i,j)∈E
cijeij (3.4)
subject to ∑(i,j)∈E
eij = n− 1, (3.5)
∑i:(i,j)∈A
fij −∑
l:(j,l)∈A
fjl = 1 j ∈ V \ {1}, (3.6)
∑i:(i,1)∈A
fi1 −∑
l:(1,l)∈A
f1l = −(n− 1), (3.7)
fij + fji ≤ (n− 1) · eij ∀(i, j) ∈ E, (3.8)∑(i,j)∈Ek
eij ≤ (n− 1) · yk ∀k ∈ L, (3.9)
∑k∈L
yk ≤ K, (3.10)
eij, yk ∈ {0, 1} ∀ (i, j) ∈ E,∀k ∈ L, (3.11)
fij ≥ 0 ∀ (i, j) ∈ A. (3.12)
In the objective function (3.4), we want to minimize the total cost or weight of spanning
tree. Constraint (3.5) ensures the tree has exactly (n-1) edges. Constraints (3.6) and (3.7)
are included to ensure the graph is connected. To do so, we pick node 1 as the root node
(any node of the graph may be picked for this purpose). A supply of n-1 units of flow
is available at this root node. All of the other nodes have a demand of 1 unit of flow.
Consequently, we need to send one unit of flow from the root node to all the other nodes.
Constraint set (3.8) is a forcing constraint set. These constraints enforce the condition
that if flow is sent along an edge, the edge must be included in the tree. Constraint set
(3.9) is a forcing constraint set between edges and labels. It says that if an edge with label
k is used, then this label must be selected. Constraint (3.10) imposes an upper bound on
the number of labels, and finally the variables are defined in (3.11) and (3.12).
This single commodity flow formulation is identical to Xiong et al. [82]. However, this
38

formulation can be considerable strengthened by using the technique of disaggregation [81]
on constraint set (3.9). We replace this constraint with the stronger:
eij ≤ yk ∀k ∈ L,∀ {i, j} ∈ Ek. (3.13)
To describe the multicommodity formulation, we define a bidirected network obtained
by replacing each undirected edge (i,j ) by a pair of arcs (i,j ) and (j,i). Let A denote
the set of arcs. The variables eij and yk are, as before, in the single commodity flow
formulation. In addition we define
xij =
{1 if arc (i, j) is used,
0 otherwise(3.14)
fhij = flow of commodity h along arc (i,j ). (3.15)
The multicommodity flow formulation (mcf) can then be described as follows :
min∑
(i,j)∈E
cijeij (3.16)
subject to ∑(i,j)∈E
eij = n− 1, (3.17)
∑i:(i,h)∈A
fhih −∑
l:(h,l)∈A
fhhl = 1 ∀h ∈ V \ {1}, (3.18)
∑i:(i,1)∈A
fhi1 −∑
l:(1,l)∈A
fh1l = −1 ∀h ∈ V \ {1}, (3.19)
∑i:(i,j)∈A
fhij −∑
l:(j,l)∈A
fhjl = 0 ∀h ∈ V \ {1}, ∀j 6= h, (3.20)
fhij ≤ xij ∀ (i, j) ∈ A, ∀h ∈ V \ {1} , (3.21)
xij + xji ≤ eij ∀ (i, j) ∈ E, (3.22)
eij ≤ yk ∀k ∈ L,∀(i, j) ∈ Ek, (3.23)∑k∈L
yk ≤ K, (3.24)
eij, yk ∈ {0, 1} ∀ (i, j) ∈ E,∀k ∈ L, (3.25)
xij ≥ 0 ∀ (i, j) ∈ A, (3.26)
fhij ≥ 0 ∀ (i, j) ∈ A, ∀h ∈ V \ {1}· (3.27)
39

The objective function (3.16) and constraint (3.17) are identical to (3.4) and (3.5). In
the multicommodity flow model, each commodity has the root node as its origin and
the destination is one of the nodes in {2, 3, · · · , n}, for a total of n-1 commodities. Each
commodity has a supply of 1 unit of flow and a demand of 1 unit of flow. Thus, constraints
(3.18) to (3.20) represent the flow balance constraints for these flows. Constraints (3.21)
and (3.22) are forcing constraints. Constraint (3.21) ensures that if flow of a commodity
is sent on an arc, the arc is selected. Constraint (3.22) ensures that either arc (i, j) or arc
(j, i) can be in the solution, but not both. In fact, the tree must be directed away from
the root node. Constraints (3.23) and (3.24) are as before. We note that we have used the
strengthened version of the forcing constraint between the edge variables and the label
variables, as opposed to Xiong et al. [82] who have used the weaker version. Constraints
(3.25) define the edge and label variables as binary.
Constraints (3.26) and (3.27) define the arc and flow variables as continuous variables.
We note that these variables can be defined as binary. However, it is easy to see that if
the edge and label variables are binary then the arc and flow variables are automatically
integral.
In our computational work, we use the multicommodity flow model to obtain lower
bounds and optimal solutions on our test instances. We found that it is considerably
stronger than the multicommodity flow model proposed by Xiong et al. [82] that has the
aggregated version of constraint (3.23).
3.3 Variable Neighborhood Search for the LCMST
Problem
In this section, we develop our Variable Neighborhood Search algorithm for the LCMST
problem. Variable Neighborhood Search is a metaheuristic proposed by Mladenovic and
Hansen [50], which explicitly applies a strategy based on dynamically changing neighbor-
hood structures. The algorithm is very general and many degrees of freedom exist for
designing variants.
The basic idea is to choose a set of neighborhood structures that vary in size. These
neighborhoods can be arbitrarily chosen, but usually a sequence of neighborhoods with
increasing cardinality is defined. In the VNS paradigm, an initial solution is generated,
then the neighborhood index is initialized, and the algorithm iterates through the different
neighborhood structures looking for improvements, until a stopping condition is met.
We consider VNS as a framework, and start by constructing an initial solution. We
then improve upon this initial solution using local search. Then, the improvement of the
40

incumbent solution (R) continues in a loop until the termination criterion is reached.
This loop contains a shaking phase and a local search phase. The shaking phase follows
the VNS paradigm. It considers a specially designed neighborhood and makes random
changes to the current solution that enables us to explore neighborhoods farther away from
the current solution. The local search phase considers a more restricted neighborhood set
and attempts to improve upon the quality of a given solution.
We now make an important observation regarding the relationship between the selected
labels and the associated solution. Given a set of labels, the minimum cost solution on
the labels R is the minimum spanning tree computed on the graph induced by the labels
in R. We denote the minimum spanning tree on the graph induced by the labels in R as
MST(R) and its cost by MSTCOST(R). These two can be computed rapidly using any
of the well-known minimum spanning tree algorithms [41, 59]. Consequently, our search
for a solution focuses on selecting labels (as opposed to edges), and our neighborhoods as
such are neighborhoods on labels. Our solutions then are described in terms of the labels
they contain (as opposed to the edges they contain).
3.3.1 Initial Solution
Since having more labels in the solution results in a less MSTCOST, our procedure to
construct an initial solution focuses on selecting a set of labels with the maximum number
of allowed labels that result in a connected graph. Let Components(R) denote the number
of connected components in the graph induced by the labels in R. This can easily be
computed using depth first search [76]. Our procedure adds labels to our solution in
a greedy fashion. The label selected for addition to the current set of labels is the one
(amongst all the labels that are not in the current set of labels) that when added results in
the minimum number of connected components. Ties between labels are broken randomly.
In other words, we choose a label for addition to the current set of labels R randomly
from the set
S = {t ∈ (L \R) : min Components (R ∪ {t})}. (3.28)
This continues until the selected labels result in a single component.
In figure 3.1, an example illustrating the initialization method is shown. Suppose
there are three labels, namely a, b, and c, in the label set. Since the number of connected
components after adding label c is less than for the two other labels, we add this label to
the solution. However the graph is still not connected, so we go further by repeating this
procedure with the remaining labels. Both labels a and b produce the same number of
components, so we select one of them randomly (label b).
41

It is easy to observe that if R is a subset of labels, then the cost of an MST on any
superset T of R is less than or equal to the cost of the MST on R. In other words, if
R⊆T then MSTCOST(R) ≥ MSTCOST(T ). Consequently, in order to try to minimize
the cost, we iteratively add labels to the initial set of labels until we have K labels. To
do so we choose the label that, when added, results in the lowest cost minimum spanning
tree. In other words the label to be added is selected from
S = {t ∈ (L \R) : min MSTCOST (R ∪ {t})}. (3.29)
and ties are broken randomly. We continue adding labels to the current solution in this
fashion until we obtain a maximum number of labels.
3.3.2 Shaking Phase
The shaking phase follows the VNS paradigm and dynamically expands the neighborhood
search area. Suppose R denotes the current solution (it really denotes the labels in the
current solution, but as explained earlier it suffices to focus on labels). In this step, we
use randomization to select a solution that is in the size k neighborhood of the solution
R, i.e., Nk(R). Specifically Nk(R) is defined as the set of labels that can be obtained
from R by performing a sequence of exactly k additions and/or deletions of labels. So
N1(R) is the set of labels obtained from R by either adding exactly one label from R, or
deleting exactly one label from R. N2(R) is the set of labels obtained from R by either
adding exactly two labels, or deleting exactly two labels, or adding exactly one label and
deleting exactly one label.
The shaking phase may result in the selection of labels that do not result in a connected
graph, or result in a solution that does not meet the label constraint. If the set of labels
results in a graph that is not connected, we add labels that are not in the current solution
one by one, at random until the graph is connected. If the number of labels in the
solution does not meet the label constraint, we iteratively delete labels from the current
set of labels by choosing the label that when removed results in the lowest cost minimum
spanning tree.
3.3.3 Local Search Phase
The local search phase consists of two parts. The first part adds labels to a given solution
until it has K labels. The additional labels are selected iteratively, each time selecting a
label that provides the greatest decrease in the cost of the minimum spanning tree, until
we have K labels. In fact we select at random a label from the set of (3.29) and we add
42

it to the solution. The local search procedure then tries to swap each of the labels in
the current solution with an unused one, if it results in a lower minimum spanning tree
cost. To this aim, it iteratively considers the labels in the solution and tests all possible
exchanges of a given label with unused labels until it finds an exchange resulting in a lower
MST cost. If we find such an exchange, we implement it (i.e., we ignore the remaining
unused labels) and proceed to the next label in our solution. Obviously, a label remains in
the solution if the algorithm cannot find a label swap resulting in an improvement. This
is illustrated with an example in figure 3.2. Consider A = {b, c} we have MSTCOST(A)
= 12 and MSTCOST(A \ {b} ∪ a) = 9. Therefore, we remove label b and add label a to
the representation of our solution. The pseudocode for the VNS method for the LCMST
problem is provided in Algorithm 3.
Figure 3.1: An example illustrating the selection of labels for the initial connectedsubgraph.
43

Figure 3.2: An example for the swap of used and unused labels.
3.4 Computational Results
In this section, we report on an extensive set of computational experiments on the LCMST
problem. The proposed method has been tested on a Pentium IV machine with a 2.61
GHz processor and 2 GB RAM, under the Windows operating system. We also use ILOG
CPLEX 10.2 to solve the MIP formulation [39].
The two parameters that are adjustable within the VNS procedure are the value
of k (the size of the largest neighborhood Nk(R) in the VNS method), and Iter, the
number of iterations in which the algorithm is not able to improve the best known solution
(which is the termination criterion). Increasing k, not only increases the size of the
neighborhood but also increases the running time. We found that setting k=5 provides
the best results without a significant increase in running time. Additionally, as the value
of Iter is increased the running time of the algorithm is increase, though the quality
of the solution improves. We found that setting Iter=10 provides the best results in a
reasonable amount of running time. We now describe how we generated our datasets, and
then discuss our computational experience on these datasets for the LCMST problem.
3.4.1 Datasets
Xiong et al. [82] created a set of test instances for the LCMST problem. These include
37 small instances with 50 nodes or less, 11 medium-sized instances that range from 100
to 200 nodes, and one large instance with 500 nodes. All of these instances are complete
graphs. We also generated a set of 18 large instances that range from 500 to 1000 nodes.
These were created from nine large TSP instances in TSPLIB and considered to be Eu-
clidean (since the problems arise in the telecommunications industry, the costs of edges
are generally proportional to their length). To produce a labeled graph from a TSPLIB
instance, we construct a complete graph using the coordinates of the nodes in the TSPLIB
44

instance. The number of labels in the instance is one half of the total number of nodes,
and the labels are randomly assigned. Then two values for K, as the maximum allowed
labels, have been considered. Specifically, we used K = 75 and K =150.
R=ϕ;
Initialization Procedure(G,R);
Local Search(G,R);
while Termination criterion not met dok=1;
while k ≤ 5 do
R=Shaking Phase(G, k,R);
while Components(R) > 1 do
Select at random a label u ∈ L\R and add it to R;
end
while∣∣R∣∣ > K do
S={t ∈(L\R): min MSTCOST (R\{t})};Select at random a label u ∈ S and delete it from R;
end
Local Search(G,R);
if MSTCOST(R) < MSTCOST(R) then
R=R and k=1;
end
elsek=k+1;
end
end
end
Initialization Procedure(G,R):
while Components(R) > 1 doS={t ∈ (L\R) : min Components (R ∪ {t})};Select at random a label u ∈ S and add it to R;
end
while |R| < K doS={t ∈ (L \R) : min MSTCOST (R ∪ {t})};Select at random a label u ∈ S and add it to R;
end
Shaking Phase(G,k,R):
for i=1,. . . ,k dor=random(0,1);
If r ≤ 0.5 Then Delete at random a label from R Else Add at random a label to R;
Return(R);
end
Local Search(G,R):
while |R| < K doS = {t ∈ (L\R) : minMSTCOST (R ∪ {t})};Select at random a label u ∈ S and add it to R;
end
Consider the labels i ∈ R one by one
Swap the label i with the first unused label that strictly lowers the MST cost;
end
Algorithm 3: Variable Neighborhood Search Algorithm for the LCMST Problem
45
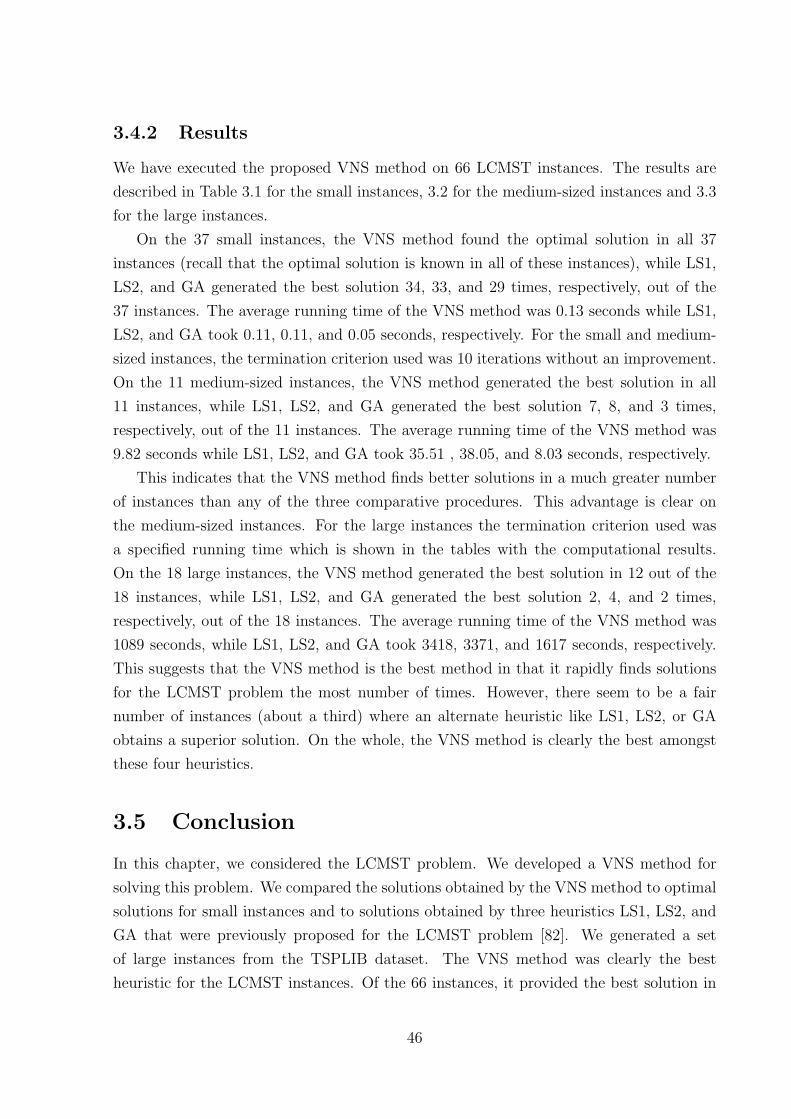
3.4.2 Results
We have executed the proposed VNS method on 66 LCMST instances. The results are
described in Table 3.1 for the small instances, 3.2 for the medium-sized instances and 3.3
for the large instances.
On the 37 small instances, the VNS method found the optimal solution in all 37
instances (recall that the optimal solution is known in all of these instances), while LS1,
LS2, and GA generated the best solution 34, 33, and 29 times, respectively, out of the
37 instances. The average running time of the VNS method was 0.13 seconds while LS1,
LS2, and GA took 0.11, 0.11, and 0.05 seconds, respectively. For the small and medium-
sized instances, the termination criterion used was 10 iterations without an improvement.
On the 11 medium-sized instances, the VNS method generated the best solution in all
11 instances, while LS1, LS2, and GA generated the best solution 7, 8, and 3 times,
respectively, out of the 11 instances. The average running time of the VNS method was
9.82 seconds while LS1, LS2, and GA took 35.51 , 38.05, and 8.03 seconds, respectively.
This indicates that the VNS method finds better solutions in a much greater number
of instances than any of the three comparative procedures. This advantage is clear on
the medium-sized instances. For the large instances the termination criterion used was
a specified running time which is shown in the tables with the computational results.
On the 18 large instances, the VNS method generated the best solution in 12 out of the
18 instances, while LS1, LS2, and GA generated the best solution 2, 4, and 2 times,
respectively, out of the 18 instances. The average running time of the VNS method was
1089 seconds, while LS1, LS2, and GA took 3418, 3371, and 1617 seconds, respectively.
This suggests that the VNS method is the best method in that it rapidly finds solutions
for the LCMST problem the most number of times. However, there seem to be a fair
number of instances (about a third) where an alternate heuristic like LS1, LS2, or GA
obtains a superior solution. On the whole, the VNS method is clearly the best amongst
these four heuristics.
3.5 Conclusion
In this chapter, we considered the LCMST problem. We developed a VNS method for
solving this problem. We compared the solutions obtained by the VNS method to optimal
solutions for small instances and to solutions obtained by three heuristics LS1, LS2, and
GA that were previously proposed for the LCMST problem [82]. We generated a set
of large instances from the TSPLIB dataset. The VNS method was clearly the best
heuristic for the LCMST instances. Of the 66 instances, it provided the best solution in
46

Table 3.1: VNS, GA, LS1, and LS2 for the LCMST problem on small datasets.# Nodes, # Labels K MIP Value LS1 LS2 GA VNS
Gap Time Gap Time Gap Time Gap Time20,20 2 6491.35 0.00 0.02 0.00 0.01 0.00 0.00 0.00 0.01
3 5013.51 0.00 0.04 0.00 0.04 0.00 0.00 0.00 0.024 4534.67 0.00 0.05 0.00 0.05 0.00 0.01 0.00 0.025 4142.57 0.00 0.05 0.00 0.04 0.00 0.01 0.00 0.026 3846.50 0.00 0.05 0.00 0.04 0.00 0.02 0.00 0.027 3598.05 0.00 0.05 0.00 0.05 0.00 0.02 0.00 0.038 3436.57 0.00 0.05 0.00 0.05 0.00 0.02 0.00 0.039 3281.05 0.00 0.04 0.00 0.05 0.00 0.02 0.00 0.0310 3152.05 0.00 0.05 0.00 0.04 0.00 0.02 0.00 0.0311 3034.01 0.00 0.05 0.00 0.04 0.00 0.03 0.00 0.03
30,30 3 7901.81 0.00 0.04 0.00 0.05 0.00 0.01 0.00 0.054 6431.58 0.00 0.06 0.00 0.05 0.00 0.02 0.00 0.055 5597.36 0.00 0.07 0.00 0.06 0.00 0.03 0.00 0.066 5106.94 0.00 0.11 0.00 0.07 0.00 0.04 0.00 0.067 4751.00 0.00 0.12 0.46 0.07 0.00 0.05 0.00 0.088 4473.11 0.00 0.07 0.00 0.07 0.00 0.05 0.00 0.099 4196.71 0.00 0.08 0.00 0.11 0.00 0.05 0.00 0.1010 3980.99 0.52 0.09 0.52 0.16 0.00 0.06 0.00 0.1211 3827.23 0.00 0.09 0.00 0.13 1.41 0.07 0.00 0.1412 3702.08 0.00 0.09 0.23 0.09 0.00 0.07 0.00 0.1313 3585.42 0.00 0.09 0.00 0.10 0.00 0.07 0.00 0.14
40,40 3 11578.61 0.00 0.05 0.00 0.06 0.00 0.02 0.00 0.114 9265.42 1.72 0.06 2.56 0.07 1.72 0.03 0.00 0.095 8091.45 0.00 0.09 0.00 0.10 0.75 0.03 0.00 0.156 7167.27 0.00 0.11 0.00 0.11 2.53 0.07 0.00 0.207 6653.23 0.13 0.12 0.00 0.13 0.13 0.05 0.00 0.238 6221.63 0.00 0.29 0.00 0.20 0.00 0.09 0.00 0.289 5833.39 0.00 0.26 0.00 0.22 0.48 0.10 0.00 0.2510 5547.08 0.00 0.16 0.00 0.24 0.00 0.10 0.00 0.3311 5315.92 0.00 0.18 0.00 0.20 0.00 0.15 0.00 0.3112 5164.14 0.00 0.35 0.00 0.21 0.00 0.09 0.00 0.31
50,50 3 14857.09 0.00 0.07 0.00 0.08 3.08 0.02 0.00 0.144 12040.89 0.00 0.15 0.00 0.12 0.00 0.04 0.00 0.145 10183.95 0.00 0.21 0.00 0.26 0.00 0.12 0.00 0.286 9343.69 0.00 0.25 0.00 0.34 0.00 0.12 0.00 0.257 8594.36 0.00 0.30 0.00 0.31 1.51 0.12 0.00 0.258 7965.52 0.00 0.24 0.00 0.34 0.00 0.20 0.00 0.30
Table 3.2: VNS, GA, LS1, and LS2 for the LCMST problem on medium-sized datasets.# Nodes, # Labels Labels LS1 LS2 GA VNS
Cost Time Cost Time Cost Time Cost Time100, 50 20 8308.68 3.92 8308.68 3.26 8335.75 2.94 8308.68 1.54100, 100 20 10055.85 5.89 10055.85 6.35 10138.27 1.70 10055.85 1.24100, 100 40 7344.72 11.36 7335.61 12.70 7335.61 2.68 7335.61 2.44150, 75 20 11882.62 7.47 11846.80 13.95 11854.17 4.49 11846.80 12.61150, 75 40 9046.71 17.42 9046.71 18.57 9047.22 12.63 9046.71 2.83150, 150 20 15427.54 25.33 15398.42 19.88 15688.78 3.82 15398.42 17.73150, 150 40 10618.58 41.67 10627.36 55.38 10728.93 7.04 10618.58 18.45200, 100 20 14365.95 27.19 14365.95 17.25 14382.65 10.64 14365.95 14.21200, 100 40 10970.94 46.23 10970.94 49.26 10970.94 12.84 10970.93 5.80200, 200 20 18951.05 44.61 18959.37 89.58 18900.25 13.06 18900.25 9.50200, 200 40 12931.46 159.56 12941.85 132.40 12987.29 16.49 12931.46 21.64
• The best solutions are in bold.
47

Table 3.3: VNS, GA, LS1, and LS2 for the LCMST problem on large datasets.# Nodes, # Labels Labels LS1 LS2 GA VNS
Cost Time Cost Time Cost Time Cost Time Max time532, 266 75 95671.13 397 95617.19 558 95808.91 383 95562.78 236 500
150 78418.55 703 78392.49 1011 78400.90 627 78400.90 363 500574, 287 75 44799.25 451 44650.40 485 44682.80 415 44633.91 377 500
150 34521.44 850 34501.63 944 34502.26 753 34457.48 442 500575, 287 75 8319.41 654 8309.18 706 8335.96 501 8307.45 335 500
150 6683.95 892 6683.48 996 6683.95 822 6683.48 370 500654, 327 75 34751.11 861 34809.59 1117 34795.62 551 34722.55 451 1200
150 30107.18 1325 30092.77 1901 30103.64 1004 30090.78 1108 1200657, 328 75 61970.46 2001 61978.58 1290 61977.86 684 61941.07 502 1200
150 47355.97 2430 47351.50 2624 47413.26 1443 47397.51 1185 1200666, 333 75 3509.17 706 3500.22 981 3505.82 663 3496.59 414 1200
150 2821.43 1441 2821.70 2043 2820.87 1920 2820.63 773 1200724, 362 75 56600.13 1374 56377.24 1435 56245.65 973 56510.83 700 1200
150 42874.35 4869 42855.57 3694 42847.26 2273 42835.26 1060 1200783, 391 75 12560.76 2839 12539.51 2466 12529.96 1039 12542.81 875 1200
150 9509.07 2766 9495.57 3748 9502.96 2024 9495.57 1180 12001000, 500 75 27246908 9100 27280794 13092 27428732 4955 27257080 3333 7200
150 20196378 27869 20216576 21587 20258258 8085 20229668 5903 7200
• The best solutions are in bold.
60 instances.
48

Chapter 4
The Generalized Covering Salesman
Problem
4.1 Introduction
The Traveling Salesman Problem (TSP) is one of the most celebrated combinatorial op-
timization problems. Given a graph G = (N,E), the goal is to find the minimum length
tour of the nodes in N , such that the salesman, starting from a node, visits each node
exactly once and returns to the starting node (see Dantzig et al., [19]). In recent years,
many new variants such as the TSP with profits [24], the Clustered TSP [11], the Gen-
eralized TSP [27], the Prize Collecting TSP [28], and the Selective TSP [44] have been
introduced and studied. The recent monograph by Gutin and Punnen [35] has a nice
discussion of different variations of the TSP and solution procedures.
Current [16] defined and introduced a variant of the TSP called the Covering Salesman
Problem (CSP). In the CSP the goal is to find a minimum length tour of a subset of n given
nodes, such that every node i not on the tour is within a predefined covering distance di
from a node on the tour. If di = 0 or di < minjcij, where cij denotes the shortest distance
between nodes i and j, the CSP reduces to TSP (thus it is NP-hard). Current and
Schilling [17] referred to several real world examples, such as routing of rural healthcare
delivery teams where the assumption of visiting each city is not valid since it is sufficient
for all cities to be near to some stops on the tour (the inhabitants of those cities which are
not in the tour are expected to go to their nearest stop). Current and Schilling [17] also
suggested a heuristic for the CSP where in the first step a Set Covering Problem (SCP)
over the given nodes is solved. Specifically, to solve the related Set Covering Problem, a
zero-one n × n matrix, i.e. matrix A, in which the rows and columns correspond to the
nodes is considered. If node i can be covered by node j (i.e., di ≥ cij) then aij is equal to
49

1, otherwise it is 0. Since the value of covering distance di varies for each node i, it should
be clear that A is not a symmetric matrix, but for each node i we have aii = 1. We should
also mention that in the CSP there is no cost associated with the nodes, so the cost of
columns of matrix A are all equal to one. Therefore a unit cost Set Covering Problem is
solved in the first step of this algorithm to obtain the cities visited on the tour. Then the
algorithm finds the optimal TSP tour of the nodes over these cities. Since there might
be multiple optimal solutions to the SCP, Current and Schilling suggest that all optimal
solutions to the SCP be tried out (i.e., have an optimal TSP tour constructed over the
nodes selected in the optimal SCP), and the best solution be selected. The algorithm is
demonstrated on a sample problem, but no additional computational results are reported.
Arkin and Hassin [3] introduced a geometric version of the Covering Salesman Prob-
lem. In this problem each node specifies a compact set in the plane, its neighborhood,
within which the salesman should meet the stop. The goal is computing the shortest
length tour that intersects all of the neighborhoods and returns to the initial node. In
fact, this problem generalizes the Euclidean Traveling Salesman Problem in which the
neighborhoods are single points. Unlike the CSP in which each node i should be within a
covering distance di from the nodes which are visited by the tour, in the geometric version
it is sufficient for the tour to intersects the specific neighborhoods without visiting any
specific node of the problem. Arkin and Hassin [3] presented simple heuristics for con-
structing tours for a variety of neighborhood types. They show that the heuristics provide
solutions where the length of the tour is guaranteed to be within a constant factor of the
length of the optimal tour.
Other than Current [16], Current and Schilling [17], and Arkin and Hassin [3] the CSP
does not seem to have got much attention in the literature. However, some generalizations
of the CSP have appeared in the literature. One generalization and closely related problem
discussed in Gendreau et al. [34] is the Covering Tour Problem (CTP). Here, some subset
of the nodes must be on the tour while the remaining nodes need not be on the tour. Like
the CSP, a node i not on the tour must be within a predefined covering distance di from a
node on the tour. When the subset of nodes that must be on the tour is empty the CTP
reduces to the CSP, and when the subset of nodes that must be on the tour consists of
the entire node set the CTP reduces to the TSP. Gendreau et al. [34] proposed a heuristic
that combines GENIUS, a high quality heuristic for the TSP [33], with PRIMAL1, a high
quality heuristic for the SCP [4].
Vogt et al. [79] considered the Single Vehicle Routing Allocation Problem (SVRAP)
that further generalizes the CTP. Here, in addition to tour (routing) costs, nodes covered
by the tour (that are not on it) incur an allocation cost, and nodes not covered by the tour
incur a penalty cost. If the penalty costs are set high and the allocation costs are set to
50

0, the SVRAP reduces to the CTP. Vogt et al. [79] discussed a tabu search algorithm for
the SVRAP that includes aspiration, path relinking and frequency based-diversification.
All of the earlier generalizations of the CSP assume that when a node is covered, its
entire demand can be covered. However, in many real-world applications this is not neces-
sarily the case. As an example, suppose we have a concert tour which must visit or cover
several cities. Since each show has a limited number of tickets, and large metropolitan ar-
eas are likely to have ticket demand which exceeds ticket supply for a single concert, there
must be concerts on several nights in each large city in order to fulfill the ticket demand.
Also in the rural healthcare delivery problem, discussed in Current and Schilling [17],
when we create a route for the rural medical team, on each day a limited number of peo-
ple can benefit from the services, so the team should visit some places more than once.
Consequently, rather than assuming that a node’s demand is completely covered when
either it or a node that can cover it is visited, we generalize the CSP by specifying the
coverage demand ki which denotes the number of times a node i should be covered. In
other words, node i must be covered ki times by a combination of visits to node i and
visits to nodes that can cover node i. If ki=1 for all nodes, we obtain the CSP. This gen-
eralization significantly complicates the problem, and is quite different from the earlier
generalizations that effectively deal with unit coverage (i.e., ki=1). In addition, since in
many applications there is a cost for visiting a node (e.g., cost of hotel for staying in a
city for one night) we include node visiting costs (for nodes on the tour) in the GCSP. In
the next section, we introduce and explain in more detail three different variations that
can arise in the GCSP (that deal with whether a node can be revisited or not). All these
variants are strongly NP-hard, since they contain the classical TSP as a special case.
The rest of this chapter1 is organized as follows. In Section 4.2, we formally define
the generalized covering salesman problem, and describe three variants. We also describe
a mathematical model for the problem. Section 4.3 describes two local search heuristics
for the GCSP. Section 4.4 discusses our computational experience on the three different
variants of the GCSP, as well as the CSP and the Generlized TSP (GTSP), which are
special cases of the GCSP. Section 4.5 provides concluding remarks and discusses some
possible extensions of the GCSP.
1The results of this chapter appear in: Golden B., Naji-Azimi Z., S. Raghacan, Salari M., and TothP.: “The Generalizaed Covering Salesman Problem”. INFORMS Journal on Computing. Submitted forpublication [51].
51
4.2 Problem Definition
In the Generalized Covering Salesman Problem (GCSP), we are given a graph G = (N,E)
with N = {1, 2, · · · , n} and E = ({i, j} : i, j ∈ N, i < j) as the node and edge sets re-
spectively. Without loss of generality, we assume the graph is complete with edge lengths
satisfying the triangle inequality, and let cij denote the cost of edge {i, j} (cij may be
simply set to the cost of the shortest path from node i to j). Each node i can cover a
subset of nodes Di (note that i ∈ Di, and when coverage is based on distance Di, it can
be computed easily from cij) and has a predetermined coverage demand ki. Fi is the fixed
cost associated with visiting node i, and a solution is feasible if each node i is covered at
least ki times by the nodes in the tour. The objective is to minimize the total cost which
is the sum of the tour length and the fixed costs associated with the visited nodes.
We discuss three variants of the GCSP: Binary GCSP, Integer GCSP without overnight
and Integer GCSP with overnight. In the following we explain each of these variants.
Binary Generalized Covering Salesman Problem: In this version, the tour is not
allowed to visit a node more than once and after visiting a node we must satisfy the
remaining coverage demand of that node by visiting other nodes that can cover it. We
use the qualifier binary as this version only permits a node to be visited once.
Integer Generalized Covering Salesman Problem without Overnights: Here a
node can be visited more than once, but overnight stay is not allowed. Therefore, to have
a feasible solution, after visiting a node, the tour can return to this node, if necessary,
after having visited at least one other node. In other words, the tour is not allowed to
visit a node more than one time consecutively. We use the qualifier integer as this version
allows a node to be visited multiple (or an integer number of) times.
Integer Generalized Covering Salesman Problem with Overnights: This ver-
sion is similar to the previous one, but overnight stay at a node is allowed.
In the CSP, ki = 1 for all nodes i ∈ N . Clearly, the CSP is a special case of the binary
GCSP. When there are unit demands there is no benefit to revisiting a node, consequently
the CSP can also be viewed as a special case of the integer variants of the GCSP. Thus
the CSP is a special case of all three variants of the GCSP. As the TSP is a special case
of the CSP, all three GCSP variants are strongly NP-hard.
We now discuss the issue of feasibility of a given instance of the problem. For the
binary GCSP, the problem is feasible if demand is covered when all nodes in the graph
52

are visited by the tour. In other words if hj denotes the number of nodes that can
cover node j (i.e., the number of nodes i for which j ∈ Di), then the problem is feasible
if kj ≤ hj. For the integer GCSP with and without overnights, the problem is always
feasible, since a tour on all nodes in the graph may be repeated until all demand is covered.
We now formulate the three different variants of the GCSP. We first provide an in-
teger programming formulation for the binary GCSP, and then an integer programming
formulation for the integer GCSP. Our models are on directed graphs (for convenience,
as they can easily be extended to asymmetric versions of the problem). Hence we replace
the edge set E by an arc set A, where each edge {i, j} is replaced by two arcs (i, j) and
(j, i) with identical costs. Also, from the problem data we have available
aij =
{1 if node j can cover node i,
0 otherwise(4.1)
We introduce the decision variables:
wi =
{1 if node i is on the tour,
0 otherwise(4.2)
xij =
{1 if arc (i, j) is chosen to be in the solution,
0 otherwise(4.3)
The integer programming model can now be stated as:
BinaryGCSP:
min∑
(i,j)∈A
cijxij +∑i∈N
Fiwi (4.4)
subject to: ∑j:(j,i)∈A
xji =∑
j:(i,j)∈A
xij = wi ∀i ∈ N, (4.5)
∑j∈N
aijwj ≥ ki ∀i ∈ N, (4.6)∑l∈S
∑k∈N\S
xlk +∑k∈N\S
∑l∈S
xkl ≥ 2(wi + wj − 1) S ⊂ N, 2 ≤ |S| ≤ n− 2 (4.7)
i ∈ S, j ∈ N \ S,
xij ∈ {0, 1} ∀(i, j) ∈ A, (4.8)
53

wi ∈ {0, 1} ∀(i) ∈ N. (4.9)
The objective is to minimize the sum of the tour costs and the node visiting costs.
Constraint set 4.5 ensures that for each on-tour customer, we have one incoming and one
outgoing arc. Constraint set 4.6 specifies that the demand of each node must be covered.
Constraint set 4.7 is a connectivity constraint that ensures that there are no subtours.
Note that there are an exponential number of connectivity constraints. Constraints 4.8
and 4.9 define the variables as binary.
For the integer GCSP without overnights we introduce two additional variables to rep-
resent the number of times a node is visited, and the number of times an arc is traversed
in the tour.
yi: Number of times that node i is visited by the tour.
zij: Number of times arc (i, j) is traversed by the tour.
The integer programming model can now be stated as:
IntegerGCSP:
min∑
(i,j)∈A
cijzij +∑i∈N
Fiyi (4.10)
subject to: ∑j:(j,i)∈A
zji =∑
j:(i,j)∈A
zij = yi ∀i ∈ N, (4.11)
∑j∈N
aijyj ≥ ki ∀i ∈ N, (4.12)
yi ≤ Lwi ∀i ∈ N, (4.13)
zij ≤ Lxij ∀(i, j) ∈ A, (4.14)∑l∈S
∑k∈N\S
xlk +∑k∈N\S
∑l∈S
xkl ≥ 2(wi + wj − 1) S ⊂ N, 2 ≤ |S| ≤ n− 2 (4.15)
i ∈ S, j ∈ N \ S,
xij ∈ {0, 1}, zij ∈ Z+ ∀(i, j) ∈ A, (4.16)
wi ∈ {0, 1}, yi ∈ Z+ ∀(i) ∈ N. (4.17)
where L is a sufficiently large positive value. The objective is to minimize the sum
of the tour costs and the node visiting costs. Constraint set 4.11 ensures that if node i
is visited yi times, then we have yi incoming and yi outgoing arcs. Constraint set 4.12
54

specifies that the demand of each node must be covered. Constraint sets 4.13 and 4.14
are linking constraints, ensuring that wi and xij are 1 if yi or zij are greater than 0 (i.e.,
if a node is visited or an arc is traversed). Note that it suffices to set L = maxi∈N {ki}.Constraint set 4.15 is a connectivity constraint that ensures that there are no subtours.
Note again, that there are an exponential number of connectivity constraints. Finally,
constraint sets 4.16 and 4.17 define the variables as binary and integer as appropriate. For
the integer GCSP with overnights, the above integer programming model (IntegerGCSP)
is valid if we augment the arc set A with self loops. Specifically, we add to A the arc set
{(i, i) : i ∈ N} (or A = A ∪ {(i, i) : i ∈ N}) with cii the cost of self loop arcs (i, j) set to
0.
Note that both the binary GCSP and the integer GCSP formulations rely heavily on
the integrality of the node variables. Consequently, the LP-relaxations of these models
can be quite poor. Further, these models have an exponential number of constraints,
implying that this type of model can only be solved in a cutting plane or a branch-and-
cut framework. Thus considerable strengthening of the above formulations is necessary,
before they are viable for obtaining exact solutions to the GCSP. In this paper, we focus
on local search algorithms to develop high-quality solutions for the GCSP.
4.3 Local Search Algorithms
In this section we propose two local search solution procedures, and refer to them as LS1
and LS2, respectively. They are designed to be applicable to all variants of GCSP. In
both algorithms, we start from a random initial solution. As we discussed in Section 4.2,
assuming that a problem is feasible (which can be checked easily for the binary GCSP)
any random order of the n nodes produces a feasible solution for the binary GCSP, and
repeating this ordering until all demand is covered produces a feasible solution for the
integer GCSP. We provide an initial solution to our local search heuristics by considering
a random initial ordering of the nodes in the graph and repeat this ordering for the integer
variants (if necessary) to cover all of the demand.
A solution is represented by the sequence of nodes in the tour. Thus for the binary
GCSP no node may be repeated on the tour, while in the integer GCSP nodes may be
repeated on the tour. For the integer GCSP with no overnights a repeated node may not be
next to itself in the sequence, while in the integer GCSP with overnights a repeated node
is allowed to be next to itself in the sequence. Thus 〈1, 2, 3, 4, 5, 8, 9〉, 〈1, 2, 3, 4, 3, 2, 8〉,〈1, 1, 2, 3, 3, 8〉 represent tour sequences that do not repeat nodes, repeat nodes but not
consecutively, and repeat nodes consecutively. Observe that if the costs are non-negative,
55

then in the integer GCSP with overnights there is no benefit to going away from a node
and returning to revisit it.
4.3.1 LS1
LS1 tries to find improvements in a solution S by replacing some nodes of the current
tour. It achieves this in a two step manner. First, LS1 deletes a fixed number of nodes.
(The number of nodes removed from the tour is equal to a predefined parameter, Search-
magnitude, multiplied by the number of nodes in the current tour. If this number is
greater than 1 it is rounded down, otherwise it is rounded up.) It removes a node k from
the current solution S with a probability that is related to the current tour and computed
as:
Pk = Ck/∑s∈S
Cs (4.18)
where Ck is the amount of decrease in the tour cost by deleting node k from S (while
keeping the rest of the tour sequence as before). Since the deletion of some nodes from the
tour S may result in a tour S ′ that is no longer feasible, LS1 attempts to make the solu-
tion feasible by inserting new nodes into S ′. We refer to this as the Feasibility Procedure.
Suppose that P is the set of nodes that can be added to the current tour. For the binary
GCSP P, consists of the nodes not in the tour S ′, while in the integer GCSP P, consists of
all nodes that do not appear more than L times in S ′. We select the node k ∈ P for which
Ik/N2k = minj∈P
(Ij/N
2j
)(4.19)
Here Ik is the amount of increase in the tour cost by insering node k into its best position
in the tour, while Nk is the number of uncovered nodes (or uncovered demand) which can
be covered by node k. We update the calculation of Nk for all nodes in P and repeat
the selection and insertion of nodes procedure until we obtain a feasible solution. After
this step, LS1 checks for the possible removal of “redundant” nodes from the current tour
in the Delete Redundant Nodes Procedure. A node is redundant if, by removing it, the
solution remains feasible.
Next, in the case LS1 finds an improvement, i.e., the cost of S ′ is less than the cost
of S, it tries to improve the tour length (and thus the overall cost) by applying the
Lin-Kernighan Procedure [47] to the solution S ′. We apply the Lin-Kernighan code LKH
version 1.3 of Helsgaun [36] that is available for download on the web. Since the procedure
is computationally expensive, we only apply it after max k (a parameter) improvements
over the solution S.
In order to get out locally optimum solutions, and to search through a larger set in
56

the feasible solution space, we apply a Mutation Procedure whenever the algorithm is not
able to increase the quality of the solution for a given number of consecutive iterations.
In the mutation procedure, a node is selected randomly and if the node does not belong
to the solution it is added to the solution in its best place (i.e. the place which causes the
minimum increase in the tour length); otherwise it is removed from the solution. In the
latter case, the algorithm calls the feasibility procedure to ensure the solution is feasible,
and updates the best solution if necessary.
To add diversity to the search procedure, we allow downhill moves with respect to
the best solution that LS1 has found. In other words, if the cost of the solution S ′ that
LS1 obtains is better than (1 + α) times the best solution found we keep it as the current
solution (over which we try and find an improvement), otherwise we use the best solution
obtained so far as the current solution. The stopping criterion for LS1 is a given number
of iterations that we denote by max iter. The pseudo-code of LS1 is given in Algorithm 4.
The parameters to be tuned for LS1 and their best values obtained in our computational
testing are described in Table 4.1 (see Section 4.4).
4.3.2 LS2
This local search procedure tries to improve the cost of a solution by either deleting a node
on the tour if the resulting solution is feasible; or by extracting a node and substituting
it with a promising sequence of nodes. In contrast to LS1, this local search algorithm
maintains feasibility (i.e., it only considers feasible neighbors in the local search neigh-
borhood). LS2 mainly consists of two iterative procedures: the Improvement Procedure
and the Perturbation Procedure. In the Improvement Procedure the algorithm considers
extraction of nodes from the current tour in a round robin fashion. (In other words, given
some ordering of nodes on the tour, it first tries to delete the first node on the tour, and
then it tries to delete the second node on the tour, and so on, until it tries to delete the
last node on the tour.) If by removing a node on the tour the solution remains feasible,
the tour cost has improved and the node is deleted from the tour. On the other hand, ex-
tracting a node from the tour may cause some other nodes to lose their covering demands
(meaning that their demand is no longer fully covered and the solution becomes infeasi-
ble). Consequently, in such cases we try to obtain a feasible solution by substituting the
deleted node with a new subsequence of nodes. To this aim, the algorithm considers the
T nodes nearest to the extracted node and generates all the promising subsequences with
cardinality one or two. Then it selects the subsequence s that has the minimum insertion
cost (i.e., the cost of the tour generated by substituting the deleted node by subsequence s
minus the cost of tour with the deleted node). In the case of improvement in the tour cost
57

(i.e., when the minimum insertion cost is negative) we make this substitution; otherwise,
we disregard it (i.e. reinsert the deleted node back into its initial position) and continue.
The improvement procedure is repeated until it cannot find any improvements (i.e., no
change is found while extracting nodes from the current tour in a round robin fashion).
In the Perturbation Phase, LS2 tries to escape from a locally optimum solution by
perturbing the solution. In the perturbation procedure we iteratively add up to K nodes
to the tour. It randomly selects one node from among the nodes eligible for addition to
the tour (in the binary GCSP the nodes must be selected from those out of the current
tour, while for the two other GCSP variants the nodes can be selected as well from those
visited in the current tour) and inserts it in the tour in its best possible position. Since
the tour is feasible prior to the addition of these nodes, the tour remains feasible upon
addition of these K nodes. In one iteration of the procedure the improvement phase
and perturbation phase are iteratively applied J times. After one iteration, when the
best solution has improved (i.e., an iteration found a solution with lower cost) we use the
Lin-Kernighan Procedure [47], to improve the current tour length (and thus the cost of the
solution). The stopping criterion for LS2 is a given number of iterations that we denote
by max iter. The pseudo-code for LS2 is given in Algorithm 5, and the parameters to be
tuned for LS2 and their best values obtained in our computational testing are described
in Table 4.2 (see Section 4.4).
4.4 Computational Experiments
In this section we report on our computational experience with the two local search
heuristics LS1 and LS2 on the different GCSP variants. We first consider the CSP, and
compare the performance of the two proposed heuristics LS1 and LS2, with that of the
method proposed by [17] for the CSP. Next we compare LS1 and LS2 on a large number
of GCSP instances for the three variants. We also consider a Steiner version of the GCSP,
and report our experience with the two local search heuristics. Finally, in order to compare
the quality of the solutions found by the two heuristics, we compare them with existing
heuristics for the GTSP where there exist well studied instances in the literature. All of
the experiments suggest that the heuristics are of a high quality and run very rapidly.
4.4.1 Test Problems
Since there are no test problems in the literature for the CSP (as well as the variants of
the GCSP we introduce), we created datasets based on the TSP library instances (Reinelt,
1991). In particular we constructed our datasets based on 16 Euclidean TSPLIB instances
58

BeginS := An initial random tour of n nodes, S* := S and BestCost := Cost(S* );CS= Decrease in the tour cost by short cutting node s;IS= Increase in the tour cost by adding node s to its best position in the tour;NS= max{1, Number of uncovered nodes covered by node s};No Null Iter= Number of iterations without improvement;Set k := 0; No Null Iter := 0;for i=1,. . . ,max iter do
for j=1,. . . ,Search-magnitude×|S| doDelete node k from S according to the probability Ck/
∑s∈S Cs ;
endS′:= Restricted solution obtained by shortcutting the nodes deleted in the previous step;Apply Feasibility Procedure(S′);Apply Delete Redundant Nodes Procedure(S′);if Cost(S′) < Cost(S) then
If (k=max k) Obtain TSP tour(S′) by calling Lin-Kernighan Procedure and set k := 0;Else k := k+1;
endif Cost(S′) > BestCost ×(1+α) then
S :=S* ;No Null Iter := No Null Iter + 1;
endelse
S := S′;if Cost(S) < BestCost then
Update S∗ := S, BestCost := Cost(S) and No Null Iter := 0;end
endIf No Null Iter > Mutation Parameter then apply Mutation Procedure(S);
endObtain TSP tour(S*) by calling Lin-Kernighan Procedure. Output the solution S*;End.
Feasibility Procedure(S′):P = The set of nodes that can be entered into the solution;while there exist uncovered nodes do
Select node k ∈ P such that Ik / N2k = minj∈P (Ij / N2
j );
Insert node k in its best position in S′;For each node j update the remaining coverage demand, Ij and Nj ;
end
Delete Redundant Nodes Procedure(S′):for i ∈ S′ do
If by removing node i from S′ the solution remains feasible, then remove node i ;end
Mutation Procedure(S);Select a random node k from the set of nodes P ;If node k /∈ S then add node k to S in its best position;Else remove node k from S and call Feasibility Procedure(S);If Cost(S) < BestCost then update S* := S, BestCost := Cost(S).
Algorithm 4: Local Search Algorithm 1 (LS1) for the GCSP
59

whose size ranged from 51 to 200 nodes. In the datasets created, each node can cover its
7, 9 or 11 nearest nodes (resulting in 3 instances for each TSPLIB instance), and each
node i must be covered ki times, where ki is a randomly chosen integer number between
1 and 3. We generated the datasets to ensure that a tour over all of the nodes covers
the demand (i.e., we ensured that the binary GCSP instances were feasible). Although
the cost for visiting a node can be different from node to node, for simplicity we consider
the node visiting costs to be the same for all nodes in an instance. In fact, if we assign
a high node visiting cost, the problem becomes a Set Covering Problem (as the node
visiting costs dominate the routing cost) under the assumption that a tour over all the
nodes covers the demand. On the other hand, if the node visiting cost is insignificant
(i.e., the routing costs dominate), there is no difference between the integer GCSP with
overnight and the CSP. This is because if there is no node visiting cost, a salesman will
stay overnight at a node (at no additional cost) until he/she covers all the demand that
can be covered from that node. After testing different values for the node visiting cost,
to ensure that its effect was not to either extreme (Set Covering Problem or CSP), we
fixed the node visiting cost value to 50 for all the instances (which turned out to be an
appropriate amount for the different kinds of instances studied in this paper). In this
fashion we constructed 48 datasets for our computational work.
After considerable experimentation on a set of small test instances, we determined the
best values of the parameters to be used in both LS1 and LS2. Tables 4.1 and 4.2 show
the different values that were tested for various parameters and the best value obtained
for the parameters in LS1 and LS2. Both LS1 and LS2 were implemented in C and tested
on a Windows Vista PC with an Intel Core Duo processor running at 1.66 GHz with 1
GB RAM. As is customary in testing the performance of randomized heuristic algorithms,
we performed several independent executions of the algorithms. In particular, for each
benchmark instance, 5 independent runs of the algorithms LS1 and LS2 were performed,
with 5 different seeds for initializing the random number generator and the best and the
average performances of the two heuristics are provided.
In all tables reporting the computational performance of the heuristics, the first column
is related to the instance name which includes the number of nodes. The second column
(NC) gives the number of nearest nodes that can be covered by each node. Moreover,
for each method the best and the average cost, the number of nodes in the best solution
(NB), the average time to best solution (Avg.TB), i.e. the average time until the best
solution is found (note the local search heuristic typically continues after this point until
it reaches its termination criterion), and the average time (Avg.TT) are reported (TT is
the total time for one run of the local search heuristic). In all tables, in each row the best
solution is written in bold and the last two rows give the average of each column (Avg)
60

BeginS := An initial random tour of n nodes, S* := S and BestCost := Cost(S* );N (S) = Number of nodes in S ;for i=1,. . . ,max iter do
bestimprove := false;for j=1,. . . ,J do
improve := true;RepeatImprovement Procedure(S,improve)Until (improve = false)if Cost(S) < BestCost then
S∗ := S ;BestCost := Cost(S);bestimprove := true;
endElse S := S∗;Perturbation Procedure(S);
endif bestimprove=true then
Obtain TSP tour(S∗) by calling Lin-Kernighan Procedure. Output the solution S∗;S := S∗ and BestCost := Cost(S∗);
end
endEnd.
Improvement Procedure(S, improve):Beginimprove :=false;r :=1;while r ≤ N(S) do
Extract the rth node of the tour from the current solution S ;if the new solution (obtained from extracting the rth node of S) is feasible then
S := new solution;improve := true;
endelse
Generate all subsequences with cardinality 1 or 2, by considering the T closest nodes to the extractednode;Extra Cost := Extra cost for the subsequence with the minimum insertion cost;if Extra Cost < 0 then
Update S by substituting the new subsequence for the extracted node;improve := true;
end
endr := r+1;
end
Perturbation Procedure(S):Beginfor i=1,. . . ,K do
Randomly select an eligible node;Insert the node in its best feasible position in the tour;
endEnd.
Algorithm 5: Local Search Algorithm 2 (LS2) for the GCSP
61

Table 4.1: Parameters for LS1.Parameters Different values tested Best valueSearch-magnitude {0.1, 0.2, 0.3, 0.4, 0.5, 0.6} 0.2Mutation parameter {5, 10, 15, 20} 10max k {5, 10, 15, 20} 10α {0, 0.1, 0.01, 0.001} 0.001max iter {1500, 3500, 5500, 7500, 8500} 3500 (CSP and Binary GCSP)
7500 (Integer GCSP)
Table 4.2: Parameters for LS2.Parameters Different values tested Best valueJ {50, 100, 150, 200, 250, 300} 200K {5, 10, 15, 20} 10T {5, 10, 15} 10max iter {15, 20, 25, 30, 35, 40, 45, 50, 55, 60} 25 (CSP and Binary GCSP)
50 (Integer GCSP)
and the number of best solutions found by each method (No.Best), respectively. All the
computing times are expressed in seconds.
4.4.2 Comparison of LS1, LS2 and Current and Schilling’s Heuris-
tic for the CSP
Since Current and Schilling [17] introduced the CSP and proposed a heuristic for it,
we compare the performance of LS1 and LS2 against their heuristic. Recall, their al-
gorithm was described in Section 4.1. Since there are no test instances or computa-
tional experiments reported in Current and Schilling’s paper, we coded their algorithm
to compare the performance of the heuristics. For Current and Schilling’s method, we
used CPLEX 11 [39] to generate all optimal solutions of the SCP, and since solving
the TSP to optimality is computationally quite expensive on these instances we use the
Lin-Kernighan Procedure [47] to find a TSP tour for each solution. Sometimes finding all
the optimal solutions of an SCP instance is quite time consuming, so we only consider
those optimal solutions for the SCP that can be found in less than 10 minutes of running
time.
Table 4.3 reports the results obtained by LS1, LS2 and our implementation of Current
and Schilling’s method. In this table, the number of optimal solutions (NO) of the set
covering problem is given. In Table 4.3 instances for which all the optimal solutions to
the set covering problem cannot be obtained within the given time threshold are shown
with an asterisk. As can be seen in Table 4.3 for the CSP, both LS1 and LS2 can obtain,
in a few seconds, better solutions than Current and Schilling’s method. The results of
both the heuristics in all except one case (where they are tied with Current and Schilling’s
method) are better than Current and Schilling’s method, while they are several orders
62

Table 4.3: Comparison of Current and Schilling’s method with LS1 and LS2 for CSP.Instance NC Current and Schilling LS1 LS2
NO Cost NB TB TT BestCost Avg.Cost NB Avg.TB Avg.TT BestCost Avg.Cost NB Avg.TB Avg.TTEil 51 7 13 194 7 0.07 0.21 164 164.0 10 0,20 1,48 164 164.0 10 0.04 0.77
9 309 169 6 1.92 1.97 159 159.0 8 0.10 1.34 159 159.0 9 0.03 0.6111 282 167 5 0.59 1.70 147 147.0 7 0.04 1.22 147 147.0 8 0.03 0.55
Berlin 52 7 2769 4019 8 19.39 21.04 3887 3966.2 11 0.08 1.68 3887 3887.0 11 0.26 0.679 11478 3430 7 26.08 94.14 3430 3435.8 7 0.10 1.41 3430 3430.0 7 0.04 0.6211 11 3742 5 0.22 0.26 3262 3262.0 6 0.02 1.60 3262 3262.0 6 0.02 0.34
St 70 7 32832 297 10 232.24 454.07 288 288.0 11 0.11 1.86 288 288.0 12 0.05 1.039 18587 271 9 173.87 176.00 259 259.0 10 0.05 1.79 259 259.0 10 0.05 1.2211 1736 269 7 13.21 13.74 247 247.0 10 0.16 1.98 247 247.0 10 0.04 0.88
Eil 76 7 241 241 11 1.15 2.46 207 210.6 15 0.53 2.09 207 207.0 15 0.17 1.119 1439 193 9 7.43 13.95 186 186.8 11 0.26 1.98 185 185.0 11 0.05 1.1311 7050 180 8 30.48 78.88 170 176.4 11 0.05 2.14 170 170.0 11 0.05 1.07
Pr 76 7 26710 53255 11 54.20 170.41 50275 51085.0 14 0.55 1.86 50275 50275.0 14 0.78 1.279 326703* 45792 10 6743.66 9837.36 45348 45348.0 12 0.27 2.01 45348 45348.0 12 0.26 1.1211 20 45955 7 0.11 0.20 43028 43418.4 10 0.48 1.95 43028 43028.0 10 0.07 1.03
Rat 99 7 3968 572 14 22.74 32.75 486 486.4 18 0.08 2.20 486 486.0 18 0.16 1.779 170366 462 12 1749.66 2729.67 455 455.6 15 0.67 2.38 455 455.0 15 0.11 1.9211 16301 456 10 88.87 140.18 444 444.8 12 0.43 2.25 444 444.0 12 0.09 1.75
KroA 100 7 208101* 10306 15 6303.03 6475.95 9674 9674.0 19 0.38 2.06 9674 9674.0 19 0.31 2.049 95770 9573 12 524.49 1365.42 9159 9159.0 15 0.13 2.28 9159 9159.0 15 0.14 1.8511 33444 9460 10 409.47 433.97 8901 8912.2 13 0.19 2.56 8901 8901.0 13 0.13 1.62
KroB 100 7 4068 11123 14 45.62 48.35 9537 9537.0 20 0.39 1.99 9537 9537.0 20 0.33 1.939 133396 9505 12 2112.57 2623.76 9240 9262.2 15 0.54 2.13 9240 9240.0 15 0.16 1.9911 90000* 9049 10 1056.27 2895.35 8842 8842.6 13 1.34 2.62 8842 8842.0 13 0.09 1.83
KroC 100 7 129545* 10367 15 3391.82 4212.98 9728 9728.6 18 0.72 2.46 9723 9723.0 17 0.17 1.979 5028 9952 12 35.91 52.25 9171 9184.4 13 0.12 2.45 9171 9171.0 13 0.19 1.9111 75987* 9150 10 1389.84 2482.00 8632 8632.0 13 0.14 2.74 8632 8632.0 13 0.09 1.85
KroD 100 7 1392 11085 14 10.29 15.58 9626 9626.0 20 1.35 2.39 9626 9626.0 20 0.21 1.839 700 10564 11 6.18 7.74 8885 8903.8 13 0.75 2.38 8885 8885.0 13 0.12 2.0411 85147* 9175 10 968.39 2761.51 8725 8730.4 13 0.48 2.83 8725 8725.0 13 0.13 1.89
KroE 100 7 92414* 11323 15 1971.32 3075.58 10150 10154.8 19 0.14 2.48 10150 10150.0 19 1.06 1.849 85305* 9095 12 1918.72 2764.70 8992 8992.0 13 0.33 2.69 8991 8991.0 14 0.16 1.9011 70807* 8936 10 609.81 2335.43 8450 8450.0 13 0.36 2.89 8450 8450.0 13 0.08 1.97
Rd 100 7 2520 4105 14 24.43 4196.23 3461 3478.2 18 0.31 2.53 3461 3485.6 18 0.24 1.839 95242* 3414 12 1798.14 3118.93 3194 3211.4 16 0.91 2.65 3194 3194.0 16 0.25 1.7611 1291 3453 10 8.60 22.11 2944 2944.0 12 0.44 3.1 2922 2922.0 13 0.14 1.54
KroA150 7 97785* 12367 22 2252.50 3499.43 11480 11548.8 27 0.89 2.68 11423 11481.0 28 1.97 2.919 69377* 11955 17 2454.99 2477.69 10072 10072.0 23 0.71 2.78 10056 10056.0 26 1.91 2.7511 169846* 10564 15 5483.07 5518.26 9439 9439.0 21 1.06 2.82 9439 9439.0 21 0.39 2.68
KroB 150 7 14400 12876 21 196.85 270.94 11490 11517.0 30 1.39 2.58 11457 11463.6 30 1.66 3.089 137763* 11774 18 2760.03 4572.81 10121 10173.4 24 1.19 2.77 10121 10121.0 24 0.64 2.7811 1431 10968 14 26.64 46.96 9611 9639.8 21 0.61 2.88 9611 9611.0 21 0.28 2.88
KroA 200 7 53686* 14667 28 537.60 1170.37 13293 13345.2 34 1.05 3.25 13285 13313.8 34 3.99 4.289 64763* 12683 23 1504.07 1628.36 11710 11753.6 29 1.23 2.80 11708 11725.0 28 3.25 3.8811 29668* 12736 19 398.25 671.55 10748 10813.4 29 1.04 3.16 10748 10814.8 29 3.10 3.65
KroB 200 7 107208* 14952 29 365.08 3351.89 13280 13297.6 36 0.46 2.83 13051 13147.4 35 2.24 4.389 38218* 13679 23 637.66 805.04 11864 11898.6 29 1.02 2.98 11864 11937.8 29 2.30 4.0211 67896* 12265 20 493.64 1410.60 10644 10714.0 29 0.98 2.81 10644 10650.4 29 3.10 3.72
Avg 55896 9808.02 13 1017.94 1626.68 9031.4 9070.3 17 0.52 2.35 9023.6 9031.5 17 0.65 1.95No.Best 1 38 48
of magnitude faster than Current and Schilling’s method. Between LS1 and LS2, LS2
outperforms LS1 as it obtains the best solution in all 48 instances, while LS1 only obtains
the best solution in 38 out of the 48 instances.
From Table 4.3 we can make the following counter-intuitive observation. Sometimes by
selecting a set of nodes with a larger cardinality, we are able to find a shorter tour length,
so the optimal solution of the Set Covering Problem is not necessary a good solution
for the Covering Salesman Problem. Figures 4.1 and 4.2 illustrate two examples of CSP
(Rat99 and KroA200) in which, by increasing the number of nodes in the tour, the tour
length is decreased.
63

Figure 4.1: An example of decreasing the tour length by increasing the number of nodesin Rat99 (NC=7).
Figure 4.2: An example of decreasing the tour length by increasing the number of nodesin KroA200 (NC=7).
64

4.4.3 Comparison of LS1 and LS2 on GCSP Variants
In Table 4.4 the results of the two local search heuristics on the binary GCSP are given.
As can be seen in this table, for the binary GCSP the two local search heuristics are
very competitive with each other. Although on average LS2 is a bit faster than LS1, in
terms of the average cost, average time to best solution, and the number of best solutions
found LS1 is better than LS2. Over the 48 instances, the two heuristics were tied in 22
instances. While, in 14 instances LS1 is strictly better than LS2, and in 12 instances LS2
is strictly better than LS1. Table 4.5 provides a comparison of LS1 and LS2 on the integer
GCSP without overnights. Here, the table contains one additional column reporting the
number of times a solution revisits cities (NR). Here, over 48 test instances, LS1 is strictly
better than LS2 in 12 instances, LS2 is strictly better than LS1 in 11 instances, while
they are tied in 26 instances. Again the running time of both LS1 and LS2 is extremely
small, taking no more than 20 seconds even for the largest instances. Table 4.6 compares
LS1 and LS2 on integer GCSP with overnights. Here, the table contains one additional
column reporting the number of times a solution stays overnight at a node (ON). Here,
over 48 test instances, LS1 is strictly better than LS2 in 8 instances, LS2 is strictly better
than LS1 in 30 instances, and they are tied in 10 instances. However, the running time
of LS1 increases significantly compared to LS2. This increase in running time appears
to be due to a significant increase in the number of times LS1 calls the Lin-Kernighan
Procedure. Overall, LS2 appears to be a better choice than LS1 for the integer GCSP with
overnights. Notice that a solution to the binary GCSP is a feasible solution to the integer
GCSP without overnights, and a feasible solution to the integer GCSP without overnights
is a feasible solution for the integer GCSP with overnights. Hence, we should expect that
the average cost of the solutions found should go down as we move from Tables 4.4-4.6.
This is confirmed in our experiments.
4.4.4 GCSP with Steiner Nodes
In our earlier test instances every node had a demand. We now construct some Steiner
instances, i.e., ones where some nodes have ki set to zero (the rest of the demands remain
unchanged). In these cases, a tour could contain some “Steiner nodes” (i.e., nodes without
any demand) that can help satisfy the coverage demand of the surrounding (or nearby)
nodes. On the other hand, if fewer nodes have demands then it is likely that fewer nodes
need to be visited (in particular the earlier solutions obtained are feasible for the Steiner
versions), and thus we would expect the cost of the solutions to the GCSP with Steiner
nodes to decrease compared to the instances of the GCSP without Steiner nodes. Table
4.7 confirms this observation. Here we compare LS1 and LS2 on the CSP with Steiner
65

Table 4.4: Comparison of LS1 and LS2 on Binary GCSP.Instance NC LS1 LS2
BestCost Avg.Cost NB Avg.TB Avg.TT BestCost Avg.Cost NB Avg.TB Avg.TTEil 51 7 1224 1224 20 0.10 1.65 1190 1191.6 19 0.24 1.08
9 991 996.2 15 0.48 1.63 991 993.4 15 0.21 1.1011 844 869.4 13 0.27 1.49 844 849.4 13 0.19 1.14
Berlin 52 7 5429 5429.0 17 0.06 1.65 5429 5514.6 17 0.11 1.119 4807 4818.8 14 0.09 1.49 4807 4834.0 14 0.08 1.0811 4590 4655.0 13 0.27 1.58 4590 4639.6 13 0.30 0.85
St 70 7 1836 1841.6 29 0.56 2.58 1834 1836.4 29 0.45 1.339 1461 1468.8 22 0.35 1.76 1460 1460.0 22 0.42 1.3811 1268 1270.2 19 0.90 1.73 1268 1270.2 19 0.45 1.37
Eil 76 7 1610 1630.8 26 0.52 2.51 1610 1623.0 26 0.25 1.639 1270 1319.8 20 0.37 1.83 1296 1301.2 21 0.83 1.6411 1117 1130.8 18 0.31 1.87 1117 1122.2 18 1.04 1.61
Pr 76 7 66789 66850.8 28 0.66 1.46 66455 66887.8 29 0.83 1.719 62907 62916.0 23 0.18 1.71 63114 63203.6 25 0.83 1.6811 52175 52527.0 19 0.25 1.58 52175 52175.0 19 0.32 1.47
Rat 99 7 2341 2346.0 34 0.64 3.07 2325 2340.2 33 0.98 2.179 1936 1940.4 27 0.24 1.97 1936 1941.2 27 1.01 2.4311 1686 1714.2 23 0.31 1.80 1686 1691.2 23 1.21 2.39
KroA 100 7 14660 14660 41 0.53 2.18 14660 14726.6 41 1.26 2.259 12974 12974 33 0.13 1.65 12974 12987.2 33 0.47 2.3811 11970 11977.2 28 0.42 1.57 11942 11942.0 29 0.41 2.38
KroB 100 7 14415 14451.8 44 0.87 1.91 14459 14577.6 42 0.43 2.239 12222 12296.4 34 0.86 2.17 12194 12247.0 33 2.18 2.2711 11276 11277.2 28 1.20 2.55 11276 11315.2 28 0.83 2.43
KroC 100 7 13830 13888.8 41 0.13 2.88 13830 13850.2 41 2.08 2.249 12149 12190.2 33 0.64 2.12 12149 12189.6 33 1.45 2.2111 11032 11032 26 0.11 2.00 11032 11032.0 26 1.74 2.22
KroD 100 7 13567 13666.4 38 0.06 2.53 13704 13857.2 38 0.31 2.429 12409 12448.6 32 1.03 1.92 12419 12479.8 31 2.08 2.4811 11486 11520.8 28 0.43 1.76 11443 11515.6 29 1.34 2.11
KroE 100 7 15321 15485.0 41 0.37 2.62 15471 15700.6 41 0.30 1.999 12482 12482 32 0.19 1.64 12482 12482.0 32 0.40 2.3311 11425 11452.4 30 0.66 1.48 11456 11490.6 28 2.24 2.26
Rd 100 7 6209 6210.8 37 0.30 2.20 6170 6251.4 37 0.70 2.339 5469 5595.0 29 0.23 2.10 5469 5477.2 29 1.06 2.4411 4910 4985.6 28 0.52 1.63 4910 4965.2 28 1.17 2.22
KroA150 7 17258 17274.6 55 0.96 4.52 17270 17425.8 54 2.11 3.639 15007 15042.6 46 1.07 3.68 15007 15145.4 46 2.60 4.2011 13666 13755.6 40 1.20 2.93 13762 14010.8 41 2.50 3.75
KroB 150 7 17639 17745.8 60 2.94 4.16 17639 18141.4 60 2.18 3.569 15505 15688.0 50 0.90 3.61 15506 15854.8 50 3.71 3.7611 13740 13899.0 42 1.82 2.97 13719 13836.4 40 2.82 3.69
KroA 200 7 21388 21553.8 74 3.23 8.11 21346 21543.8 76 3.71 4.739 17843 17999.4 59 2.33 5.70 17893 18103.8 60 3.09 4.9111 16591 16702.4 54 1.84 4.94 16380 16580.4 55 3.80 4.85
KroB 200 7 20736 20960.0 79 2.30 8.71 20882 21117.6 79 3.88 4.529 18266 18377.4 66 1.94 6.28 18269 18500.6 67 3.05 4.7311 15961 16428.8 55 2.37 4.71 16173 16372.0 55 3.57 4.65
Avg 13035.2 13103.6 35 0.79 2.72 13041.9 13137.4 35 1.40 2.49No.Best 36 34
66

Table 4.5: Comparison of LS1 and LS2 on Integer GCSP without overnight.Instance NC LS1 LS2
BestCost Avg.Cost NB NR Avg.TB Avg.TT BestCost Avg.Cost NB NR Avg.TB Avg.TTEil 51 7 1185 1199.8 19 1 0.28 4.19 1185 1187.0 19 1 0.96 3.83
9 991 992.8 15 0 1.59 4.09 991 996.2 15 0 0.85 3.3011 843 845.0 13 1 1.27 4.77 843 843.0 13 1 1.12 3.22
Berlin 52 7 5429 5429.0 17 0 0.14 3.99 5429 5429.0 17 0 0.18 3.379 4785 4796.8 15 1 0.02 4.17 4785 4807.6 15 1 0.12 2.6911 4590 4651.4 13 0 0.12 3.27 4590 4620.0 13 0 0.66 2.51
St 70 7 1778 1783.4 28 3 1.21 6.56 1782 1786.0 28 1 0.48 5.109 1461 1497.8 22 0 0.23 5.27 1460 1461.2 22 0 1.46 4.5611 1268 1268.0 19 0 1.33 3.31 1241 1264.2 18 1 1.70 4.03
Eil 76 7 1600 1626.6 26 1 1.69 6.67 1600 1619.4 26 2 2.27 5.119 1270 1291.6 20 0 1.26 5.10 1270 1294.0 20 0 1.93 4.7911 1117 1121.2 18 0 0.89 4.13 1117 1117.0 18 0 0.48 4.63
Pr 76 7 65990 66615.8 28 1 1.47 4.73 64111 65560.8 29 4 1.70 5.449 57147 57945.2 29 1 1.14 5.17 54907 55862.4 29 6 1.37 4.9411 51587 51650.0 20 2 1.52 4.42 49445 49445.0 21 3 1.02 4.22
Rat 99 7 2311 2315.0 33 1 0.65 7.39 2311 2341.2 33 1 2.70 7.619 1936 1937.8 27 0 1.53 5.85 1936 1949.4 28 0 1.99 7.1911 1683 1704.4 23 0 2.07 4.55 1683 1701.0 23 0 1.87 6.77
KroA 100 7 14660 14678.8 41 0 1.52 6.35 14660 14784.4 41 0 2.40 8.189 12974 12974.0 33 0 0.53 4.98 12974 13090.0 33 0 2.27 7.4911 11737 11737.0 29 1 0.47 4.59 11737 11737.0 29 1 2.03 0.30
KroB 100 7 14246 14394.2 45 6 3.00 6.16 14297 14316.8 43 3 3.54 8.839 12200 12348.6 34 3 2.39 4.91 12189 12197.8 33 2 1.56 7.3511 11268 11394.2 27 2 0.30 6.38 11268 11378.0 27 2 0.74 6.95
KroC 100 7 13520 13644.0 42 5 3.42 7.49 13792 13999.8 41 1 2.55 8.429 12119 12209.0 33 1 1.22 6.76 12119 12119.0 33 1 1.18 7.2211 11032 11032.0 26 0 0.57 9.82 11032 11074.4 26 0 0.85 6.19
KroD 100 7 13501 13517.6 39 2 4.97 7.61 13501 13635.0 39 2 1.97 8.849 12261 12303.2 31 1 0.62 6.20 12257 12279.6 31 1 1.98 7.7111 11452 11534.0 29 1 2.79 9.43 11409 11450.2 30 1 1.65 7.30
KroE 100 7 15308 15386.8 42 1 2.71 7.05 15471 15767.2 41 0 4.37 8.029 12482 12541.8 32 0 0.42 5.72 12482 12485.0 32 0 1.29 7.1811 11344 11417.8 30 1 2.89 7.40 11344 11373.6 30 1 2.92 6.68
Rd 100 7 6078 6182.8 37 2 0.86 6.78 6078 6199.6 37 2 2.05 7.459 5384 5501.0 30 2 3.54 6.39 5384 5418.8 30 2 2.60 7.1511 4853 4916.6 29 1 1.73 4.14 4853 4867.2 29 1 1.58 6.29
KroA150 7 16947 16974.0 57 4 3.29 13.36 16976 17143.0 56 3 7.22 12.509 15007 15158.6 46 0 2.55 9.47 15000 15136.8 49 3 2.40 11.8011 13580 13709.4 40 2 1.92 7.47 13683 13791.8 41 2 4.76 10.60
KroB 150 7 17621 17776.8 59 1 5.55 11.46 17639 18136.2 60 0 3.15 12.159 15332 15609.8 48 3 3.90 10.68 15383 15556.0 48 3 4.83 11.7811 13554 13582.0 41 2 2.76 7.66 13554 13670.8 41 2 4.96 10.82
KroA 200 7 21337 21415.2 79 3 10.35 20.03 21120 21294.8 78 6 10.09 16.929 17812 17927.0 62 2 6.77 14.37 17832 18186.8 64 5 10.91 14.9711 16290 16517.8 54 4 9.14 12.56 16370 16485.0 53 4 10.41 14.48
KroB 200 7 20628 20808.2 78 2 5.91 20.45 20862 21027.4 77 2 6.62 16.019 18247 18387.6 67 3 4.75 14.88 18260 18448.6 68 3 8.84 14.7911 15888 16150.0 56 3 4.03 11.73 15688 15968.8 56 4 8.01 13.80
Avg 12825.7 12925.0 35 1 2.36 7.50 12706.3 12839.7 35 2 2.97 7.74No.Best 37 36
67

Table 4.6: Comparison of LS1 and LS2 on Integer GCSP with overnight.Instance NC LS1 LS2
BestCost Avg.Cost NB ON Avg.TB Avg.TT BestCost Avg.Cost NB ON Avg.TB Avg.TTEil 51 7 1146 1146.0 19 10 0.60 10.21 1146 1146.0 19 10 0.09 2.81
9 958 980.8 15 5 0.77 8.26 958 968.4 15 5 0.70 3.1511 842 866.8 13 5 1.66 7.85 827 829.4 13 4 0.33 2.90
Berlin 52 7 4969 4981.6 19 11 5.65 9.22 4966 4976.0 18 9 0.66 2.879 4272 4301.2 16 8 3.00 6.74 4272 4324.0 16 8 0.58 2.3511 3962 4149.2 14 8 0.10 8.09 3962 3962.0 14 8 0.12 2.17
St 70 7 1654 1656.2 27 15 2.95 17.46 1655 1655.0 27 14 0.35 4.269 1442 1453.0 23 12 1.07 11.21 1416 1438.6 22 9 0.40 3.7911 1196 1226.8 18 6 1.71 8.30 1196 1213.0 18 6 1.77 3.75
Eil 76 7 1554 1587.0 26 10 6.00 12.37 1562 1578.4 26 10 1.06 4.639 1268 1307.2 21 7 4.23 9.54 1268 1298.2 21 7 1.00 4.2211 1107 1125.6 18 3 4.99 8.01 1107 1110.2 18 4 0.68 4.08
Pr 76 7 53270 56065.2 29 15 1.41 16.58 53266 54142.0 30 16 1.97 4.619 47226 49028.4 26 15 7.40 12.84 46912 47245.8 27 17 0.72 3.9911 44036 46104.0 19 8 0.73 11.47 44028 44029.6 20 10 0.99 3.62
Rat 99 7 2229 2241.8 33 10 3.43 10.24 2229 2259.4 33 10 3.09 6.349 1908 1940.6 27 5 5.58 10.05 1922 1947.0 28 8 3.17 6.1911 1673 1697.2 24 9 3.89 10.84 1650 1686.6 23 6 0.73 5.71
KroA 100 7 12474 12762.4 42 24 10.20 28.73 12006 12322.6 43 26 1.34 6.699 11671 11733.4 34 21 16.59 22.31 11218 11245.2 35 21 1.00 6.2811 10886 10931.8 29 17 6.79 19.91 10665 10700.8 31 17 2.20 5.64
KroB 100 7 12728 12920.6 39 18 7.31 21.13 12273 12530.0 43 25 3.31 7.219 11176 11232.0 34 19 3.11 17.40 11128 11133.2 35 21 3.65 6.5911 10302 10534.6 28 15 5.28 16.54 10302 10409.8 28 15 1.69 6.04
KroC 100 7 12202 12401.6 41 22 11.17 32.46 12043 12269.2 45 27 2.52 6.639 11196 11374.8 33 16 3.63 17.75 11031 11141.0 35 20 1.95 5.7111 10445 10629.2 27 15 2.00 18.27 10299 10406.2 28 15 1.26 5.42
KroD 100 7 11868 12115.4 38 20 5.13 22.28 11725 11827.8 39 20 1.70 6.569 11062 11287.0 31 16 6.55 15.75 10742 10869.6 35 20 2.56 6.1111 10523 10714.0 27 13 4.35 15.30 10404 10469.4 29 16 1.10 5.83
KroE 100 7 13101 13332.4 42 25 6.35 24.37 12689 12859.6 45 28 1.83 6.019 10821 11193.2 34 20 6.03 24.89 10821 10905.0 34 20 1.52 5.6111 10007 10190.6 29 17 4.59 16.30 10007 10136.4 29 17 0.59 5.34
Rd 100 7 5626 5834.2 37 17 4.83 20.75 5570 5645.6 39 20 2.72 6.559 4950 5129.4 32 18 4.24 13.02 5037 5093.2 30 13 0.81 5.8911 4541 4705.8 27 13 4.72 15.30 4514 4581.8 27 12 2.01 5.23
KroA150 7 15341 15483.2 59 32 19.02 41.95 15385 15644.6 60 37 3.34 9.569 13475 13714.2 49 28 6.60 30.64 12944 13288.6 51 28 6.32 10.0711 12151 12399.4 43 25 4.31 21.24 12215 12407.4 44 25 3.31 8.92
KroB 150 7 15825 15964.0 58 31 8.91 32.67 15252 15774.2 61 32 4.47 10.499 13198 13415.8 52 30 21.04 36.04 13139 13372.0 52 31 8.28 9.7811 12418 12933.0 40 24 6.91 28.11 12174 12561.6 44 26 3.46 9.06
KroA 200 7 18093 18186.4 76 39 27.64 47.57 17873 18431.8 82 49 6.32 13.749 15562 15979.4 63 37 10.07 37.55 15782 16141.6 64 35 3.48 12.3611 14873 14933.0 55 30 20.95 30.29 14629 14835.0 56 32 4.41 11.39
KroB 200 7 18119 18436.6 82 46 36.42 56.66 17701 18108.4 85 51 8.09 13.989 16289 16395.4 68 36 28.23 40.13 15766 16264.4 66 37 8.69 12.2711 14217 14705.8 54 26 13.26 29.64 14360 14490.8 56 27 7.99 11.37
Avg 11246.9 11529.7 35 18 7.74 20.50 11125.8 11284.9 36 19 2.51 6.54No.Best 18 40
68

nodes. For each CSP instance (in Table 4.3) we select 10 percent of the nodes randomly
and set their corresponding demands to zero. The behavior of LS1 and LS2 is similar to
that of the earlier CSP instances. Specifically, over the 48 test instances LS1 was strictly
better once, LS2 was strictly better 6 times, and the two methods were tied 41 times.
Overall LS2 runs slightly faster than LS1. For brevity, we have limited the comparison to
the CSP with Steiner nodes.
4.4.5 Analyzing the Quality of LS2 on the Generalized TSP
Overall, LS2 seems to be a better choice than LS1, in that it is more robust than LS1.
It outperforms LS1 on the CSP and the integer GCSP with overnights, while it is tied
with LS1 for the binary GCSP and integer GCSP without overnights. Further, the run
time of LS2 remains fairly stable. However, since we do not have lower bounds or optimal
solutions for the CSP and GCSP instances, it is hard to assess the quality of the solutions.
Noting that the generalized TSP (GTSP) is a special case of the CSP (we explain how
momentarily), we use some well studied GTSP instances in the literature (see Fischetti
et al. [27]) and compare LS2 with eight different heuristics designed specifically for the
GTSP; as well as to the optimal solutions on these instances obtained by Fischetti et
al. [27] using a branch-and-cut method. In the GTSP, the set of nodes in the graph are
clustered into disjoint sets and the goal is to find the minimum length tour over a subset
of nodes so that at least one node from each cluster is visited by the tour. This can be
formulated as a CSP, where each node has unit demand (i.e., ki=1 for each node i) and
each node in a cluster covers every other node in a cluster (and no other nodes). We
executed LS2 on the benchmark GTSP dataset (see Fischetti et al. [27]) by first tuning
its parameters. The tuned parameters of LS2 are configured as follows: J = 300, K = 10,
T = 10, max iter = 50 and 10 independent runs of LS2 were performed. We compared
LS2 to eight other heuristics in the literature that are described below.
• MSA: A Multi-Start Heuristic by Cacchiani et al. [9]
• mrOX: a Genetic Algorithm by Silberholz and Golden [71],
• RACS: a Reinforcing Ant Colony System by Pintea et al. [57],
• GA: a Genetic Algorithm by Snyder and Daskin [72],
• GI3: a composite algorithm by Renaud and Boctor [61],
• NN: a Nearest Neighbor approach by Noon [54],
• FST-Lagr and FST-root: Two heuristics by Fischetti et al. [27].
69

Table 4.7: Comparison of LS1 and LS2 on Steiner CSP.Instance LS1 LS2
Best Cost Avg. Cost NB Avg. TB Avg. TT Best Cost Avg. Cost NB Avg. TB Avg. TTEil 51 163 163.0 8 0.02 1.29 163 163.0 9 0.03 0.69
159 159.40 8 0.38 4.90 159 159.0 9 0.03 0.52147 147.0 7 0.10 2.08 147 147.0 8 0.03 0.57
Berlin 52 3470 3483.60 10 0.09 1.45 3470 3470.0 10 0.33 0.683097 3097.0 7 0.98 4.45 3097 3097.0 7 0.03 0.512956 2959.60 6 0.05 2.46 2956 2956.0 6 0.02 0.54
St 70 288 288.0 11 0.11 1.64 287 287.0 12 0.08 0.89259 259.0 9 0.04 4.53 259 259.0 10 0.06 1.07245 245.80 10 0.46 2.71 245 245.0 10 0.04 0.82
Eil 76 207 211.40 15 0.11 1.64 207 210.0 15 0.25 0.91186 186.40 11 0.76 4.39 185 185.0 10 0.04 0.99169 170.80 10 0.19 2.63 169 169.0 11 0.04 0.92
Pr 76 49773 50566.80 13 0.18 1.61 49773 49773.0 13 0.18 1.1544889 44889.0 12 0.47 4.65 44889 44889.0 12 0.12 1.0842950 43399.20 9 0.34 2.84 42950 42950.0 9 0.05 0.87
Rat 99 483 483.0 17 0.19 1.91 482 482.0 18 0.29 1.54454 454.0 14 0.56 4.38 454 454.0 14 0.09 1.67444 444.40 12 0.76 3.09 444 444.0 12 0.08 1.47
KroA 100 9545 9545.0 18 0.31 2.04 9545 9545.0 18 0.39 1.759112 9112.0 15 0.09 1.72 9112 9112.0 15 0.35 1.558833 8841.40 13 0.23 3.42 8833 8833.0 13 0.08 1.32
KroB 100 9536 9536.0 19 0.33 1.93 9536 9536.0 19 0.37 1.629199 9205.80 15 0.66 1.53 9199 9199.0 15 0.09 1.648763 8763.0 11 0.50 3.55 8763 8763.0 11 0.12 1.61
KroC 100 9591 9591.0 15 0.17 1.97 9590 9590.0 16 0.14 1.729171 9171.0 13 0.70 1.79 9171 9171.0 13 0.27 1.528632 8632.0 13 0.39 3.55 8632 8632.0 13 0.09 1.63
KroD 100 9526 9526.0 19 0.21 1.83 9526 9526.0 19 0.15 1.518885 8885.40 13 0.78 1.87 8885 8885.0 13 0.15 1.838725 8731.40 13 0.77 3.69 8725 8725.0 13 0.10 1.65
KroE 100 9800 9800.0 16 1.06 1.84 9800 9800.0 16 0.16 1.548987 8987.0 13 0.29 2.02 8986 8986.0 14 0.11 1.568450 8450.0 13 0.40 3.85 8450 8450.0 13 0.11 1.70
Rd 100 3412 3412.0 18 0.24 1.83 3412 3434.4 18 0.25 1.603194 3206.80 16 0.43 1.87 3194 3194.0 16 0.31 1.522761 2761.0 12 0.49 3.66 2761 2761.0 12 0.09 1.33
KroA150 10939 10939.0 27 1.97 2.91 10939 11099.6 27 0.85 2.459808 9823.20 23 0.25 2.25 9808 9808.0 23 0.20 2.269360 9382.60 20 1.13 3.46 9360 9360.0 20 0.29 2.30
KroB 150 11225 11288.6 30 1.66 3.08 11225 11240.4 30 1.08 2.4810121 10211.40 24 1.10 2.35 10121 10121.0 24 0.64 2.319542 9556.60 20 0.86 3.54 9542 9542.0 20 0.19 2.55
KroA 200 13042 13042.0 32 3.99 4.28 13227 13268.0 35 1.12 3.6211392 11429.20 27 0.22 2.42 11392 11424.0 27 0.83 3.1810527 10615.80 24 0.51 4.02 10525 10673.8 26 0.79 2.95
KroB 200 13020 13160.20 34 2.24 4.38 13020 13092.0 34 1.77 3.4111712 11788.60 28 0.79 2.63 11712 11837.2 28 1.89 3.3910614 10769.40 28 1.62 3.60 10614 10734.8 28 0.89 2.99
Avg 8911.73 8953.56 16 0.63 2.82 8915.4 8930.9 16 0.33 1.65No.Best 42 47
70

Table 4.8: Comparison of computing times of GTSP methods.Computer Mflops r MethodGateway Profile 4MX 230 1.568 GASun Sparc Station LX 4.6 0.032 GI3, NNHP 9000/720 2.3 0.016 FST-Lagr, FST-Root, B&CUnknown - 1 RACSDell Dimension 8400 290 2 mrOXPentium(R) IV, 3.4 Ghz 295 2.03 MSAOur 145 1 LS2
In order to perform a fair comparison on the running times of the different heuristics, we
scaled the running times for the different computers as indicated in [22]. The computer
factors are shown in Table 4.8. The columns indicate the computer used, solution method
used, Mflops of the computer, and r the scaling factor. Thus the reported running times
in the different papers are appropriately multiplied by the scaling factor r. We note that
an identical approach was taken in [9] to compare across these heuristics for the GTSP.
Since no computer information is available for the RACS heuristic, we use a scaling factor
of 1.
Table 4.9 reports on the comparison. For each instance we report the percentage gap
with respect to the optimal solution value and the computing time (expressed in seconds
and scaled according to the computer factors given in Table 4.8) for all the methods but
for B&C (for which we report only the computing time). Some of the methods (RACS,
GI3, and NN) only reported solutions for 36 of the 41 instances. Consequently, in the last
four rows of Table 4.9 we report for each algorithm, the average percentage gap and the
average running time on the 36 instances tested by all the methods, as well as over all 41
instances (for all methods except RACS, GI3, and NN). We also summarize the number
of times the optimum solution was found by a method. As Table 4.9 indicates, although
LS2 was not explicitly developed for the GTSP (but rather for a generalization of it), it
performs quite creditably. On average it takes 2.2 seconds, finds solutions that are on
average 0.08% from optimality, and found optimal solutions in 30 out of 41 benchmark
GTSP instances.
4.5 Summary and Conclusions
In this chapter we considered the CSP, and introduced a generalization quite different
from earlier generalizations of the CSP in the literature. Specifically, in our generaliza-
tion nodes must be covered multiple times (i.e., we introduce a notion of coverage demand
of a node). This may require a tour to visit a node multiple times (which is not the case
in earlier generalizations), and there are also node visiting costs. We discussed three
71

Table 4.9: Comparison of LS2 against 8 other heuristics on benchmark GTSP instances inthe literature.
Instances LS2 MSA mrOX RACS GA GI3 NN FST-lagr FST-Root B&Cgap time gap time gap time gap gap time gap time gap time gap time gap time time
Att48 0 0.4 0 0 0 0.8 - 0 0 - - - - 0 0 0 0 0.0Gr48 0 0.4 0 0 0 0.6 - 0 0.8 - - - - 0 0 0 0 0.0Hk48 0 0.5 0 0 0 0.6 - 0 0.4 - - - - 0 0 0 0 0.0Eil51 0 0.5 0 0 0 0.6 0 0 0.2 0 0 0 0 0 0 0 0 0.0Brazil58 0 0.6 0 0 0 1.6 - 0 0.4 - - - - 0 0 0 0 0.0St70 0 0.7 0 0 0 0.8 0 0 0.4 0 0 0 0 0 0 0 0.2 0.2Eil76 0 0.8 0 0 0 0.8 0 0 0.4 0 0 0 0 0 0 0 0.2 0.2Pr76 0 0.9 0 0 0 1.0 0 0 0.4 0 0 0 0 0 0 0 0.2 0.2Rat99 0 1.2 0 0 0 1.0 0 0 1.0 0 0.2 0 0.2 0 0 0 0.8 0.8KroA100 0 1.2 0 0 0 1.2 0 0 0.6 0 0.2 0 0.2 0 0 0 0.2 0.2KroB100 0 1.3 0 0 0 1.2 0 0 0.6 0 0.2 0 0 0 0 0 0.4 0.4KroC100 0 1.2 0 0 0 1.2 0 0 0.4 0 0.2 0 0.2 0 0 0 0.2 0.2KroD100 0 1.2 0 0 0 1.4 0 0 0.6 0 0.2 0 0. 0 0 0 0.2 0.2KroE100 0 1.3 0 0 0 1.2 0 0 1.2 0 0.2 0 0 0 0 0 0.2 0.2Rd100 0 1.2 0 0 0 1.0 0 0 0.4 0.08 0.2 0.08 0.2 0.08 0 0 0.2 0.2Eil101 0 1.1 0 0 0 1.0 0 0 0.4 0.4 0.2 0.4 0 0 0 0 0.4 0.4Lin105 0 1.3 0 0 0 1.2 0 0 0.4 0 0.4 0 0.2 0 0 0 0.2 0.2Pr107 0 1.2 0 0 0 1.0 0 0 0.6 0 0.2 0 0.2 0 0 0 0.2 0.2Gr120 0 1.1 0 0 0 1.4 - 0 0.8 - - - - 1.99 0 0 0.6 0.6Pr124 0 1.5 0 0 0 1.4 0 0 1.0 0.43 0.4 0 0.4 0 0 0 0.4 0.4Bier127 0.04 1.6 0 0 0 1.6 0 0 0.8 5.55 1.0 9.68 0.2 0 0.2 0 0.4 0.4Pr136 0 1.8 0 0 0 1.6 0 0 0.8 1.28 0.4 5.54 0.2 0.82 0.2 0 0.6 0.6Pr144 0 1.6 0 0 0 2.0 0 0 0.4 0 0.4 0 0.4 0 0 0 0.2 0.2KroA150 0 2.1 0 0 0 2.0 0 0 2.0 0 0.6 0 0.6 0 0.2 0 1.4 1.5KroB150 0 1.9 0 0 0 2.0 0 0 1.6 0 0.4 0 0.6 0 0.2 0 0.8 0.8Pr152 0 2.0 0 0 0 2.0 0 0 2.4 0.47 0.6 1.8 0.4 0 0.2 0 0.8 1.5U159 0 2.2 0 0 0 2.0 0.01 0 1.0 2.6 0.6 2.79 0.8 0 0.2 0 2.0 2.0Rat195 0 2.5 0 0.2 0 2.8 0 0 1.0 0 1.2 1.29 2.6 1.87 0.2 0 3.5 3.5D198 0.32 3.4 0 0 0 3.2 0.01 0 1.8 0.6 1.8 0.6 3.6 0.48 0.2 0 10.8 10.8KroA200 0 2.8 0 0 0 3.4 0.01 0 4.2 0 0.8 5.25 1.6 0 0.2 0 2.6 2.6KroB200 0 2.7 0 0 0.05 3.2 0 0 2.2 0 1.0 0 4.0 0.05 0.2 0 3.9 3.9Ts225 0 2.9 0 4.3 0.14 3.4 0.02 0 3.9 0.61 2.6 0 3.6 0.09 0.2 0.09 18.5 538.2Pr226 0.09 2.5 0 0 0 3.0 0.03 0 1.6 0 0.8 2.17 2.0 0 0.2 0 1.4 1.4Gil262 0.79 3.6 0 7.1 0.45 7.2 0.22 0.79 3.0 5.03 3.5 1.88 3.6 3.75 0.2 0.89 20.5 94.2Pr264 0.59 3.6 0 0 0 4.8 0 0 2.0 0.36 2.0 5.73 4.5 0.33 0.4 0 4.9 4.9Pr299 0.04 4.5 0 1.4 0.05 9.2 0.24 0.02 9.7 2.23 0.2 2.01 8.5 0 0.4 0 11.6 11.6Lin318 0.01 4.4 0 0 0 16.2 0.12 0 5.5 4.59 6.2 4.92 9.7 0.36 0.8 0.36 12.0 23.8Rd400 0.98 6.2 0 0.6 0.58 29.2 0.87 1.37 5.5 1.23 12.2 3.98 34.7 3.16 0.8 2.97 71.5 99.9Fl417 0.01 5.8 0 0 0.04 16.4 0.57 0.07 3.8 0.48 12.8 1.07 40.8 0.13 1.0 0 237.5 237.5Pr439 0.09 7.1 0 3.9 0 38.2 0.79 0.23 14.4 3.52 18.4 4.02 37.8 1.42 2.0 0 76.9 77.1Pcb442 0.16 6.9 0 1.6 0.01 46.8 0.69 1.31 16.0 5.91 17.0 0.22 25.6 4.22 1.2 0.29 76.1 835.1Average 36 0.09 2.5 0 0.53 0.04 6.12 0.10 0.10 2.58 0.98 2.42 1.48 5.21 0.46 0.26 0.13 15.61 54.32# Opt 36 25 36 29 24 30 19 18 23 31 36Average 41 0.08 2.2 0 0.47 0.03 5.38 0.09 2.31 0.46 0.22 0.11 13.72 47.71# Opt 41 30 41 34 35 27 36 41
72
variants of the GCSP. The binary GCSP where revisiting a node is not permitted, the
integer GCSP without overnights where revisiting a node is permitted only after another
node is visited, and the integer GCSP with overnights where revisiting a node is permit-
ted without any restrictions. We designed two local search heuristics, LS1 and LS2, for
these variants. Overall LS2 appears to be more robust in terms of its running time as
well as its performance in terms of the number of times it found the best solutions in the
different variants. When LS2 is compared to 8 benchmark heuristics for the GTSP (that
were specifically designed for the GTSP), LS2 performs quite well, finding high-quality
solutions rapidly. We introduced two integer programming models for the binary and in-
teger GCSP respectively. However, both these models require considerable strengthening
and embedding in a branch-and-cut framework in order to obtain exact solutions to the
GCSP. This is a natural direction for research on the GCSP (as it will provide an even
better assessment of the quality of heuristics for the GCSP), and we hope researchers
will take up this challenge. Some natural generalizations of the GCSP (along the lines of
the earlier generalizations of the CSP) may be considered in future research. The earlier
generalizations of the CSP (see Vogt et al. [79]) included requirements in terms of (i)
requiring some nodes to be on the tour, (ii) requiring some nodes not to be on the tour,
(iii) allowing a node not to be covered at a cost (for our GCSP that would mean the
covering demand of a node could be partially covered at a cost), and (iv) including a cost
for allocating nodes not on the tour to the tour. These would be natural generalizations
of this multi-unit coverage demand variant of the CSP that we have introduced.
73

Bibliography
[1] Archetti C., Bertazzi L., Hertz A., and Speranza M.G.: A hybrid heuristic for an
inventory-routing problem. Technical Report, n. 317, University of Brescia, Brescia,
Italy (2009).
[2] Archetti C., Speranza M.G., and Savelsbergh M.W.P.: An optimization-based heuris-
tic for the split delivery vehicle routing problem. Transportation Science 42, 22–31
(2008).
[3] Arkin E.M., and Hassin R.: Approximation algorithms for the geometric covering
salesman problem. Discrete Applied Mathematics 55(3), 197-218 (1994).
[4] Balas E. and Ho A.: Set covering algorithms using cutting planes, heuristics, and
subgradient optimization: A computational study. Mathematical Programming 12,
37-60 (1980).
[5] Baldacci R., and Dell’Amico M.: Heuristic algorithms for the design of urban optical
networks. Technical Report, n. 63, Department of Sciences and Methods for Engineer-
ing, University of Modena and Reggio Emilia, Reggio Emilia, Italy (2004).
[6] Baldacci R., Dell’Amico M., and Salazar Gonzalez J.J.: The capacitated m-Ring-Star
Problem. Operations Research 55(6), 1147-1162 (2007).
[7] Brandao J.: A tabu search algorithm for the open vehicle routing problem. European
Journal of Operational Research 157, 552-564 (2004).
[8] Bruggemann T., Monnot J., and Woeginger G.J.: Local search for the minimum label
spanning tree problem with bounded color classes. Operations Research Letters 31,
195-201 (2003).
[9] Cacchiani V., Fernandes Muritiba A.E., Negreiros M., and Toth P.: A multi-start
heuristic for the equality generalized traveling salesman problem. Networks, to appear
(2010).
74

[10] Chang R.-S., and Leu S.-J.: The minimum labeling spanning trees. Information
Processing Letters 63(5), 277-282 (1997).
[11] Chisman J.A.: The clustered traveling salesman problem, Computers & Operations
Research, 2, 115-119 (1975).
[12] Christofides N., Mingozzi A., and Toth P.: The vehicle routing problem. In:
Christofides N., Mingozzi A., Toth P., and Sandi C. (eds.), Combinatorial Optimiza-
tion, pp. 313–338. Wiley, Chichester (1979).
[13] Cerulli R., Fink A., Gentili M., Voß S.: Metaheuristics comparison for the minimum
labelling spanning tree problem. In: Golden B., Raghavan S., and Wasil E. (Eds.), The
Next Wave in Computing, Optimization, and Decision Technologies, Springer-Verlag,
Berlin, 93-106 (2008).
[14] Consoli S., Darby-Dowman K., Mladenovic N., and Moreno-Perez J.A.: Greedy ran-
domized adaptive search and variable neighbourhood search for the minimum labelling
spanning tree problem. European Journal of Operational Research 196(2), 440-449
(2009).
[15] Cordeau J.-F., Laporte G., Savelsbergh M.W.P., and Vigo D.: Vehicle routing. In:
Barnhart C., and Laporte G. (eds.), Transportation. Handbooks in Operations Re-
search and Management Science 14, 367–428. Elsevier, Amsterdam (2007).
[16] Current J.R.: Multi-objective design of Transportation Networks. Ph.D thesis, De-
partment of Geography and Environmental Engineering. The Johns Hopkins Univer-
sity, Baltimore (1981).
[17] Current J.R., and Schilling D.A.: The covering salesman problem. Transportation
Science 23(3), 208-213 (1989).
[18] Danna E., Rothberg E., and Le Pape C.: Exploring relaxation induced neighborhoods
to improve MIP solutions. Mathematical Programming 102, Ser. A, 71–90 (2005).
[19] Dantzig G.B., Fulkerson R., and Johnson S.M.: Solution of a large scale traveling
salesman problem. Operations Research 2, 393-410 (1954).
[20] De Franceschi R., Fischetti M., and Toth P.: A new ILP-based refinement heuristic
for vehicle routing problems. Mathematical Programming 105, 471–499 (2006).
[21] Derigs U., Reuter K.: A simple and efficient tabu search heuristic for solving the
open vehicle routing problem. Journal of the Operational Research Society 60(12),
1658–1669 (2008).
75

[22] Dongarra J.J.: Performance of various computers using standard linear equations
software. Technical Report CS-89-85, Computer Science department, University of
Tennessee (2004).
[23] Eiselt H.A., and Sandblom C.-L.: Integer programming and network models.
Springer, (2000).
[24] Feillet D., Dejax P., Gendreau M., and Gueguen C.: An exact algorithm for the
elementary shortest path problem with resource constraints: Application to some
vehicle routing problems. Networks 44, 216–229 (2004).
[25] Feillet D., Dejax P., and Gendreau M.: Traveling Salesman Problems with Profits.
Transportation Science 39(2), 188-205 (2005).
[26] Fischetti M., and Lodi A.: Local branching. Mathematical Programming 98, Ser. B,
23–47 (2003).
[27] Fischetti M., Salazar Gonzalez J.J. , and Toth P.: A branch-and-cut algorithm for the
symmetric generalized traveling salesman problem. Operations Research 45, 378-394
(1997).
[28] Fischetti M., and Toth P.: An additive approach for the optimal solution of the
prize-collecting traveling salesman problem. In Vehicle Routing: Methods and Studies.
Golden B. L., and Assad A.A., (eds.). North-Holland, Amsterdam, 319-343 (1988).
[29] Fisher M.: Optimal solutions of vehicle routing problems using minimum k-trees.
Operations Research 42, 626–642 (1994).
[30] Fleszar K., Osman I.H., and Hindi K.S.: A variable neighbourhood search for the
open vehicle routing problem. European Journal of Operational Research 195, 803–809
(2009).
[31] Fu Z., Eglese R., and Li L.Y.O.: A new tabu search heuristic for the open vehicle
routing problem. Journal of the Operational Research Society 56, 267-274 (2005).
[32] Fu Z., Eglese R., and Li L.Y.O.: Corrigendum: A new tabu search heuristic for the
open vehicle routing problem. Journal of the Operational Research Society 57, 1018
(2006).
[33] Gendreau M., Hertz A., and Laporte G.: New insertion and postoptimization proce-
dures for the traveling salesman problem. Operations Research 40, 1086-1094 (1992).
76

[34] Gendreau M., Laporte G., and Semet F.: The covering tour problem. Operations
Research 45(4), 568-576 (1997).
[35] Gutin G., and Punnen A.P. (Eds.): The traveling salesman problem and its varia-
tions. Kluwer Academic publishers, Netherlands (2002).
[36] Helsgaum K.: Effective implementation of the Lin-Kerninghan traveling salesman
heuristic. European Journal of Operational Research 126, 106-130 (2000).
[37] Hewitt M., Nemhauser G.L., and Savelsbergh M.W.P.: Combining exact and heuris-
tic approaches for the capacitated fixed charge network flow problem. INFORMS Jour-
nal on Computing, To appear.
[38] Hoshino E.A., and de Souza C.C.: Column generation algorithms for the capaci-
tated m-ring-star problem. Computing and Combinatorics, 14th Annual International
Conference, COCOON, Dalian, China 2008, Proceedings, LNCS, 631-641 (2008).
[39] IBM ILOG Cplex, http://www.ilog.com.
[40] Krumke S.O., and Wirth H.C.: On the minimum label spanning tree problem. Infor-
mation Processing Letters 66(2), 81–85 (1998).
[41] Kruskal J.B.: On the shortest spanning subset of a graph and the traveling salesman
sroblem. In: Proceedings of the American Mathematical Society 7(1), 48–50 (1956).
[42] LabbeM., Laporte G., Martin I.R., and Salazar Gonzalez J.J.: The ring star problem:
polyhedral analysis and exact algorithm. Networks 43(3), 177-189 (2004).
[43] Labbe M., Laporte G., Martin I.R., and Salazar Gonzalez J.J.: Locating median
cycles in networks. European Journal of Operations Research 160, 457-470 (2005).
[44] Laporte G., and Martello S.: The selective traveling salesman problem. Discrete
Applied. Mathematics 26, 193-207 (1990).
[45] Letchford A.N., Lysgaard J., Eglese R.W.: A branch-and-cut algorithm for the ca-
pacitated open vehicle routing problem. Journal of the Operational Research Society
58, 1642–1651 (2007).
[46] Li F., Golden B., Wasil E.: The open vehicle routing problem: Algorithms, large-
scale test problems, and computational results. Computers & Operations Research 34,
2918-2930 (2007).
77

[47] Lin S., and Kernighan B.W.: An effective heuristic algorithm for the traveling sales-
man problem. Operations Research 21, 498-516 (1973).
[48] Magnanti T., Wolsey L.: Optimal trees. In: Ball M., Magnanti T., Monma C.,
and Nemhauser G, (eds.). Network models. Handbooks in operations research and
management science. placeCityAmsterdam: North-Holland 7, 503–615 (1996).
[49] Mauttone A., Nesmachnow S., Olivera A., and Robledo F.: A hybrid metaheuris-
tic algorithm to solve the capacitated m-ring star Problem. International Network
Optimization Conference (2007).
[50] Mladenovic N., and Hansen P.: Variable neighborhood search. Computers & Opera-
tions Research 24, 1097–1100 (1997).
[51] Naji-Azimi Z., Salari M., Golden B., S. Raghavan, Toth P.: The generalized covering
salesman problem. INFORMS Journal on Computing. Submitted for publication.
[52] Naji-Azimi Z., Salari M., Golden B., S. Raghavan, Toth P.: Variable Neighborhood
Search for the Cost Constrained Minimum Label Spanning Tree and Label Constrained
Minimum Spanning Tree Problems. Computers & Operations Research, To appear.
[53] Naji-Azimi Z., Salari M., Toth P.: An integer linear programming based heuristic
approach for the capacitated m-ring-star problem. Technical Report. DEIS, University
of Bologna (2010).
[54] Noon C.E.: The generalized traveling salesman problem, Ph.D. Dissertation, Univer-
sity of Michigan (1988).
[55] Papadimitriou C.H., Steiglitz K.: Combinatorial optimization: algorithms and com-
plexity. placeCityPrentice-Hall, StateNew Jersey (1982).
[56] Pessoa A., Poggi de Aragao M., and Uchoa E.: Robust branch-cut-and-price algo-
rithms for vehicle routing problems. In: Golden B., Raghavan S., Wasil E. (eds.). The
vehicle routing problem: Latest advances and new challenges, 297–325. Springer, New
York (2008).
[57] Pintea C.M., Pop P.C., and Chira C.: The generalized traveling salesman problem
solved with ant algorithms. Journal of Universal Computer Science 13, 1065-1075
(2007).
[58] Pisinger D., Ropke S.: A general heuristic for vehicle routing problems. Computers
& Operations Research 34, 2403–2435 (2007).
78

[59] Prim R.C.: Shortest connection networks and some generalizations. In: placeCityBell
System Technical Journal 36, 1389–1401 (1957).
[60] Reinelt G.: TSPLIB, A traveling salesman problem library. ORSA Journal on Com-
puting 3, 376-384 (1991).
[61] Renaud J., and Boctor F.F.: An efficient composite heuristic for the symmetric
generalized traveling salesman problem. European Journal of Operational Research
108, 571-584 (1998).
[62] Righini G., and Salani M.: New dynamic programming algorithms for the resource
constrained elementary shortest path problem. Networks 51 155–170 (2008).
[63] Salari M., and Naji-Azimi Z.: Introduction to electromagnetism for examination
eimetabling problem and comparison of it with other metaheuristics. Pacific Journal
of Optimization, An International Journal 2(2), 341–366 (2006).
[64] Salari M., Naji-Azimi Z., and Toth P.: A Variable Neighborhood Search and its Ap-
plication to a Ring Star Problem Generalization. International Symposium on Com-
binatorial Optimization, Hammamet, Tunesia, March (2010), Proceedings, Electronic
Notes in Discrete Mathematics, To appear.
[65] Salari M., Naji-Azimi Z., and Toth P.: A heuristic procedure for the capacitated
m-ring-star problem. European Journal of Operational Research. Submitted for pub-
lication.
[66] Salari M., and Tareghian H.R.: Serial and parallel approaches to resource constrained
project scheduling problems. Journal of Management Research 1(1), 32-45 (2009).
[67] Salari M., and Tareghian H.R.: On the optimal frequency and timing of control points
in a projects’s life cycle. International Journal of Industrial Engineering & Production
Research 20(3), 96-102 (2009).
[68] Salari M., Toth P., and Tramontani A.: An ILP improvement procedure for the open
vehicle routing problem. Computer & Operations Research. To appear.
[69] Sariklis D., Powell S.: A heuristic method for the open vehicle routing problem.
Journal of the Operational Research Society 51, 564-573 (2000).
[70] Schrage L.: Formulation and structure of more complex/realistic routing and schedul-
ing problems. Networks 11, 229-232 (1981).
79

[71] Silberholz J., and Golden B.: The generalized traveling salesman problem: a new
genetic algorithm approach, in Baker E.K., Joseph A., Mehrotra A., and Trick
M.A.(eds.) Extending the Horizons: Advances in Computing, Optimization Decision
Technologies, Springer, 165-181 (2007).
[72] Snyder L.V., and Daskin M.S.: A random-key genetic algorithm for the generalized
traveling salesman problem. European Journal of Operational Research 174, 38-53
(2006).
[73] Tarantilis C.D., Diakoulaki D., and Kiranoudis C.T.: Combination of geographical
information system and efficient routing algorithms for real life distribution operations.
European Journal of the Operational Research 152, 437-453 (2004).
[74] Tarantilis C.D., Ioannou G., Kiranoudis C.T., and Prastacos G.P.: A threshold ac-
cepting approach to the open vehicle routing problem. RAIRO Operations Research
38, 345-360 (2004).
[75] Tarantilis C.D., Ioannou G., Kiranoudis C.T., and Prastacos G.P.: Solving the open
vehicle routing problem via a single parameter metaheuristic algorithm. Journal of the
Operational Research Society 56, 588-596 (2005).
[76] Tarjan R.: Depth first search and linear graph algorithms. placecountry-regionSIAM
Journal of Computing 1(2), 215-225 (1972).
[77] Toth P., Tramontani A.: An integer linear programming local search for capacitated
vehicle routing problems. In: Golden B., Raghavan S., Wasil E. (eds.), The Vehicle
Routing Problem: Latest Advances and New Challenges, 275–295. Springer, New York
(2008).
[78] Toth P., and Vigo D.: The vehicle routing problem. SIAM Monographs on Discrete
Mathematics and Applications, Philadelphia (2002).
[79] Vogt L., Poojari CA. and Beasley JE.: A tabu search algorithm for the single vehi-
cle routing allocation problem. Journal of Operational Research Society 58, 467-480
(2007).
[80] Wan Y., Chen G., and Xu Y.: A note on the minimum label spanning tree. Informa-
tion Processing Letters 84, 99-101 (2002).
[81] Wolsey L.A.: Integer programming. Wiley-Interscience Publication (1998).
80

[82] Xiong Y., Golden B., Wasil E., and Chen S.: The label-constrained minimum span-
ning tree problem. In: Raghavan S., Golden B., Wasil E. (Eds.), Telecommunications
Modeling, Policy, and Technology, Springer 39-58 (2008).
[83] Xiong Y., Golden B., and Wasil E.: A one-parameter genetic algorithm for the
minimum labeling spanning tree problem. IEEE Transactions on Evolutionary Com-
putation 9(1), 55-60 (2005a).
[84] Xiong Y., Golden B., and Wasil E.: Worst-case behavior of the MVCA heuristic
for the minimum labeling spanning tree problem. Operations Research Letters 33(1),
77-80 (2005b).
[85] Xiong Y., Golden B., and Wasil E.: Improved heuristics for the minimum label
spanning tree problem. IEEE Transactions on Evolutionary Computation 10(6), 700-
703 (2006).
81