universal sports’ income statement sales$1,050,000 cogs777,000 gross profit$273,000 selling and...
TRANSCRIPT

UNIVERSAL SPORTS’ INCOME STATEMENT
Sales $ 1,050,000
COGS 777,000
Gross Profit $ 273,000
Selling and administrative expense 231,000
Operating income $ 42,000
Tax expense (30%) 12,600
Net Income $ 29,400
What would Universal Sports’ net income be if sales volume increased by 10%?

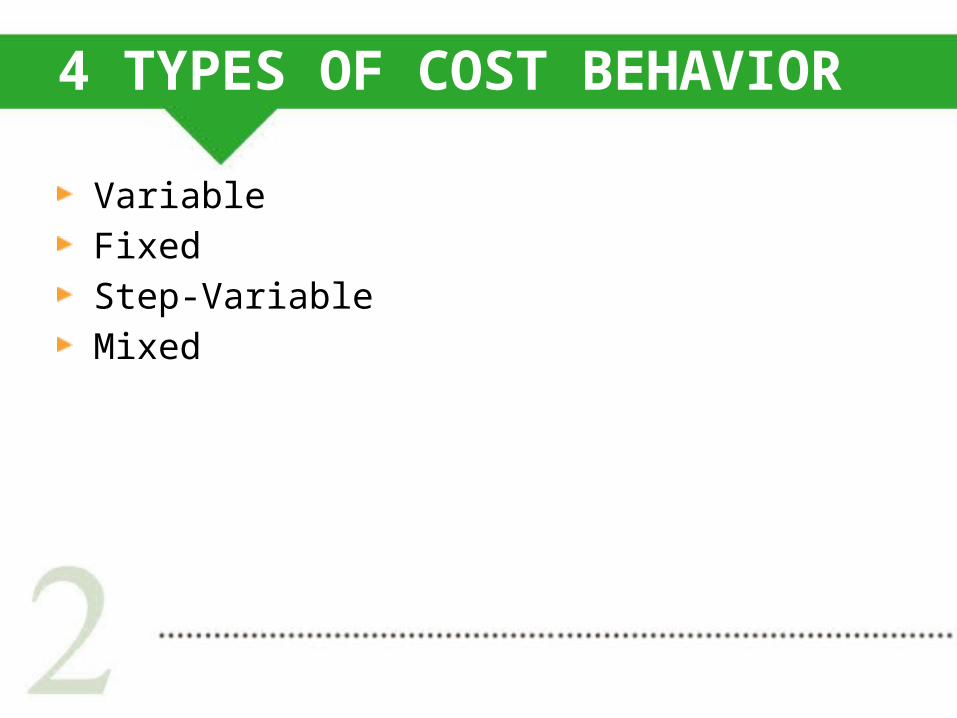
4 TYPES OF COST BEHAVIOR
Variable
Fixed
Step-Variable
Mixed

IT’S TIME FOR A STUDY BREAK!
You’ve been studying for several hours and are getting ready to take a study break, so you break open a nice cold can of soda. Just then the doorbell rings and in come three friends.
© Roman Sigaev/iStockphoto

HERE’S THE DRINK BILL
Friends Cost per can Total cost
1 $0.75 $0.75
2 $0.75 $1.50
3 $0.75 $2.25
4 $0.75 $3.00

VARIABLE COST
1 2 3 4$0.00
$0.50
$1.00
$1.50
$2.00
$2.50
$3.00
$3.50
PeopleTo
tal c
ost o
f sod
as
Total cost varies proportionately with changes in volume
Cost per unit remains constant with changes in volume

LET’S ORDER PIZZA!
The soda didn’t do the trick, so you order two large pizzas from your favorite pizza place. After ordering, more friends begin to arrive and ask to join your study break.
© Lisa Thornberg/iStockphoto

THE PIZZA BILL…
Friends Total cost Cost per person
1 $12.00 $12.00
2 $12.00 $ 6.00
3 $12.00 $ 4.00
4 $12.00 $ 3.00

FIXED COST
Total cost remains constant with changes in volume
Unit cost changes inversely with changes in volume
Fixed relationship only holds over the relevant range
1 2 3 4$0.00
$2.00
$4.00
$6.00
$8.00
$10.00
$12.00
$14.00
PeopleTo
tal c
ost o
f piz
zas

REMEMBER TO KEEP IT CONSTANT
Friends Cost per can Total cost
1 $0.75 $ 0.75
2 $0.75 $ 1.50
3 $0.75 $ 2.25
4 $0.75 $ 3.00
Friends Cost per person Total cost
1 $12.00 $12.00
2 $ 6.00 $12.00
3 $ 4.00 $12.00
4 $ 3.00 $12.00
Variable Cost
Fixed Cost

COMMITTED VS. DISCRETIONARY
Depends on the time frame over which the costs are incurred and fixed.
How quickly can you renegotiate the fixed cost?
What effect will reducing the cost to $0 have on the long-term health of the company?
CEO salary, advertising contract, factory lease, auto lease

WE NEED TO ORDER MORE PIZZA!
Two large pizzas won’t satisfy everyone’s hunger. You need ½ a pizza for each person.
© Vasko Miokovic/iStockphoto

STEP COST
Cost remains fixed in total over small range of volume or activity
These small ranges are smaller than the relevant range of fixed cost
Give some examples1 4 7 10 13 16 19
$0.00
$10.00
$20.00
$30.00
$40.00
$50.00
$60.00
$70.00
PeopleTo
tal c
ost o
f piz
za
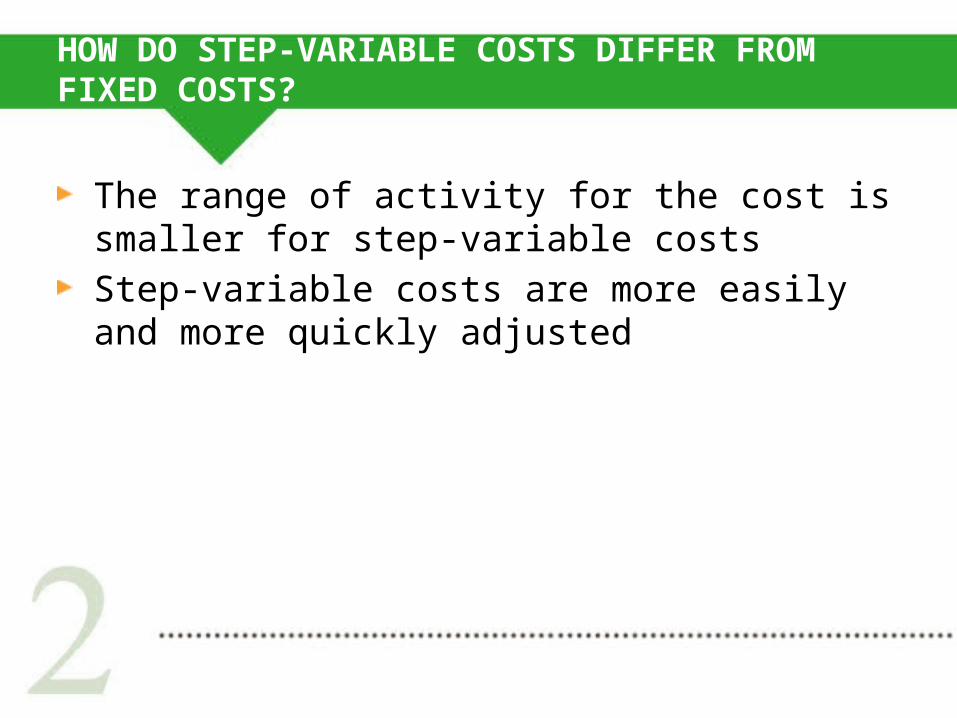
HOW DO STEP-VARIABLE COSTS DIFFER FROM FIXED COSTS?
The range of activity for the cost is smaller for step-variable costs
Step-variable costs are more easily and more quickly adjusted

MIXED COST
Cost contains both fixed and variable components
Total cost AND unit cost varies with changes in volume
Also called semi-variable cost
Examples?1 2 3 4
$11.50
$12.00
$12.50
$13.00
$13.50
$14.00
$14.50
$15.00
$15.50
PeopleTo
tal c
ost o
f piz
za
Fixed component
Variable component
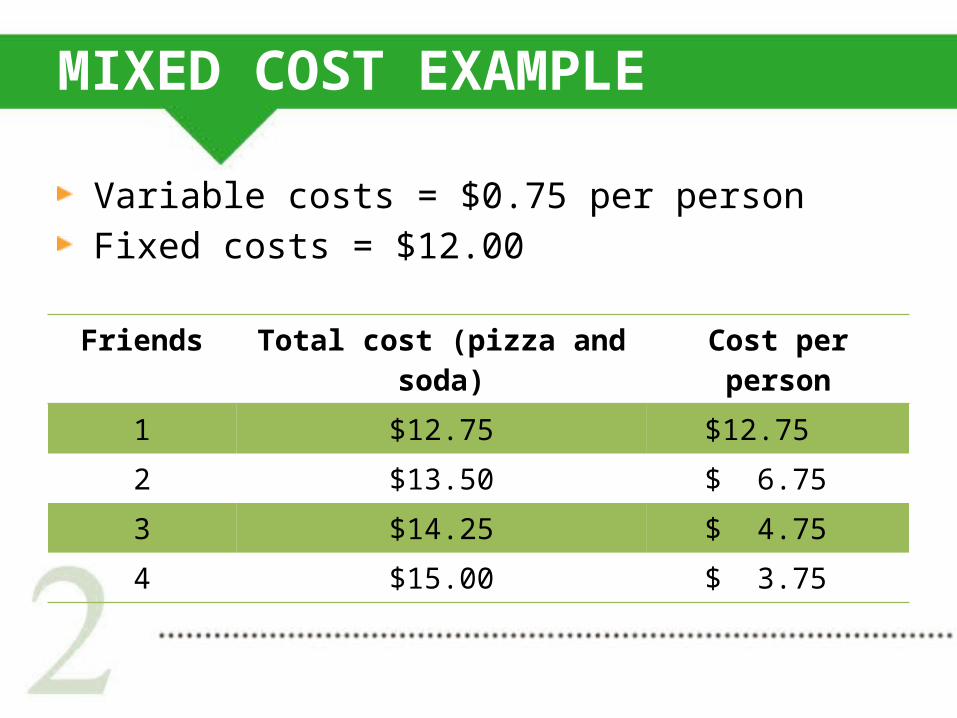
MIXED COST EXAMPLE
Variable costs = $0.75 per person
Fixed costs = $12.00
Friends Total cost (pizza and soda) Cost per person
1 $12.75 $12.75
2 $13.50 $ 6.75
3 $14.25 $ 4.75
4 $15.00 $ 3.75


REVISITING COST BEHAVIOR
How do we break a mixed cost into its fixed and variable components?

REALITY

WHICH LINE BEST ESTIMATES TOTAL COST?

THE SCATTERGRAPH METHOD

USING THE STRAIGHT-LINE COST FORMULA
Where:
y is total cost
m is the variable cost per unit
x is the level of activity (number of units)
b is total fixed cost
y = mx + b

ESTIMATING THE SCATTERGRAPH LINE
y = mx + b
y = + $500$2,600-$500
1,500

THE HIGH-LOW METHOD
This is an algebraic method to break out the fixed and variable components of a mixed cost
Based on two extreme points during a period – the highest activity level and the lowest activity level

THE MECHANICS OF HIGH-LOW
STEP 1: Find the high and low points in terms of activity level
STEP 2: Compute the variable cost per unit
STEP 3: Calculate the fixed cost using either the high point or the low point.
STEP 4: Complete the cost equation y = mx + b.

REGRESSION ANALYSIS
Statistical technique to calculate variable and fixed components of mixed costs
Gives the “best” line that fits a set of cost points
Easy to do with Excel

REGRESSION WITH EXCEL – VARIABLE COST
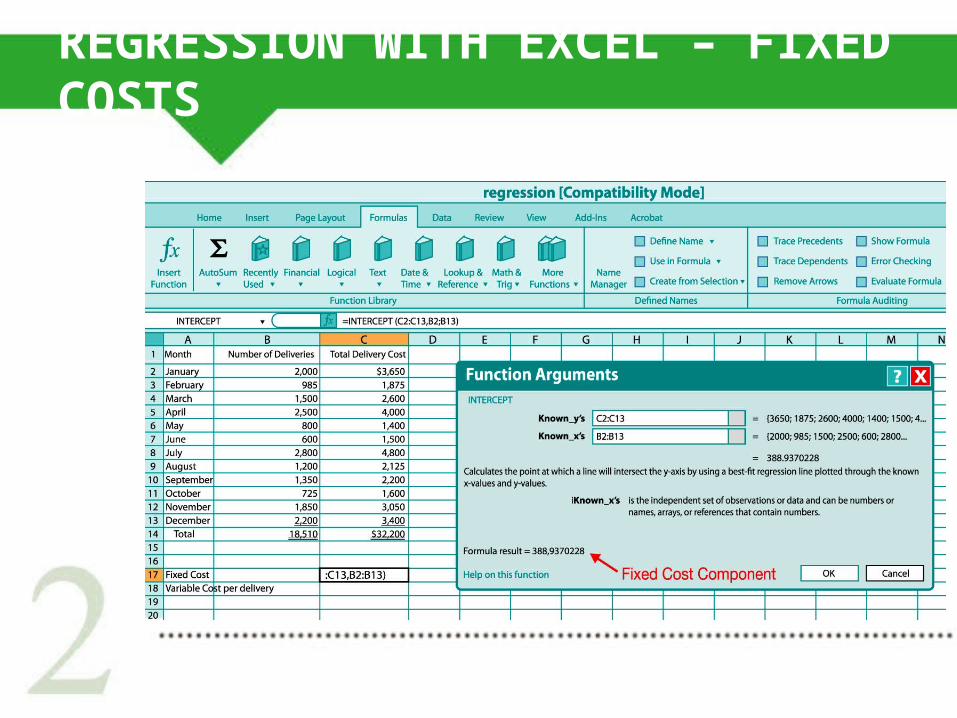
REGRESSION WITH EXCEL – FIXED COSTS
LET’S PRACTICE
Problem 2-16
© Michal Kram/iStockphoto


WHAT IS “CONTRIBUTION MARGIN”?
Sales Revenue – Total Variable Expenses
Contribution margin is the revenue remaining to cover fixed costs and provide profit after variable expenses have been covered
Contribution Margin Ratio =Contribution Margin
Sales
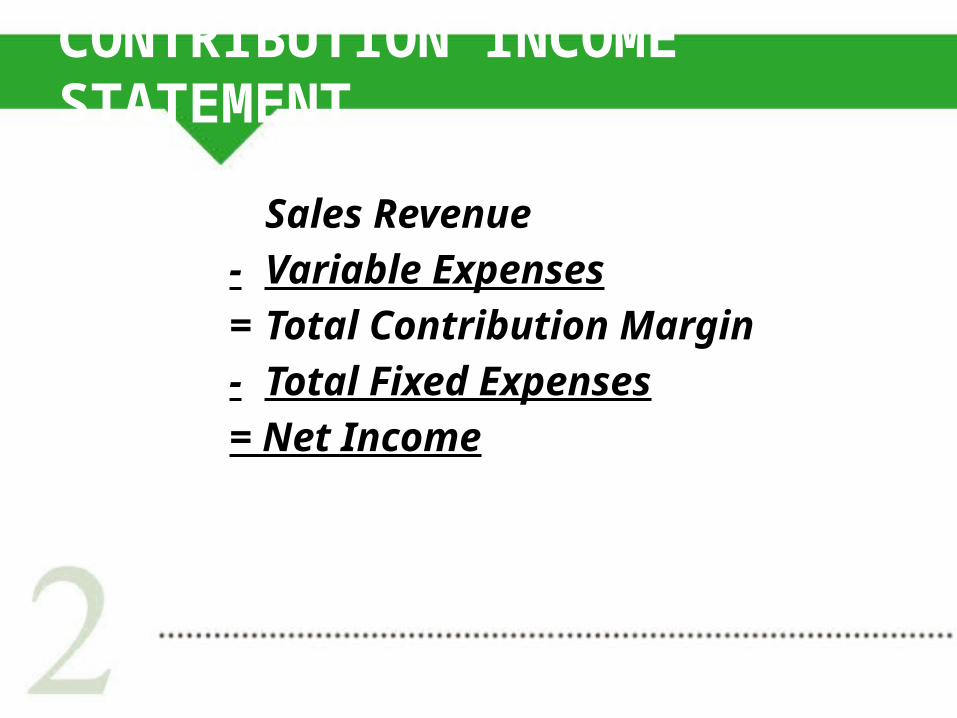
CONTRIBUTION INCOME STATEMENT
Sales Revenue
- Variable Expenses
= Total Contribution Margin
- Total Fixed Expenses
= Net Income

LET’S BUILD A CM INCOME STATEMENT

HERE IT IS…

A BETTER FORMAT