united nations united nations children’s fund · a/65/5/add.2 united nations united nations...
TRANSCRIPT
A/65/5/Add.2
United Nations
United Nations Children’s Fund
Financial report and audited financial statements
for the biennium ended 31 December 2009
and
Report of the Board of Auditors
General Assembly Official Records Sixty-fifth Session Supplement No. 5B

United Nations Children’s Fund
Financial report and audited financial statements
for the biennium ended 31 December 2009
and
Report of the Board of Auditors
General Assembly Official Records Sixty-fifth Session Supplement No. 5B
United Nations • New York, 2010

A/65/5/A
dd.2

Note
Symbols of United Nations documents are composed of capital letters combined with figures. Mention of such a symbol indicates a reference to a United Nations document.
ISSN 0251-8317
iii
[14 July 2010]
Contents Chapter Page
Letters of transmittal . . . . . . . . . . . . . . . . . . . . . . . . . . . . . . . . . . . . . . . . . . . . . . . . . . . . . . . . . . . . v
I. Report of the Board of Auditors on the financial statements: audit opinion. . . . . . . . . . . . . . . . 1
II. Long-form report of the Board of Auditors . . . . . . . . . . . . . . . . . . . . . . . . . . . . . . . . . . . . . . . . . 3
Summary . . . . . . . . . . . . . . . . . . . . . . . . . . . . . . . . . . . . . . . . . . . . . . . . . . . . . . . . . . . . . . . . . . . . . 3
A. Mandate, scope and methodology . . . . . . . . . . . . . . . . . . . . . . . . . . . . . . . . . . . . . . . . . . . . . 8
B. Findings and recommendations . . . . . . . . . . . . . . . . . . . . . . . . . . . . . . . . . . . . . . . . . . . . . . . 9
1. Follow-up of previous recommendations . . . . . . . . . . . . . . . . . . . . . . . . . . . . . . . . . . . 9
2. Financial overview . . . . . . . . . . . . . . . . . . . . . . . . . . . . . . . . . . . . . . . . . . . . . . . . . . . . . 12
3. Progress towards the implementation of the International Public Sector Accounting Standards. . . . . . . . . . . . . . . . . . . . . . . . . . . . . . . . . . . . . . . . . . . . . . . . . . . 13
4. Statement of income and expenditure . . . . . . . . . . . . . . . . . . . . . . . . . . . . . . . . . . . . . . 14
5. Statement of assets, liabilities and reserves and fund balances. . . . . . . . . . . . . . . . . . 18
6. End-of-service liabilities, including after-service health insurance . . . . . . . . . . . . . . 20
7. Results-based management/budgeting . . . . . . . . . . . . . . . . . . . . . . . . . . . . . . . . . . . . . 25
8. Cash transfers . . . . . . . . . . . . . . . . . . . . . . . . . . . . . . . . . . . . . . . . . . . . . . . . . . . . . . . . . 27
9. Programme and project management . . . . . . . . . . . . . . . . . . . . . . . . . . . . . . . . . . . . . . 30
10. Procurement and contract management . . . . . . . . . . . . . . . . . . . . . . . . . . . . . . . . . . . . 33
11. Non-expendable property management. . . . . . . . . . . . . . . . . . . . . . . . . . . . . . . . . . . . . 36
12. Inventory management . . . . . . . . . . . . . . . . . . . . . . . . . . . . . . . . . . . . . . . . . . . . . . . . . . 38
13. Human resources management . . . . . . . . . . . . . . . . . . . . . . . . . . . . . . . . . . . . . . . . . . . 39
14. Consultants, experts and temporary assistance. . . . . . . . . . . . . . . . . . . . . . . . . . . . . . . 41
15. Information technology . . . . . . . . . . . . . . . . . . . . . . . . . . . . . . . . . . . . . . . . . . . . . . . . . 42
16. Enterprise resource planning systems . . . . . . . . . . . . . . . . . . . . . . . . . . . . . . . . . . . . . . 43
17. Internal audit function . . . . . . . . . . . . . . . . . . . . . . . . . . . . . . . . . . . . . . . . . . . . . . . . . . 44
18. Internal audit findings . . . . . . . . . . . . . . . . . . . . . . . . . . . . . . . . . . . . . . . . . . . . . . . . . . 45
19. Revenue-producing activities . . . . . . . . . . . . . . . . . . . . . . . . . . . . . . . . . . . . . . . . . . . . 47
20. Travel management. . . . . . . . . . . . . . . . . . . . . . . . . . . . . . . . . . . . . . . . . . . . . . . . . . . . . 51
iv
C. Disclosures by management . . . . . . . . . . . . . . . . . . . . . . . . . . . . . . . . . . . . . . . . . . . . . . . . . . 52
1. Write-off of losses of cash, receivables and property . . . . . . . . . . . . . . . . . . . . . . . . . 52
2. Ex gratia payments . . . . . . . . . . . . . . . . . . . . . . . . . . . . . . . . . . . . . . . . . . . . . . . . . . . . . 53
3. Cases of fraud and presumptive fraud. . . . . . . . . . . . . . . . . . . . . . . . . . . . . . . . . . . . . . 53
D. Acknowledgement. . . . . . . . . . . . . . . . . . . . . . . . . . . . . . . . . . . . . . . . . . . . . . . . . . . . . . . . . . 53
Annexes
I. UNICEF offices audited during the biennium 2008-2009 . . . . . . . . . . . . . . . . . . . . . . . . . . 54
II. Status of implementation of recommendations for the biennium ended 31 December 2007 . . . . . . . . . . . . . . . . . . . . . . . . . . . . . . . . . . . . . . . . . . . . . . . . . . . . . . . . . 55
III. Financial report for the biennium ended 31 December 2009 . . . . . . . . . . . . . . . . . . . . . . . . . . . . 64
IV. Financial statements for the biennium ended 31 December 2009 . . . . . . . . . . . . . . . . . . . . . . . . 66
A. Financial statements . . . . . . . . . . . . . . . . . . . . . . . . . . . . . . . . . . . . . . . . . . . . . . . . . . . . . . . . 66
Statement I. Income and expenditure and changes in reserves and fund balances. . . . . . . 66
Statement II. Assets, liabilities, reserves and fund balances . . . . . . . . . . . . . . . . . . . . . . . . 68
Statement III. Cash flow. . . . . . . . . . . . . . . . . . . . . . . . . . . . . . . . . . . . . . . . . . . . . . . . . . . . . 69
Statement IV. Statement of appropriations . . . . . . . . . . . . . . . . . . . . . . . . . . . . . . . . . . . . . . 70
Statement V. Income/receipts, expenditure/disbursements and changes in fund balances. . . 71
Statement VI. Status of funding for approved programmes and appropriations . . . . . . . . 72
Statement VII. Statement of approved programmes and appropriations, expenditure and unspent balances for regular resources, other resources (regular) and other resources (emergency) . . . . . . . . . . . . . . . . . . . . . . . . . . . . . . . . . . . . . . . . . . . . . . . . . . . . . . . . . . . . . . . 73
Statement VII.1. Statement of approved programmes and appropriations, expenditure and unspent balances for regular resources. . . . . . . . . . . . . . . . . . . . . . . . . . . . . . . . . . . . . . 78
Statement VII.2. Statement of approved programmes, expenditure and unspent balances for other resources (regular). . . . . . . . . . . . . . . . . . . . . . . . . . . . . . . . . . . . . . . . . . . . . . . . . . 82
Statement VII.3. Statement of approved programmes, expenditure and unspent balances for other resources (emergency) . . . . . . . . . . . . . . . . . . . . . . . . . . . . . . . . . . . . . . . . . . . . . . 86
B. Schedules to the financial statements . . . . . . . . . . . . . . . . . . . . . . . . . . . . . . . . . . . . . . . . . . 90
Schedule 1. Contributions received or pledged . . . . . . . . . . . . . . . . . . . . . . . . . . . . . . . . . . 90
Schedule 2. Contributions receivable for regular resources, other resources (regular) and other resources (emergency) . . . . . . . . . . . . . . . . . . . . . . . . . . . . . . . . . . . . . . . . . . . . . . . . . 98
Schedule 3. Receipts, disbursements and changes in trust fund balances . . . . . . . . . . . . . 101
C. Notes to the financial statements . . . . . . . . . . . . . . . . . . . . . . . . . . . . . . . . . . . . . . . . . . . . . . 102
Annexes
I. Income and expenditure and changes in reserves and fund balances for the years ended 31 December 2008 and 31 December 2009 . . . . . . . . . . . . . . . . . . . . . . . . . . . . . . . . . . . . . . . . . . 116
II. Glossary . . . . . . . . . . . . . . . . . . . . . . . . . . . . . . . . . . . . . . . . . . . . . . . . . . . . . . . . . . . . . . . . . . . . . . 118
v
Letters of transmittal
31 March 2010
Pursuant to United Nations Children’s Fund financial regulation 13.3, enclosed are the financial report and statements for the biennium 2008-2009. These statements have been prepared and signed by the Comptroller.
Copies of these financial statements are also being transmitted to the Advisory Committee on Administrative and Budgetary Questions.
(Signed) Ann M. Veneman Executive Director
The Chair of the Board of Auditors United Nations New York

vi
30 June 2010
I have the honour to transmit to you the report of the Board of Auditors on the financial statements of the United Nations Children’s Fund for the biennium ended 31 December 2009.
(Signed) Terence Nombembe Auditor-General of South Africa
Chair, United Nations Board of Auditors
The President of the General Assembly of the United Nations New York
A/65/5/Add.2
1 10-45045
Chapter I Report of the Board of Auditors on the financial statements:
audit opinion
We have audited the accompanying financial statements of the United Nations Children’s Fund for the biennium ended 31 December 2009, which comprise the statement of assets, liabilities, reserves and fund balances as at 31 December 2009 (statement II); the statement of income and expenditure and changes in reserve and fund balances (statement I); the statement of cash flow (statement III); the statement of appropriations (statement IV); statements V to VII; and the supporting statements, schedules and explanatory notes. The audit did not cover annexes I and II to the financial statements.
Management’s responsibility for the financial statements
The Comptroller of the United Nations Children’s Fund is responsible for the preparation and fair presentation of these financial statements in accordance with the United Nations system accounting standards, and for such internal control as management deems necessary to permit the preparation of financial statements that are free from material misstatement, whether due to fraud or error.
Auditor’s responsibility
Our responsibility is to express an opinion on these financial statements based on our audit. We conducted our audit in accordance with the International Standards on Auditing. Those standards require that we comply with ethical requirements and plan and perform the audit to obtain reasonable assurance as to whether the financial statements are free from material misstatement.
An audit includes performing procedures to obtain audit evidence about the amounts and disclosures in the financial statements. The procedures selected depend on the auditor’s judgement, including the assessment of the risks of material misstatement of the financial statements, whether due to fraud or error. In making those risk assessments, the auditor considers internal control relevant to the entity’s preparation and fair presentation of the financial statements in order to design audit procedures that are appropriate in the circumstances, but not for the purpose of expressing an opinion on the effectiveness of the entity’s internal control. An audit also includes evaluating the appropriateness of accounting policies used and the reasonableness of accounting estimates made by management, as well as evaluating the overall presentation of the financial statement.
We believe that the audit evidence we have obtained is appropriate and sufficient to provide a basis for our audit opinion.
Opinion
In our opinion, the financial statements present fairly, in all material respects, the financial position of the United Nations Children’s Fund as at 31 December 2009 and its financial performance and cash flows for the period then ended, in accordance with the United Nations system accounting standards.
A/65/5/Add.2
10-45045 2
Report on other legal and regulatory requirements
Furthermore, in our opinion, the transactions of the United Nations Children’s Fund that have come to our notice, or which we have tested as part of our audit, have in all significant respects been in accordance with the Financial Regulations and Rules of the United Nations Children’s Fund and legislative authority.
In accordance with article XIV of the Financial Regulations and Rules of the United Nations Children’s Fund and the related annex, we have also issued a long-form report on our audit of the United Nations Children’s Fund.
(Signed) Terence Nombembe Auditor-General of South Africa
Chair of the United Nations Board of Auditors
(Signed) Liu Jiayi Auditor-General of China
(Lead Auditor)
(Signed) Didier Migaud First President of the Court of Accounts of France
30 June 2010

A/65/5/Add.2
3 10-45045
Chapter II Long-form report of the Board of Auditors
Summary
The Board of Auditors has audited the financial statements and reviewed the operations of the United Nations Children’s Fund (UNICEF) for the biennium ended 31 December 2009. The audit was carried out through field visits to six regional offices and 11 country offices, as well as a review of the financial transactions and operations at headquarters in New York, Geneva, Copenhagen and Florence, Italy. The audit did not cover annexes I and II to the financial statements.
Audit opinion
The Board issued an unmodified audit opinion on the financial statements for the period under review (see chapter I).
Follow-up of previous recommendations
Of the 38 recommendations made for the biennium 2006-2007, 26 (68 per cent) were fully implemented and 12 (32 per cent) were under implementation. Details regarding the status of implementation of the recommendations are shown in annex II. The Board noted a 17 per cent decrease in the implementation rate compared with that in the previous biennium. The Board also determined the age of the 12 recommendations under implementation and noted that they were first made in 2006-2007.
Financial overview
For the period under review, total income was $6.61 billion, compared with $5.75 billion for the previous biennium, an increase of 15 per cent. Total expenditure amounted to $6.32 billion, compared with $5.1 billion for the previous biennium, an increase of 24 per cent. This resulted in an excess of income over expenditure of $0.29 billion, compared with an excess of $0.65 billion in the preceding biennium.
A total of 75 per cent of the increase in income was attributed to the increase in voluntary contributions from Governments and intergovernmental agencies. The increase in expenditure of $1.22 billion was due mainly to the increase in programme assistance expenditure of $1.11 billion.
Progress towards the implementation of the International Public Sector Accounting Standards
UNICEF, together with other United Nations agencies, had originally planned to adopt the International Public Sector Accounting Standards (IPSAS) in 2010. However, in June 2009, the UNICEF Executive Board took note of a proposal to defer the full implementation of IPSAS until 2012, based on a review of organizational initiatives, primarily the synchronization with the introduction of new enterprise resource planning systems (“One ERP”) and the related financial implications. The Fund’s IPSAS communication and training plan had not been updated according to the new timeline for full IPSAS adoption.

A/65/5/Add.2
10-45045 4
Statement of income and expenditure
According to the UNICEF basic cooperation agreement with Governments, Government partners are required to submit annual audited financial statements to UNICEF. From the 15 country offices sampled, there was no evidence that audited financial statements had been received for the period under review.
UNICEF recognized its cash transfers to implementing partners in advance of the actual programme implementation as expenditures when the cash transfers were disbursed, which is not in keeping with the principle of the accrual basis of accounting for expenditure. This matter had previously been drawn to the attention of UNICEF.
End-of-service liabilities, including after-service health insurance
End-of-service liabilities as at 31 December 2009 amounted to $578.28 million, compared with $568.36 million as at the end of the previous biennium, an increase of $9.92 million. This increase was due mainly to the revaluation of unused vacation days and repatriation benefits using actuarial calculations, as well as the inclusion of active staff in the determination of UNICEF after-service health insurance liabilities.
In its previous report, the Board noted that UNICEF had not provided for its end-of-service liabilities (including after-service health insurance) but disclosed those liabilities in the notes to the financial statements. Accordingly, the Board had recommended that UNICEF consider disclosing its end-of-service liabilities on the face of the financial statements. For the period under review, however, UNICEF continued to disclose its end-of-service liabilities in the notes to the financial statements. In addition, the census data used in the computation of end-of-service liabilities was partly outdated.
Results-based management/budgeting
UNICEF presented the biennium support budget for 2008-2009 using a results-based budgeting format. Some of the results, however, were not specific, measurable, attainable, relevant and time-bound and some of the indicators were not measurable. Furthermore, there were no budget estimates for each result nor were activities defined for each result. In addition, some weaknesses were observed in relation to the extension of programme budget allotments. These included: (a) high extension rates of programme budget allotments; (b) untimely submission of some programme budget allotment extension requests; and (c) the absence of established mechanisms to monitor the timeliness of the submission of programme budget allotment extension requests by field offices.
Cash transfers
As at 31 December 2009, a total amount of $507.86 million in cash transfers remained outstanding, of which amounts totalling $4.51 million had been outstanding for more than nine months. In addition, at some field offices, acknowledgement receipts for cash transfers were not obtained from implementing partners, and some acknowledgement receipts were not attached to the related payment vouchers.

A/65/5/Add.2
5 10-45045
Programme and project management
Of the 260 completed evaluation reports for 2009, 163 (63 per cent) were not uploaded to the UNICEF online evaluation database within the three-month time frame specified for the completion of reports, while 45 (or 43 per cent) of the 105 completed evaluation reports for 2008 were not rated by the Evaluation Office within the six-month time frame, as required by the UNICEF evaluation policy (E/ICEF/2008/4).
Procurement and contract management
A number of deficiencies in relation to competitive bidding were noted. In particular, written solicitation documents were sent only to two suppliers, which was not in compliance with the requirements of the UNICEF Supply Manual. In addition, in some procurement cases, the lowest-bid principle was not followed and there were no adequate justifications. Solicitation documents were also sent to suppliers who were not pre-qualified. Furthermore, in some field offices, procured items were delivered beyond the due dates and there were no penalty clauses for late delivery.
Non-expendable property management
As at 31 December 2009, the total value of non-expendable property amounted to $155.84 million, a 9 per cent increase compared with the balance of $142.61 million in the previous biennium. In a physical count conducted by UNICEF at its New York headquarters, 1,005 items, amounting to $3.24 million, could not be located. In addition, some discrepancies were noted between the results of physical counts and database records at headquarters and some field offices.
Inventory management
At the Supply Division, the reports on programme supplies about to expire were not submitted to the Property Survey Board on a monthly basis as required by the Division’s procedures. There were also delays in the approval by the Director of the Supply Division based on the Property Survey Board recommendations relating to the programme supplies about to expire.
Human Resources Management
As at 31 December 2009, 1,898 (18 per cent) of the 10,518 approved posts were vacant. In 13 field offices and headquarters divisions, the vacancy rates were more than 30 per cent. The high vacancy rates could adversely affect the capacity of UNICEF to implement the planned activities. In addition, at UNICEF headquarters and some field offices, the performance evaluation reports were not completed within the time frame set out in the UNICEF Human Resources Manual. Furthermore, no office/division was responsible for monitoring the completion status of performance evaluation reports.
Enterprise resource planning systems
UNICEF planned to roll out the “One ERP” system to all its offices by the end of 2011. The project was in the phases of realization and upgrading of global infrastructure. Those two phases covered six major tasks: system development, system testing, updating the regulatory framework, training preparation and
A/65/5/Add.2
10-45045 6
development, preparing for the roll-out of the system and setting up and developing support capacity. However, some of the activities relating to updating the regulatory framework were not being carried out in a timely manner.
Internal audit function
According to the 2008-2009 office management plan of the Office of Internal Audit, there should be no recommendations outstanding for more than 18 months. As at 31 March 2010, there were still seven audit recommendations outstanding for more than 18 months relating to the regional offices and Headquarters audits.
Internal audit findings
During the biennium 2008-2009, the Office of Internal Audit conducted 50 audits of country offices and issued 730 audit observations. A total of 18 headquarters, systems and thematic audits were also carried out during the period under review.
The key observations made during the audits of country offices included: (a) weak strategic planning and priority setting; (b) lack of a systematic approach to risk management; (c) weaknesses in human resources strategy and recruitment; (d) deficiencies in relation to the assessment of implementing partners’ capacities; (e) weakness in evaluation functions; (f) insufficient knowledge of the situation of children and weak advocacy for children’s rights; (g) weaknesses in the processing of financial transactions and the implementation of financial controls; (h) deficiencies in the procurement of supplies and the selection of suppliers; and (i) deficiencies in the management of inventory and assets.
The key observations made in the headquarters, systems and thematic audits included: (a) lack of sufficient guidance and support for efficient operation functions in country offices; (b) weaknesses in treasury management; (c) deficiencies in relation to the management of evaluation in country offices; (d) weaknesses in oversight and operations support to the country offices and the management of internal operations in the regional offices; and (e) weaknesses in the management of the information and communication technology function in country offices.
Revenue-producing activities
There was a decline in the proportion of regular resources to overall income, as well as a decrease in thematic funds as a percentage of other resources. This could affect the capacity of UNICEF to provide continued leadership on child-related priorities and its ability to realize its medium-term strategic plan for the period 2006-2011.
According to the standard cooperation agreement between the National Committees and UNICEF, each National Committee may be authorized to retain up to 25 per cent of its revenue. However, 24 National Committees had overall retention rates of more than 25 per cent in both 2008 and 2009.
While the percentage of donor reports submitted on time by country offices increased from 77 per cent in 2007 to 82 per cent in 2009, in 10 offices, 155 sampled donor reports were submitted after the due dates, with delays ranging from 1 day to 437 days.
A/65/5/Add.2
7 10-45045
Disclosures by management
Management made certain disclosures, set out in section C of the present report as regards write-off of losses of cash, receivables and property, and cases of fraud and presumptive fraud.
Recommendations The Board has made a number of recommendations based on its audit. The main recommendations are that UNICEF:
(a) Update its IPSAS communication and training plan according to the new timeline for full IPSAS adoption;
(b) Review its current practice of obtaining assurance on programme expenditures and take appropriate measures to obtain such assurance to ensure the validity of the programme expenditures;
(c) Consider amending its Financial Regulations to ensure that under the accounting treatment in relation to cash transfers, such transfers provided in advance to the implementing partners are recorded as advances and are recognized as programme expenditure only until the appropriate financial utilization reports have been received;
(d) Revise its accounting policy and disclose its end-of-service liabilities on the face of the financial statements in conjunction with the adoption of IPSAS;
(e) Take appropriate measures to ensure the accuracy of the data used in the computation of end-of-service liabilities (including after-service health insurance) in future financial periods;
(f) Develop training courses for staff members in respect of results-based budgeting methodology; include in future budget submissions resource estimates, as well as activities, for each expected result; and establish a monitoring mechanism to facilitate the tracking of budget implementation as well as progress towards the achievement of results;
(g) Provide necessary support to the offices with higher extension rates to improve programme implementation; and put in place measures to monitor the timeliness of the submission of requests for programme budget allotment extensions by field offices;
(h) Intensify its efforts to settle long-outstanding cash transfers;
(i) Ensure that its field offices comply with financial circular 15 on the issuance of official receipts by the recipients of cash transfers;
(j) Ensure that all the completed evaluation reports are submitted and rated in a timely manner in accordance with the provisions of the UNICEF evaluation policy (E/ICEF/2008/4);
(k) Strictly comply with the provisions in the Supply Manual in relation to competitive bidding and maintain written justifications in related files for exceptions;
(l) Ensure that all offices include in purchase orders a penalty clause for late delivery in accordance with the provisions in the UNICEF Supply Manual;
A/65/5/Add.2
10-45045 8
(m) Take appropriate measures to improve its management of non-expendable property, including ensuring the completeness and accuracy of the non-expendable property records;
(n) Ensure that the Supply Division adhere strictly to Supply Division procedure 006 to deal with stock materials nearing the end of their shelf life;
(o) Review the need for posts that have been vacant for a long period; and take appropriate measures to fill the remaining vacancies;
(p) Adhere strictly to the provisions of the UNICEF Human Resources Manual in relation to performance evaluation; and establish a mechanism to monitor the overall completion rate of performance evaluation reports;
(q) Expedite the implementation of the “One ERP” project in accordance with its project plan;
(r) Accelerate the implementation of the internal audit recommendations stemming from headquarters and regional office audits;
(s) Strengthen advocacy and communication with current and potential donors to increase regular resources and global thematic funds;
(t) Adhere strictly to the provisions of the UNICEF Financial Regulations and Rules in relation to the retention of income by National Committees;
(u) Determine the cause of the delays in donor reporting by field offices and institute measures to ensure that reports are submitted in accordance with donor agreements.
The Board’s other recommendations appear in paragraphs 40, 45, 50, 54, 58, 75, 84, 106, 115, 138, 142, 145, 149, 153, 168, 172, 181, 188, 192, 200, 211, 216, 220, 222, 247, 255, 258, 261, and 267 of the present report.
A. Mandate, scope and methodology
1. The Board of Auditors has audited the financial statements of the United Nations Children’s Fund and has reviewed its operations for the financial period from 1 January 2008 to 31 December 2009 in accordance with General Assembly resolution 74 (I) of 1946. The audit was conducted in conformity with article XIV of the UNICEF Financial Regulations and Rules and the annex thereto, as well as the International Standards on Auditing. Those standards require that the Board comply with ethical requirements and plan and perform the audit to obtain reasonable assurance as to whether the financial statements are free from material misstatement. The audit did not cover annexes I and II to the financial statements.
2. The audit was conducted primarily to enable the Board to form an opinion as to whether the financial statements presented fairly the financial position of UNICEF as at 31 December 2009 and the results of its operations and cash flows for the financial period then ended in accordance with the United Nations system accounting standards. This included an assessment as to whether the expenditure recorded in the financial statements had been incurred for the purposes approved by the governing bodies and whether income and expenditure had been properly classified and
A/65/5/Add.2
9 10-45045
recorded in accordance with UNICEF Financial Regulations and Rules. The audit included a general review of financial systems and internal controls and a test examination of the accounting records and other supporting evidence to the extent that the Board considered necessary to form an opinion on the financial statements.
3. In addition to auditing the accounts and financial transactions, the Board reviewed UNICEF operations under UNICEF financial regulation 12.5. This requires the Board to make observations with respect to the efficiency of the financial procedures, the accounting system, the internal financial controls and, in general, the administration and management of UNICEF operations. The General Assembly had also requested the Board to follow up on previous recommendations and to report to it accordingly. Those matters are addressed in the relevant sections of the present report.
4. The Board continued to report the results of audits to UNICEF in the form of management letters containing detailed observations and recommendations. This practice allowed for ongoing dialogue with the administration. In this regard, 20 management letters were issued covering the period under review.
5. The Board coordinated with the UNICEF Office of Internal Audit in the planning of its audits in order to avoid duplication of effort and to determine the extent of reliance that could be placed on the latter’s work.
6. Where observations in the present report refer to specific locations, such observations are limited to those locations.
7. The present report covers matters that, in the opinion of the Board, should be brought to the attention of the General Assembly, including specific requests from the General Assembly and the Advisory Committee on Administrative and Budgetary Questions.
8. The Board’s observations and conclusions were discussed with the administration, whose views have been appropriately reflected in the report.
9. The recommendations contained in the present report do not address steps which UNICEF may wish to consider in respect of officials for instances of non-compliance with its Financial Regulations and Rules, administrative instructions and other related directives.
B. Findings and recommendations
1. Follow-up of previous recommendations
10. Of the 38 recommendations made by the Board for the biennium 2006-2007, 26 (68 per cent) had been fully implemented and 12 (32 per cent) were under implementation. Details of the status of implementation of the recommendations are shown in annex II. With regard to the previous biennium, 85 per cent of the recommendations had been fully implemented; 14 per cent were under implementation; and 1 per cent had not been implemented. This represented a decrease in the implementation rate for the biennium 2006-2007 compared with that for the previous biennium. UNICEF explained that some of the recommendations made for the biennium 2006-2007 related to different areas and would take longer and require more effort to implement.
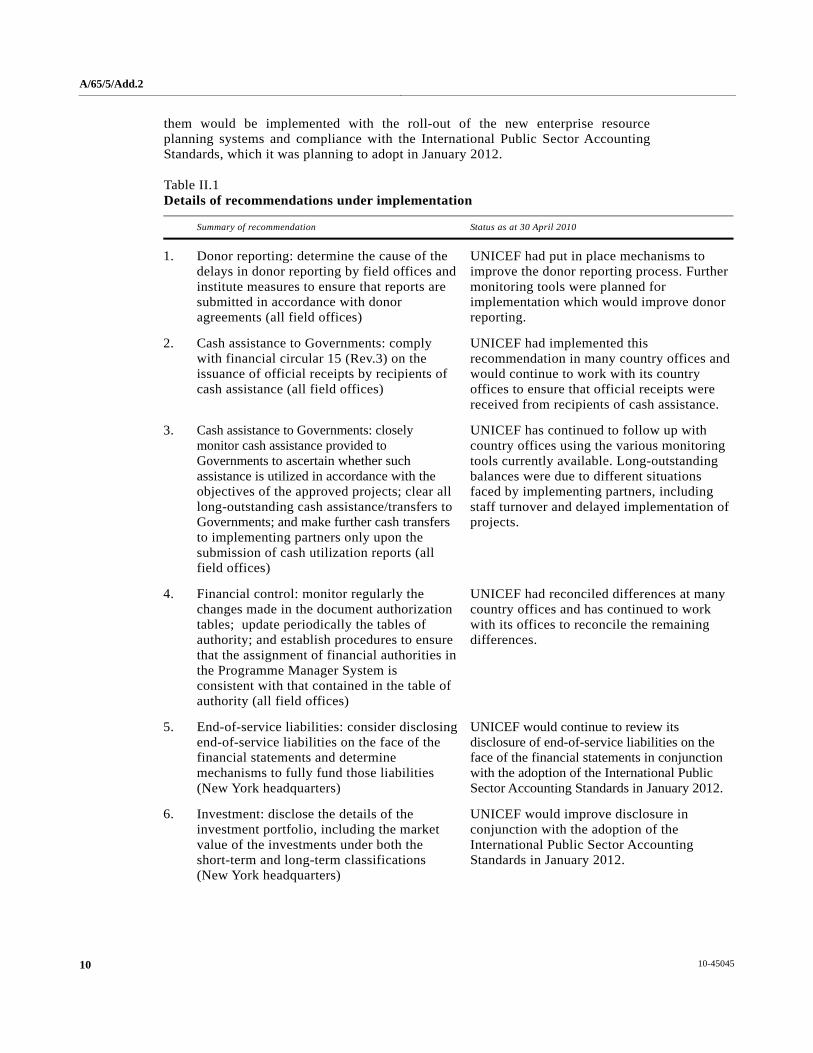
11. With respect to the 12 recommendations for the 2006-2007 biennium which were still under implementation (see table II.1), UNICEF indicated that most of
A/65/5/Add.2
10-45045 10
them would be implemented with the roll-out of the new enterprise resource planning systems and compliance with the International Public Sector Accounting Standards, which it was planning to adopt in January 2012.
Table II.1 Details of recommendations under implementation
Summary of recommendation Status as at 30 April 2010
1. Donor reporting: determine the cause of the delays in donor reporting by field offices and institute measures to ensure that reports are submitted in accordance with donor agreements (all field offices)
UNICEF had put in place mechanisms to improve the donor reporting process. Further monitoring tools were planned for implementation which would improve donor reporting.
2. Cash assistance to Governments: comply with financial circular 15 (Rev.3) on the issuance of official receipts by recipients of cash assistance (all field offices)
UNICEF had implemented this recommendation in many country offices and would continue to work with its country offices to ensure that official receipts were received from recipients of cash assistance.
3. Cash assistance to Governments: closely monitor cash assistance provided to Governments to ascertain whether such assistance is utilized in accordance with the objectives of the approved projects; clear all long-outstanding cash assistance/transfers to Governments; and make further cash transfers to implementing partners only upon the submission of cash utilization reports (all field offices)
UNICEF has continued to follow up with country offices using the various monitoring tools currently available. Long-outstanding balances were due to different situations faced by implementing partners, including staff turnover and delayed implementation of projects.
4. Financial control: monitor regularly the changes made in the document authorization tables; update periodically the tables of authority; and establish procedures to ensure that the assignment of financial authorities in the Programme Manager System is consistent with that contained in the table of authority (all field offices)
UNICEF had reconciled differences at many country offices and has continued to work with its offices to reconcile the remaining differences.
5. End-of-service liabilities: consider disclosing end-of-service liabilities on the face of the financial statements and determine mechanisms to fully fund those liabilities (New York headquarters)
UNICEF would continue to review its disclosure of end-of-service liabilities on the face of the financial statements in conjunction with the adoption of the International Public Sector Accounting Standards in January 2012.
6. Investment: disclose the details of the investment portfolio, including the market value of the investments under both the short-term and long-term classifications (New York headquarters)
UNICEF would improve disclosure in conjunction with the adoption of the International Public Sector Accounting Standards in January 2012.
A/65/5/Add.2
11 10-45045
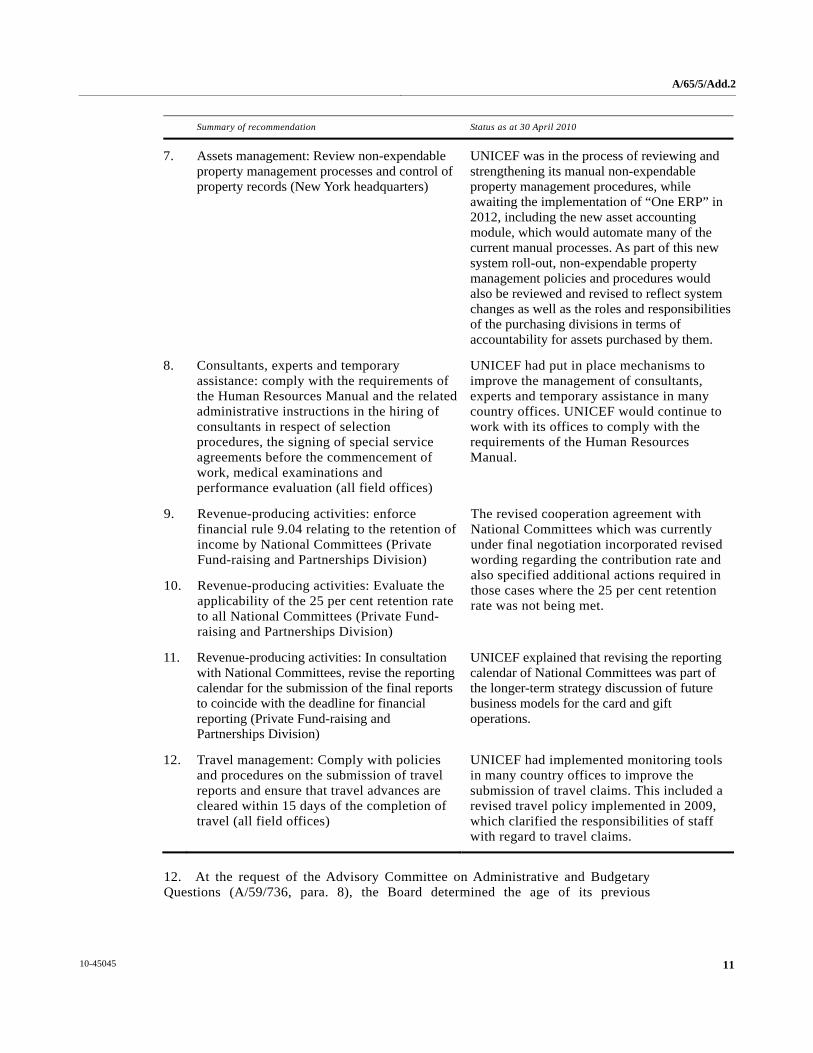
Summary of recommendation Status as at 30 April 2010
7. Assets management: Review non-expendable property management processes and control of property records (New York headquarters)
UNICEF was in the process of reviewing and strengthening its manual non-expendable property management procedures, while awaiting the implementation of “One ERP” in 2012, including the new asset accounting module, which would automate many of the current manual processes. As part of this new system roll-out, non-expendable property management policies and procedures would also be reviewed and revised to reflect system changes as well as the roles and responsibilities of the purchasing divisions in terms of accountability for assets purchased by them.
8. Consultants, experts and temporary assistance: comply with the requirements of the Human Resources Manual and the related administrative instructions in the hiring of consultants in respect of selection procedures, the signing of special service agreements before the commencement of work, medical examinations and performance evaluation (all field offices)
UNICEF had put in place mechanisms to improve the management of consultants, experts and temporary assistance in many country offices. UNICEF would continue to work with its offices to comply with the requirements of the Human Resources Manual.
9. Revenue-producing activities: enforce financial rule 9.04 relating to the retention of income by National Committees (Private Fund-raising and Partnerships Division)
10. Revenue-producing activities: Evaluate the applicability of the 25 per cent retention rate to all National Committees (Private Fund-raising and Partnerships Division)
The revised cooperation agreement with National Committees which was currently under final negotiation incorporated revised wording regarding the contribution rate and also specified additional actions required in those cases where the 25 per cent retention rate was not being met.
11. Revenue-producing activities: In consultation with National Committees, revise the reporting calendar for the submission of the final reports to coincide with the deadline for financial reporting (Private Fund-raising and Partnerships Division)
UNICEF explained that revising the reporting calendar of National Committees was part of the longer-term strategy discussion of future business models for the card and gift operations.
12. Travel management: Comply with policies and procedures on the submission of travel reports and ensure that travel advances are cleared within 15 days of the completion of travel (all field offices)
UNICEF had implemented monitoring tools in many country offices to improve the submission of travel claims. This included a revised travel policy implemented in 2009, which clarified the responsibilities of staff with regard to travel claims.
12. At the request of the Advisory Committee on Administrative and Budgetary Questions (A/59/736, para. 8), the Board determined the age of its previous

A/65/5/Add.2
10-45045 12
recommendations and noted that all 12 recommendations under implementation were first made in 2006-2007.
2. Financial overview
13. Total income for the period under review amounted to $6.61 billion, while total expenditure was $6.32 billion, giving an excess of income over expenditure of $286.24 million. Comparative income and expenditures for the financial periods 2004-2005, 2006-2007 and 2008-2009 are shown in figure II.1.
Figure II.1 Comparative income and expenditure (Billions of United States dollars)
14. For the biennium 2008-2009, income totalled $6.61 billion, compared with $5.75 billion for the biennium 2006-2007, an increase of $0.86 billion, or 15 per cent. A total of 75 per cent of the increase was attributed to the increase in voluntary contributions from Governments and intergovernmental agencies, which rose from $3.35 billion for the biennium 2006-2007 to $3.99 billion for the biennium 2008-2009. The increase in expenditure of $1.22 billion (24 per cent) was due mainly to the increase in programme assistance expenditure of $1.11 billion, from $4.64 billion for the biennium 2006-2007 to $5.75 billion for the biennium 2008-2009.
15. As shown in table II.2, an improvement was noted in the ratio of unliquidated obligations to total liabilities, while slight decreases were observed in the other two ratios relating to cash/total assets and cash/total liabilities. The decreases were due mainly to the reduction in cash and term deposits by $91.34 million (4 per cent).
4.72
3.79
5.755.10
6.61 6.32
0
1
2
3
4
5
6
7
2004-2005 2006-2007 2008-2009Income Expenditure

A/65/5/Add.2
13 10-45045
Table II.2 Ratios of key financial indicators
Biennium ended 31 December
Ratio 2007 2009 Component of 2009 ratioa
Cash/total assetsb 0.65 0.56 2 138.49/3 800.07
Cash/total liabilitiesc 2.79 2.45 2 138.49/871.53
Unliquidated obligations/total liabilitiesd 0.34 0.30 264.38/871.53
a In millions of United States dollars. b A high indicator reflects a healthy financial position. c A low indicator is a reflection of insufficient cash available to settle debts. d A low indicator is a positive reflection of obligations being liquidated.
16. As at 31 December 2009, investment amounted to $838.95 million, compared with $445 million as at 31 December 2007, an increase of 89 per cent. The investment income for the biennium 2008-2009 amounted to $49.95 million.
3. Progress towards the implementation of the International Public Sector Accounting Standards
17. In accordance with resolution 61/233 and in response to the comments made by the Advisory Committee on Administrative and Budgetary Questions in its relevant report (A/61/350), the Board again conducted a gap analysis relating to the implementation of the International Public Sector Accounting Standards (IPSAS) at UNICEF.
Project governance and organization
18. The General Assembly, in its resolution 60/283, approved of the adoption of IPSAS. UNICEF, together with other United Nations agencies, had originally planned to adopt the Standards in 2010. The IPSAS project shares a project board with the “One ERP” project. The project board comprises divisional directors and field representatives and is chaired by the Deputy Executive Director, Management. A project implementation team was established comprising one project manager and two IPSAS specialists. In September 2008, the project board approved the project charter, in which the objectives and scope of the project were defined.
19. In June 2009, the UNICEF Executive Board took note of the proposal to defer the full adoption of IPSAS until 2012, based on a review of organizational initiatives, primarily the synchronization with the introduction of “One ERP” and the related financial implications. In July 2009, the project charter was updated to reflect the revision of the strategy to achieve full IPSAS adoption by 2012. The project implementation team was expanded to include divisional coordinators for the “One ERP” project and IPSAS focal points in key divisions where significant policy development and implementation work was needed.
IPSAS implementation
20. In its previous report (A/63/5/Add.2 and Corr.1, chap. II, para. 120), the Board noted that UNICEF had no IPSAS adoption plan, and it had recommended that UNICEF develop a plan detailing the various steps to be taken leading to the full

A/65/5/Add.2
10-45045 14
implementation of IPSAS by 2010. The Board reviewed the efforts undertaken by UNICEF to implement this recommendation and noted that a high-level implementation approach had been approved by the project board, that a detailed policy development plan had been produced and implemented and that detailed implementation plans were being produced. At the time of audit, 16 main policy position papers had been finalized and endorsed by the project board.
21. The UNICEF IPSAS communication and training plan had not been updated according to the new timeline for full IPSAS adoption. The Board is of the view that the success of the implementation of IPSAS will to a large extent depend on the careful monitoring of the various milestones leading to its full implementation, including communication with relevant stakeholders, as well as training of staff members.
22. UNICEF agreed with the Board’s recommendation that it update its IPSAS communication and training plan according to the new timeline for full IPSAS adoption.
23. UNICEF commented that the main communication activities in the existing plan for 2010 remained unchanged. The communication component of the plan would therefore be extended until 2011 accordingly. UNICEF was producing a detailed training plan that would incorporate the IPSAS element.
4. Statement of income and expenditure
Audited financial statements of implementing partners
24. As provided in the standard basic cooperation agreement between UNICEF and Governments, the Government shall, as soon as possible, but in any event within 60 days after the end of each of the UNICEF financial years, submit to UNICEF progress reports on the programme of cooperation and certified financial statements, audited in accordance with existing Government rules and procedures.
25. The Board was not provided with relevant information regarding the number of Government partners and related programme expenditure that are subject to the requirement for audited financial statements. In addition, from the 15 country offices sampled, there was no evidence that audited financial statements had been obtained from Government partners in the biennium 2008-2009.
26. The Board recommends that UNICEF review its current practice of obtaining assurance on programme expenditures and take appropriate measures to obtain such assurance to ensure the validity of the programme expenditures.
27. UNICEF commented that according to the Framework for Cash Transfers to Implementing Partners, approved by the United Nations Development Group in September 2005, the funding authorization and certificate of expenditures form is intended to replace all other documentation used by partners for requesting funds and reporting expenditure. UNICEF further commented that, since under the harmonized approach to cash transfers all implementing partners are required to submit certification of actual expenditures on a regular basis, requesting annual certified financial statements from partners would entail an additional administrative burden (and cost).
A/65/5/Add.2
15 10-45045
28. Notwithstanding the explanation given by UNICEF, the Board remains of the view that the funding authorization and certificate of expenditures form is the internal document for reporting on the utilization of cash transfers and that it would be more appropriate for UNICEF to obtain independent external assurance on the validity of the programme expenditures through audited financial statements.
Accounting treatment for cash transfers to implementing partners
29. Paragraph 4 of the United Nations system accounting standards provides that the accrual basis is one of the fundamental accounting assumptions applied in the United Nations system, and the accrual basis of accounting for expenditure in each financial period means that costs are recognized when obligations arise or liabilities are incurred and not when payments are made. As indicated in note 2 to the financial statements, all expenditures of UNICEF are accounted for on an accrual basis, except for certain expenditures relating to staff entitlements.
30. For the biennium 2008-2009, the total programme expenditure of UNICEF amounted to $5.75 billion, of which $1.68 billion represented cash transfers to implementing partners provided as cash assistance to governments or cash transfers to implementing partners under a direct cash transfer modality. These were disbursed in advance of programme implementation and were recorded as expenditure instead of as advances. That practice is contrary to the principle of the accrual basis of accounting for expenditure.
31. This matter was subject to comments by the Board as reflected in its report for the biennium 1994-1995. The Board stated that the recording of cash assistance to implementing partners as programme expenditure at the time funds were advanced to Governments was contrary to the (then) definition of programme expenditure in the UNICEF Financial Regulations. The Board recommended that UNICEF review its accounting policy with regard to cash assistance made in advance to implementing partners.
32. In September 1999, the UNICEF Executive Board decided to maintain its existing accounting policy and modified the UNICEF Financial Regulations accordingly. For the biennium 2000-2001, the Board reiterated its concern about the Fund’s accounting policy on this matter and recommended that UNICEF change its Financial Regulations to ensure that cash advances would not be reflected as programme expenditure until the relevant financial utilization reports had been received.
33. UNICEF explained that, as the ownership of the cash had already been completely transferred to the recipients at the time the disbursement was made, the cash was treated as expenditure instead of as an advance and that that practice was compliant with the UNICEF Financial Regulations and Rules. UNICEF further indicated that under its current business model, its contribution to a country programme might take many forms, including cash assistance. The Government owns the country programme and controls the programme inputs transferred to it, including cash assistance.
34. Under current UNICEF practice, when cash is transferred to implementing partners and recorded as expenditure, a monitoring record is maintained in the UNICEF Programme Manager System, which is closed (liquidated) only upon the receipt of the report on the utilization of cash received. In addition, cash transfers
A/65/5/Add.2
10-45045 16
normally cover the needs for a period of no longer than three months of estimated expenditure. The recipients of cash transfers are responsible for submitting financial utilization reports to UNICEF, and future payments are contingent upon their submission. When the actual expenditure is lower than the disbursed amount, the remainder is either transferred to other activities or returned to UNICEF. The actual amount of expenditure is determined only upon the submission of the financial utilization reports by the implementing partners. In the biennium 2008-2009, a total of $82.48 million in unspent programme funds was transferred to other activities or returned to UNICEF.
35. A request for a refund of unused money implies that the significant rewards and risks of ownership of the funds have not been transferred to the implementing partners at the time when the payments are made. Therefore, the charging of advances made to implementing partners as final expenditure is contrary to the accrual basis of accounting.
36. The Board recommends that UNICEF consider amending its Financial Regulations to ensure that under the accounting treatment in relation to cash transfers, such transfers provided in advance to the implementing partners are recorded as advances and are recognized as programme expenditure only until the appropriate financial utilization reports have been received.
Handling fee income from procurement services
37. The Supply Division renders procurement services to assist Governments and development agencies in providing essential supplies for children. According to an executive directive (CF/Exd/2007-004), UNICEF should charge a handling fee at the minimum amount to cover necessary costs in the provision of procurement services.
38. The Supply Division indicated that the average handling fee rates in 2008 and 2009 charged on all procurement service orders were 3.95 per cent and 3.94 per cent of the turnover, respectively. According to note 9 to the financial statements, during the financial period under review, UNICEF received a total amount of $38.68 million in handling fees, while the related expenses of providing procurement services totalled $25.87 million, giving an excess of $12.81 million, reflected as miscellaneous income in the financial statements. This practice is not in keeping with the requirement of charging handling fees at the minimum level to cover UNICEF costs.
39. UNICEF explained that indirect costs were also incurred at New York headquarters and related field offices for procurement services which were not directly charged to handling fees. Since UNICEF could not identify the indirect costs relating to the provision of procurement services separately, the appropriateness of the current handling fee rate could not be validated.
40. The Board recommends that UNICEF review its costing methodology on the provision of procurement services so that indirect costs can be appropriately allocated and charged to the handling fee income.
Inconsistencies between the table of authority, the document authorization table and the bank signatory panel
41. At UNICEF, the authorizing, certifying, approving and paying authorities are set out in the table of authority, which is the basis of the document authorization

A/65/5/Add.2
17 10-45045
table in the Programme Manager System. Any amendments to the document authorization table are based on changes made in the table of authority. Signatories for bank accounts are ordinarily designated as the paying officers.
42. In its previous report (A/63/5/Add.2 and Corr.1, chap. II, paras. 62 to 68), the Board noted that there were inconsistencies between the table of authority and the document authorization table, and it had recommended that UNICEF ensure that the assignment of financial authorities in the Programme Manager System was consistent with that defined in the table of authority. The Board reviewed the efforts undertaken by UNICEF to implement that recommendation and noted that inconsistencies between the table of authority and the document authorization table still existed in some field offices, as set out below:
(a) At the Madagascar country office, there were 17 inconsistencies between assigned authorities in the document authorization table and the table of authority. In addition, the office had no process for the periodic review of the document authorization table. The nature of the discrepancies between the table of authority and the document authorization table could therefore not be identified;
(b) At the Nepal country office, 12 staff members had different levels of authority relating to budget verification and allocation in the table of authority and the document authorization table. In addition, nine staff members were authorized to allocate annual workplan funds in the table of authority but were not identified in the document authorization table. Furthermore, the levels of authority of another four staff members listed in the document authorization table were not defined in the table of authority;
(c) At the Yemen country office and the Western and Central Africa Regional Office, the tables of authority in use had not been updated since May 2007 and April 2008, respectively. Four staff members had separated from the regional office, although they were still listed as paying officers in the table of authority. The failure to update the table of authority in a timely manner had also resulted in some discrepancies between the document authorization table and the table of authority. For example, at the Yemen country office, the authorization limit on cash requisition for both the representative and the operations officer was $5 million in the document authorization table, while their authorization limits in the table of authority were $1 million and $50,000, respectively.
43. In addition, three staff members at the Nepal country office and two staff members at the Western and Central Africa Regional Office, who were designated as bank signatories, were not authorized as paying officers in the table of authority as required by financial circular 9 (Rev. 3) and Add.1.
44. The discrepancies between the table of authority and the document authorization table, and between the table of authority and the signatory panel could expose the offices to unauthorized transactions.
45. The Board reiterates its previous recommendation that UNICEF ensure that all field offices monitor and update the document authorization table, the table of authority and the signatory panel in a timely manner to ensure their consistency.
46. UNICEF commented that it recognized the importance of maintaining accurate tables of authority, document authorization tables and signatory panels, and that it

A/65/5/Add.2
10-45045 18
had rectified the discrepancies at the offices in question. UNICEF would continue to remind offices of their responsibilities.
Approving control over freight invoices
47. Certification and approval of freight invoices in the Supply Division were delegated to its Logistics Centre through the table of authority. According to the Logistics Centre’s standard operation procedure relating to freight invoice certification, the Logistics Assistant stamps and initials the invoice. For freight invoices of $50,000 and over, the Shipping Officer must also sign and stamp the invoice; thus, for freight invoices of less than $50,000, no approval is required before payments are made.
48. The total value of freight invoices of less than $50,000 amounted to $54.34 million and $49.71 million in 2008 and 2009, respectively. The Board reviewed a sample of 24 freight invoices for less than $50,000 and confirmed that, although they had been certified, they had not been signed by the approving officer.
49. UNICEF explained that certification and approval functions were combined for freight invoices of less than $50,000. The combining of certification and approval functions is not in compliance with the provisions of UNICEF financial circular 34 relating to segregation of duties. In addition, the absence of approving control on freight invoices of less than $50,000 could weaken financial control over expenditure.
50. The Board recommends that UNICEF (a) strictly comply with the provisions of UNICEF financial circular 34 relating to segregation of duties between the certification and approval functions; and (b) establish approving control over freight invoices of less than $50,000.
5. Statement of assets, liabilities and reserves and fund balances
Accounts receivable from and payable to other United Nations agencies
51. As at 31 December 2009, UNICEF accounts receivable from and payable to other United Nations agencies amounted to $3.98 million and $11.28 million, respectively. There were, however, significant differences between the balances recorded in UNICEF accounts and those confirmed by the agencies (see tables II.3 and II.4).
Table II.3 Accounts receivable: differences between UNICEF and other United Nations agencies as at 31 December 2009 (United States dollars)
Recorded by UNICEF Confirmed by agencies Difference
Agencies (a) (b) (c)=(a)-(b)
United Nations Headquarters 1 555 045.20 0 1 555 045.20
Office for the Coordination of Humanitarian Affairs 624 706.52 0 624 706.52
United Nations Development Programme 707 398.11 0 707 398.11
United Nations Human Settlements Programme 314 060.91 0 314 060.91
Total 3 201 210.74 0 3 201 210.74

A/65/5/Add.2
19 10-45045
Table II.4 Accounts payable: differences between UNICEF and other United Nations agencies as at 31 December 2009 (United States dollars)
Recorded by UNICEF Confirmed by agencies Difference
Agencies (a) (b) (c)=(a)-(b)
United Nations Headquarters 5 835 643.57 2 017 411.45 3 818 232.12
United Nations Development Programme 0 4 731 448.18 -4 731 448.18
World Health Organization 1 673 660.43 2 105 681.00 -432 020.57
United Nations Population Fund 1 681 655.41 0 1 681 655.41
Total 9 190 959.41 8 854 540.63 336 418.78
52. The Board verified the balance of the accounts payable to the United Nations Population Fund (UNFPA) by reviewing the supporting documents relating to the payment of $1,681,655.41 made by UNICEF in January 2010. The Board was unable to verify the other differences between UNICEF and other United Nations agencies as shown in tables II.3 and II.4. UNICEF explained that the other differences were due mainly to variations in timing and the delayed preparation and transmission of information relating to inter-agency transactions at year-end. UNICEF further indicated that reconciliation and recovery activities were initiated early in 2009 with four of the six agencies identified and that it would continue to coordinate with those agencies to settle the outstanding account balances.
53. The failure to reconcile accounts receivable and payable balances with other United Nations agencies could result in disputes and hence affect the accuracy of the balances reflected in the accounts of UNICEF.
54. UNICEF agreed with the Board’s recommendation that it intensify its efforts to reconcile its accounts receivable and payable balances with other United Nations agencies.
Disclosure of accounting policy for landholdings
55. Paragraph 49 (v) of the United Nations system accounting standards states that the value of land and buildings should be disclosed and the method of valuation (cost, valuation, or nominal) should be clearly stated.
56. In its previous report (A/63/5/Add.2 and Corr.1, chap. II, paras. 92 to 95), the Board noted that parcels of land were not recorded in UNICEF accounts and were not disclosed in the financial statements. Accordingly, the Board had recommended that UNICEF carry out a comprehensive inventory of all of its landholdings and reconcile the results with the related asset records.
57. The Board reviewed the efforts undertaken by UNICEF to implement that recommendation and noted that UNICEF had conducted a global inventory of all office buildings, staff housing and land owned, donated to or leased by UNICEF and had reconciled the results with the relevant asset records. UNICEF indicated that as at 31 December 2009, it had received three parcels of land (in Burundi, Zimbabwe, and Haiti) free of charge and that the costs of those lands were reported as zero under the item “buildings” in the financial statements. However, there was no

A/65/5/Add.2
10-45045 20
disclosure in the notes to the financial statements of this value or of the basis of the valuation as required by the United Nations system accounting standards.
58. UNICEF agreed with the Board’s recommendation that it disclose the value of all land under its control as well as the basis of the valuation in the notes to the financial statements.
6. End-of-service liabilities, including after-service health insurance
Disclosure of end-of-service liabilities, including after-service health insurance
59. The General Assembly, in its resolution 60/255, requested the Secretary-General to take the steps necessary to disclose end-of-service liabilities in the United Nations financial statements. The General Assembly, in its resolution 61/264, noted that the International Public Sector Accounting Standards required that the accrued after-service health insurance liabilities and future accrued expenses be recognized on the face of the financial statements and that this requirement was irrespective of funding such liabilities.
60. In its previous report (A/63/5/Add.2 and Corr.1, chap. II, para. 109), the Board noted that UNICEF had not provided for its end-of-service liabilities (including after-service health insurance) but disclosed those liabilities in a note to the financial statements. Accordingly, the Board recommended that UNICEF consider disclosing its end-of-service liabilities on the face of the financial statements. The Board noted that for the financial period under review, UNICEF continued to disclose its end-of-service liabilities in the notes to the financial statements.
61. As indicated in note 2 to the financial statements, it is the UNICEF accounting policy to disclose the end-of-service liabilities (including after-service health insurance) in the notes to the financial statements. The Board, however, continues to hold the view that the disclosure of end-of-service liabilities (including after-service health insurance) on the face of the financial statements would improve the transparency of its financial reporting, especially in the preparation for the implementation of IPSAS.
62. The Board recommends that UNICEF revise its accounting policy and disclose its end-of-service liabilities on the face of the financial statements in conjunction with the adoption of IPSAS.
63. UNICEF commented that it planned to disclose its end-of-service liabilities on the face of the financial statements in conjunction with the adoption of IPSAS, which would take effect on 1 January 2012.
Census data
64. In accordance with resolution 64/241, the Board continued its validation on the after-service health insurance liabilities of UNICEF. As at 31 December 2009, the overall end-of-service liabilities (including after-service health insurance) of UNICEF amounted to $578.28 million. Of this amount, $463.99 million represented after-service health insurance, $37.62 million related to unused annual leave credits and $76.67 million represented repatriation benefits. Those liabilities were determined on the basis of an actuarial valuation undertaken by an external actuarial firm, using the census data provided by UNICEF as well as relevant United Nations system-wide actuarial assumptions.

A/65/5/Add.2
21 10-45045
65. The census data used in the computation of UNICEF end-of-service liabilities (including after-service health insurance) as at 31 December 2009 was partly outdated. UNICEF explained that the year-end closure timetable required the field offices to submit their year-end schedules on annual leave balances by 25 January 2010. However, the deadline for the submission of census data to the actuary was 10 January 2010. In March 2010, upon receipt of the year-end schedules, UNICEF updated its census data. The Board analysed the census data provided to the actuary as well as the updated data, and noted several differences (see table II.5).
Table II.5 Differences between updated census data and census data provided to the actuary
Census data provided
to the actuaryUpdated
census data Difference
Population of active staff members 11 022 10 919 103 (1 per cent)
Unused annual leave days 332 559 359 715 27 156 (8 per cent)
Note: Based on the census data provided by UNICEF.
66. UNICEF explained that the difference in the number of active staff members was due to the delay in the receipt of notification to remove inactive staff members from the database maintained at headquarters, while the difference in unused annual leave days resulted from the use of 2008 data rather than 2009 data.
67. In March 2010, UNICEF requested the actuary to evaluate the impact of the data change on the estimated end-of-service liabilities (including after-service health insurance). The actuary indicated that recalculating those obligations would result in: (a) an increase in the after-service health insurance obligation of 2 to 3 per cent ($9.28 million to $13.92 million); (b) an increase in the repatriation obligation of 1 to 2 per cent ($0.77 million to $1.53 million); and (c) an increase in the annual leave obligation well below 4.62 per cent ($1.74 million).
68. UNICEF explained that, in consultation with the actuary, it had determined that it was impractical to request the actuary to conduct a revaluation, given the timeline for the submission of the financial statements. As a result, UNICEF made further disclosures in the notes to the financial statements regarding the reason for and impact of the census data error.
69. During field visits, the Board also noted that at the Eastern and Southern Africa Regional Office, as well as at the country offices in the Lao Democratic People’s Republic and Kenya, some staff members’ unused annual leave balances as submitted to UNICEF headquarters were different from those contained in the attendance records maintained by the offices.
70. The inconsistency between staff members’ attendance records and unused annual leave balances submitted to UNICEF headquarters, as well as the provision of outdated census data to the actuary, could result in inaccuracy in the end-of-service liabilities (including after-service health insurance) reflected in the notes to the financial statements.
71. UNICEF agreed with the Board’s recommendation that it take appropriate measures to ensure the accuracy of the data used in the computation of end-of-
A/65/5/Add.2
10-45045 22
service liabilities (including after-service health insurance) in future financial periods.
Funding of end-of-service liabilities, including after-service health insurance
72. Upon the approval of its Executive Board, UNICEF established reserves for after-service health insurance and separation costs in 2003 and 2006, respectively, with an initial allocation of $30 million and $10 million from regular resources. The Executive Board approved annual transfers of $30 million to the after-service health insurance reserve for the period 2006-2009. The reserve for separation costs is built up on an annual basis by the net of total contributions less payments made.
73. In its previous report (A/63/5/Add.2 and Corr.1, chap. II, para. 112), the Board noted that the UNICEF reserve for end-of-service liabilities (including after-service health insurance) was not adequate, and it had recommended that UNICEF establish mechanisms to fully fund those liabilities. The Board reviewed the efforts undertaken by UNICEF to implement that recommendation and noted that as at 31 December 2009, the UNICEF reserve for end-of-service liabilities (including after-service health insurance) amounted to $237.97 million, compared with $168.28 million as at 31 December 2007, an increase of 41 per cent.
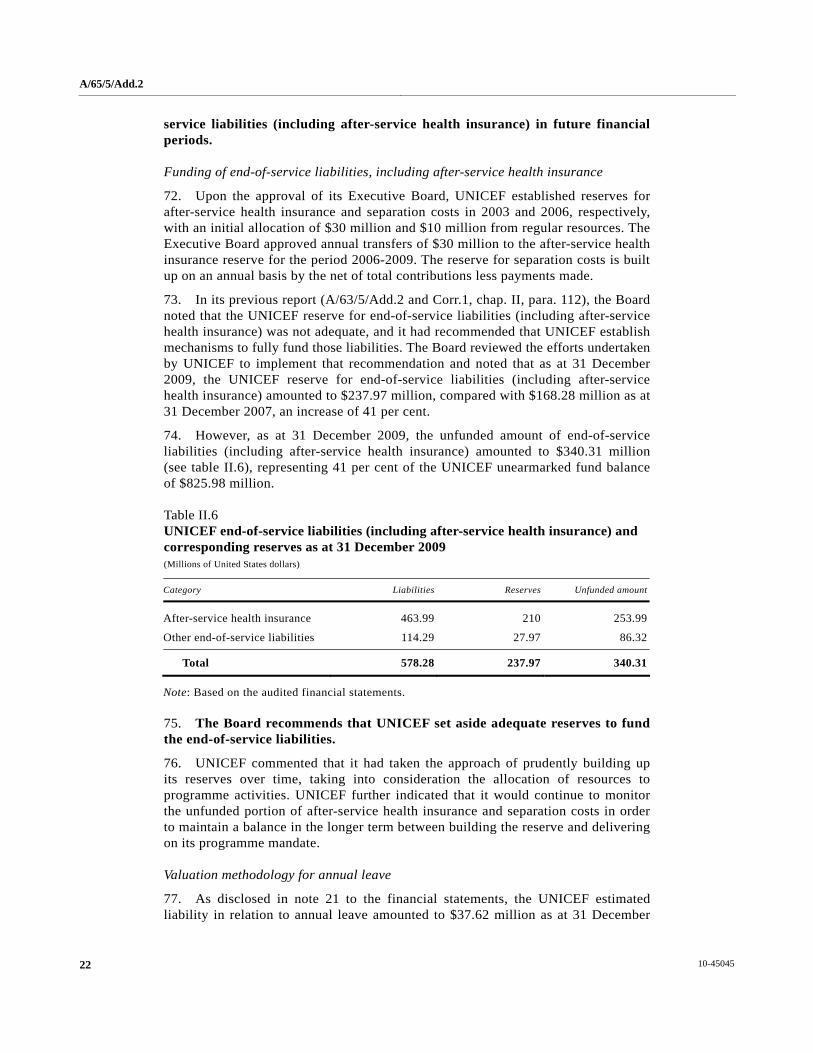
74. However, as at 31 December 2009, the unfunded amount of end-of-service liabilities (including after-service health insurance) amounted to $340.31 million (see table II.6), representing 41 per cent of the UNICEF unearmarked fund balance of $825.98 million.
Table II.6 UNICEF end-of-service liabilities (including after-service health insurance) and corresponding reserves as at 31 December 2009 (Millions of United States dollars)
Category Liabilities Reserves Unfunded amount
After-service health insurance 463.99 210 253.99
Other end-of-service liabilities 114.29 27.97 86.32
Total 578.28 237.97 340.31
Note: Based on the audited financial statements.
75. The Board recommends that UNICEF set aside adequate reserves to fund the end-of-service liabilities.
76. UNICEF commented that it had taken the approach of prudently building up its reserves over time, taking into consideration the allocation of resources to programme activities. UNICEF further indicated that it would continue to monitor the unfunded portion of after-service health insurance and separation costs in order to maintain a balance in the longer term between building the reserve and delivering on its programme mandate.
Valuation methodology for annual leave
77. As disclosed in note 21 to the financial statements, the UNICEF estimated liability in relation to annual leave amounted to $37.62 million as at 31 December

A/65/5/Add.2
23 10-45045
2009. Whereas the annual leave liability had previously been estimated using the current-cost methodology, UNICEF changed its accounting policy and calculated the annual leave liability based on an actuarial valuation performed by an external consultant. The external consultant indicated in his report that he had been requested by UNICEF to provide an actuarial valuation of after-service health insurance, repatriation and annual leave benefits for the purpose of reporting under International Public Sector Accounting Standard 25.
78. UNICEF justified the change in the valuation method of annual leave by reference to IPSAS 25, although no mention of IPSAS was made in the financial statements. This change was considered by UNICEF as an enhancement of the financial information which, while compliant with the United Nations system accounting standards, was also a step towards the full implementation of IPSAS.
79. The Board took this into consideration and checked whether the new valuation method would be compliant with IPSAS once it is fully applicable to UNICEF.
80. An important distinction made by IPSAS 25 is that between short-term and long-term benefits. UNICEF applied the actuarial valuation method to the leave liability based on the assumption that annual leave is a long-term benefit.
81. IPSAS 25 defines short-term employee benefits as benefits (other than termination benefits) which fall due wholly within 12 months after the end of the period in which the employees render the related service. Furthermore, IPSAS 25, paragraph 11, provides examples of items that are classified as short-term benefits, including short-term compensated absences (such as annual leave and paid sick leave) where the absences are expected to occur within 12 months after the period in which the employees render the related service. The fact that, as provided for by the staff rules of UNICEF, employees may accumulate unused leave days from one period to the next does not in itself make annual leave a long-term benefit; nor does the fact that employees are entitled to a cash payment for unused leave days upon ceasing service. IPSAS 25 (paras. 14 to 19) provides for those cases, which are classified under short-term benefits.
82. In addition, IPSAS 25, paragraph 12, states that accounting for short-term employee benefits is generally straightforward because no actuarial assumptions are required to measure the obligation or the cost and there is no possibility of any actuarial gain or loss and that, moreover, short-term employee benefit obligations are measured on an undiscounted basis.
83. The Board therefore is of the view that the annual leave liability of $37.62 million calculated through the actuarial valuation is not compliant with IPSAS 25 as it (a) includes future days to be accumulated; and (b) is a discounted amount.
84. The Board recommends that UNICEF consider a revision of its policy for the valuation of leave liability in preparation for the implementation of the International Public Sector Accounting Standards.
Discount rate
85. In its previous valuation of the after-service health insurance liability, UNICEF had used a discount rate of 5.5 per cent. The valuation of the after-service
A/65/5/Add.2
10-45045 24
health insurance liability as at 31 December 2009 relies on a discount rate of 6.0 per cent.
86. A discount rate is an interest rate used as a common financial practice by which to estimate the present value of an amount to be earned or lost at a future date. In other words, it represents the time value of money. As the after-service health insurance liability is composed of benefits that will be paid out by UNICEF to its retired staff in the future, IPSAS, like most other accounting frameworks, requires that these amounts be “discounted” so that the reporting entity takes the present value of the future benefits as an estimate for its liability.
87. In practical terms, the higher the discount rate, the lower the present value of future amounts (conversely, the lower the rates, the higher the present value). Hence, all things being equal, the increase in the discount rate used by UNICEF resulted in a lower after-service health insurance liability compared with the previous financial period. In this regard, note 21 to the financial statements indicates that a 1.0 per cent increase in the discount rate would result in a 17 per cent decrease of the after-service health insurance liability, which represents $78.88 million.
88. IPSAS 25, which serves as a reference for the actuarial methodology used for the valuation of the after-service health insurance liability in accordance with resolution 61/264, does not prescribe any particular discount rate. It states, however, that “the rate used to discount post-employment benefit obligations (both funded and unfunded) shall reflect the time value of money. The currency and term of the financial instrument selected to reflect the time value of money shall be consistent with the currency and estimated term of the post-employment benefit obligations” (para. 91). It further specifies that “an entity makes a judgement whether the discount rate that reflects the time value of money is best approximated by reference to market yields at the reporting date on government bonds, high-quality corporate bonds or by another financial instrument” (para. 94).
89. Like most of the methodological elements used for the actuarial valuation of the after-service health insurance liability, the discount rate was selected by the United Nations on behalf of all the entities participating in the same health insurance plans, for which the United Nations coordinated the valuation exercise.
90. According to the United Nations, the objective of selecting a discount rate when valuing end-of-service liability benefits is to measure the single amount that, if invested in a portfolio of high-quality debt instruments, would provide the future cash flow necessary to pay the accrued benefits when due. The United Nations has historically established the discount rate assumption by referring to rates of return on available high-quality, fixed-income investments with cash flow that match the timing and amount of expected benefit payments. The rates of return used as a reference by the United Nations have been those of high-quality, long-term corporate bonds.
91. While the Board acknowledges that this methodology is compliant with IPSAS 25, it makes the following comments for consideration in the discussion on the funding of these liabilities:
(a) The increase in the discount rate does not reflect the trend in interest rates, which have generally tended to decrease during the recent period. The increase is due to the decision of the United Nations not to increase the discount rate

A/65/5/Add.2
25 10-45045
for the previous valuation, although the application of the methodology described above would have resulted in an increase from 5.5 per cent to 6.5 per cent at that time. Given the uncertainties regarding the prescriptions of IPSAS (IPSAS 25 had not yet been adopted), the United Nations conservatively decided to maintain the 5.5 per cent rate. Had it chosen to raise the rate to 6.5 per cent, the rate would have decreased — rather than increased — for the last valuation, which would have been consistent with the economic environment;
(b) The discount rate is only one example reflecting the high level of uncertainty inherent in the actuarial valuation of a liability. While compliant with the Accounting Standards, the present valuation is only an estimate of the actual value of the liability. Consequently, the Executive Board of UNICEF may wish not to regard it as an absolute reference. Valuations based on standards other than the Accounting Standards may yield different results. In that regard, the Board wishes to emphasize that a financial valuation of funding needs (or a “funding valuation”) would result in a value different from that determined through an accounting valuation, which is generally more conservative.
7. Results-based management/budgeting
Support budget
92. UNICEF presented the biennium support budget for 2008-2009 using the results-based-budgeting format, which included results, indicators, baselines and targets.
93. The Board reviewed a sample of seven 2008-2009 support budgets submitted by five headquarters divisions and two regional offices and noted the following deficiencies: (a) some of the results were not specific, measurable, attainable, relevant and time-bound and some of the indicators were not measurable; and (b) there were no budget estimates for each result nor were activities defined for each result. In addition, there was no monitoring system in place to facilitate the tracking of results-based-budgeting implementation, including progress towards the achievement of results.
94. UNICEF explained that 2008-2009 had been the biennium in which results-based-budgeting had been introduced for the preparation and presentation of the biennial support budget and it was in its early stages of implementation. Staff members were unfamiliar with results-based methodology. Although results and indicators had been formulated, the corresponding budget estimates had not been clearly identified against each result.
95. Without defining the cost estimates for each result, UNICEF could not determine a clear connection between results and resources needed to carry out each function, while the lack of a monitoring system could make it difficult to evaluate the management performance of each division.
96. The Board recommends that UNICEF: (a) develop training courses for staff members in respect of results-based budgeting methodology; (b) include in future budget submissions resource estimates, as well as activities, for each expected result; and (c) establish a monitoring mechanism to facilitate the tracking of budget implementation as well as progress towards the achievement of results.

A/65/5/Add.2
10-45045 26
97. UNICEF commented that it would conduct results-based-budgeting training as part of the roll-out of its “One ERP” system, which would facilitate both the presentation of cost against resources and the monitoring of budget implementation.
98. UNICEF further commented that it was undertaking a review, jointly with the United Nations Development Programme (UNDP) and UNFPA, to strengthen results-based-budgeting, with a specific focus on providing details concerning activities and related costs and their inclusion in budget submissions. The findings of the review would be implemented in conjunction with the Executive Board-endorsed road map towards an integrated budget presentation for the period starting in 2014.
Extension of programme budget allotments
99. A Public Sector Alliances and Resource Mobilization Office advisory note states that UNICEF should take all preventive measures to avoid the extension of grants. However, 369 grants (30 per cent) relating to other resources programme budget allotments, with a total value of $0.68 billion, were extended after their expiration date of 31 December 2009. The other resources programme budget allotment extension rates for the regions of Central and Eastern Europe and the Commonwealth of Independent States and of East Asia and the Pacific were 35 per cent and 32 per cent, respectively.
100. The Board reviewed a sample of 25 other resources programme budget allotment extensions and noted that 20 extensions, or 80 per cent, had been caused by delays in programme implementation and that 23 had not been submitted to the Public Sector Alliances and Resource Mobilization Office by field offices at least three months prior to the programme budget allotment expiration dates, as required by the advisory note. The delays ranged from half a month to 10 months. Furthermore, UNICEF had no established mechanism to monitor the timeliness of the submission of extension requests by field offices.
101. Extensions of programme budget allotments could affect the capacity of UNICEF to raise funds in future, while delays in submitting requests for the extensions could result in insufficient time for UNICEF to negotiate with donors regarding unspent funds.
102. UNICEF agreed with the Board’s recommendation that it (a) provide necessary support to the offices with higher extension rates to improve programme implementation; and (b) put in place measures to monitor the timeliness of the submission of requests for programme budget allotment extensions by field offices.
Refunds to donors
103. UNICEF makes refunds to donors in the following cases: (a) when project implementation is completed at a lower cost than planned; (b) when implementation is not completed but the donor cannot extend the programme budget allotment expiration date; and (c) when programme implementation is cancelled.
104. An amount of $13.2 million relating to 467 expired programme budget allotments was refunded to donors in 2009. A total of 106 programme budget allotments (23 per cent), with a value of $4.9 million, had expired before 2006, accounting for 37 per cent of the total value refunded in 2009. In addition, 757 other
A/65/5/Add.2
27 10-45045
resources programme budget allotments, totalling $5.2 million, had expired on 31 December 2008, of which amount $3.1 million had not been closed as at the time of audit. This meant that the expired funds had not yet been reprogrammed, transferred to regular resources or refunded to donors. Furthermore, there was no policy to regulate the refund process or accountability for refunds.
105. The absence of a policy to regulate the refund process, as well as the late closure of expired programme budget allotments, could cause delays in the return of funds to donors.
106. UNICEF agreed with the Board’s recommendation that it establish a policy to regulate the refund process.
8. Cash transfers
107. According to its financial circular 15 (Rev.2), UNICEF provides Governments with direct financial support, which is termed cash assistance to Governments.
108. In September 2005, the United Nations Development Group (which includes UNDP, UNICEF, UNFPA and the World Food Programme (WFP)) issued the Framework for Cash Transfers to Implementing Partners, a common operational framework for such transfers. Under the Framework, all United Nations Development Group agencies would use the harmonized approach to cash transfers to implementing partners to make cash transfers.
109. In September 2005, UNICEF issued financial circular 15 (Rev.3) to give effect to specific UNICEF policies and procedures relating to cash transfers to implementing partners following the implementation of the harmonized approach. According to financial circular 15 (Rev.3), a funding authorization and certificate of expenditure form will be used for reporting on cash transfers to implementing partners. This approach is unlike the reporting procedures relating to cash assistance to Governments, in that implementing partners do not need to submit supporting documents to UNICEF in order to substantiate receipt of cash transfers.
110. According to United Nations Development Group statistics, as at 30 April 2009, of the 123 countries where Development Group members operate, 9 had not implemented the harmonized approach to cash transfers owing to the absence of cash transfers; 17 countries had fully implemented the approach; and the remaining 97 countries were in various stages of implementation. Therefore, both financial circular 15 (Rev.2) and financial circular 15 (Rev.3) were applicable during the financial period under review.
Monitoring/assurance activities for cash transfers
111. Financial circular 15 (Rev.2) requires field offices to conduct field monitoring and spot checks so as to provide assurances in connection with the disbursed cash assistance to Governments. The Framework sets out the requirements relating to the assurance activities for cash transfers to implementing partners, including periodic on-site reviews (spot checks and special audits), programmatic monitoring (site visits and field monitoring) and scheduled audits. The Framework also requires the preparation and implementation of assurance activities and an annual audit plan.
112. The Board reviewed the monitoring/assurance activities performed by country offices and noted the following deficiencies:
A/65/5/Add.2
10-45045 28
(a) At the Madagascar country office, spot checks were not planned or carried out in 2008;
(b) At the Tajikistan country office, the spot check sheet did not include recommendations to partners or comments from partners;
(c) At the Cambodia country office, some spot checks were not completed owing to the lack of staff resources;
(d) At the China country office, there was no office-wide coordination mechanism for assurance activities. In addition, the standard spot check manual and the checklist were not followed and no monitoring system was established to follow up on the recommendations made during spot checks.
113. In addition, the Board issued questionnaires regarding monitoring/assurance activities on cash assistance to Governments/cash transfers to implementing partners to 17 country offices, covering 51 per cent of total UNICEF cash assistance to Governments/cash transfers to implementing partners in the biennium 2008-2009. In all, 15 responses were received, including from the Iraq country office, where no on-site monitoring or assurance activities could be performed owing to the security situation. Of the remaining 14 country offices, 7 had not prepared office-wide plans for assurance activities in 2008, while 6 had not done so in 2009. In addition, 12 country offices had not prepared annual audit plans for 2008 and 2009 as required by the Framework.
114. The absence of office-wide plans for assurance activities and annual audit plans, as well as inadequate monitoring/assurance activities, could result in the failure of UNICEF to obtain sufficient assurance regarding the proper utilization of cash assistance to Governments/cash transfers to implementing partners.
115. UNICEF agreed with the Board’s recommendation that it ensure that all country offices plan and implement monitoring/assurance activities in accordance with financial circular 15 and the Framework for Cash Transfers to Implementing Partners.
116. UNICEF commented that it would continue to remind all of its country offices of the requirements of financial circular 15 and the Framework for Cash Transfers to Implementing Partners.
Long-outstanding cash transfers
117. In a report to the Executive Board dated 30 May 2002, UNICEF stated that disbursements for cash assistance to Governments should cover the estimated expenditures for a period of no longer than three months and that the recipient of cash assistance was responsible for submitting a financial and activity monitoring report to UNICEF within a period of six months, and nine months in exceptional cases, following the actual provision of funds (E/ICEF/2002/AB/L.5, para. 40).
118. In its previous report (A/63/5/Add.2 and Corr.1, chap II, paras. 58 to 60), the Board noted that in eight field offices, some cash transfers had been outstanding for more than nine months, and it had recommended that UNICEF clear all long-outstanding cash transfers. The Board reviewed the efforts undertaken by UNICEF to implement that recommendation and noted that New York headquarters had strengthened its global monitoring on cash transfers and had issued quarterly letters

A/65/5/Add.2
29 10-45045
to regional offices on the status of cash transfers, highlighting those outstanding for more than nine months.
119. As at 31 December 2009, a total amount of $507.86 million in cash transfers remained outstanding. Of that amount, $30.12 million (6 per cent) had been outstanding for between six and nine months, while $4.51 million (1 per cent) released by 56 country offices had been outstanding for more than nine months.
120. During the field audits, the Board reviewed the cash transfer monitoring reports of five country offices (in Madagascar, Nepal, the Niger, Senegal and the United Republic of Tanzania), and noted that a total amount of $345,455 in cash transfers to implementing partners remained outstanding for more than nine months from the date of release.
121. UNICEF explained that long-outstanding cash transfers were due to various situations faced by implementing partners, such as staff turnover, delayed project implementation, the slow utilization of funds and incomplete documentation.
122. Long-outstanding cash transfers could affect the ability of UNICEF to obtain adequate assurance about the proper utilization of the programme funds.
123. UNICEF agreed with the Board’s reiterated recommendation that it intensify its efforts to settle long-outstanding cash transfers.
Acknowledgement receipts
124. UNICEF financial circular 15 (Rev.2) and financial circular 15 (Rev.3) both provide that for all cash transfers, acknowledgement receipts are to be obtained from the head of the Government department concerned or from the official formally authorized to register funds. The receipts should be attached to the relevant payment vouchers and kept in UNICEF files.
125. In its previous report (A/63/5/Add.2 and Corr.1, chap. II, para. 50), the Board noted that in six country offices, payment vouchers had not been supported by acknowledgement receipts from implementing partners, and it had recommended that UNICEF ensure that its country offices comply with financial circular 15 in relation to that matter. However, some acknowledgement receipts for cash transfers had not been obtained from implementing partners at the Eastern and Southern Africa Regional Office or at the country offices in Madagascar, Cambodia, Tajikistan, the Lao People’s Democratic Republic or Yemen.
126. In addition, at the country offices in the Lao People’s Democratic Republic, Madagascar, Tajikistan, Nepal and the Niger, some acknowledgement receipts had not been attached to the payment vouchers. The finance units of the Lao People’s Democratic Republic and Madagascar country offices kept the receipts separately from the payment vouchers. At the Tajikistan and Nepal country offices, the receipts were kept in programme sections instead of in the finance unit, as required by financial circular 15. In addition, at the Nepal country office, partner signatures for six receipts were missing.
127. The absence of acknowledgement receipts to substantiate payments made could result in an inability on the part of UNICEF to determine whether cash transfers have actually been received.

A/65/5/Add.2
10-45045 30
128. The Board reiterates its previous recommendation that UNICEF ensure that its field offices comply with financial circular 15 on the issuance of official receipts by the recipients of cash transfers.
129. UNICEF commented that it would continue to remind all its offices of the requirements of financial circular 15 in relation to obtaining official receipts for cash transfers.
9. Programme and project management
Submission and rating of completed evaluation reports
130. According to the UNICEF evaluation policy (E/ICEF/2008/4), UNICEF offices/divisions are required to upload completed evaluation reports to the UNICEF online evaluation database within three months of the completion of reports. The Evaluation Office is to manage the evaluation quality-rating process and rate all evaluation reports within six months of submission.
131. Of 260 completed evaluation reports for 2009, 97 (37 per cent) had been uploaded to the UNICEF online evaluation database as at 31 March 2010. The submission rates of completed evaluation reports for 2006, 2007 and 2008 were 25 per cent, 20 per cent and 15 per cent, respectively. While this indicates that some progress was made in connection with the submission of completed evaluation reports in 2009, the submission rate is still in need of improvement. The delay in conducting programme evaluations was also addressed by the Office of Internal Audit during its audits of country offices as discussed in detail further in the report.
132. UNICEF explained that in recent years, a series of methods had been adopted to enhance the submission rate of the evaluation reports, such as mentioning the need to submit the evaluation reports during monitoring and evaluation meetings and including the submission requirements in the annual written reminders relating to the country office annual report guidelines. Although the policy was clear and measures were taken to emphasize the requirements of the submission, the situation still needed further improvement.
133. A total of 105 completed evaluation reports for 2008 had been submitted, of which 45 (43 per cent) had not been rated by the Evaluation Office within the six-month time frame as required by the UNICEF evaluation policy. The delay in the submission and rating of the completed evaluation reports could prevent UNICEF from sharing lessons learned and enhancing evaluation capacity to support programme implementation.
134. UNICEF agreed with the Board’s recommendation that it ensure that all completed evaluation reports are submitted and rated in a timely manner in accordance with the provisions of the UNICEF evaluation policy (E/ICEF/2008/4).
135. UNICEF commented that it was implementing a new strategy to increase the submission rate of evaluation reports, as well as their rating.
Regional office support to country offices
136. The UNICEF regional offices are responsible for providing guidance, support, oversight and coordination to the country offices within the region. During the field visits to the Western and Central Africa Regional Office, the Regional Office for

A/65/5/Add.2
31 10-45045
South Asia and the Regional Office for Central and Eastern Europe and the United States, the Board issued questionnaires to country offices with regard to the support provided by those regional offices. A total of 34 country offices indicated that they had not been requested by the regional offices to provide feedback on the quality of the support provided by the regional offices. In addition, 24 country offices indicated that they would like those regional offices to provide more technical guidance and support in such areas as the implementation of the harmonized approach to cash transfers, programme evaluation, knowledge management and human resources management. The issue of insufficient support for country offices was also addressed by the Office of Internal Audit during its audits of the regional offices.
137. The obtaining of timely feedback from country offices on the guidance and support provided would enable regional offices to improve the quality of their support activities.
138. UNICEF agreed with the Board’s recommendation that it ensure that all regional offices request country offices to regularly provide feedback on the support given by regional offices so as to strengthen their support activities.
Annual management plan
139. Annual management plans prepared by country offices are important management tools for ensuring that the resources of the country offices remain focused on planned strategic results for children. At the Senegal, Cambodia and Yemen country offices, the annual management plans for 2008 and 2009 had not been finalized within the time frame established in the UNICEF Programme Policy and Procedures Manual, with delays ranging from one month to six months. At the Yemen country office, management indicators (targets) had not been included in the 2008 annual management plan as required by the Programme Policy and Procedures Manual. The delay in the preparation of plans and the issue of the incomplete plan were also addressed by the Office of Internal Audit during its audits of country offices.
140. In addition, at the country offices in Cambodia, Yemen, Senegal and the Niger, some activities set out in the 2008 annual management plans had not been fully implemented in 2008. For instance, the country management team of the Yemen country office had met seven times in 2008, although the 2008 annual management plan required it to meet on a monthly basis. At the Niger country office, the situation analysis on women and children had not been completed as planned in the 2008 annual management plan.
141. Delays in the preparation of annual management plans and their partial implementation could have a negative effect on the monitoring and fulfilment of the achievements of the country offices.
142. The Board recommends that UNICEF ensure that all country offices strictly comply with the provisions of the UNICEF Programme Policy and Procedures Manual in relation to the preparation and implementation of annual management plans.

A/65/5/Add.2
10-45045 32
Annual integrated monitoring and evaluation plan
143. According to the UNICEF Programme Policy and Procedures Manual, country offices are required to prepare an annual integrated monitoring and evaluation plan as a management tool to track progress in collecting critical information in relation to programme planning and implementation. At the country offices in Madagascar, Nepal, the Lao People’s Democratic Republic, Senegal, Kenya and the Niger, out of a total of 155 studies, surveys and evaluations planned in the 2008 integrated monitoring and evaluation plan, 63 (41 per cent) had been fully conducted, 60 (39 per cent) were ongoing and 32 (20 per cent) had been cancelled or postponed.
144. UNICEF explained that the low completion rate of the integrated monitoring and evaluation plan activities was mainly the result of unrealistic planning, changing situations in various countries and the incapability of the counterparts. The delay in the completion of the integrated monitoring and evaluation plan activities could affect the information collection relating to programme planning and implementation.
145. UNICEF agreed with the Board’s recommendation that it ensure that all country offices: (a) prepare realistic integrated monitoring and evaluation plans; and (b) make every effort to improve the completion rate of the integrated monitoring and evaluation plans.
Field trips
146. UNICEF field offices regularly make field trips to facilitate the progress of programme implementation. According to the UNICEF Programme Policy and Procedures Manual, field offices should follow up on the recommendations made during field trips. The Programme Policy and Procedures Manual also provides a standard checklist detailing various procedures to be conducted during field trips.
147. The Regional Office for South Asia, the Regional Office for Central and Eastern Europe and the United States, and the Middle East and North Africa Regional Office, as well as the Madagascar and Kenya country offices, had not established a mechanism to follow up on the recommendations made during field trips. For instance, at the Regional Office for Central and Eastern Europe and the United States, there was no database to monitor and share the status of implementation of main recommendations contained in field trip reports. In addition, at the Western and Central Africa Regional Office, 56 of the 185 field trip reports made in 2009 had not been provided to the planning section for follow-up purposes, as required by its internal management procedures. In addition, at the Madagascar and Kenya country offices, the standard field trip checklist was not followed during field trips.
148. Inadequate follow-up of the implementation of recommendations made in field trip reports could affect the ability of UNICEF to share lessons learned during field trips.
149. UNICEF agreed with the Board’s recommendations that it ensure that all field offices: (a) establish mechanisms to follow up on the recommendations made during field trips; and (b) comply with procedures included on the field trip checklist.

A/65/5/Add.2
33 10-45045
Emergency preparedness and response plan
150. According to the UNICEF Programme Policy and Procedures Manual, all country offices should annually review and update their emergency preparedness and response plan to maintain a level of preparedness commensurate with local risks of emergencies so as to ensure an effective, dependable and timely response to the needs of children and women in the countries.
151. The Board reviewed the emergency preparedness and response plan status reports of 131 UNICEF offices as at 31 March 2010, including 127 country offices, 3 offices in the Pacific (Kiribati, Vanuatu and Solomon Islands) and the Southern Sudan area office, and noted that some offices had not updated their emergency preparedness and response plans annually in accordance with the Programme Policy and Procedures Manual (see table II.7).
Table II.7 Summary of the emergency preparedness and response plan status report of 131 UNICEF offices as at 31 March 2010
Year of most recent update Number of offices
2005 2
2006 2
2007 5
2008 27
2009 82
2010 13
Total 131
Note: Based on the emergency preparedness and response plan status report provided by UNICEF.
152. Delay in updating the emergency preparedness and response plan on the part of country offices could affect the ability of UNICEF to respond to the needs of children and women.
153. UNICEF agreed with the Board’s recommendation that it ensure that all country offices update their emergency preparedness and response plans in a timely manner in accordance with the UNICEF Programme Policy and Procedures Manual.
10. Procurement and contract management
Competitive bidding
154. The UNICEF Supply Manual provides that, with certain exceptions, all purchases are to be the result of competitive bidding, and written solicitations are required to be sent to a number of suppliers sufficient to obtain preferably at least three valid and acceptable replies. The waiving of competitive bidding should be recorded in writing and signed by the approved officer. The Supply Manual further requires that in all cases where the lowest acceptable bid is not selected, the reasons must be documented and signed for audit purposes.

A/65/5/Add.2
10-45045 34
155. Four country offices (in Cambodia, Madagascar, Tajikistan and Yemen) and the Private Fund-raising and Partnerships Division did not strictly comply with the provisions of the Supply Manual relating to competitive bidding, as set out below:
(a) At the Private Fund-raising and Partnerships Division, one bid was awarded to the second-lowest bidder in 2008;
(b) At the Cambodia country office, in 2 of the 10 local procurements sampled, the written solicitations were sent only to 2 suppliers, respectively;
(c) At the Madagascar country office, for all five emergency supplies contracts awarded in March 2008, solicitations were sent to suppliers that had not been pre-qualified by the office;
(d) At the Tajikistan country office, in three of seven cases sampled in which the purchase order amount was more than $10,000, the solicitation documents were not kept in files. In addition, in three cases the lowest-bid principle was not followed, with the highest bid having been selected in the first, the third-lowest having been selected in the second and the fifth-lowest bid having been selected in the third;
(e) At the Yemen country office, written solicitations for one procurement activity in 2008 were sent to six suppliers. However, only one response was received and the contract was awarded to the bidder.
156. The Private Fund-raising and Partnerships Division explained that the award of the contract to the second-lowest bidder was based on its experience with the lowest-price bidder in terms of delay in delivery. However, the Board was not provided with any evidence supporting that judgement. The Cambodia and Madagascar country offices commented that their departure from competitive bidding was due to the lack of qualified suppliers, while the Tajikistan country office indicated that the lowest bid had been rejected because of the poor quality of the bid samples provided.
157. The deficiencies in the bidding process were also addressed by the Office of Internal Audit during its audits of country offices. Non-compliance with the standard bidding process could affect the efficiency of the procurement of UNICEF.
158. UNICEF agreed with the Board’s recommendation that it strictly comply with the provisions in the Supply Manual in relation to competitive bidding and maintain written justifications in related files for exceptions.
Late delivery
159. In its previous report (A/63/5/Add.2 and Corr.1, chap. II, paras. 128 and 129), the Board noted that three country offices had not included in purchase orders a penalty clause for late delivery, and it had recommended that those offices comply with the provisions of the UNICEF Supply Manual in relation to liquidated damages.
160. At the Regional Office for South Asia, the Regional Office for East Asia and the Pacific and the Tajikistan and Cambodia country offices, some procured items were delivered after the due dates. For example, for 32 purchase orders issued by the Regional Office for South Asia, the related items were delivered later than the agreed delivery dates, with the delays ranging from 3 to 292 days. In addition, the
A/65/5/Add.2
35 10-45045
penalty clause for late delivery had still not been included in the standard purchase orders generated by the Programme Manager System. At the Cambodia country office, six purchase orders lacked penalty clauses for late delivery.
161. The Regional Office for South Asia explained that the late delivery was largely the result of insufficient planning, while the Cambodia country office indicated that the late deliveries were the result of the fact that authorized staff were not available to receive the supplies and other external factors.
162. The absence of penalty clauses in purchase orders could affect the timely delivery of procured supplies, which could have an adverse impact on the timely implementation of programme activities, as well as on costs.
163. The Board reiterates its previous recommendation that UNICEF ensure that all offices include in purchase orders a penalty clause for late delivery in accordance with the provisions set out in the UNICEF Supply Manual.
164. UNICEF commented that it would roll out the “One ERP” system to its country offices by the end of 2011. The new system would provide optional contractual remedy clauses that could be included in contracts as deemed appropriate by the contracting official.
Vaccine arrival reports
165. In 2008, 1,803 vaccine shipments were dispatched by the Supply Division to field offices. As at 31 December 2008, the Division had received 1,588 vaccine arrival reports, representing 88 per cent, of which only 234 (15 per cent) had been received within 72 hours, as required by the Supply Manual. The remaining vaccine arrival reports were delayed by 4 to 316 days.
166. The Supply Division explained that efforts had been made to increase the submission rate of vaccine arrival reports. For instance, a full-time assistant had been designated for that purpose. A positive trend was observed in 2009: 1,731 of the 1,906 vaccine arrival reports had been received as at 31 December 2009, representing 91 per cent of the total, of which 404 (23 per cent) had been received within 72 hours. The remaining 1,327 vaccine arrival reports were delayed by 4 to 360 days.
167. The non-receipt of vaccine arrival reports within the stipulated time frame could affect the ability of the Supply Division to properly monitor the timely delivery as well as the physical condition of vaccines and to pursue remedial action or recovery of any pertinent costs through insurance in the case of reported problems.
168. UNICEF agreed with the Board’s recommendation that it ensure that all country offices submit vaccine arrival reports to the Supply Division within the time frame specified in the Supply Manual.
Supplier database
169. At the Innocenti Research Centre, there were no supplier profile forms for suppliers, and the performance evaluations of suppliers were not carried out. At the Madagascar country office, information about 506 suppliers was kept in an Excel spreadsheet, which was used as a supplier database, and only 12 suppliers had supplier profile forms. In addition, there were no financial statements, annual
A/65/5/Add.2
10-45045 36
reports, inspection reports, quality certificates, correspondence relating to quality problems or other documents relevant to the suppliers’ performance in the supplier files as required by the Supply Manual.
170. At the Tajikistan country office, 92 suppliers were recorded in the Programme Manager System, and information about only 19 suppliers had been compiled. No records about the process or results of the performance evaluation were maintained.
171. The delay in updating the supplier databases was also addressed by the Office of Internal Audit during its audits of country offices. Non-compliance with the standard procedures for supplier evaluation and file management could result in unqualified suppliers being listed in the database and being awarded supply contracts.
172. UNICEF agreed with the Board’s recommendations that it ensure that all offices update the supplier database in a timely manner and maintain proper records of listed suppliers in accordance with the requirements of the Supply Manual.
11. Non-expendable property management
173. Non-expendable property consists of property and equipment valued at $1,500 or more per unit at the time of purchase and with a serviceable life of five years or more. As disclosed in note 24 to the financial statements, the total value of the non-expendable property of UNICEF as at 31 December 2009 amounted to $155.84 million, a 9 per cent increase from the balance of $142.61 million in the previous biennium. The breakdown is shown in table II.8.
Table II.8 Breakdown of non-expendable property of UNICEF as at 31 December 2009 (Thousands of United States dollars)
Offices Value Percentage to total
Headquarters and 7 regional offices 22 728 15
127 country offices 133 107 85
Total 155 835 100
Note: Based on the data provided by the Division of Financial and Administrative Management.
Discrepancies
174. According to the 2009 year-end non-expendable property physical inventory report of New York headquarters, 1,005 non-expendable property items, valued at $3.24 million, could not be located. UNICEF explained that most of those items were laptop computers assigned to staff members who had failed to bring them into the office for physical verification, as had been requested. In addition, some divisions had not returned out-of-use items for disposal, and those items had therefore not been found during the annual physical verification. At the time of audit, UNICEF stated that it had identified 628 of the missing items, valued at $1.69 million, and would continue to reconcile the remaining discrepancies.
175. In nine field offices (Eastern and Southern Africa Regional Office, Middle East and North Africa Regional Office, and country offices in Nepal, Kenya,

A/65/5/Add.2
37 10-45045
Senegal, Yemen, Tajikistan, Madagascar and the United Republic of Tanzania), as well as at the Private Fund-raising and Partnerships Division and the Innocenti Research Centre, there were discrepancies between the results of the physical verifications and the information contained in the database records. Some examples are set out below:
(a) At the Private Fund-raising and Partnerships Division, in a sample of 77 items recorded in the database, 16 items (21 per cent) could not be located;
(b) At the Innocenti Research Centre, in a sample of 14 items, 4 had database records that did not correspond with their actual status;
(c) At the Eastern and Southern Africa Regional Office, of 20 items sampled, the actual locations of 14 were different from those recorded in the database;
(d) At the Senegal country office, no value was indicated in the database records of 1,072 items, including five pieces of transportation equipment;
(e) At the Kenya country office, of 67 sampled items acquired in 2008 and 2009, 29 items had not been recorded in the database in a timely manner. In addition, the value of two items was incorrectly recorded in the database. Furthermore, of 20 sampled items acquired before 2008, information about 11, such as serial numbers, location and usage conditions, was not consistent with that kept in the database.
176. Discrepancies between the physical status of non-expendable property items and their records in the database, as well as incomplete records of non-expendable property, could affect the management of such property and the accuracy of non-expendable property disclosure in the notes to the financial statements.
177. The Board recommends that UNICEF take appropriate measures to improve its management of non-expendable property, including ensuring the completeness and accuracy of the non-expendable property records.
178. UNICEF commented that as part of its “One ERP” implementation, it would review and strengthen its non-expendable property management procedures. The implementation of the asset accounting module of the system would automate the operations process, improving the completeness and accuracy of the records.
Disposal of non-expendable property
179. At the Regional Office for South Asia and Eastern and Southern Africa Regional Office, some non-expendable property items were not disposed of in a timely manner, as set out below:
(a) In December 2008, the Property Survey Board of the Regional Office for South Asia decided to dispose of 49 non-expendable property items, valued at $142,757, which were damaged or out of service. As at 20 May 2009, three of those items, valued at $27,496 (19 per cent of the total value of the items marked for disposal), had not yet been disposed of;
(b) At the Eastern and Southern Africa Regional Office, 12 non-expendable property items, with an original cost of $30,193, were recommended for disposal by the Property Survey Board at a meeting held on 3 July 2008. The items were not physically disposed of until January 2009. The Office explained that the items recommended for disposal in July 2008 had been auctioned together with other
A/65/5/Add.2
10-45045 38
items, recommended for disposal by the Board in October 2008, because there were very few of them and the proceeds would not cover the auction costs.
180. The delay in implementing the recommendations of the Property Survey Board in relation to the disposal of non-expendable property was also addressed by the Office of Internal Audit during its audits of country offices. Such a delay could affect the residual value of the non-expendable property.
181. UNICEF agreed with the Board’s recommendation that it ensure that the Regional Office for South Asia and the Eastern and Southern Africa Regional Office take appropriate measures to expedite disposal of their non-expendable property.
12. Inventory management
Handling stock materials nearing the end of shelf life
182. UNICEF Supply Division procedure 006 requires that in order to identify stock materials nearing the end of their shelf life, the warehouse manager is required to submit a report on expiring stock materials to the Property Survey Board on a monthly basis. The Property Survey Board meets quarterly to consider submissions and make recommendations on how to deal with the expiring materials. Within one working day of the meeting, Board recommendations, together with all attached documentation, are presented to the Director of the Supply Division for approval. The Director makes a decision within one working day.
183. The Board reviewed the minutes of Property Survey Board meetings and noted that only eight reports on expiring stock materials had been submitted to the Board for recommendation during the biennium 2008-2009. The average time between the date of the Property Survey Board meeting and the date of approval by the Director was 27 days; the longest period was 82 days.
184. Untimely submission to the Property Survey Board of reports on expiring stock materials and delay in approval of Board recommendations by the Director of the Supply Division could affect the handling in a timely manner of soon-to-expire stocks.
185. UNICEF agreed with the Board’s recommendation that it ensure that the Supply Division adheres strictly to Supply Division procedure 006 to deal with stock materials nearing the end of their shelf life.
Undistributed supplies
186. In its previous report (A/63/5/Add.2 and Corr.1, chap. II, paras. 133 to 140), the Board noted that at some country offices, some project supplies had remained undistributed for a long period, and it had recommended that country offices dispatch the supplies to the end-users in a timely manner. This issue had not been resolved at two country offices, as set out below:
(a) At the Niger country office, seven supply items with a total value of $154,174 expired and were destroyed in 2008 because of the failure to monitor their expiration dates. The Niger country office explained that it had since created and implemented monitoring tools to strengthen its warehouse stock management;
A/65/5/Add.2
39 10-45045
(b) At the Senegal country office, supplies with a value of $164,119 had been stored in the warehouse for more than six months and for up to five years as at 30 June 2009. The Senegal country office explained that actions had been taken to distribute long-term supply items and that it had made the reduction of long-term storage supply items a priority at the country management team meeting.
187. The delay in the distribution of programme supplies was also addressed by the Office of Internal Audit during its audits of country offices. Stocking supplies in warehouses for long periods could affect the efficient utilization of programme supplies.
188. UNICEF agreed with the Board’s recommendation that it ensure that the Niger and Senegal country offices take measures to prevent the long-term storage and expiration of supply items.
Storage conditions at warehouses
189. Section 2, chapter 11, of the Supply Manual provides that UNICEF should physically improve the fabric of warehouses in order to ensure safe and adequate storage conditions. At the Senegal country office, the warehouse, which was used to store medicine and food, did not have a thermometer or a hygrometer for monitoring temperature and humidity and there was no air conditioner or other equipment in place to ventilate the warehouse.
190. At the Yemen and Nepal country offices, some programme supplies, including vaccines and injectors, were stored in the warehouses managed by implementing partners. The sanitary conditions at those warehouses needed to be improved. For example, at the warehouse managed by an implementing partner in Yemen, there were no thermometers or air conditioners in the warehouse, despite the requirement that Plasmotrim be stored at less than 25 degrees centigrade.
191. Unsatisfactory storage conditions at the warehouse could affect the quality of programme supplies.
192. The Board recommends that UNICEF ensure that all country offices, in coordination with implementing partners when necessary, improve the conditions for the storage of programme supplies.
13. Human resources management
Vacancy rate
193. As at 31 December 2009, of a total of 10,518 approved UNICEF posts, including international Professional, National Professional Officer and General Service posts, 1,898, or 18 per cent, were vacant. The vacancy rate for international Professional posts (26 per cent) was the highest of the three categories in 2009 and was 28 per cent and 27 per cent for 2007 and 2008, respectively. While this indicates some improvement, the vacancy rate for international Professional posts remains relatively high. Of 778 international Professional posts vacant as at 31 December 2009, 135, or 17 per cent, had been vacant since 2008 and 34 had been vacant since 2005. A total of 98 of those posts were at the P-5/L-5 level or above.
194. In 13 field offices/headquarter divisions, vacancy rates were more than 30 per cent. High vacancy rates could weaken the capacity of the field offices to implement their planned activities.
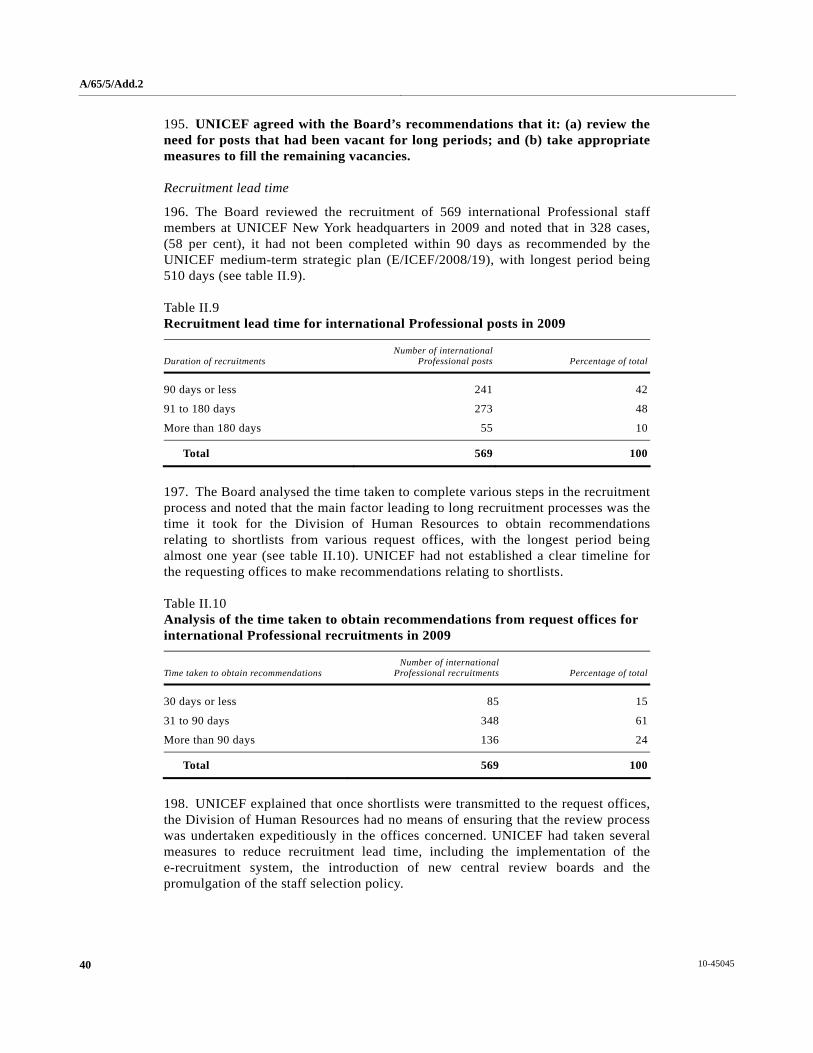
A/65/5/Add.2
10-45045 40
195. UNICEF agreed with the Board’s recommendations that it: (a) review the need for posts that had been vacant for long periods; and (b) take appropriate measures to fill the remaining vacancies.
Recruitment lead time
196. The Board reviewed the recruitment of 569 international Professional staff members at UNICEF New York headquarters in 2009 and noted that in 328 cases, (58 per cent), it had not been completed within 90 days as recommended by the UNICEF medium-term strategic plan (E/ICEF/2008/19), with longest period being 510 days (see table II.9).
Table II.9 Recruitment lead time for international Professional posts in 2009
Duration of recruitments Number of international
Professional posts Percentage of total
90 days or less 241 42
91 to 180 days 273 48
More than 180 days 55 10
Total 569 100
197. The Board analysed the time taken to complete various steps in the recruitment process and noted that the main factor leading to long recruitment processes was the time it took for the Division of Human Resources to obtain recommendations relating to shortlists from various request offices, with the longest period being almost one year (see table II.10). UNICEF had not established a clear timeline for the requesting offices to make recommendations relating to shortlists.
Table II.10 Analysis of the time taken to obtain recommendations from request offices for international Professional recruitments in 2009
Time taken to obtain recommendations Number of international
Professional recruitments Percentage of total
30 days or less 85 15
31 to 90 days 348 61
More than 90 days 136 24
Total 569 100
198. UNICEF explained that once shortlists were transmitted to the request offices, the Division of Human Resources had no means of ensuring that the review process was undertaken expeditiously in the offices concerned. UNICEF had taken several measures to reduce recruitment lead time, including the implementation of the e-recruitment system, the introduction of new central review boards and the promulgation of the staff selection policy.
A/65/5/Add.2
41 10-45045
199. Long recruitment processes for international Professional staff members could have a negative impact on the effective operation of the requesting offices/divisions.
200. UNICEF agreed with the Board’s recommendation that it set up a clear timeline for requesting offices/divisions to make recommendations relating to shortlists so as to expedite the recruitment process.
Performance evaluation
201. The Board reviewed a sample of 413 performance evaluation reports from UNICEF New York headquarters for 2009 and noted that 126 such reports, or 31 per cent, had not been completed within the time frame set in the UNICEF Human Resources Manual. In addition, each office/division at New York headquarters maintained its own performance evaluation reports, and the respective heads of offices/divisions were accountable for the timely completion of the reports. However, no office/division was responsible for monitoring the completion status of the reports, and the overall completion rate was unavailable at the time of audit.
202. In seven UNICEF offices (the Innocenti Research Centre, the Regional Office for South Asia, the Eastern and Southern Africa Regional Office, the Western and Central Africa Regional Office and the country offices in Nepal, Senegal and the United Republic of Tanzania), some performance evaluation reports for 2008 had not been completed in a timely manner as required by the UNICEF Human Resources Manual.
203. UNICEF indicated that the delay in the completion of performance evaluation reports was due mainly to competing priorities and project deadlines, as well as a heavy year-end workload. UNICEF also explained that an electronic performance appraisal system (e-PAS) was being piloted in 2010, which would be used for the timely processing and monitoring of performance appraisals in future.
204. The delay in the completion of performance evaluation reports could weaken the effectiveness of such reports in motivating staff members and affect the performance evaluation process.
205. UNICEF agreed with the Board’s recommendation that it: (a) adhere strictly to the provisions of UNICEF Human Resources Manual in relation to performance evaluation; and (b) establish a mechanism to monitor the overall completion rate of the performance evaluation reports.
14. Consultants, experts and temporary assistance
Selection process
206. In its previous report (A/63/5/Add.2 and Corr.1, chap. II, para. 156), the Board noted that some UNICEF offices had hired or rehired their contractors from a sole source, and it had recommended that UNICEF comply with the requirement of the UNICEF Human Resources Manual in relation to consultant selection.
207. At the Supply Division, 5 out of 14 individual consultants contracted in 2008 were selected through the sole source approach. The justification for using the sole source approach in the selection of one consultant was not documented, while justifications in the other four cases were not consistent with the requirements of the UNICEF Human Resources Manual.
A/65/5/Add.2
10-45045 42
208. At the Middle East and North Africa Regional Office, 10 of 25 consultants and individual contractors sampled in 2008 had been selected through the sole source method, but no justification was offered in four cases.
209. In 2009, UNICEF New York headquarters signed 78 contracts with former/retired staff members; 13 contracts (17 per cent) were entered into without the approval of the Director of the Division of Human Resources, as required by the UNICEF Human Resources Manual.
210. The selection of consultants and individual contractors through the sole source approach without sufficient justification and the awarding of contracts to former/retired staff members without the approval of the Director of the Division of Human Resources could affect the quality of service rendered.
211. UNICEF agreed with the Board’s recommendation that it strictly comply with the requirements of the UNICEF Human Resources Manual relating to the selection of consultants and individual contractors.
212. UNICEF commented that it planned to raise awareness of existing policies internally.
Performance evaluation
213. Section 2, chapter 6, of the UNICEF Human Resources Manual requires that the work and performance of all consultants and individual contractors be evaluated, and no final payments against contracts can be made until an evaluation has been submitted, stating that the entire assignment has been satisfactorily completed.
214. In its previous report (A/63/5/Add.2 and Corr.1, chap. II, para. 152), the Board noted that at the India country office, payments had been made to some consultants/contractors without an effective evaluation of the quality of their work, and it had recommended that UNICEF comply with the performance evaluation provisions of the UNICEF Human Resources Manual.
215. In four country offices (Nepal, Kenya, Tajikistan and Yemen), final payments for 33 special service agreements were made to contractors without an evaluation of their performance regarding the accomplishment of agreed deliverables having been conducted. UNICEF explained that some contracts had been evaluated without being marked as “evaluated” in the Programme Manager System. In addition, some contracts were jointly supervised by several sections, and insufficient coordination among sections resulted in final payment being made without a final evaluation.
216. UNICEF agreed with the Board’s recommendation that it ensure that all country offices strictly comply with the requirements of the UNICEF Human Resources Manual in relation to the performance evaluation of consultants and individual contractors.
15. Information technology
System user account administration
217. The UNICEF user provisioning and password policy requires that user accounts be closed upon contract expiration contract termination, or retirement. The Systems, Applications and Products (SAP) security administration procedures

A/65/5/Add.2
43 10-45045
require that if the user has not logged into the SAP system for more than one year, the user account is to be closed.
218. At UNICEF New York headquarters, the Board reviewed the SAP user list generated by the system on 16 April 2010 and noted that 89 users had not logged into the system for more than one year, including 17 who had not logged in for more than two years. However, those accounts had not been closed as at the time of audit.
219. At the country office in the United Republic of Tanzania, the Board reviewed the Programme Manager System user list generated on 24 August 2009 and noted that 11 staff member accounts remained active even though those staff members had been gone from the office for periods ranging from 3 to 12 months. Delays in the closure of former staff member accounts could result in unauthorized access to confidential information.
220. UNICEF agreed with the Board’s recommendation that user accounts be closed in a timely manner in accordance with the requirements of the user provisioning and password policy and the Systems, Applications and Products security administration procedures.
Physical controls at data centres
221. UNICEF information and communications technology requirements and recommendations for 2008-2009 require that file servers and other data centre components be placed in a secure, dust- and static-free and heat-controlled environment, with a stable and earthed power source backed up by a UNICEF standard uninterruptible power supply and generators where needed. At the Niger country office, the power supply, to cleaning of and anti-static and safety precaution controls at the data centre were not adequate, while the data centre at the Cambodia country office had no humidity-control equipment. In addition, those country offices had not established specific guidelines or procedures in relation to physical controls at the data centres.
222. UNICEF agreed with the Board’s recommendation that it ensure that the Niger and Cambodia country offices establish and enforce specific guidelines or procedures to improve the physical controls at their data centres.
16. Enterprise resource planning systems
223. UNICEF made a strategic decision in 2008 to move to one enterprise resource planning application system (“One ERP”) to enhance business efficiency and effectiveness. The “One ERP” project would be closely linked to UNICEF improvement initiatives, including the commitment made by the Fund to the General Assembly to become IPSAS-compliant.
224. According to the “One ERP” project charter, there are nine phases for the implementation of the project, namely, preparation; finalization of scope; sign-off of charter; business blueprint; sign-off of blueprint; realization; upgrading of global infrastructure; global training; and final preparation for deployment. UNICEF plans to roll out the new system to all UNICEF offices by the end of 2011 so that the entire organization is on an IPSAS-compliant platform in 2012.
225. UNICEF had completed the first five phases and was currently entering the phases of “realization” and “upgrading of global infrastructure”. Under those two

A/65/5/Add.2
10-45045 44
phases, there are six major tasks, namely, system development; system testing; the updating of the regulatory framework; training preparation and development; preparation for the roll-out; and the setting up and development of support capacity. Some activities relating to the updating of the regulatory framework had, however, been delayed. For example, six divisions had needed to outline changes in 205 policies or procedures by the end of March 2010, but no outline had been provided by the end of April. The delay in the updating of the regulatory framework could affect the implementation of the “One ERP” project and the achievement of the improvement initiatives of UNICEF.
226. The Board recommends that UNICEF expedite the implementation of the “One ERP” project in accordance with its project plan.
17. Internal audit function
227. The Board reviewed the work of the Office of Internal Audit relating to its audit coverage of UNICEF offices as well as its audit management process. The Office adopts a risk-based audit methodology and plans its audit activities on an annual basis. According to the office management plan of the Office of Internal Audit for the biennium 2008-2009, 68 audits were planned, including 50 country office audits and 18 headquarters, systems and thematic audits. As at 31 December 2009, the Office of Internal Audit had completed 68 audits, as planned.
228. As indicated in the audit management process flow chart of the Office of Internal Audit, the audit report is to be issued within 10 weeks of the clearance of audit observations with the auditee at the time of the exit meeting. UNICEF indicated that it took an average of 11.6 weeks in 2008 and 15.5 weeks in 2009 to issue country office audit reports. Those delays were due mainly to the introduction of the new reporting approach. In addition, a number of country offices took considerable time to provide their comments, which further contributed to the delays. This matter was discussed at the January 2010 workshop and the Office of Internal Audit was considering revising the standard.
229. According to its terms of reference, the UNICEF Audit Advisory Committee provides advice on the strengthening of the UNICEF oversight system. During the period under review, the Committee reviewed and endorsed the annual workplan of the Office of Internal Audit and regularly monitored the status of implementation of audit plan and audit recommendations. The annual reports of the Office of Internal Audit were also submitted to the Committee.
Implementation of internal audit recommendations
230. According to the 2008-2009 office management plan of the Office of Internal Audit, there should be no recommendations outstanding for more than 18 months. However, 32 audit recommendations were outstanding for more than 18 months as at 31 December 2009. As at 31 March 2010, there were still 7 audit recommendations outstanding for more than 18 months. These were made in 2007 and relate to the regional offices and headquarters.
231. UNICEF explained that it took more time to close a recommendation stemming from a headquarters or regional office audit than it took to close one stemming from a country office audit because the recommendations generally required structural changes in the oversight, policy and guidance, and performance measurement and reporting systems.
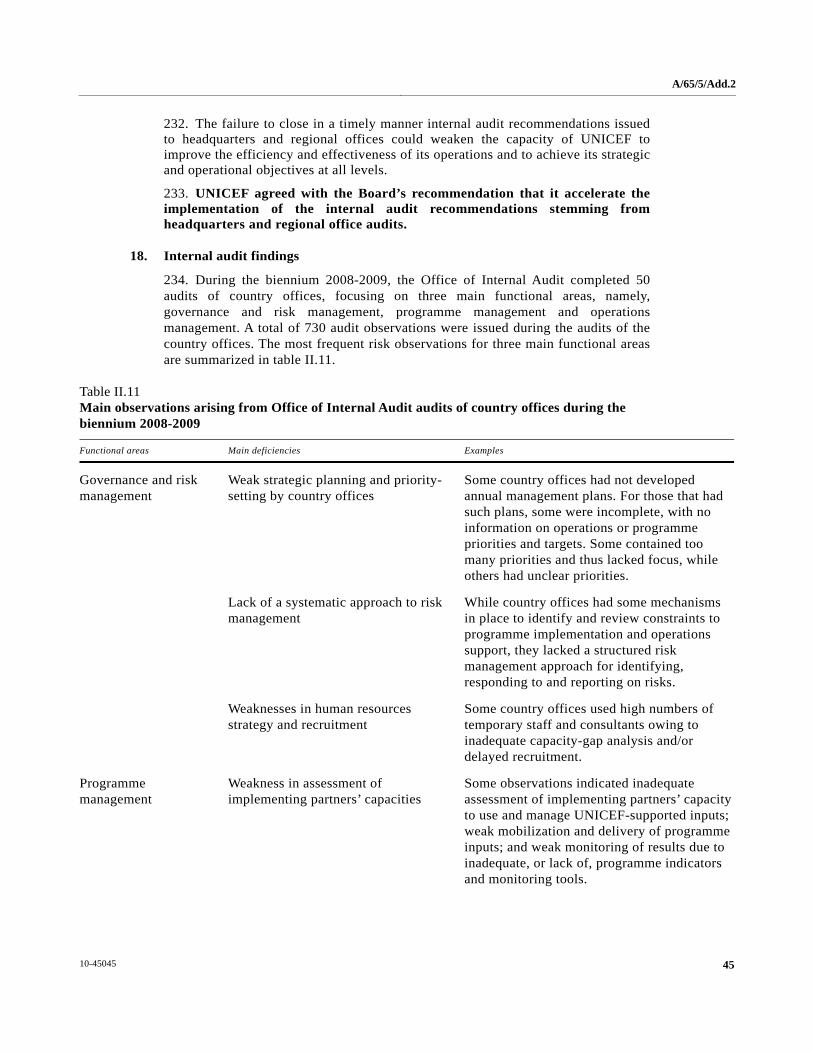
A/65/5/Add.2
45 10-45045
232. The failure to close in a timely manner internal audit recommendations issued to headquarters and regional offices could weaken the capacity of UNICEF to improve the efficiency and effectiveness of its operations and to achieve its strategic and operational objectives at all levels.
233. UNICEF agreed with the Board’s recommendation that it accelerate the implementation of the internal audit recommendations stemming from headquarters and regional office audits.
18. Internal audit findings
234. During the biennium 2008-2009, the Office of Internal Audit completed 50 audits of country offices, focusing on three main functional areas, namely, governance and risk management, programme management and operations management. A total of 730 audit observations were issued during the audits of the country offices. The most frequent risk observations for three main functional areas are summarized in table II.11.
Table II.11 Main observations arising from Office of Internal Audit audits of country offices during the biennium 2008-2009
Functional areas Main deficiencies Examples
Governance and risk management
Weak strategic planning and priority-setting by country offices
Some country offices had not developed annual management plans. For those that had such plans, some were incomplete, with no information on operations or programme priorities and targets. Some contained too many priorities and thus lacked focus, while others had unclear priorities.
Lack of a systematic approach to risk management
While country offices had some mechanisms in place to identify and review constraints to programme implementation and operations support, they lacked a structured risk management approach for identifying, responding to and reporting on risks.
Weaknesses in human resources strategy and recruitment
Some country offices used high numbers of temporary staff and consultants owing to inadequate capacity-gap analysis and/or delayed recruitment.
Programme management
Weakness in assessment of implementing partners’ capacities
Some observations indicated inadequate assessment of implementing partners’ capacity to use and manage UNICEF-supported inputs; weak mobilization and delivery of programme inputs; and weak monitoring of results due to inadequate, or lack of, programme indicators and monitoring tools.

A/65/5/Add.2
10-45045 46
Functional areas Main deficiencies Examples
Weakness in evaluation functions At some country offices, the programme evaluations were not properly prioritized or implemented on time, and/or their recommendations were not rigorously monitored, thereby weakening institutional knowledge of programme effectiveness and accurate reporting on the achievement of multi-year results.
Insufficient knowledge of the situation of children and weak advocacy for children’s rights
Some country offices did not have current relevant data and information on the situation of children — thereby weakening the identification of priority needs of children and the design of country programmes and advocacy plans. In addition, they did not sufficiently support national data collection and analysis by partners. In some country offices, there were no structured advocacy plans with clear strategies, assigned responsibilities, resources and targets for the measurement of progress in the realization of children’s rights.
Operations management
Weaknesses in the processing of financial transactions and implementation of financial controls
Sampled payments for the procurement of goods and services were not always processed on time, fully supported, correctly coded and in compliance with relevant financial requirements. In the majority of offices audited, the goods were not always certified as received. For the offices that had implemented the harmonized approach to cash transfers, there were delays in the processing of direct cash transfer requests from partners.
Weakness in procurement of supplies and selection of suppliers
Market surveys were often outdated; supplier databases were either lacking or outdated; contracts were at times issued prior to proposal review by the contract review committee; and bids were sometimes not processed properly.
Deficiencies in the management of inventory and assets
At some country offices, there was generally no physical count of inventory; there was delayed implementation or weak monitoring of the status of recommendations of the property survey board; a parallel manual system was used in recording assets in addition to the standard database; and there were some delays in the distribution of programme supplies to implementing partners.

A/65/5/Add.2
47 10-45045
235. During the biennium 2008-2009, OIA completed 18 headquarters, systems and thematic audits. The key observations are summarized in table II.12.
Table II.12 Main observations arising from the headquarters, system and thematic audits undertaken by the Office of Internal Audit during the biennium 2008-2009
Topics Main deficiencies
Audit of UNICEF guidance and support for efficient operation functions in country offices
There was no guidance on the measurement of the efficiency of the main support functions in country offices and no global efficiency indicators — which link costs with the results of the main support functions — to assist UNICEF in overseeing the efficiency of country office operations functions.
Audit of treasury management Improvements were required in areas such as the roles, responsibilities and composition of the oversight committee; cash forecasting; completeness of treasury guidelines and agreements with bank partnerships; and benchmark selection to judge performance of investments.
Audit of the management of evaluation in country offices
Weaknesses included a low percentage of satisfactory-quality evaluations at country office level, insufficient guidance to enable strategic selection of evaluations and lack of a clear distinction between programme and institutional evaluations.
Audit of oversight and operations support provided to the country offices by the regional offices
Improvements were required in developing guidance and standards to ensure the right support for the country offices where and when it is needed.
Audit of the management of the information and communications technology function in country offices
There was no identification of appropriate organizational frameworks and resource allocations for information and communications technology services in different types of location; no guidance was provided on information and communications technology governance structures, strategies and expected services at the country level; and regional and country offices did not have tools to monitor computer misuse or attempted security violations.
19. Revenue-producing activities
Regular resources and global thematic funds
236. According to section 2 of the executive directive on fund-raising (CF/Exd/2003-013), UNICEF should make efforts to increase regular resources and global thematic funds under other resources for the five organizational priorities. Global thematic funds are the best alternative to regular resources.
237. UNICEF regular resources decreased by 0.5 per cent from $2.16 billion in 2006-2007 to $2.15 billion in 2008-2009. The proportion of regular resources to total income decreased by 5 per cent from 37 per cent in 2006-2007 to 32 per cent in 2008-2009. In addition, the 2008-2009 financial statements indicated that, as at 31 December 2009, the funds to be raised from regular resources for approved programmes and appropriations amounted to $1.73 billion, compared with $717 million as at 31 December 2007, an

A/65/5/Add.2
10-45045 48
increase of $1.01 billion, or 141 per cent. This indicated that UNICEF needed to intensify its efforts to raise more regular resources.
238. Overall global thematic funds increased by 6 per cent from $600 million in 2006-2007 to $638 million in 2008-2009. However, the global thematic funds as a percentage to other resources decreased by 3 per cent from 17 per cent in 2006-2007 to 14 per cent in 2008-2009. UNICEF explained that the financial crisis in 2008 had had an impact on UNICEF regular resource fund-raising. In addition, several major donors reduced their contributions owing to Government budget cuts. The decrease in thematic funds resulted from many factors, including donor interest in new ways of funding or in funding different agencies and changes in donor policy and governance.
239. The decline in the proportion of regular resources to overall income and the decrease in thematic funds as a percentage of other resources could affect the capacity of UNICEF to provide continued leadership on child-related priorities, as well as its ability to realize its medium-term strategic plan for the period 2006-2011.
240. UNICEF agreed with the Board’s recommendation that it strengthen advocacy and communication with current and potential donors to increase regular resources and global thematic funds.
Income retention by National Committees from the sale of greeting cards and gifts
241. According to the standard cooperation agreement between the National Committees and UNICEF, each National Committee may be authorized to retain up to 25 per cent of its revenue (including the gross proceeds from sales of greeting cards and gifts as well as revenue from private sector fund-raising activities) to UNICEF.
242. In its previous report (A/63/5/Add.2 and Corr.1, chap. II, paras. 185 to 188), the Board noted that the income-retention rates of National Committees relating to the sale of greeting cards and gifts had exceeded the ceiling of 25 per cent, and it had recommended that UNICEF enforce the provisions of the UNICEF Financial Regulations and Rules in relation to income retention and evaluate the applicability of the 25 per cent retention rate. In its relevant report (A/63/474), the Advisory Committee on Administrative and Budgetary Questions concurred with the Board’s recommendation that UNICEF ensure that the 25 per cent retention limit is applied and, if necessary, evaluate and formalize any exceptions to the rule.
243. In 2008 and 2009, there were 29 and 27 National Committees, respectively, that had retention rates for sales of greeting cards and gifts greater than 25 per cent. In addition, 24 National Committees had overall retention rates for revenue (including both the gross proceeds from the sales of greeting cards and gifts and revenue from private-sector fund-raising activities) greater than 25 per cent in both 2008 and 2009.
244. UNICEF explained that it had included the evaluation of retention rates in the joint strategic planning and renegotiation processes of the new cooperation agreement with the National Committees. The renegotiation process was still ongoing at the time of audit.
245. The Board reiterates its previous recommendation that the Private Fund-raising and Partnerships Division adhere strictly to the provisions of the UNICEF Financial Regulations and Rules in relation to the retention of income by National Committees.
Joint strategic plan
246. The joint strategic plan is the primary mechanism permitting UNICEF and the National Committees to work together to increase revenues for UNICEF programmes

A/65/5/Add.2
49 10-45045
and promote UNICEF goals. As at 20 April 2010, 2 joint strategic plans covering the period 2009-2011 and 14 covering the period 2010-2012 had not been signed between UNICEF and National Committees. UNICEF explained that of the 16 National Committees that had not signed the joint strategic plans, 4 were still negotiating with UNICEF on plan provisions; 6 would sign the plans later in 2010 and the remaining 6 had not decided when to sign them.
247. UNICEF agreed with the Board’s recommendation that it ensure that the Private Fund-raising and Partnerships Division accelerates the negotiations with National Committees and signs the joint strategic plan as early as possible.
Submission of donor reports
248. The Programme Policy and Procedures Manual requires UNICEF offices to ensure timely and good quality reports to account for the resources entrusted to the organization and to help raise additional resources. In its previous report (A/63/5/Add.2 and Corr.1, chap. II, para. 39), the Board noted that the donor reports of seven field offices were submitted after the due date, and it had recommended that UNICEF determine the cause of the delays and institute measures to ensure that the reports are submitted in accordance with donor agreements.
249. The Board reviewed the efforts undertaken by UNICEF to implement that recommendation and noted that the percentage of donor reports submitted on time by country offices increased from 77 per cent in 2007 to 82 per cent in 2009. According to the report prepared by UNICEF New York headquarters, 596 (18 per cent) of 3,324 donor reports were not submitted on time by country offices in 2009. In addition, in 10 offices (the Innocenti Research Centre, the Regional Office for South Asia, the Regional Office for East Asia and the Pacific, the Western and Central Africa Regional Office, the Middle East and North Africa Regional Office and the country offices in Cambodia, Tajikistan, the Niger, Senegal and Nepal), 155 sampled donor reports were submitted after the due date, with delays ranging from 1 to 437 days (see table II.13).
Table II.13 Delays in submission of donor reports in UNICEF offices during the period under review
Office Number of
reports due
Number of reports not submitted
on time Length of delay
1 Innocenti Research Centre 25 20 Unspecified
2 Regional Office for South Asia 13 6 3-106 days
3 Regional Office for East Asia and the Pacific 22 8 6-36 days
4 Western and Central Africa Regional Office 48 30 30-437 days
5 Middle East and North Africa Regional Office 22 4 Over 30 days
6 Cambodia country office 22 3 Unspecified
7 Tajikistan country office 14 2 Unspecified
8 Nepal country office — 31 Unspecified
9 Niger country office 76 33 7-30 days
10 Senegal country office 28 18 1-135 days
A/65/5/Add.2
10-45045 50
250. UNICEF explained that delays in the submission of donor reports were due mainly to: (a) capacity limitations arising from the high vacancy rates and high turnover rates of programme staff members; (b) the difficulties in collecting data from remote zones, where the national counterparts had the weakest capacity; and (c) external factors, such as humanitarian crises, that had an impact on the normal business operations of the offices.
251. Delays in the submission of reports to donors could result in the failure of UNICEF to meet donors’ expectations regarding accurate and timely reporting and could affect their enthusiasm to contribute to UNICEF programme activities in the future.
252. UNICEF agreed with the Board’s reiterated recommendation that it determine the cause of the delays in donor reporting by field offices and institute measures to ensure that reports are submitted in accordance with donor agreements.
Donor report checklist
253. The UNICEF Programme Policy and Procedures Manual provides for UNICEF offices to prepare their donor reports in accordance with the requirements of the checklist and attach the completed checklist when submitting such reports. At seven field offices (the Western and Central Africa Regional Office, the Regional Office for East Asia and the Pacific, the Middle East and North Africa Regional Office, the Regional Office for South Asia and the country offices in Cambodia, Senegal and Nepal), some donor reports were not prepared or submitted in accordance with the provisions of the Manual, as set out below:
(a) At the Cambodia, Senegal and Nepal country offices and the Regional Office for South Asia, the relevant staff members did not complete the checklists while reviewing the contents of donor reports, or did not attach the checklists to the donor reports;
(b) At the Western and Central Africa Regional Office, the Regional Office for East Asia and the Pacific, the Middle East and North Africa Regional Office and the Nepal country office, some important components of the donor reports, such as the future workplan, the comparison between planned and achieved results and the fund utilization report, were absent.
254. The absence of completed checklists or of important components of the donor reports could influence the quality of such reports, which could adversely affect the fund-raising ability of UNICEF.
255. UNICEF agreed with the Board’s recommendation that it ensure that all field offices strictly comply with the provisions of the Programme Policy and Procedures Manual in the preparation and submission of donor reports.
Oversight of donor reporting performance of country offices
256. The UNICEF Programme Policy and Procedures Manual provides for regional offices to be responsible for monitoring and conducting sample assessments of country office donor reporting performance. At four regional offices, some weaknesses existed in connection with the oversight of the donor reporting performance of country offices, as set out below:
(a) The Western and Central Africa Regional Office, the Regional Office for East Asia and the Pacific and the Regional Office for Central and Eastern Europe and
A/65/5/Add.2
51 10-45045
the United States did not conduct sample assessments of the donor reporting performance of country offices during the financial period under review. The Western and Central Africa Regional Office and the Regional Office for East Asia and the Pacific had developed a quality assurance checklist to monitor the quality of country office donor reports, but the checklist was not utilized;
(b) The Middle East and North Africa Regional Office contracted a consultant to review the donor reports prepared by the country offices. However, it did not implement the recommendations made in the consultant’s report.
257. UNICEF explained that some regional offices paid more attention to the timely submission of donor reports than to the quality of such reports when monitoring the country office reporting performance.
258. UNICEF agreed with the Board’s recommendation that it ensure that all regional offices conduct monitoring and sample assessments of country office donor reporting performance in accordance with Programme Policy and Procedures Manual.
20. Travel management
Travel plan
259. The UNICEF Administration Manual provides for a travel plan to be prepared, updated quarterly and approved by the head of the office. In its previous report (A/63/5/Add.2 and Corr.1, chap. II, paras. 204 and 205), the Board noted that three field offices had not prepared travel plans, and it had recommended that UNICEF ensure that the relevant field offices prepare travel plans in line with the Manual. The Board reviewed the actions taken by the three field offices to address this recommendation and considered it implemented. However, the following deficiencies in relation to the preparation of travel plans were noted at the Private Fund-raising and Partnerships Division and at three country offices, as set out below:
(a) At the Nepal, Senegal and Tajikistan country offices, there were no office-wide travel plans. For example, during the period from 1 January 2008 to 30 August 2009, the Senegal country office did not prepare a travel plan at the office level. Four programme sections prepared their own travel plans, which were approved by the relevant section chiefs, rather than by the head of the office. At the Nepal country office, only four programme sections had their own travel plans for 2008, which were not approved by the head of the office and did not cover the whole year;
(b) At the Private Fund-raising and Partnerships Division, four sections had no travel plans during the financial period under review.
260. The absence of a travel plan at the office level could hamper the efficiency of travel management.
261. UNICEF agreed with the Board’s reiterated recommendation that it ensure that all offices prepare a travel plan in compliance with the requirements of the UNICEF Administration Manual.
262. UNICEF commented that its offices had prepared their travel plans in 2010.
Submission of travel request forms
263. The UNICEF Human Resources Manual requires staff members to complete and submit travel request forms at least two weeks prior to the anticipated departure dates. In its previous report (A/63/5/Add.2 and Corr.1, chap. II, para. 203), the Board noted that
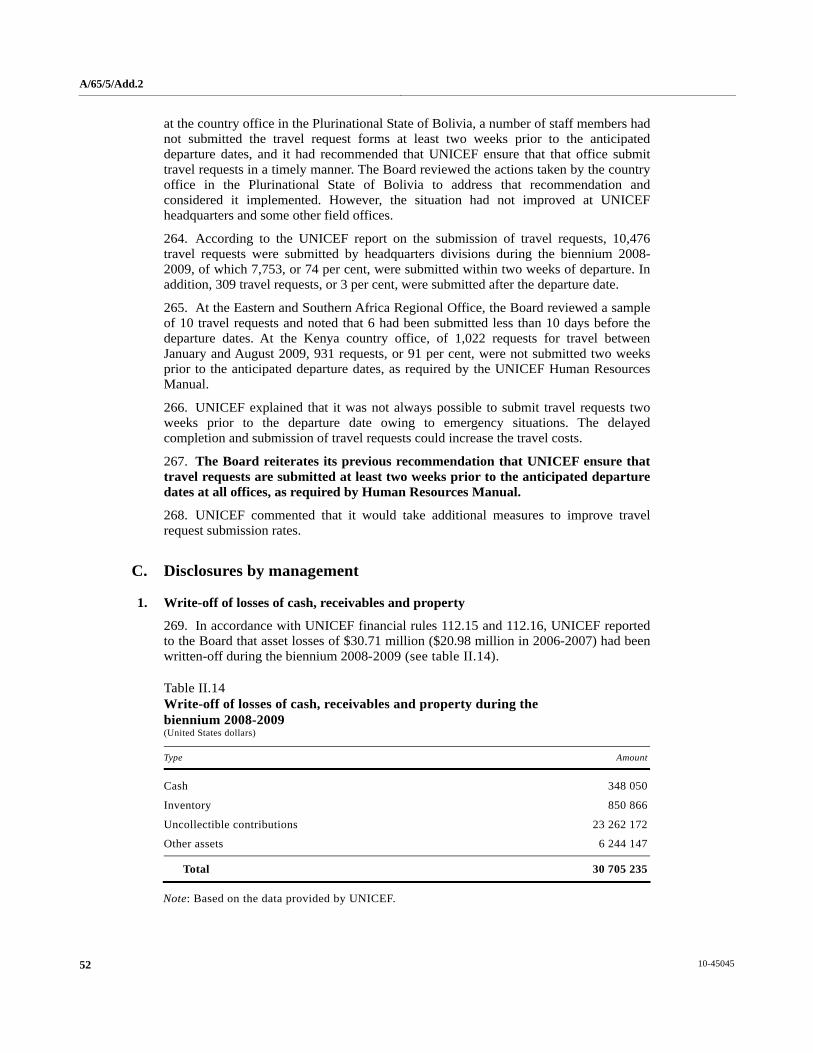
A/65/5/Add.2
10-45045 52
at the country office in the Plurinational State of Bolivia, a number of staff members had not submitted the travel request forms at least two weeks prior to the anticipated departure dates, and it had recommended that UNICEF ensure that that office submit travel requests in a timely manner. The Board reviewed the actions taken by the country office in the Plurinational State of Bolivia to address that recommendation and considered it implemented. However, the situation had not improved at UNICEF headquarters and some other field offices.
264. According to the UNICEF report on the submission of travel requests, 10,476 travel requests were submitted by headquarters divisions during the biennium 2008-2009, of which 7,753, or 74 per cent, were submitted within two weeks of departure. In addition, 309 travel requests, or 3 per cent, were submitted after the departure date.
265. At the Eastern and Southern Africa Regional Office, the Board reviewed a sample of 10 travel requests and noted that 6 had been submitted less than 10 days before the departure dates. At the Kenya country office, of 1,022 requests for travel between January and August 2009, 931 requests, or 91 per cent, were not submitted two weeks prior to the anticipated departure dates, as required by the UNICEF Human Resources Manual.
266. UNICEF explained that it was not always possible to submit travel requests two weeks prior to the departure date owing to emergency situations. The delayed completion and submission of travel requests could increase the travel costs.
267. The Board reiterates its previous recommendation that UNICEF ensure that travel requests are submitted at least two weeks prior to the anticipated departure dates at all offices, as required by Human Resources Manual.
268. UNICEF commented that it would take additional measures to improve travel request submission rates.
C. Disclosures by management
1. Write-off of losses of cash, receivables and property
269. In accordance with UNICEF financial rules 112.15 and 112.16, UNICEF reported to the Board that asset losses of $30.71 million ($20.98 million in 2006-2007) had been written-off during the biennium 2008-2009 (see table II.14).
Table II.14 Write-off of losses of cash, receivables and property during the biennium 2008-2009 (United States dollars)
Type Amount
Cash 348 050
Inventory 850 866
Uncollectible contributions 23 262 172
Other assets 6 244 147
Total 30 705 235
Note: Based on the data provided by UNICEF.
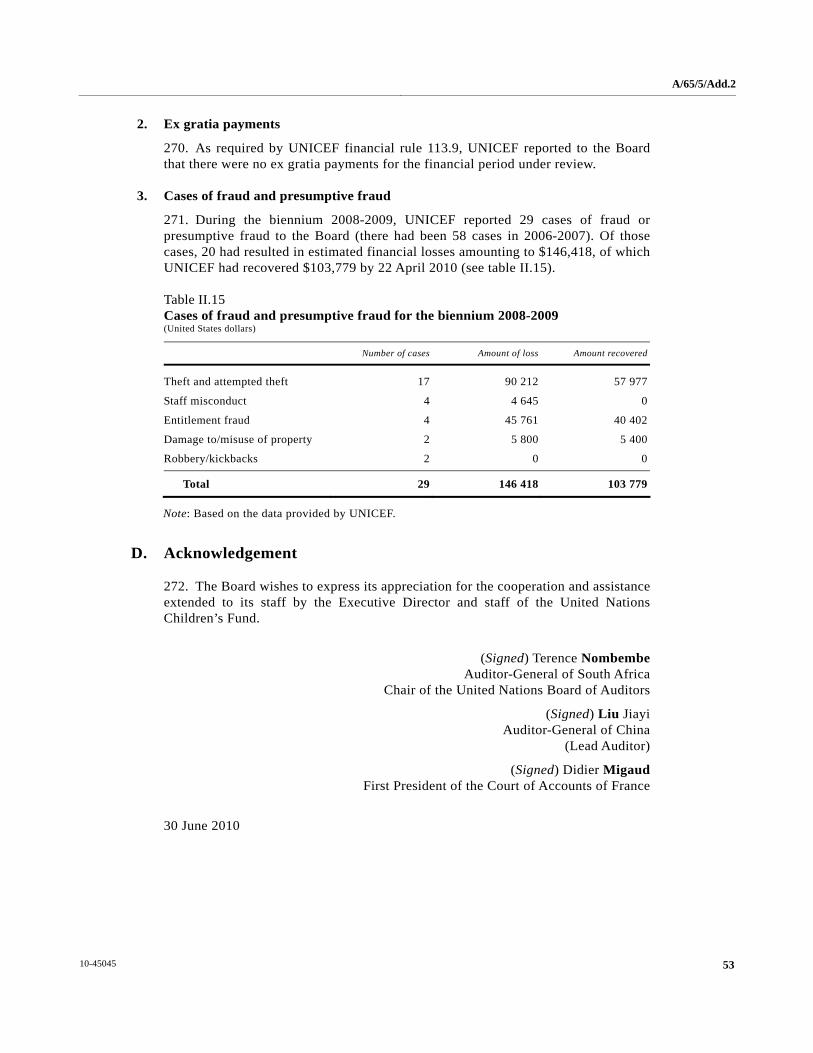
A/65/5/Add.2
53 10-45045
2. Ex gratia payments
270. As required by UNICEF financial rule 113.9, UNICEF reported to the Board that there were no ex gratia payments for the financial period under review.
3. Cases of fraud and presumptive fraud
271. During the biennium 2008-2009, UNICEF reported 29 cases of fraud or presumptive fraud to the Board (there had been 58 cases in 2006-2007). Of those cases, 20 had resulted in estimated financial losses amounting to $146,418, of which UNICEF had recovered $103,779 by 22 April 2010 (see table II.15).
Table II.15 Cases of fraud and presumptive fraud for the biennium 2008-2009 (United States dollars)
Number of cases Amount of loss Amount recovered
Theft and attempted theft 17 90 212 57 977
Staff misconduct 4 4 645 0
Entitlement fraud 4 45 761 40 402
Damage to/misuse of property 2 5 800 5 400
Robbery/kickbacks 2 0 0
Total 29 146 418 103 779
Note: Based on the data provided by UNICEF.
D. Acknowledgement
272. The Board wishes to express its appreciation for the cooperation and assistance extended to its staff by the Executive Director and staff of the United Nations Children’s Fund.
(Signed) Terence Nombembe Auditor-General of South Africa
Chair of the United Nations Board of Auditors
(Signed) Liu Jiayi Auditor-General of China
(Lead Auditor)
(Signed) Didier Migaud First President of the Court of Accounts of France
30 June 2010
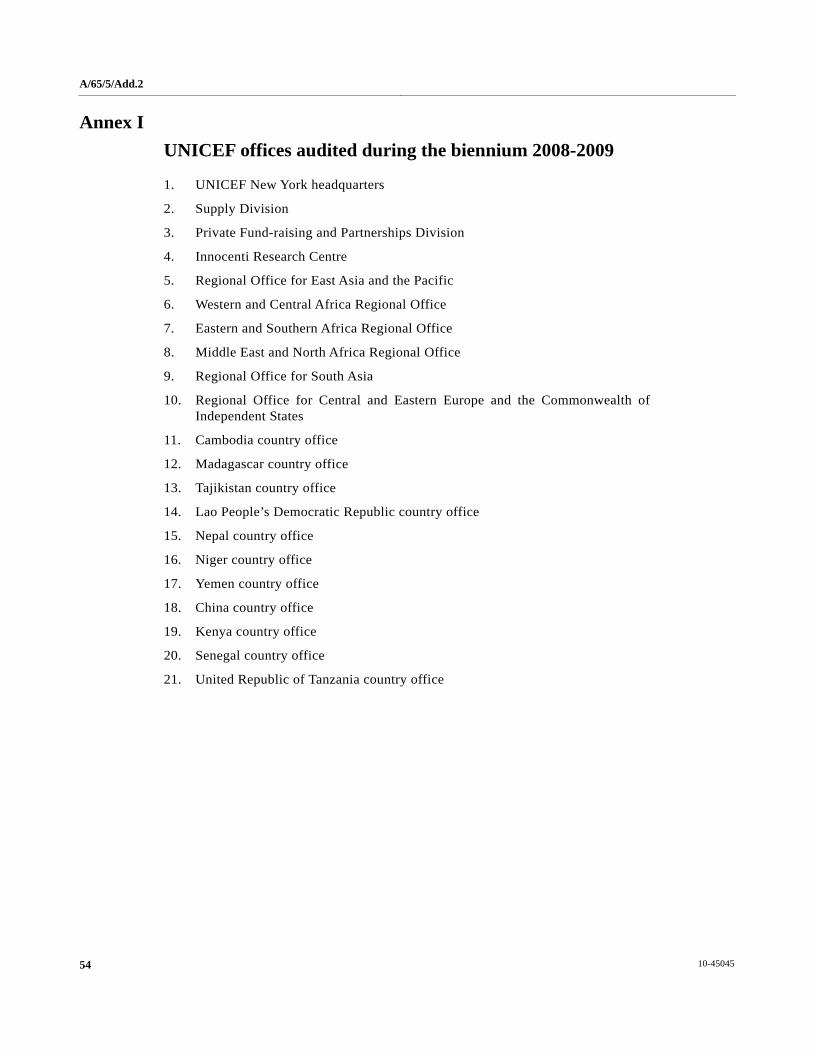
A/65/5/Add.2
10-45045 54
Annex I
UNICEF offices audited during the biennium 2008-2009
1. UNICEF New York headquarters
2. Supply Division
3. Private Fund-raising and Partnerships Division
4. Innocenti Research Centre
5. Regional Office for East Asia and the Pacific
6. Western and Central Africa Regional Office
7. Eastern and Southern Africa Regional Office
8. Middle East and North Africa Regional Office
9. Regional Office for South Asia
10. Regional Office for Central and Eastern Europe and the Commonwealth of Independent States
11. Cambodia country office
12. Madagascar country office
13. Tajikistan country office
14. Lao People’s Democratic Republic country office
15. Nepal country office
16. Niger country office
17. Yemen country office
18. China country office
19. Kenya country office
20. Senegal country office
21. United Republic of Tanzania country office

A/65/5/Add.2
55 10-45045
Annex II
Status of implementation of recommendations for the biennium ended 31 December 2007a
Subject Paragraph
reference Period first
reported Implemented Under
implementation Not
Implemented Overtaken by events Total
Reference in the present report
1. Outstanding budgetary obligations: make the necessary adjustments against reserves and fund balances for the cancellation of outstanding prior-period obligations and consider the cancellation of outstanding obligations relating to the current biennium as a reduction to recorded expenditure instead of as income (New York headquarters) 24 2006-2007 X 1
2. Contributions receivable: assess periodically the collectibility of the amounts shown as contributions receivable and make adequate provision for any amounts that are unlikely to be collected (New York headquarters) 31 2006-2007 X 1
3. Outstanding budgetary obligations: ensure that field offices request headquarters to cancel the remaining balances of outstanding obligations as soon as they are fully settled (all field offices) 36 2006-2007 X 1
4. Donor reporting: determine the cause of the delays in donor reporting by field offices and institute measures to ensure that reports are submitted in accordance with donor agreements (all field offices) 42 2006-2007 X 1 raised
a Official Records of the General Assembly, Sixty-third Session, Supplement No. 53 and corrigendum (A/63/5/Add.2 and Corr.1), chap II.

A/65/5/Add.2
10-45045 56
Subject Paragraph
reference Period first
reported Implemented Under
implementation Not
Implemented Overtaken by events Total
Reference in the present report
5. Contributions: establish an annual contribution target that would serve as a benchmark in assessing the effectiveness of fund-raising programme activities (Tokyo office) 47 2006-2007 X 1
6. Cash assistance to Governments: comply with financial circular 15 (Rev.3) on the issuance of official receipts by recipients of cash assistance (all field offices) 52 2006-2007 X 1 raised
7. Cash assistance to Governments: monitor closely cash assistance provided to Governments to ascertain that it is utilized in accordance with the objectives of the approved projects; clear all long-outstanding cash assistance/transfers to Governments; and make further cash transfers to implementing partners only upon the submission of cash utilization reports (all field offices) 61 2006-2007 X 1 raised
8. Financial control: monitor regularly the changes made in the document authorization tables; update periodically the tables of authority; and establish procedures to ensure that the assignment of financial authorities in the Programme Manager System is consistent with that contained in the table of authority (all field offices) 69 2006-2007 X 1 raised
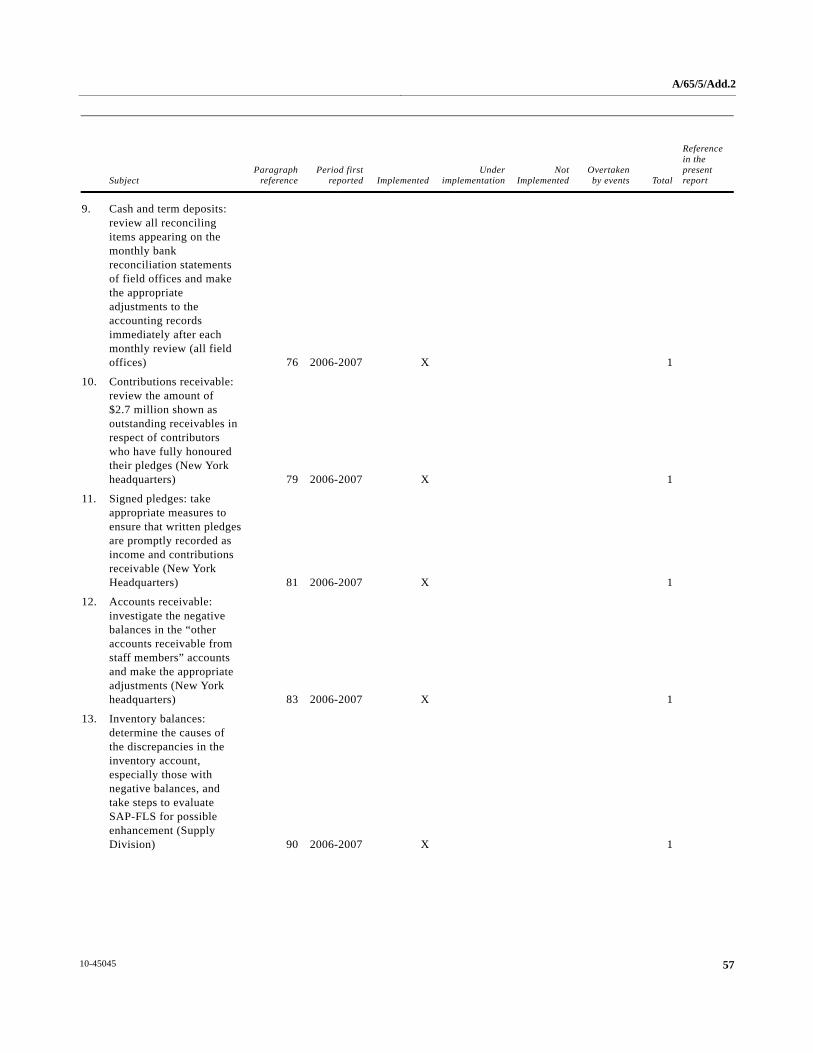
A/65/5/Add.2
57 10-45045
Subject Paragraph
reference Period first
reported Implemented Under
implementation Not
Implemented Overtaken by events Total
Reference in the present report
9. Cash and term deposits: review all reconciling items appearing on the monthly bank reconciliation statements of field offices and make the appropriate adjustments to the accounting records immediately after each monthly review (all field offices) 76 2006-2007 X 1
10. Contributions receivable: review the amount of $2.7 million shown as outstanding receivables in respect of contributors who have fully honoured their pledges (New York headquarters) 79 2006-2007 X 1
11. Signed pledges: take appropriate measures to ensure that written pledges are promptly recorded as income and contributions receivable (New York Headquarters) 81 2006-2007 X 1
12. Accounts receivable: investigate the negative balances in the “other accounts receivable from staff members” accounts and make the appropriate adjustments (New York headquarters) 83 2006-2007 X 1
13. Inventory balances: determine the causes of the discrepancies in the inventory account, especially those with negative balances, and take steps to evaluate SAP-FLS for possible enhancement (Supply Division) 90 2006-2007 X 1
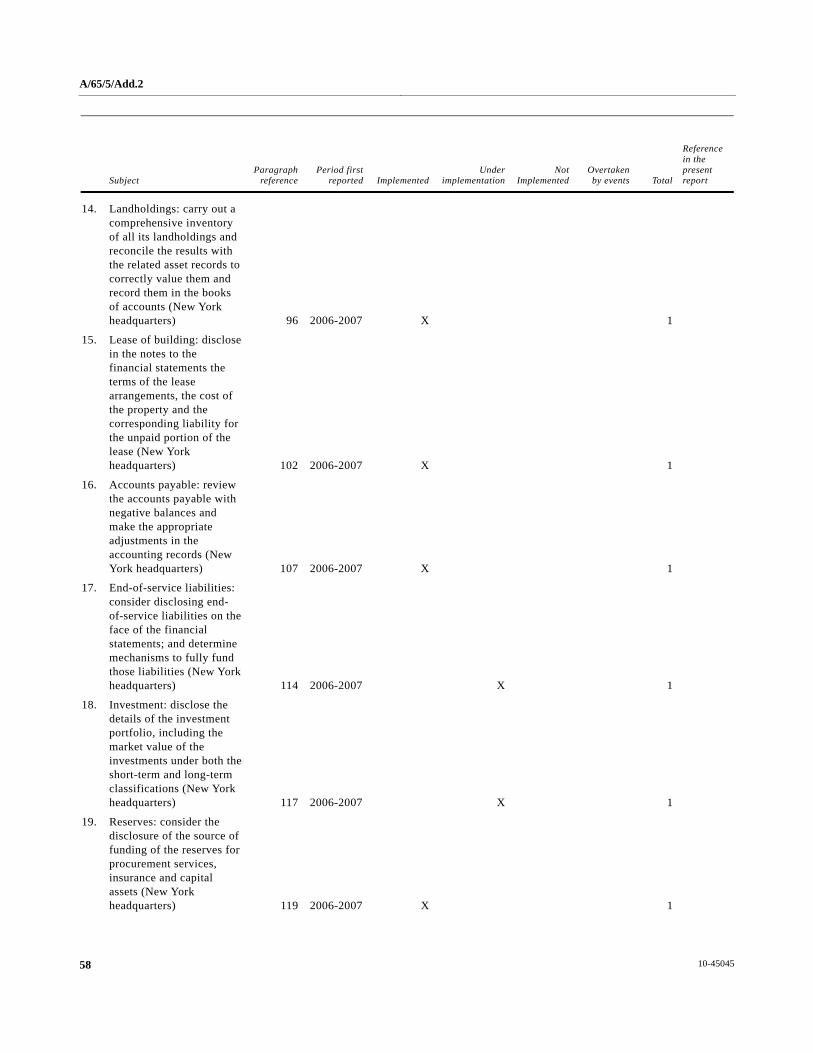
A/65/5/Add.2
10-45045 58
Subject Paragraph
reference Period first
reported Implemented Under
implementation Not
Implemented Overtaken by events Total
Reference in the present report
14. Landholdings: carry out a comprehensive inventory of all its landholdings and reconcile the results with the related asset records to correctly value them and record them in the books of accounts (New York headquarters) 96 2006-2007 X 1
15. Lease of building: disclose in the notes to the financial statements the terms of the lease arrangements, the cost of the property and the corresponding liability for the unpaid portion of the lease (New York headquarters) 102 2006-2007 X 1
16. Accounts payable: review the accounts payable with negative balances and make the appropriate adjustments in the accounting records (New York headquarters) 107 2006-2007 X 1
17. End-of-service liabilities: consider disclosing end-of-service liabilities on the face of the financial statements; and determine mechanisms to fully fund those liabilities (New York headquarters) 114 2006-2007 X 1
18. Investment: disclose the details of the investment portfolio, including the market value of the investments under both the short-term and long-term classifications (New York headquarters) 117 2006-2007 X 1
19. Reserves: consider the disclosure of the source of funding of the reserves for procurement services, insurance and capital assets (New York headquarters) 119 2006-2007 X 1
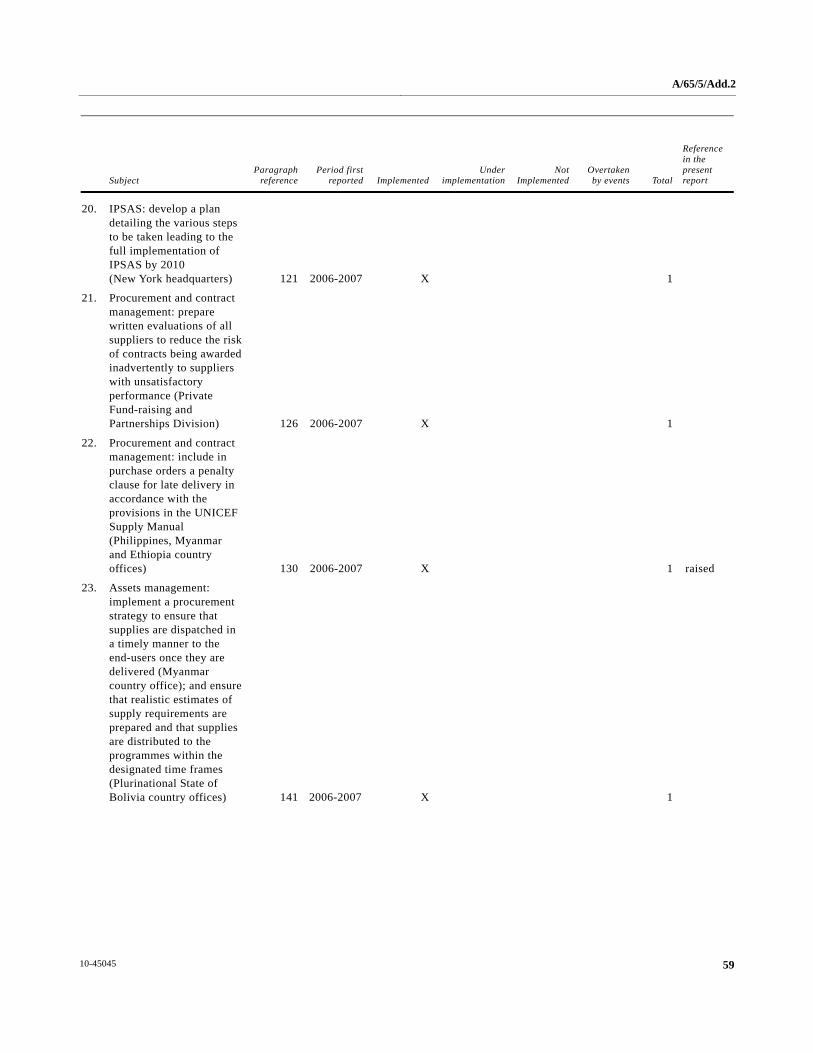
A/65/5/Add.2
59 10-45045
Subject Paragraph
reference Period first
reported Implemented Under
implementation Not
Implemented Overtaken by events Total
Reference in the present report
20. IPSAS: develop a plan detailing the various steps to be taken leading to the full implementation of IPSAS by 2010 (New York headquarters) 121 2006-2007 X 1
21. Procurement and contract management: prepare written evaluations of all suppliers to reduce the risk of contracts being awarded inadvertently to suppliers with unsatisfactory performance (Private Fund-raising and Partnerships Division) 126 2006-2007 X 1
22. Procurement and contract management: include in purchase orders a penalty clause for late delivery in accordance with the provisions in the UNICEF Supply Manual (Philippines, Myanmar and Ethiopia country offices) 130 2006-2007 X 1 raised
23. Assets management: implement a procurement strategy to ensure that supplies are dispatched in a timely manner to the end-users once they are delivered (Myanmar country office); and ensure that realistic estimates of supply requirements are prepared and that supplies are distributed to the programmes within the designated time frames (Plurinational State of Bolivia country offices) 141 2006-2007 X 1
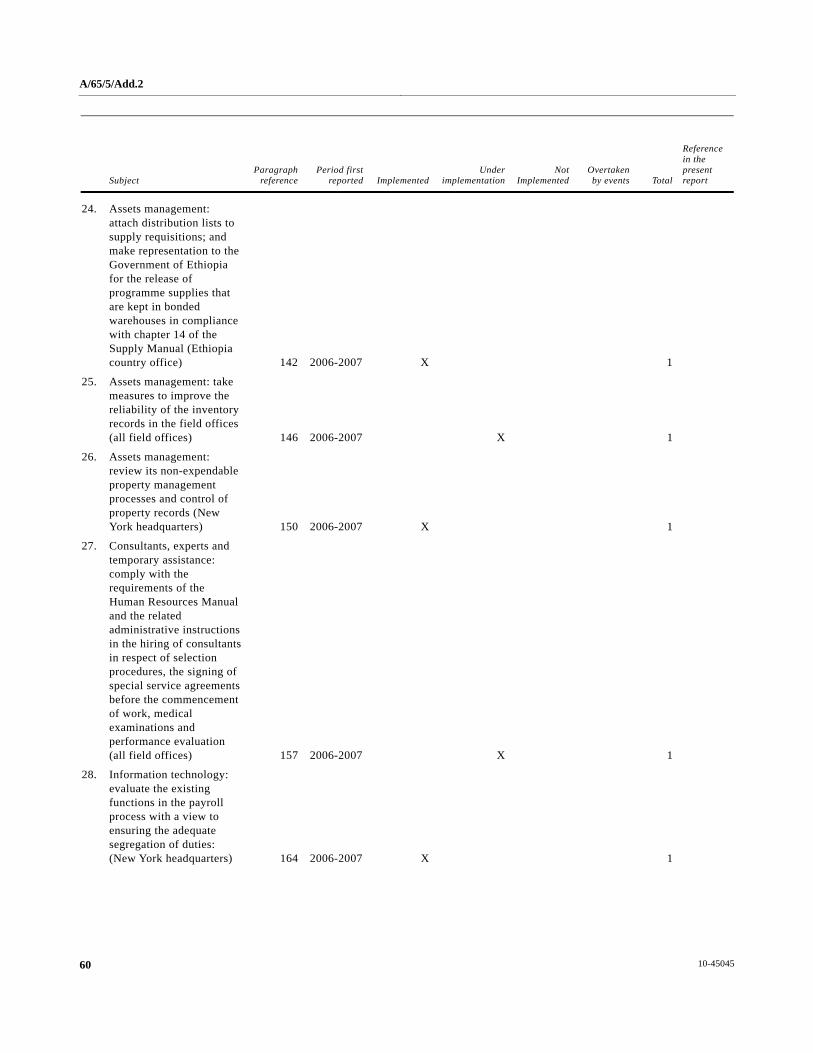
A/65/5/Add.2
10-45045 60
Subject Paragraph
reference Period first
reported Implemented Under
implementation Not
Implemented Overtaken by events Total
Reference in the present report
24. Assets management: attach distribution lists to supply requisitions; and make representation to the Government of Ethiopia for the release of programme supplies that are kept in bonded warehouses in compliance with chapter 14 of the Supply Manual (Ethiopia country office) 142 2006-2007 X 1
25. Assets management: take measures to improve the reliability of the inventory records in the field offices (all field offices) 146 2006-2007 X 1
26. Assets management: review its non-expendable property management processes and control of property records (New York headquarters) 150 2006-2007 X 1
27. Consultants, experts and temporary assistance: comply with the requirements of the Human Resources Manual and the related administrative instructions in the hiring of consultants in respect of selection procedures, the signing of special service agreements before the commencement of work, medical examinations and performance evaluation (all field offices) 157 2006-2007 X 1
28. Information technology: evaluate the existing functions in the payroll process with a view to ensuring the adequate segregation of duties: (New York headquarters) 164 2006-2007 X 1

A/65/5/Add.2
61 10-45045
Subject Paragraph
reference Period first
reported Implemented Under
implementation Not
Implemented Overtaken by events Total
Reference in the present report
29. Information technology: comply with the requirement that the Applications Administrator not be granted any financial authority (regional offices for the Middle East and North Africa and for Eastern and Southern Africa and the Jordan country office) 169 2006-2007 X 1
30. Programme and project management: provide specific baseline and target data to further enhance the measurability of project results (all field offices) 171 2006-2007 X 1
31. Programme and project management: fully utilize the Programme Manager System as a monitoring tool for programme implementation and for requisitioning inputs; and conduct training for all sector heads and programme/project officers on the use of programme management tools in System (Americas and the Caribbean Regional Office and Southern Sudan area office) 175 2006-2007 X 1
32. Programme and project management: include in the guidelines for the 2008 country office annual reports a requirement to incorporate in section 2.2 of the report a comparative analysis of the annual workplan in relation to the actual results according to the annual workplan monitoring tool (New York headquarters) 179 2006-2007 X 1

A/65/5/Add.2
10-45045 62
Subject Paragraph
reference Period first
reported Implemented Under
implementation Not
Implemented Overtaken by events Total
Reference in the present report
33. Programme and project management: evaluate project proposals to determine the adequacy of requested financing by implementing partners and probable obstacles to implementation; strengthen the monitoring of projects; and document and monitor the reprogramming and utilization of refunds (India country office) 184 2006-2007 X 1
34. Revenue-producing activities: enforce financial rule 9.04 relating to the retention of income by National Committees (Private Fund-raising and Partnerships Division) 189 2006-2007 X 1 raised
35. Revenue-producing activities: evaluate the applicability of the 25 per cent retention rate to all National Committees (Private Fund-raising and Partnerships Division) 190 2006-2007 X 1
36. Revenue-producing activities: in consultation with the National Committees, revises the reporting calendar for the submission of the final reports to coincide with the deadline for financial reporting (Private Fund-raising and Partnerships Division) 196 2006-2007 X 1
37. Travel management: comply with policies and procedures on the submission of travel reports; and ensure that travel advances are cleared within 15 days of the completion of travel (all field offices) 200 2006-2007 X 1
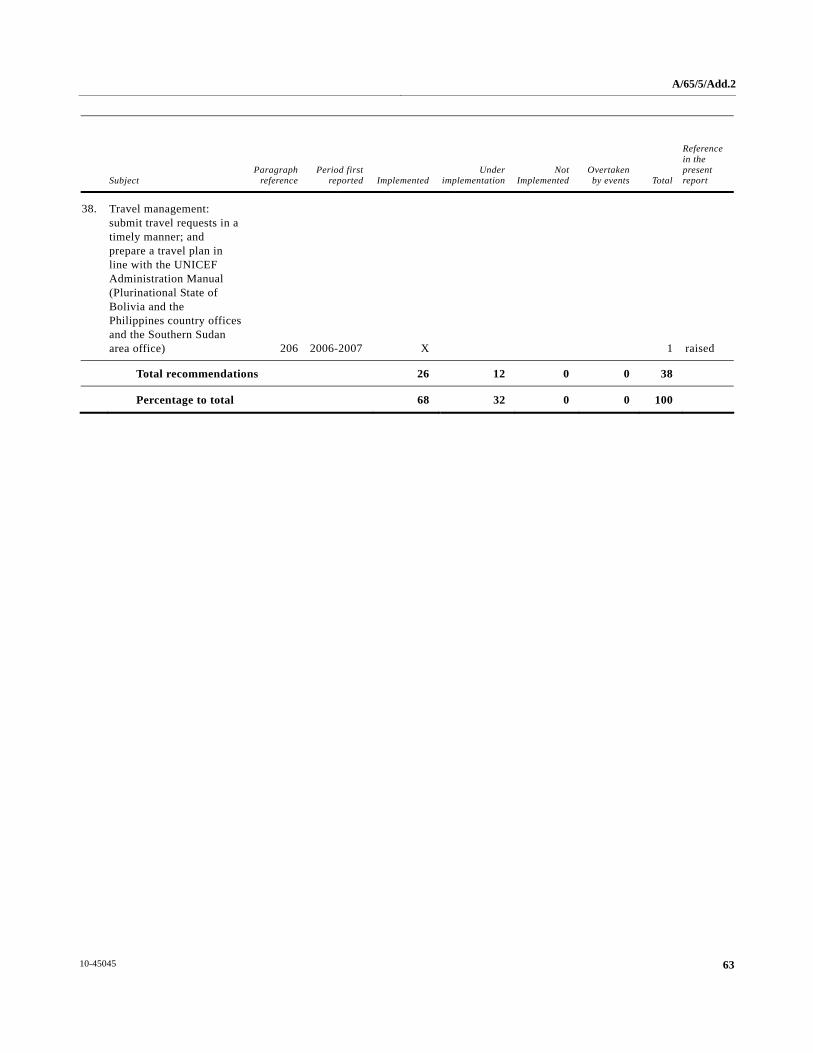
A/65/5/Add.2
63 10-45045
Subject Paragraph
reference Period first
reported Implemented Under
implementation Not
Implemented Overtaken by events Total
Reference in the present report
38. Travel management: submit travel requests in a timely manner; and prepare a travel plan in line with the UNICEF Administration Manual (Plurinational State of Bolivia and the Philippines country offices and the Southern Sudan area office) 206 2006-2007 X 1 raised
Total recommendations 26 12 0 0 38
Percentage to total 68 32 0 0 100
A/65/5/Add.2
10-45045 64
Chapter III Financial report for the biennium ended 31 December 2009
Introduction
1. The United Nations Children’s Fund (UNICEF) submits herewith its financial report, accompanied by 10 statements, 3 schedules and 2 annexes. Statements I to IV are presented in line with the formats agreed upon by the United Nations System Chief Executives Board for Coordination as a step towards harmonizing the accounts of agencies in the United Nations system. The financial report summarizes the financial results of UNICEF activities for the biennium ended 31 December 2009.
Income
2. UNICEF income in the biennium totalled $6,610 million. Income comprised $2,114 million under regular resources, $3,098 million under other resources (regular) and $1,398 million under other resources (emergency). The breakdown of UNICEF income by source is: 60 per cent ($3,959 million) from Governments and intergovernmental agencies; 29 per cent ($1,902 million) from fund-raising campaigns, the sale of greeting cards and gifts and individual donations; 8 per cent ($552 million) from inter-organizational arrangements; and 3 per cent ($197 million) from miscellaneous sources, including interest and net currency exchange adjustments and gains on foreign exchange transactions.
Expenditure
3. UNICEF expenditure for the biennium was $6,324 million, consisting of $1,883 million for programme cooperation from regular resources, $2,793 million for programme cooperation from other resources (regular), $1,443 million from other resources (emergency), $172 million for management and administration and $33 million for security.
Supported deliveries
4. UNICEF handled supported deliveries on behalf of third parties valued at $625 million during the biennium. The deliveries are not reflected in the financial accounts of UNICEF, although they are handled through the administrative structures of the organization.
Trust funds
5. Trust fund receipts in the biennium totalled $1,986 million and disbursements and obligations $1,852 million. Trust funds do not form part of the income of UNICEF. Those funds are earmarked resources entrusted to UNICEF by various entities, including Governments, other organizations in the United Nations system and non-governmental organizations, mainly to cover the cost of procuring supplies but also to provide services on behalf of those entities. They also include funds provided by Government sponsors to cover the costs of Junior Professional Officers.
A/65/5/Add.2
65 10-45045
Cash holdings and investments
6. UNICEF had total cash holdings and investments of $2,977 million, which included unspent balances from trust funds amounting to $448 million. Some $2,070 million was held in interest-bearing term deposits, $839 million was in investments and $67 million was in current bank accounts. Cash on hand amounted to $1 million globally.
Approved programmes
7. During the biennium, the Executive Board approved $7,804 million for country programmes of cooperation as well as for regional and interregional programmes. The total included $3,488 million for programmes funded from regular resources and $2,907 million for programmes funded from other resources (regular). The total also included $1,409 million for programmes and projects financed by pledges for other resources (emergency).
(Signed) Ann M. Veneman Executive Director
United Nations Children’s Fund
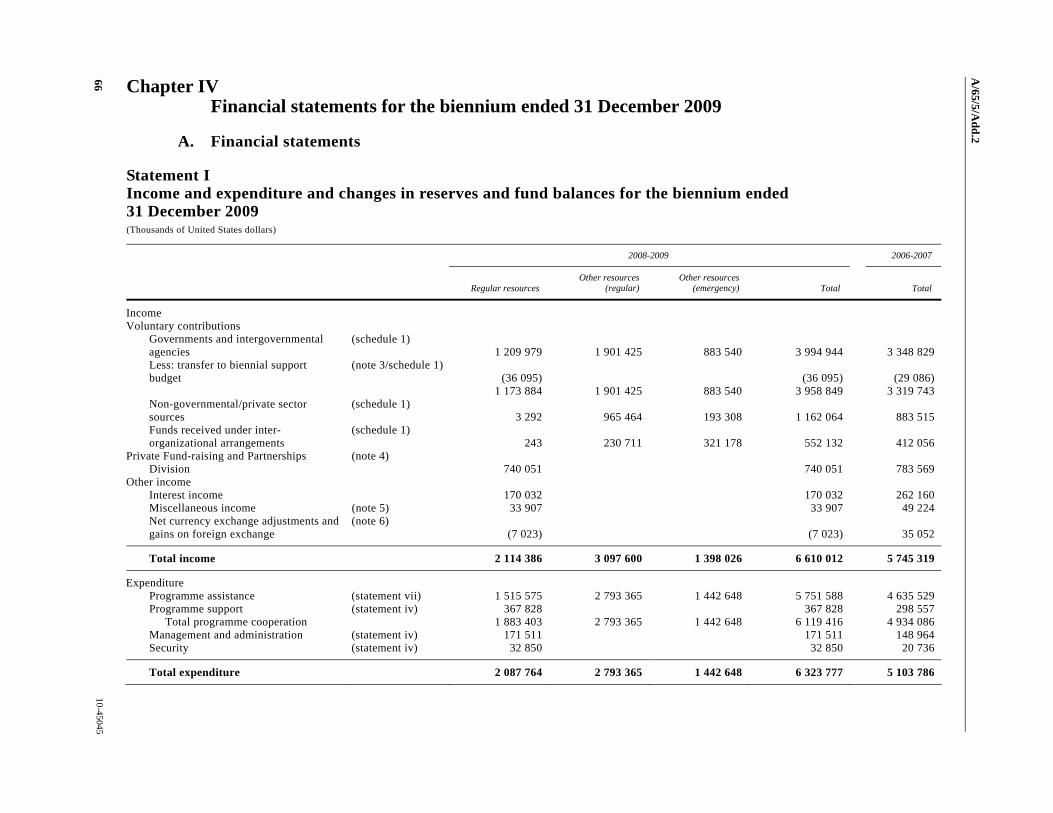
A/65/5/A
dd.2
66 10-45045
Chapter IV Financial statements for the biennium ended 31 December 2009
A. Financial statements
Statement I Income and expenditure and changes in reserves and fund balances for the biennium ended 31 December 2009 (Thousands of United States dollars)
2008-2009 2006-2007
Regular resources Other resources
(regular) Other resources
(emergency) Total Total
Income Voluntary contributions Governments and intergovernmental
agencies (schedule 1)
1 209 979 1 901 425 883 540 3 994 944 3 348 829 Less: transfer to biennial support
budget (note 3/schedule 1)
(36 095) (36 095) (29 086) 1 173 884 1 901 425 883 540 3 958 849 3 319 743 Non-governmental/private sector
sources (schedule 1)
3 292 965 464 193 308 1 162 064 883 515 Funds received under inter-
organizational arrangements (schedule 1)
243 230 711 321 178 552 132 412 056 Private Fund-raising and Partnerships
Division (note 4)
740 051 740 051 783 569 Other income Interest income 170 032 170 032 262 160 Miscellaneous income (note 5) 33 907 33 907 49 224 Net currency exchange adjustments and
gains on foreign exchange (note 6)
(7 023) (7 023) 35 052
Total income 2 114 386 3 097 600 1 398 026 6 610 012 5 745 319
Expenditure Programme assistance (statement vii) 1 515 575 2 793 365 1 442 648 5 751 588 4 635 529 Programme support (statement iv) 367 828 367 828 298 557 Total programme cooperation 1 883 403 2 793 365 1 442 648 6 119 416 4 934 086 Management and administration (statement iv) 171 511 171 511 148 964 Security (statement iv) 32 850 32 850 20 736
Total expenditure 2 087 764 2 793 365 1 442 648 6 323 777 5 103 786

A/65/5/A
dd.2
10-45045 67
2008-2009 2006-2007
Regular resources Other resources
(regular) Other resources
(emergency) Total Total
Excess (shortfall) of income over expenditure 26 622 304 235 (44 622) 286 235 641 533 Write-offs/prior-period adjustments (note 7) 7 947 16 133 6 625 30 705 21 590 Provision for uncollectible contributions
receivable (note 8)
(4 985) 5 566 5 582 6 163
Net excess (shortfall) of income over expenditure
23 660 282 536 (56 829) 249 367 619 943
Fund balances, 1 January 833 332 1 149 079 460 411 2 442 822 1 903 349 Savings on or cancellation of prior-period
obligations
28 987 28 987 19 530 Transfer to reserve for after-service health
insurance (note 9)
(60 000) (60 000) (90 000) Transfer to reserve for separation fund (note 9) (10 000) Reserve balances, 1 January (note 9) 197 520 197 520 89 081 Increase in reserves (note 9) 69 852 69 852 108 439
Reserves and fund balances, 31 December
1 093 351 1 431 615 403 582 2 928 548 2 640 342
The accompanying notes form an integral part of this statement and should be read in conjunction with it.

A/65/5/A
dd.2
68 10-45045
Statement II Assets, liabilities, reserves and fund balances as at 31 December 2009 (Thousands of United States dollars)
2009 2007
Assets Cash and term deposits (note 10) 2 138 491 2 229 829Investments (note 11) 838 952 445 000Accounts receivable Contributions receivable (note 12/schedule 2) 329 723 251 288 Less: provision for uncollectible contributions receivable (note 8) (11 163) (5 000) Net contributions receivable 318 560 246 288 Other accounts receivable (note 13) 441 654 454 576Inventories (note 14) 43 791 46 079Buildings (note 15) 18 625 17 831
Total assets 3 800 073 3 439 603
Liabilities Contributions received in advance (note 16) 19 901 40 500Unliquidated obligations (note 17) 264 378 273 724Accounts payable (note 18) 86 041 123 445Trust funds (note 19/schedule 3) 447 722 314 570Medical insurance plans (note 20) 53 483 47 022
Total liabilities 871 525 799 261
Reserves and fund balances Reserves For procurement services (note 9) 2 000 2 000 For insurance (note 9) 115 115 For capital assets (note 9) 27 286 27 126 For after-service health insurance (note 9) 210 000 150 000 For separation fund (note 9) 27 971 18 279
Total reserves 267 372 197 520
Fund balances Regular resources 825 979 833 332 Other resources (regular) 1 431 615 1 149 079 Other resources (emergency) 403 582 460 411
Total fund balances 2 661 176 2 442 822
Total reserves and fund balances 2 928 548 2 640 342
Total liabilities, reserves and fund balances 3 800 073 3 439 603
The accompanying notes form an integral part of this statement and should be read in conjunction with it.
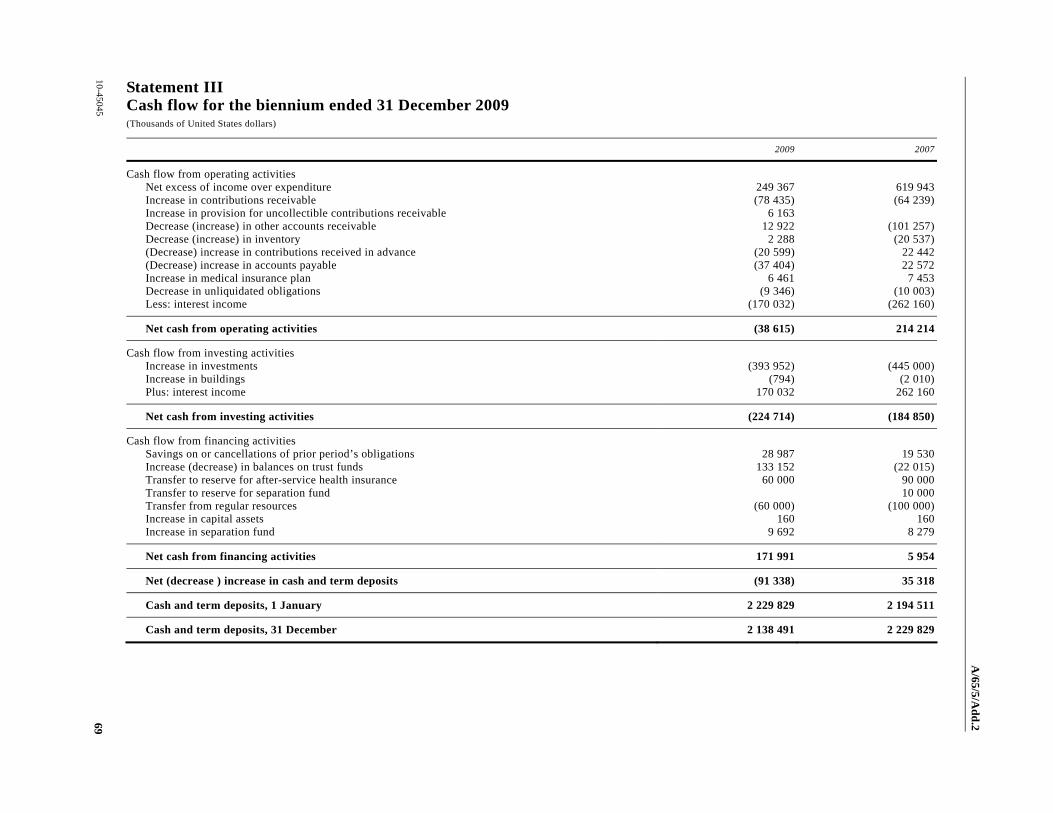
A/65/5/A
dd.2
10-45045 69
Statement III Cash flow for the biennium ended 31 December 2009 (Thousands of United States dollars)
2009 2007
Cash flow from operating activities Net excess of income over expenditure 249 367 619 943 Increase in contributions receivable (78 435) (64 239) Increase in provision for uncollectible contributions receivable 6 163 Decrease (increase) in other accounts receivable 12 922 (101 257) Decrease (increase) in inventory 2 288 (20 537) (Decrease) increase in contributions received in advance (20 599) 22 442 (Decrease) increase in accounts payable (37 404) 22 572 Increase in medical insurance plan 6 461 7 453 Decrease in unliquidated obligations (9 346) (10 003) Less: interest income (170 032) (262 160)
Net cash from operating activities (38 615) 214 214
Cash flow from investing activities Increase in investments (393 952) (445 000) Increase in buildings (794) (2 010) Plus: interest income 170 032 262 160
Net cash from investing activities (224 714) (184 850)
Cash flow from financing activities Savings on or cancellations of prior period’s obligations 28 987 19 530 Increase (decrease) in balances on trust funds 133 152 (22 015) Transfer to reserve for after-service health insurance 60 000 90 000 Transfer to reserve for separation fund 10 000 Transfer from regular resources (60 000) (100 000) Increase in capital assets 160 160 Increase in separation fund 9 692 8 279
Net cash from financing activities 171 991 5 954
Net (decrease ) increase in cash and term deposits (91 338) 35 318
Cash and term deposits, 1 January 2 229 829 2 194 511
Cash and term deposits, 31 December 2 138 491 2 229 829

A/65/5/A
dd.2
70 10-45045
Statement IV Statement of appropriations for the biennium 2008-2009 as at 31 December 2009 (Thousands of United States dollars)
Appropriations Expenditure Appropriations
Original SupplementTransfers/
adjustments RevisedProgramme
support
Management and
administration Security Total Unspent
Programme support Country and regional offices 462 043 (144) 461 899 443 137 443 137 18 762 Headquarters 139 857 2 013 141 870 131 312 131 312 10 558
Subtotal 601 900 1 869 603 769 574 449 574 449 29 320
Management and administration 310 900 (1 869) 309 031 285 238 285 238 23 793
Subtotal 912 800 912 800 574 449 285 238 859 687 53 113
Security 26 200 21 400 47 600 32 850 32 850 14 750
Total 939 000 21 400 960 400 574 449 285 238 32 850 892 537 67 863
Expenditure 574 449 285 238 32 850 892 537Less: Recovery from packing and
assembly activities 16 093 16 093 Recovery from other resources
regular 116 455 59 992 176 447 Recovery from other resources
emergency 58 387 30 079 88 466 Agency commissions from
administration of non-procurement trust funds and Junior Professional Officers 3 247 3 247
Government contribution towards local costs 524 524
Transfer from income in respect of income tax reimbursement 15 162 20 409 35 571
Subtotal 206 621 113 727 320 348
Net expenditure 367 828 171 511 32 850 572 189

A/65/5/A
dd.2
10-45045 71
Statement V Income/receipts, expenditure/disbursements and changes in fund balances for the biennium ended 31 December 2009 (Thousands of United States dollar)
2008-2009 2006-2007
Regular resourcesOther resources
(regular)Other resources
(emergency) Trust funds Total Total
Opening balances 833 332 1 149 079 460 411 304 628 2 747 450 2 235 241Income/receipts 2 114 386 3 097 600 1 398 026 1 985 799 8 595 811 7 347 778Funds available 2 947 718 4 246 679 1 858 437 2 290 427 11 343 261 9 583 019Expenditure/disbursements 2 087 764 2 793 365 1 442 648 1 852 185 8 175 962 6 733 509Write-offs/prior-period adjustments 7 947 16 133 6 625 30 705 21 590Provision for uncollectible
contributions receivable (4 985) 5 566 5 582 6 163Savings on or cancellation of prior-
period obligations (28 987) (28 987) (19 530)Transfer to reserve for after-service
health insurance 60 000 60 000 90 000Transfer to reserve for separation
fund 10 000
Closing balances 825 979 1 431 615 403 582 438 242 3 099 418 2 747 450
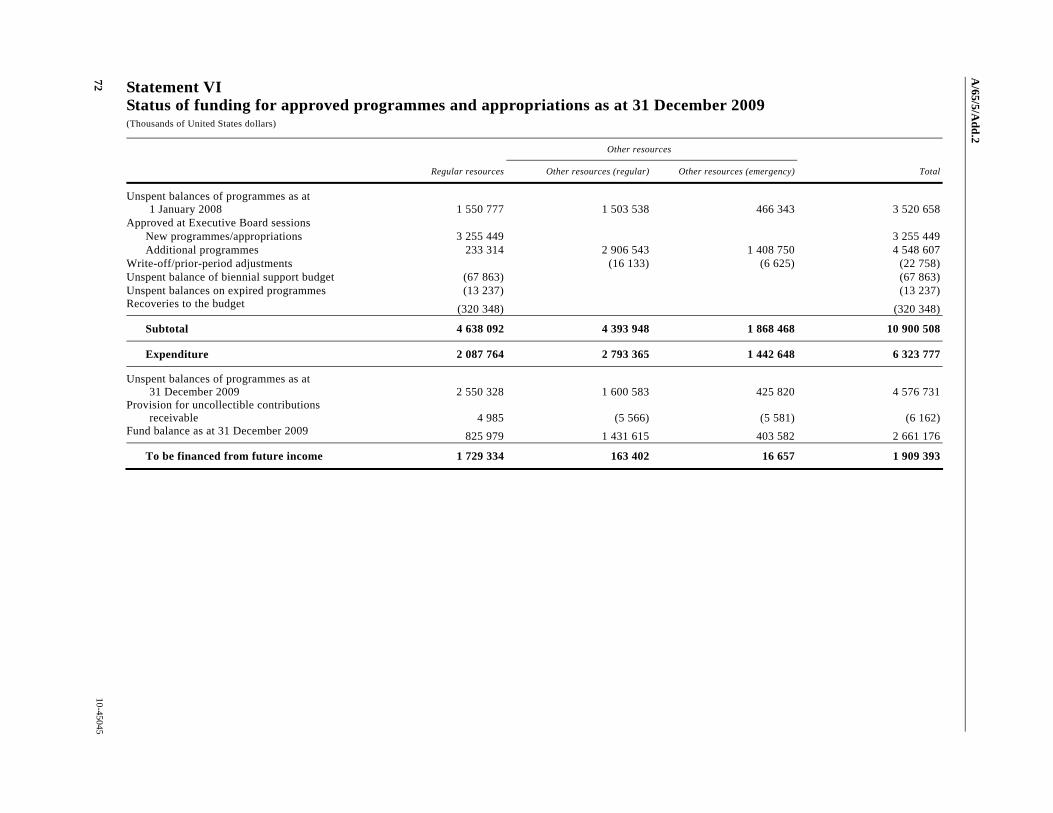
A/65/5/A
dd.2
72 10-45045
Statement VI Status of funding for approved programmes and appropriations as at 31 December 2009 (Thousands of United States dollars)
Other resources
Regular resources Other resources (regular) Other resources (emergency) Total
Unspent balances of programmes as at 1 January 2008 1 550 777 1 503 538 466 343 3 520 658
Approved at Executive Board sessions New programmes/appropriations 3 255 449 3 255 449 Additional programmes 233 314 2 906 543 1 408 750 4 548 607Write-off/prior-period adjustments (16 133) (6 625) (22 758)Unspent balance of biennial support budget (67 863) (67 863)Unspent balances on expired programmes (13 237) (13 237)Recoveries to the budget (320 348) (320 348)
Subtotal 4 638 092 4 393 948 1 868 468 10 900 508
Expenditure 2 087 764 2 793 365 1 442 648 6 323 777
Unspent balances of programmes as at 31 December 2009 2 550 328 1 600 583 425 820 4 576 731
Provision for uncollectible contributions receivable 4 985 (5 566) (5 581) (6 162)
Fund balance as at 31 December 2009 825 979 1 431 615 403 582 2 661 176
To be financed from future income 1 729 334 163 402 16 657 1 909 393

A/65/5/A
dd.2
10-45045 73
Statement VII Statement of approved programmes and appropriations, expenditure and unspent balances for regular resources, other resources (regular) and other resources (emergency) for the biennium ended 31 December 2009 (Thousands of United States dollars)
Approved programmes/appropriations
unspent balances as at 1 January 2008
New programmes/ appropriations and
cancellations Total programmes/
appropriations Total expenditure
Approved programmes/appropriations
unspent balances as at 31 December 2009
Africa Angola 38 740 118 956 157 696 103 580 54 116Benin 22 011 39 428 61 439 32 711 28 728Botswana 3 845 8 711 12 556 7 432 5 124Burkina Faso 30 821 67 403 98 224 70 578 27 646Burundi 15 172 82 561 97 733 41 757 55 976Cameroon 21 115 16 036 37 151 25 970 11 181Cape Verde 2 850 673 3 523 1 992 1 531Central African Republic 13 939 37 426 51 365 40 658 10 707Chad 21 474 71 567 93 041 71 157 21 884Comoros 5 408 3 138 8 546 5 333 3 213Congo 4 958 22 675 27 633 13 411 14 222Côte d’Ivoire 12 362 85 629 97 991 61 518 36 473Democratic Republic of the Congo 231 448 222 496 453 944 327 516 126 428Equatorial Guinea 4 539 1 532 6 071 2 495 3 576Eritrea 17 064 37 679 54 743 41 835 12 908Ethiopia 136 868 232 978 369 846 264 547 105 299Gabon 3 100 4 043 7 143 3 284 3 859Gambia 5 669 5 594 11 263 6 540 4 723Ghana 35 213 34 269 69 482 42 854 26 628Guinea 20 083 24 867 44 950 27 965 16 985Guinea-Bissau 11 885 14 256 26 141 15 985 10 156Kenya 27 653 127 475 155 128 87 861 67 267Lesotho 24 304 8 864 33 168 13 370 19 798Liberia 46 329 32 149 78 478 49 783 28 695Madagascar 48 831 55 620 104 451 63 208 41 243Malawi 54 349 61 215 115 564 79 078 36 486Mali 73 701 41 436 115 137 55 328 59 809Mauritania 5 713 19 770 25 483 15 321 10 162Mauritius 25 25 25Mozambique 70 368 73 132 143 500 118 326 25 174Namibia 8 158 9 596 17 754 11 225 6 529Niger 31 046 133 451 164 497 81 514 82 983Nigeria 77 546 264 842 342 388 181 647 160 741Rwanda 47 371 28 468 75 839 38 713 37 126Sao Tome and Principe 3 134 600 3 734 2 113 1 621Senegal 20 386 18 806 39 192 24 345 14 847
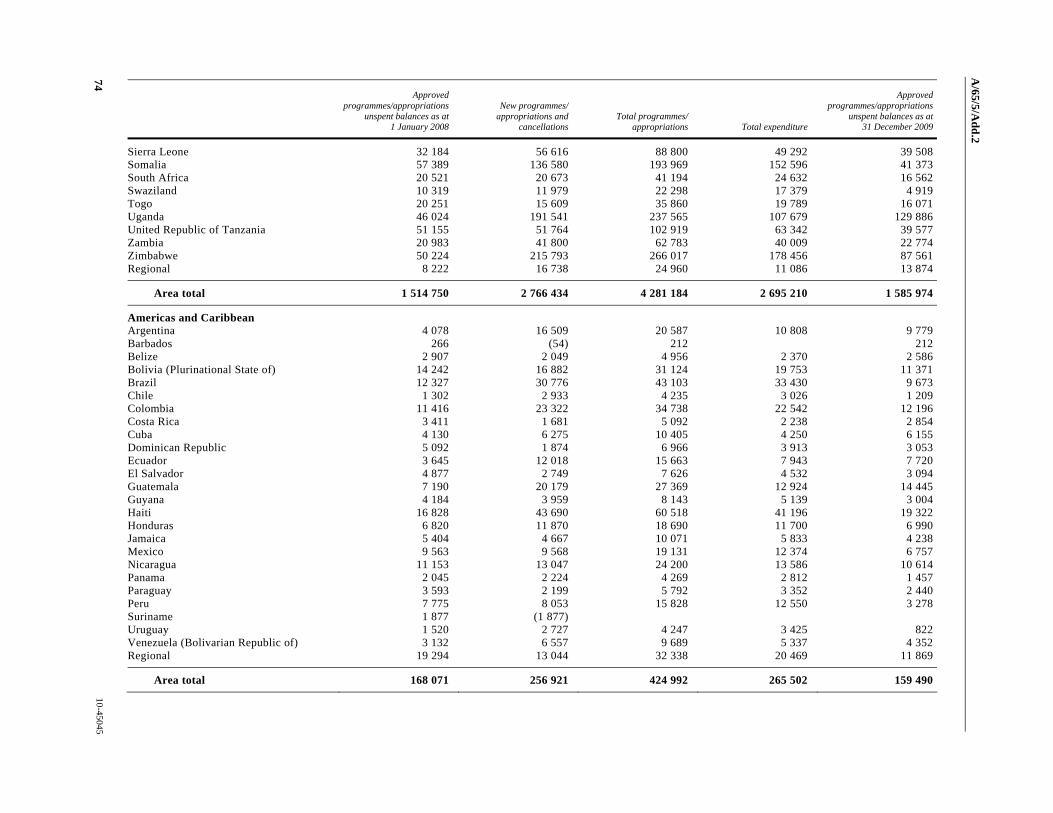
A/65/5/A
dd.2
74 10-45045
Approved programmes/appropriations
unspent balances as at 1 January 2008
New programmes/ appropriations and
cancellations Total programmes/
appropriations Total expenditure
Approved programmes/appropriations
unspent balances as at 31 December 2009
Sierra Leone 32 184 56 616 88 800 49 292 39 508Somalia 57 389 136 580 193 969 152 596 41 373South Africa 20 521 20 673 41 194 24 632 16 562Swaziland 10 319 11 979 22 298 17 379 4 919Togo 20 251 15 609 35 860 19 789 16 071Uganda 46 024 191 541 237 565 107 679 129 886United Republic of Tanzania 51 155 51 764 102 919 63 342 39 577Zambia 20 983 41 800 62 783 40 009 22 774Zimbabwe 50 224 215 793 266 017 178 456 87 561Regional 8 222 16 738 24 960 11 086 13 874
Area total 1 514 750 2 766 434 4 281 184 2 695 210 1 585 974
Americas and Caribbean Argentina 4 078 16 509 20 587 10 808 9 779Barbados 266 (54) 212 212Belize 2 907 2 049 4 956 2 370 2 586Bolivia (Plurinational State of) 14 242 16 882 31 124 19 753 11 371Brazil 12 327 30 776 43 103 33 430 9 673Chile 1 302 2 933 4 235 3 026 1 209Colombia 11 416 23 322 34 738 22 542 12 196Costa Rica 3 411 1 681 5 092 2 238 2 854Cuba 4 130 6 275 10 405 4 250 6 155Dominican Republic 5 092 1 874 6 966 3 913 3 053Ecuador 3 645 12 018 15 663 7 943 7 720El Salvador 4 877 2 749 7 626 4 532 3 094Guatemala 7 190 20 179 27 369 12 924 14 445Guyana 4 184 3 959 8 143 5 139 3 004Haiti 16 828 43 690 60 518 41 196 19 322Honduras 6 820 11 870 18 690 11 700 6 990Jamaica 5 404 4 667 10 071 5 833 4 238Mexico 9 563 9 568 19 131 12 374 6 757Nicaragua 11 153 13 047 24 200 13 586 10 614Panama 2 045 2 224 4 269 2 812 1 457Paraguay 3 593 2 199 5 792 3 352 2 440Peru 7 775 8 053 15 828 12 550 3 278Suriname 1 877 (1 877) Uruguay 1 520 2 727 4 247 3 425 822Venezuela (Bolivarian Republic of) 3 132 6 557 9 689 5 337 4 352Regional 19 294 13 044 32 338 20 469 11 869
Area total 168 071 256 921 424 992 265 502 159 490

A/65/5/A
dd.2
10-45045 75
Approved programmes/appropriations
unspent balances as at 1 January 2008
New programmes/ appropriations and
cancellations Total programmes/
appropriations Total expenditure
Approved programmes/appropriations
unspent balances as at 31 December 2009
East Asia and Pacific Cambodia 43 977 24 547 68 524 42 795 25 729China 49 243 67 236 116 479 78 102 38 377Democratic People’s Republic of Korea 10 294 24 730 35 024 24 882 10 142Indonesia 193 059 60 531 253 590 197 043 56 547Lao People’s Democratic Republic 18 019 23 470 41 489 28 184 13 305Malaysia 2 156 3 644 5 800 3 392 2 408Mongolia 5 992 3 254 9 246 5 306 3 940Myanmar 41 504 135 914 177 418 142 615 34 803Pacific island countries 31 926 17 710 49 636 22 165 27 471Papua New Guinea 14 254 8 626 22 880 11 475 11 405Philippines 19 495 32 092 51 587 33 384 18 203Thailand 9 550 15 438 24 988 17 752 7 236Timor-Leste 13 377 15 250 28 627 15 444 13 183Viet Nam 21 798 31 660 53 458 33 915 19 543Regional 1 893 3 232 5 125 3 193 1 932
Area total 476 537 467 334 943 871 659 647 284 224
South Asia Afghanistan 46 844 346 502 393 346 175 048 218 298Bangladesh 137 172 106 855 244 027 143 378 100 649Bhutan 8 110 5 638 13 748 8 128 5 620India 205 186 203 119 408 305 222 356 185 949Maldives 8 808 154 8 962 7 053 1 909Nepal 35 418 30 326 65 744 46 685 19 059Pakistan 90 923 195 260 286 183 179 079 107 104Sri Lanka 65 612 55 344 120 956 74 990 45 966Regional 666 1 432 2 098 2 091 7
Area total 598 739 944 630 1 543 369 858 808 684 561
Middle East and North Africa Algeria 4 999 2 247 7 246 3 032 4 214Djibouti 7 036 11 952 18 988 13 048 5 940Egypt 18 937 10 770 29 707 19 952 9 755Iran (Islamic Republic of) 6 880 3 477 10 357 5 959 4 398Iraq 42 297 100 969 143 266 87 674 55 592Jordan 9 132 17 012 26 144 14 151 11 993Kuwait 30 (30) Lebanon 13 128 8 652 21 780 13 970 7 810Morocco 9 121 5 533 14 654 9 073 5 581Oman 1 129 2 139 3 268 2 292 976Palestinian children and women 24 563 44 752 69 315 55 676 13 639Sudan 70 285 353 879 424 164 334 691 89 473

A/65/5/A
dd.2
76 10-45045
Approved programmes/appropriations
unspent balances as at 1 January 2008
New programmes/ appropriations and
cancellations Total programmes/
appropriations Total expenditure
Approved programmes/appropriations
unspent balances as at 31 December 2009
Syrian Arab Republic 17 121 24 648 41 769 25 787 15 982Tunisia 3 188 1 172 4 360 2 511 1 849Yemen 26 422 22 088 48 510 30 718 17 792Regional 7 744 3 639 11 383 3 579 7 804
Area total 262 012 612 899 874 911 622 113 252 798
Central and Eastern Europe and Commonwealth of Independent States
Albania 5 669 9 611 15 280 10 864 4 416Armenia 2 030 5 830 7 860 2 699 5 161Azerbaijan 2 819 3 070 5 889 4 488 1 401Belarus 2 275 1 413 3 688 1 845 1 843Bulgaria 1 930 4 660 6 590 3 356 3 234Bosnia and Herzegovina 3 395 16 142 19 537 8 042 11 495Croatia 1 221 3 317 4 538 2 752 1 786Georgia 4 229 17 953 22 182 13 855 8 327Kazakhstan 4 143 7 469 11 612 3 842 7 770Kosovo (Serbia) 2 296 7 589 9 885 7 424 2 461Kyrgyzstan 3 855 3 993 7 848 5 767 2 081Montenegro 1 590 2 795 4 385 2 533 1 852Republic of Moldova 5 815 7 617 13 432 8 626 4 806Romania 4 094 5 547 9 641 5 932 3 709Russian Federation 10 664 12 898 23 562 18 945 4 617Serbia 5 724 6 921 12 645 6 411 6 234Tajikistan 5 528 27 623 33 151 16 851 16 300The former Yugoslav Republic of
Macedonia 3 333 8 195 11 528 4 294 7 234Turkey 8 540 10 877 19 417 12 145 7 272Turkmenistan 1 883 6 698 8 581 3 179 5 402Ukraine 6 148 6 073 12 221 6 813 5 408Uzbekistan 3 265 30 881 34 146 11 656 22 490Regional 7 912 4 723 12 635 6 201 6 434
Area total 98 358 211 895 310 253 168 520 141 733
Global assistance Avian influenza 5 860 1 199 7 059 6 554 505Emergency Programme Fund 54 066 113 832 167 898 34 085 133 813Immunization 3 317 364 3 681 2 479 1 202Inter-country programmes 298 982 436 476 735 458 428 862 306 596Innocenti Research Centre 8 369 12 074 20 443 9 808 10 635
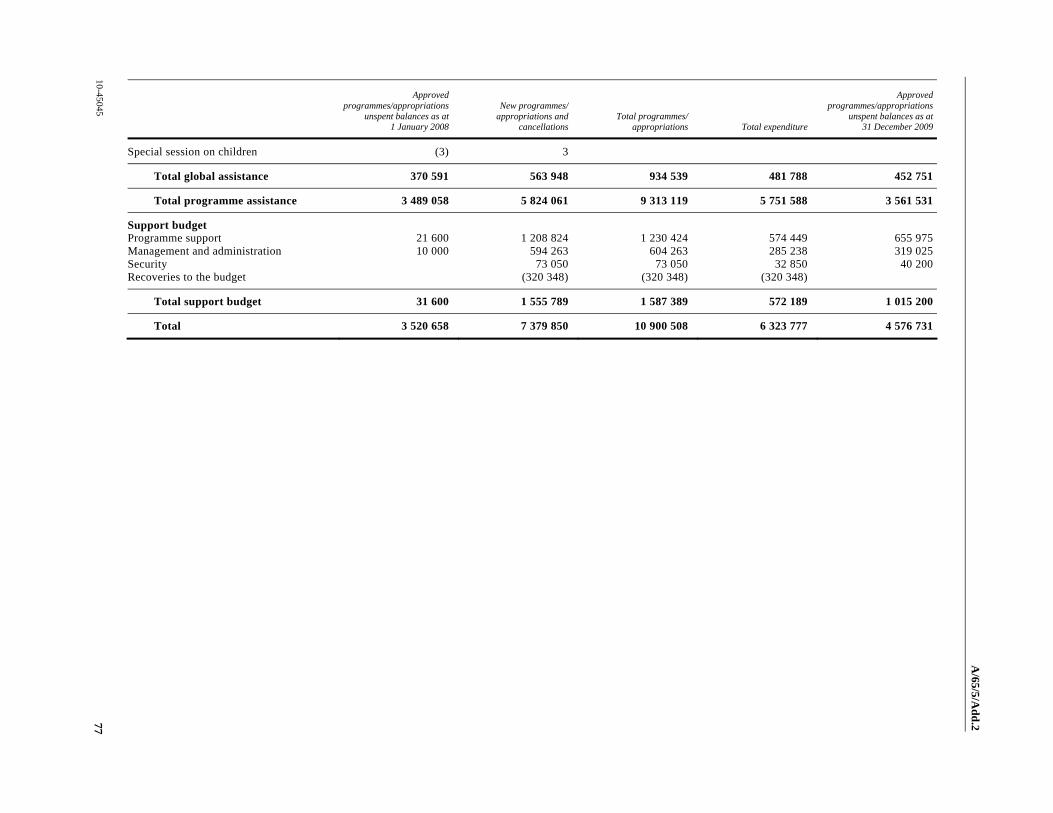
A/65/5/A
dd.2
10-45045 77
Approved programmes/appropriations
unspent balances as at 1 January 2008
New programmes/ appropriations and
cancellations Total programmes/
appropriations Total expenditure
Approved programmes/appropriations
unspent balances as at 31 December 2009
Special session on children (3) 3
Total global assistance 370 591 563 948 934 539 481 788 452 751
Total programme assistance 3 489 058 5 824 061 9 313 119 5 751 588 3 561 531
Support budget Programme support 21 600 1 208 824 1 230 424 574 449 655 975Management and administration 10 000 594 263 604 263 285 238 319 025Security 73 050 73 050 32 850 40 200Recoveries to the budget (320 348) (320 348) (320 348)
Total support budget 31 600 1 555 789 1 587 389 572 189 1 015 200
Total 3 520 658 7 379 850 10 900 508 6 323 777 4 576 731

A/65/5/A
dd.2
78 10-45045
Statement VII.1 Statement of approved programmes and appropriations, expenditure and unspent balances for regular resources for the biennium ended 31 December 2009 (Thousands of United States dollars)
Approved programmes/appropriations
unspent balances as at 1 January 2008
New programmes/ appropriations and
cancellations Total programmes/
appropriations Total expenditure
Approved programmes/appropriations
unspent balances as at 31 December 2009
Africa Angola 13 866 38 708 52 574 24 749 27 825 Benin 5 017 24 709 29 726 10 328 19 398 Botswana 1 349 4 358 5 707 1 881 3 826 Burkina Faso 19 042 32 181 51 223 33 544 17 679 Burundi 7 476 61 542 69 018 19 053 49 965 Cameroon 17 834 1 166 19 000 11 940 7 060 Cape Verde 2 320 57 2 377 1 467 910 Central African Republic 9 664 4 628 14 292 9 470 4 822 Chad 9 460 26 913 36 373 24 441 11 932 Comoros 3 723 561 4 284 1 647 2 637 Congo 1 917 7 936 9 853 4 073 5 780 Côte d’Ivoire 5 138 34 607 39 745 16 114 23 631 Democratic Republic of the Congo 191 068 6 263 197 331 113 245 84 086 Equatorial Guinea 3 599 296 3 895 1 460 2 435 Eritrea 7 759 1 171 8 930 5 327 3 603 Ethiopia 80 950 45 456 126 406 81 774 44 632 Gabon 2 587 (28) 2 559 1 422 1 137 Gambia 4 044 704 4 748 2 553 2 195 Ghana 9 952 17 514 27 466 17 596 9 870 Guinea 12 528 9 664 22 192 13 622 8 570 Guinea-Bissau 8 428 545 8 973 4 680 4 293 Kenya 10 521 49 186 59 707 26 875 32 832 Lesotho 5 159 715 5 874 2 485 3 389 Liberia 19 634 1 467 21 101 11 300 9 801 Madagascar 41 511 626 42 137 28 683 13 454 Malawi 30 307 1 423 31 730 18 535 13 195 Mali 60 323 1 685 62 008 25 884 36 124 Mauritania 2 073 5 008 7 081 4 669 2 412 Mauritius 25 25 25 Mozambique 12 941 19 368 32 309 31 981 328 Namibia 2 459 735 3 194 2 143 1 051 Niger 15 148 90 431 105 579 37 678 67 901 Nigeria 31 127 176 684 207 811 92 130 115 681 Rwanda 39 937 2 213 42 150 17 456 24 694 Sao Tome and Principe 2 755 2 755 1 427 1 328 Senegal 13 136 5 354 18 490 11 653 6 837 Sierra Leone 19 576 6 889 26 465 16 699 9 766 Somalia 17 243 3 521 20 764 18 662 2 102
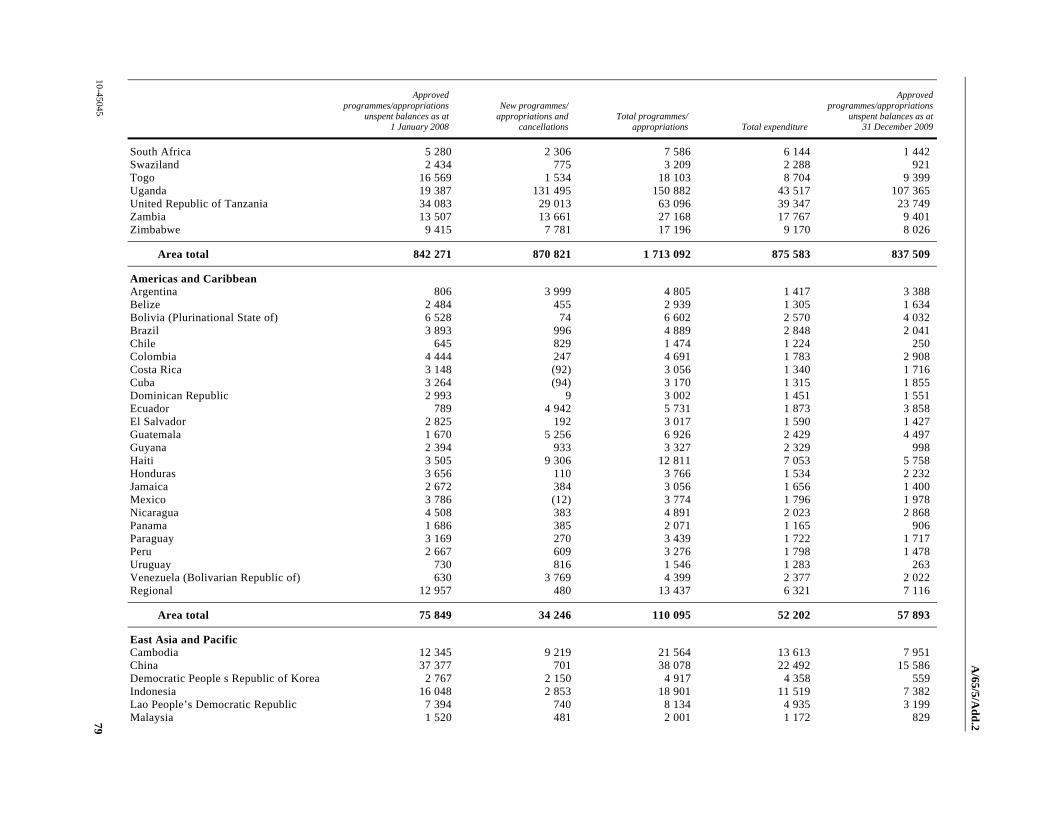
A/65/5/A
dd.2
10-45045 79
Approved programmes/appropriations
unspent balances as at 1 January 2008
New programmes/ appropriations and
cancellations Total programmes/
appropriations Total expenditure
Approved programmes/appropriations
unspent balances as at 31 December 2009
South Africa 5 280 2 306 7 586 6 144 1 442 Swaziland 2 434 775 3 209 2 288 921 Togo 16 569 1 534 18 103 8 704 9 399 Uganda 19 387 131 495 150 882 43 517 107 365 United Republic of Tanzania 34 083 29 013 63 096 39 347 23 749 Zambia 13 507 13 661 27 168 17 767 9 401 Zimbabwe 9 415 7 781 17 196 9 170 8 026
Area total 842 271 870 821 1 713 092 875 583 837 509
Americas and Caribbean Argentina 806 3 999 4 805 1 417 3 388 Belize 2 484 455 2 939 1 305 1 634 Bolivia (Plurinational State of) 6 528 74 6 602 2 570 4 032 Brazil 3 893 996 4 889 2 848 2 041 Chile 645 829 1 474 1 224 250 Colombia 4 444 247 4 691 1 783 2 908 Costa Rica 3 148 (92) 3 056 1 340 1 716 Cuba 3 264 (94) 3 170 1 315 1 855 Dominican Republic 2 993 9 3 002 1 451 1 551 Ecuador 789 4 942 5 731 1 873 3 858 El Salvador 2 825 192 3 017 1 590 1 427 Guatemala 1 670 5 256 6 926 2 429 4 497 Guyana 2 394 933 3 327 2 329 998 Haiti 3 505 9 306 12 811 7 053 5 758 Honduras 3 656 110 3 766 1 534 2 232 Jamaica 2 672 384 3 056 1 656 1 400 Mexico 3 786 (12) 3 774 1 796 1 978 Nicaragua 4 508 383 4 891 2 023 2 868 Panama 1 686 385 2 071 1 165 906 Paraguay 3 169 270 3 439 1 722 1 717 Peru 2 667 609 3 276 1 798 1 478 Uruguay 730 816 1 546 1 283 263 Venezuela (Bolivarian Republic of) 630 3 769 4 399 2 377 2 022 Regional 12 957 480 13 437 6 321 7 116
Area total 75 849 34 246 110 095 52 202 57 893
East Asia and Pacific Cambodia 12 345 9 219 21 564 13 613 7 951 China 37 377 701 38 078 22 492 15 586 Democratic People s Republic of Korea 2 767 2 150 4 917 4 358 559 Indonesia 16 048 2 853 18 901 11 519 7 382 Lao People’s Democratic Republic 7 394 740 8 134 4 935 3 199 Malaysia 1 520 481 2 001 1 172 829
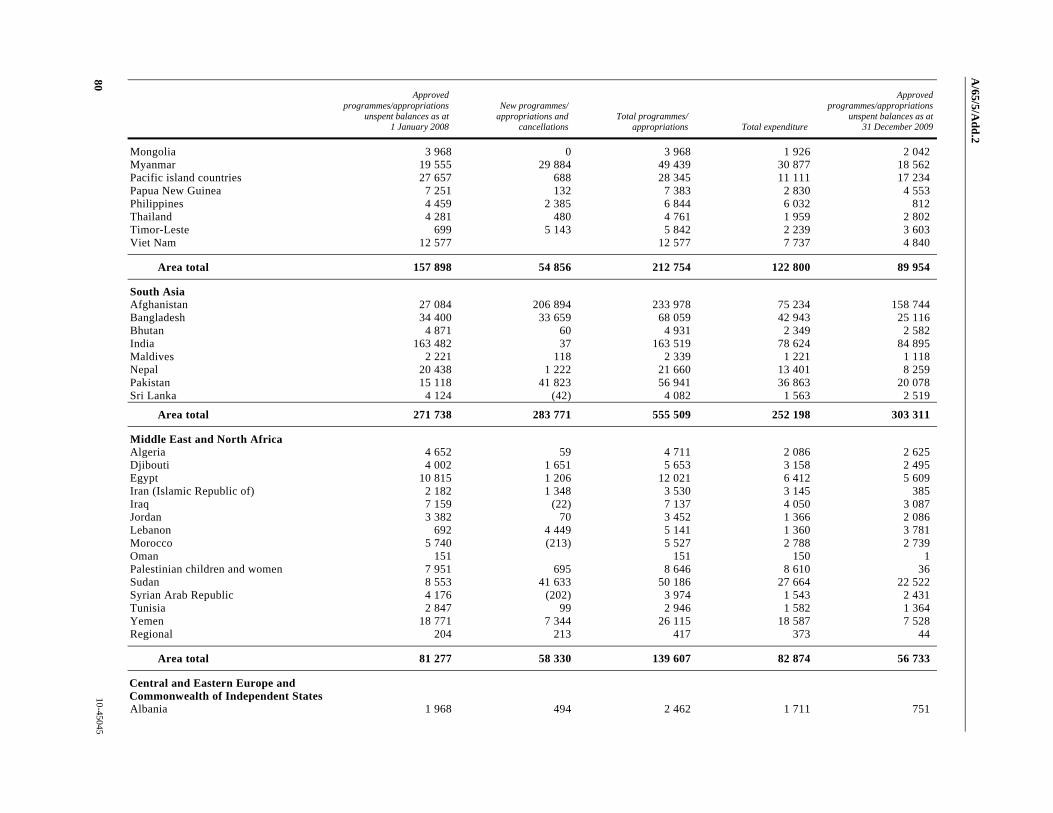
A/65/5/A
dd.2
80 10-45045
Approved programmes/appropriations
unspent balances as at 1 January 2008
New programmes/ appropriations and
cancellations Total programmes/
appropriations Total expenditure
Approved programmes/appropriations
unspent balances as at 31 December 2009
Mongolia 3 968 0 3 968 1 926 2 042 Myanmar 19 555 29 884 49 439 30 877 18 562 Pacific island countries 27 657 688 28 345 11 111 17 234 Papua New Guinea 7 251 132 7 383 2 830 4 553 Philippines 4 459 2 385 6 844 6 032 812 Thailand 4 281 480 4 761 1 959 2 802 Timor-Leste 699 5 143 5 842 2 239 3 603 Viet Nam 12 577 12 577 7 737 4 840
Area total 157 898 54 856 212 754 122 800 89 954
South Asia Afghanistan 27 084 206 894 233 978 75 234 158 744 Bangladesh 34 400 33 659 68 059 42 943 25 116 Bhutan 4 871 60 4 931 2 349 2 582 India 163 482 37 163 519 78 624 84 895 Maldives 2 221 118 2 339 1 221 1 118 Nepal 20 438 1 222 21 660 13 401 8 259 Pakistan 15 118 41 823 56 941 36 863 20 078 Sri Lanka 4 124 (42) 4 082 1 563 2 519
Area total 271 738 283 771 555 509 252 198 303 311
Middle East and North Africa Algeria 4 652 59 4 711 2 086 2 625 Djibouti 4 002 1 651 5 653 3 158 2 495 Egypt 10 815 1 206 12 021 6 412 5 609 Iran (Islamic Republic of) 2 182 1 348 3 530 3 145 385 Iraq 7 159 (22) 7 137 4 050 3 087 Jordan 3 382 70 3 452 1 366 2 086 Lebanon 692 4 449 5 141 1 360 3 781 Morocco 5 740 (213) 5 527 2 788 2 739 Oman 151 151 150 1 Palestinian children and women 7 951 695 8 646 8 610 36 Sudan 8 553 41 633 50 186 27 664 22 522 Syrian Arab Republic 4 176 (202) 3 974 1 543 2 431 Tunisia 2 847 99 2 946 1 582 1 364 Yemen 18 771 7 344 26 115 18 587 7 528 Regional 204 213 417 373 44
Area total 81 277 58 330 139 607 82 874 56 733
Central and Eastern Europe and Commonwealth of Independent States
Albania 1 968 494 2 462 1 711 751

A/65/5/A
dd.2
10-45045 81
Approved programmes/appropriations
unspent balances as at 1 January 2008
New programmes/ appropriations and
cancellations Total programmes/
appropriations Total expenditure
Approved programmes/appropriations
unspent balances as at 31 December 2009
Armenia 1 206 4 866 6 072 1 410 4 662 Azerbaijan 1 480 842 2 322 1 956 366 Belarus 2 001 219 2 220 1 293 927 Bosnia and Herzegovina 891 4 550 5 441 1 498 3 943 Bulgaria 1 230 2 444 3 674 1 400 2 274 Croatia 128 752 880 692 188 Georgia 1 919 400 2 319 1 438 881 Kazakhstan 1 806 5 854 7 660 2 055 5 605 Kosovo (Serbia) 1 214 2 400 3 614 2 720 894 Kyrgyzstan 2 472 1 063 3 535 2 381 1 154 Montenegro 1 265 1 647 2 912 1 410 1 502 Republic of Moldova 3 024 (81) 2 943 1 494 1 449 Romania 1 463 2 389 3 852 1 427 2 425 Russian Federation 2 950 2 950 1 580 1 370 Serbia 1 870 598 2 468 1 596 872 Tajikistan 2 405 15 835 18 240 5 653 12 587 The former Yugoslav Republic of
Macedonia 1 448 4 577 6 025 1 519 4 506 Turkey 3 536 574 4 110 2 835 1 275 Turkmenistan 1 663 5 341 7 004 1 736 5 268 Ukraine 3 112 250 3 362 1 991 1 371 Uzbekistan 2 648 23 922 26 570 6 434 20 136 Area and country assistance Regional 2 007 1 402 3 409 2 023 1 386
Area total 43 706 80 338 124 044 48 252 75 792
Global assistance Emergency Programme Fund 23 875 90 675 114 550 31 711 82 839 Immunization 737 737 737 Inter-country programmes 21 826 58 489 80 315 49 955 30 360
Total global assistance 46 438 149 164 195 602 81 666 113 936
Total programme assistance 1 519 177 1 531 526 3 050 703 1 515 575 1 535 128
Support Budget Programme support 21 600 1 208 824 1 230 424 574 449 655 975 Management and administration 10 000 594 263 604 263 285 238 319 025 Security 0 73 050 73 050 32 850 40 200 Recoveries to the budget 0 (320 348) (320 348) (320 348)
Total support budget 31 600 1 555 789 1 587 389 572 189 1 015 200
Total 1 550 777 3 087 315 4 638 092 2 087 764 2 550 328

A/65/5/A
dd.2
82 10-45045
Statement VII.2 Statement of approved programmes, expenditure and unspent balances for other resources (regular) for the biennium ended 31 December 2009 (Thousands of United States dollars)
Approved programmes unspent balances as at
1 January 2008New programmes and
cancellations Total programmes Total expenditure
Approved programmes unspent balances as at
31 December 2009
Africa Angola 24 219 77 971 102 190 76 247 25 943Benin 16 045 14 514 30 559 21 272 9 287Botswana 2 496 4 353 6 849 5 551 1 298Burkina Faso 8 744 23 640 32 384 25 302 7 082Burundi 4 540 15 086 19 626 14 364 5 262Cameroon 3 281 12 676 15 957 11 845 4 112Cape Verde 530 456 986 492 494Central African Republic 2 252 17 679 19 931 16 167 3 764Chad 3 898 17 845 21 743 16 815 4 928Comoros 1 660 2 181 3 841 3 266 575Congo 1 439 13 558 14 997 8 079 6 918Côte d’Ivoire 5 505 44 271 49 776 37 710 12 066Democratic Republic of the Congo 22 680 94 908 117 588 87 391 30 197Equatorial Guinea 940 1 236 2 176 1 035 1 141Eritrea 4 764 18 407 23 171 16 689 6 482Ethiopia 49 500 93 711 143 211 105 616 37 595Gabon 513 4 071 4 584 1 862 2 722Gambia 1 538 4 830 6 368 3 844 2 524Ghana 24 603 16 555 41 158 24 424 16 734Guinea 6 525 12 214 18 739 11 118 7 621Guinea-Bissau 3 238 11 732 14 970 9 271 5 699Kenya 14 488 48 750 63 238 42 020 21 218Lesotho 17 516 6 666 24 182 7 871 16 311Liberia 18 987 21 850 40 837 26 378 14 459Madagascar 6 716 40 713 47 429 21 337 26 092Malawi 23 797 56 216 80 013 56 811 23 202Mali 12 301 23 972 36 273 23 284 12 989Mauritania 2 726 10 846 13 572 7 629 5 943Mozambique 57 202 47 980 105 182 80 356 24 826Namibia 5 687 7 206 12 893 7 955 4 938Niger 11 157 27 944 39 101 30 831 8 270Nigeria 46 419 88 158 134 577 89 517 45 060Rwanda 8 137 26 319 34 456 21 257 13 199Sao Tome and Principe 373 600 973 687 286Senegal 6 598 12 790 19 388 12 299 7 089Sierra Leone 12 069 49 992 62 061 32 403 29 658Somalia 29 924 44 781 74 705 54 473 20 232South Africa 15 241 18 367 33 608 18 488 15 120Swaziland 6 761 10 101 16 862 12 859 4 003
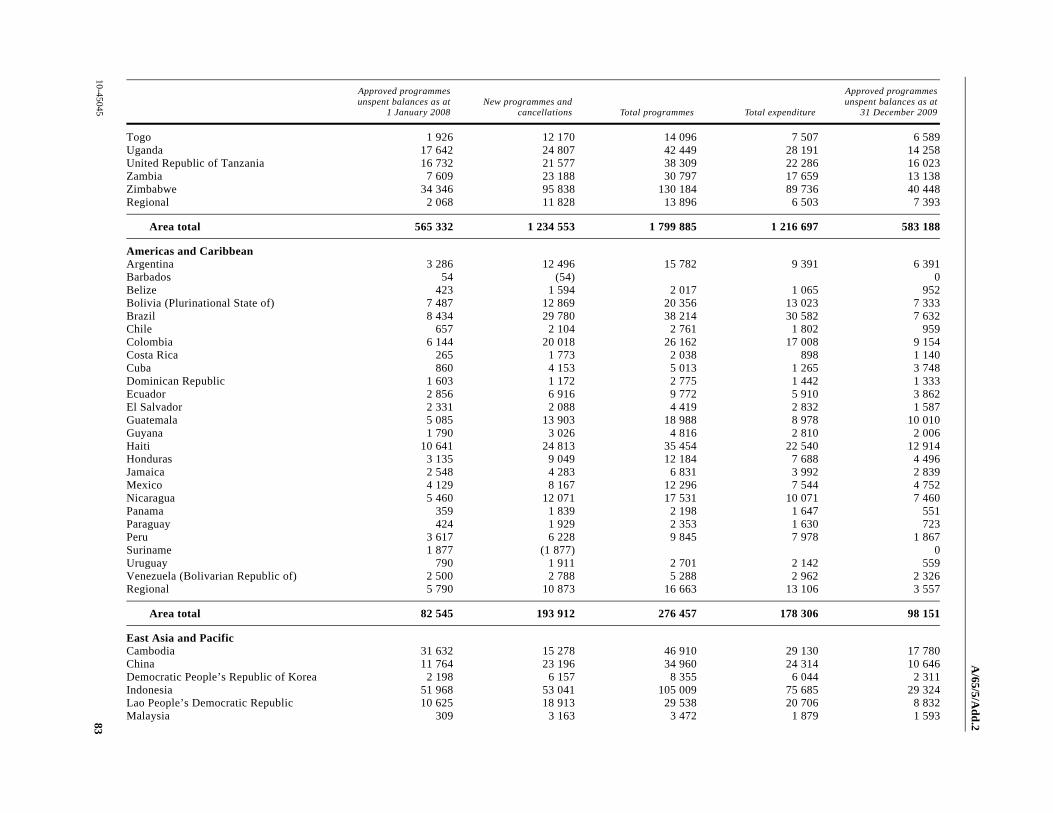
A/65/5/A
dd.2
10-45045 83
Approved programmes unspent balances as at
1 January 2008New programmes and
cancellations Total programmes Total expenditure
Approved programmes unspent balances as at
31 December 2009
Togo 1 926 12 170 14 096 7 507 6 589Uganda 17 642 24 807 42 449 28 191 14 258United Republic of Tanzania 16 732 21 577 38 309 22 286 16 023Zambia 7 609 23 188 30 797 17 659 13 138Zimbabwe 34 346 95 838 130 184 89 736 40 448Regional 2 068 11 828 13 896 6 503 7 393
Area total 565 332 1 234 553 1 799 885 1 216 697 583 188
Americas and Caribbean Argentina 3 286 12 496 15 782 9 391 6 391Barbados 54 (54) 0Belize 423 1 594 2 017 1 065 952Bolivia (Plurinational State of) 7 487 12 869 20 356 13 023 7 333Brazil 8 434 29 780 38 214 30 582 7 632Chile 657 2 104 2 761 1 802 959Colombia 6 144 20 018 26 162 17 008 9 154Costa Rica 265 1 773 2 038 898 1 140Cuba 860 4 153 5 013 1 265 3 748Dominican Republic 1 603 1 172 2 775 1 442 1 333Ecuador 2 856 6 916 9 772 5 910 3 862El Salvador 2 331 2 088 4 419 2 832 1 587Guatemala 5 085 13 903 18 988 8 978 10 010Guyana 1 790 3 026 4 816 2 810 2 006Haiti 10 641 24 813 35 454 22 540 12 914Honduras 3 135 9 049 12 184 7 688 4 496Jamaica 2 548 4 283 6 831 3 992 2 839Mexico 4 129 8 167 12 296 7 544 4 752Nicaragua 5 460 12 071 17 531 10 071 7 460Panama 359 1 839 2 198 1 647 551Paraguay 424 1 929 2 353 1 630 723Peru 3 617 6 228 9 845 7 978 1 867Suriname 1 877 (1 877) 0Uruguay 790 1 911 2 701 2 142 559Venezuela (Bolivarian Republic of) 2 500 2 788 5 288 2 962 2 326Regional 5 790 10 873 16 663 13 106 3 557
Area total 82 545 193 912 276 457 178 306 98 151
East Asia and Pacific Cambodia 31 632 15 278 46 910 29 130 17 780China 11 764 23 196 34 960 24 314 10 646Democratic People’s Republic of Korea 2 198 6 157 8 355 6 044 2 311Indonesia 51 968 53 041 105 009 75 685 29 324Lao People’s Democratic Republic 10 625 18 913 29 538 20 706 8 832Malaysia 309 3 163 3 472 1 879 1 593

A/65/5/A
dd.2
84 10-45045
Approved programmes unspent balances as at
1 January 2008New programmes and
cancellations Total programmes Total expenditure
Approved programmes unspent balances as at
31 December 2009
Mongolia 2 010 3 268 5 278 3 380 1 898Myanmar 18 725 23 256 41 981 30 650 11 331Pacific island countries 3 846 15 955 19 801 10 016 9 785Papua New Guinea 7 003 8 143 15 146 8 645 6 501Philippines 14 660 17 171 31 831 18 944 12 887Thailand 2 115 14 958 17 073 12 572 4 501Timor-Leste 11 050 9 343 20 393 11 010 9 383Viet Nam 9 178 31 703 40 881 26 178 14 703Regional 619 1 918 2 537 1 543 994
Area total 177 702 245 463 423 165 280 696 142 469
South Asia Afghanistan 17 382 91 413 108 795 77 168 31 627Bangladesh 91 886 69 298 161 184 85 947 75 237Bhutan 3 239 5 194 8 433 5 494 2 939India 39 787 196 875 236 662 136 828 99 834Maldives 902 892 1 794 746 1 048Nepal 10 682 23 347 34 029 24 363 9 666Pakistan 38 607 74 979 113 586 64 883 48 703Sri Lanka 9 567 26 526 36 093 14 501 21 592Regional 1 440 1 440 1 408 32
Area total 212 052 489 964 702 016 411 338 290 678
Middle East and North Africa Algeria 237 1 685 1 922 589 1 333Djibouti 2 655 5 472 8 127 6 039 2 088Egypt 8 102 9 169 17 271 13 308 3 963Iran (Islamic Republic of) 4 876 2 138 7 014 2 591 4 423Iraq 37 092 41 498 78 590 39 742 38 848Jordan 2 007 2 249 4 256 2 435 1 821Lebanon 2 070 3 532 5 602 2 109 3 493Morocco 3 380 5 748 9 128 6 285 2 843Oman 978 2 139 3 117 2 142 975Palestinian children and women 4 163 12 267 16 430 10 345 6 085Sudan 31 134 132 168 163 302 117 098 46 204Syrian Arab Republic 1 226 405 1 631 919 712Tunisia 341 1 073 1 414 929 485Yemen 7 562 6 106 13 668 6 037 7 631Regional 1 844 2 633 4 477 2 651 1 826
Area total 107 667 228 282 335 949 213 219 122 730

A/65/5/A
dd.2
10-45045 85
Approved programmes unspent balances as at
1 January 2008New programmes and
cancellations Total programmes Total expenditure
Approved programmes unspent balances as at
31 December 2009
Central and Eastern Europe and Commonwealth of Independent States Albania 3 649 9 117 12 766 9 153 3 613Armenia 824 964 1 788 1 289 499Azerbaijan 1 339 2 228 3 567 2 532 1 035Belarus 274 1 194 1 468 552 916Bosnia and Herzegovina 1 914 11 652 13 566 6 544 7 022Bulgaria 700 2 216 2 916 1 956 960Croatia 874 2 565 3 439 2 060 1 379Georgia 2 280 10 767 13 047 6 918 6 129Kazakhstan 2 337 1 307 3 644 1 479 2 165Kosovo (Serbia) 2 501 5 357 7 858 4 695 3 163Kyrgyzstan 1 383 2 691 4 074 3 148 926Montenegro 325 1 148 1 473 1 123 350Republic of Moldova 2 791 7 698 10 489 7 132 3 357Romania 2 625 1 928 4 553 3 421 1 132Russian Federation 8 773 12 374 21 147 15 208 5 939Serbia 2 973 6 355 9 328 4 815 4 513Tajikistan 3 068 7 842 10 910 7 631 3 279The former Yugoslav Republic of
Macedonia 1 857 3 643 5 500 2 775 2 725Turkey 5 056 10 303 15 359 9 310 6 049Turkmenistan 220 1 357 1 577 1 443 134Ukraine 3 035 5 824 8 859 4 822 4 037Uzbekistan 617 6 585 7 202 4 849 2 353Regional 2 938 3 454 6 392 4 178 2 214
Area total 52 353 118 569 170 922 107 033 63 889
Global assistance Avian influenza 5 860 1 199 7 059 6 554 505Emergency Programme Fund 8 670 (253) 8 417 751 7 666Immunization 2 580 364 2 944 2 479 465Inter-country programmes 280 411 366 280 646 691 366 484 280 207Innocenti Research Centre 8 369 12 074 20 443 9 808 10 635Special session on children -3 3 0
Total global assistance 305 887 379 667 685 554 386 076 299 478
Total programme assistance 1 503 538 2 890 410 4 393 948 2 793 365 1 600 583

A/65/5/A
dd.2
86 10-45045
Statement VII.3 Statement of approved programmes, expenditure and unspent balances for other resources (emergency) for the biennium ended 31 December 2009 (Thousands of United States dollars)
Approved programmes unspent balances as at
1 January 2008New programmes and
cancellations Total programmes Total expenditure
Approved programmes unspent balances as at
31 December 2009
Africa Angola 655 2 277 2 932 2 584 348Benin 949 205 1 154 1 111 43Burkina Faso 3 035 11 582 14 617 11 732 2 885Burundi 3 156 5 933 9 089 8 340 749Cameroon 2 194 2 194 2 185 9Cape Verde 160 160 33 127Central African Republic 2 023 15 119 17 142 15 021 2 121Chad 8 116 26 809 34 925 29 901 5 024Comoros 25 396 421 420 1Congo 1 602 1 181 2 783 1 259 1 524Côte d’Ivoire 1 719 6 751 8 470 7 694 776Democratic Republic of the Congo 17 700 121 325 139 025 126 880 12 145Eritrea 4 541 18 101 22 642 19 819 2 823Ethiopia 6 418 93 811 100 229 77 157 23 072Gambia 87 60 147 143 4Ghana 658 200 858 834 24Guinea 1 149 2 989 4 138 3 225 913Guinea-Bissau 100 1 979 2 079 2 034 45Kenya 2 644 29 539 32 183 18 966 13 217Lesotho 1 629 1 483 3 112 3 014 98Liberia 7 708 8 832 16 540 12 105 4 435Madagascar 604 14 281 14 885 13 188 1 697Malawi 245 3 576 3 821 3 732 89Mali 1 077 15 779 16 856 6 160 10 696Mauritania 914 3 916 4 830 3 023 1 807Mozambique 225 5 784 6 009 5 989 20Namibia 12 1 655 1 667 1 127 540Niger 4 741 15 076 19 817 13 005 6 812Rwanda (703) (64) (767) (767)Sao Tome and Principe 6 6 (1) 7Senegal 652 662 1 314 393 921Sierra Leone 539 (265) 274 190 84Somalia 10 222 88 278 98 500 79 461 19 039Swaziland 1 124 1 103 2 227 2 232 (5)Togo 1 756 1 905 3 661 3 578 83Uganda 8 995 35 239 44 234 35 971 8 263United Republic of Tanzania 340 1 174 1 514 1 709 (195)Zambia (133) 4 951 4 818 4 583 235

A/65/5/A
dd.2
10-45045 87
Approved programmes unspent balances as at
1 January 2008New programmes and
cancellations Total programmes Total expenditure
Approved programmes unspent balances as at
31 December 2009
Zimbabwe 6 463 112 174 118 637 79 550 39 087Regional 6 154 4 910 11 064 4 583 6 481
Area total 107 147 661 060 768 207 602 930 165 277
Americas and Caribbean Argentina (14) 14Barbados 212 212 212Bolivia (Plurinational State of) 227 3 939 4 166 4 160 6Colombia 828 3 057 3 885 3 751 134Costa Rica (2) (2) (2)Cuba 6 2 216 2 222 1 670 552Dominican Republic 496 693 1 189 1 020 169Ecuador 160 160 160El Salvador (279) 469 190 110 80Guatemala 435 1 020 1 455 1 517 (62)Haiti 2 682 9 571 12 253 11 603 650Honduras 29 2 711 2 740 2 478 262Jamaica 184 184 185 (1)Mexico 1 648 1 413 3 061 3 034 27Nicaragua 1 185 593 1 778 1 492 286Peru 1 491 1 216 2 707 2 774 (67)Venezuela (Bolivarian Republic of) 2 2 (2) 4Regional 547 1 691 2 238 1 042 1 196
Area total 9 677 28 763 38 440 34 994 3 446
East Asia and Pacific Cambodia 50 50 52 (2)China 102 43 339 43 441 31 296 12 145Democratic People’s Republic of Korea 5 329 16 423 21 752 14 480 7 272Indonesia 125 043 4 637 129 680 109 839 19 841Lao People’s Democratic Republic 3 817 3 817 2 543 1 274Malaysia 327 327 341 (14)Mongolia 14 (14)Myanmar 3 224 82 774 85 998 81 088 4 910Pacific island countries 423 1 067 1 490 1 038 452Papua New Guinea 351 351 351Philippines 376 12 536 12 912 8 408 4 504Thailand 3 154 3 154 3 221 (67)Timor-Leste 1 628 764 2 392 2 195 197Viet Nam 43 (43)Regional 1 274 1 314 2 588 1 650 938
Area total 140 937 167 015 307 952 256 151 51 801
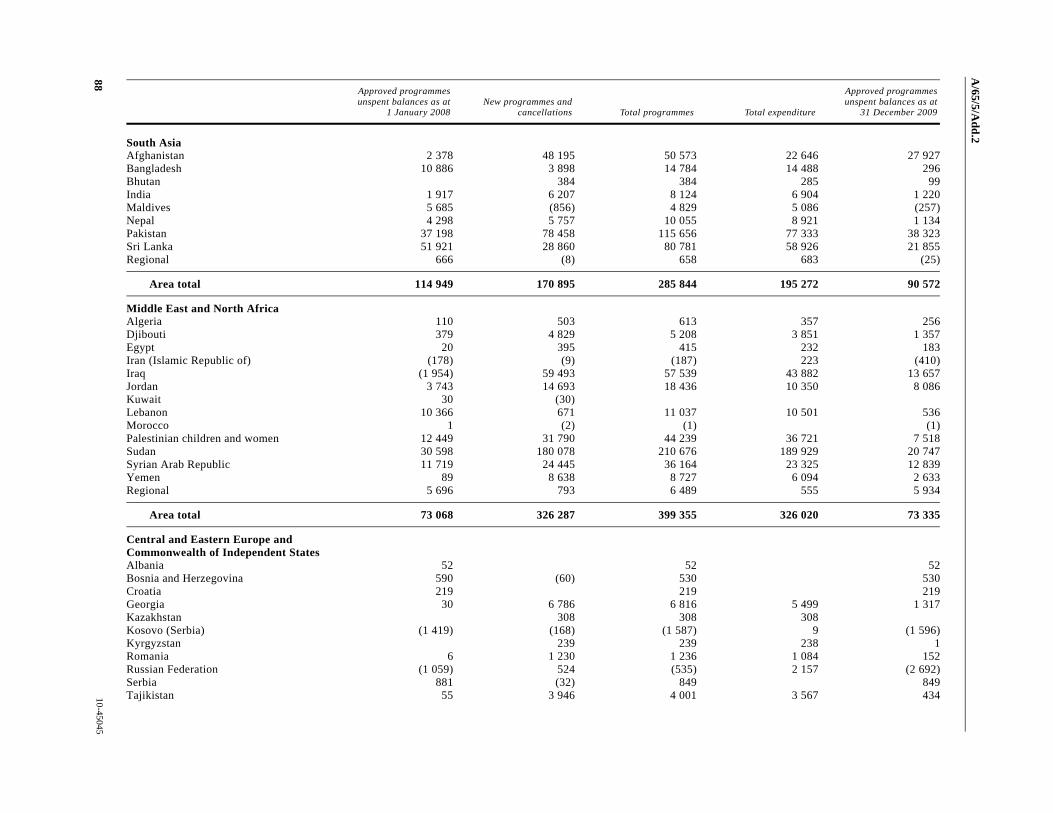
A/65/5/A
dd.2
88 10-45045
Approved programmes unspent balances as at
1 January 2008New programmes and
cancellations Total programmes Total expenditure
Approved programmes unspent balances as at
31 December 2009
South Asia Afghanistan 2 378 48 195 50 573 22 646 27 927Bangladesh 10 886 3 898 14 784 14 488 296Bhutan 384 384 285 99India 1 917 6 207 8 124 6 904 1 220Maldives 5 685 (856) 4 829 5 086 (257)Nepal 4 298 5 757 10 055 8 921 1 134Pakistan 37 198 78 458 115 656 77 333 38 323Sri Lanka 51 921 28 860 80 781 58 926 21 855Regional 666 (8) 658 683 (25)
Area total 114 949 170 895 285 844 195 272 90 572
Middle East and North Africa Algeria 110 503 613 357 256Djibouti 379 4 829 5 208 3 851 1 357Egypt 20 395 415 232 183Iran (Islamic Republic of) (178) (9) (187) 223 (410)Iraq (1 954) 59 493 57 539 43 882 13 657Jordan 3 743 14 693 18 436 10 350 8 086Kuwait 30 (30)Lebanon 10 366 671 11 037 10 501 536Morocco 1 (2) (1) (1)Palestinian children and women 12 449 31 790 44 239 36 721 7 518Sudan 30 598 180 078 210 676 189 929 20 747Syrian Arab Republic 11 719 24 445 36 164 23 325 12 839Yemen 89 8 638 8 727 6 094 2 633Regional 5 696 793 6 489 555 5 934
Area total 73 068 326 287 399 355 326 020 73 335
Central and Eastern Europe and Commonwealth of Independent States Albania 52 52 52Bosnia and Herzegovina 590 (60) 530 530Croatia 219 219 219Georgia 30 6 786 6 816 5 499 1 317Kazakhstan 308 308 308Kosovo (Serbia) (1 419) (168) (1 587) 9 (1 596)Kyrgyzstan 239 239 238 1Romania 6 1 230 1 236 1 084 152Russian Federation (1 059) 524 (535) 2 157 (2 692)Serbia 881 (32) 849 849Tajikistan 55 3 946 4 001 3 567 434
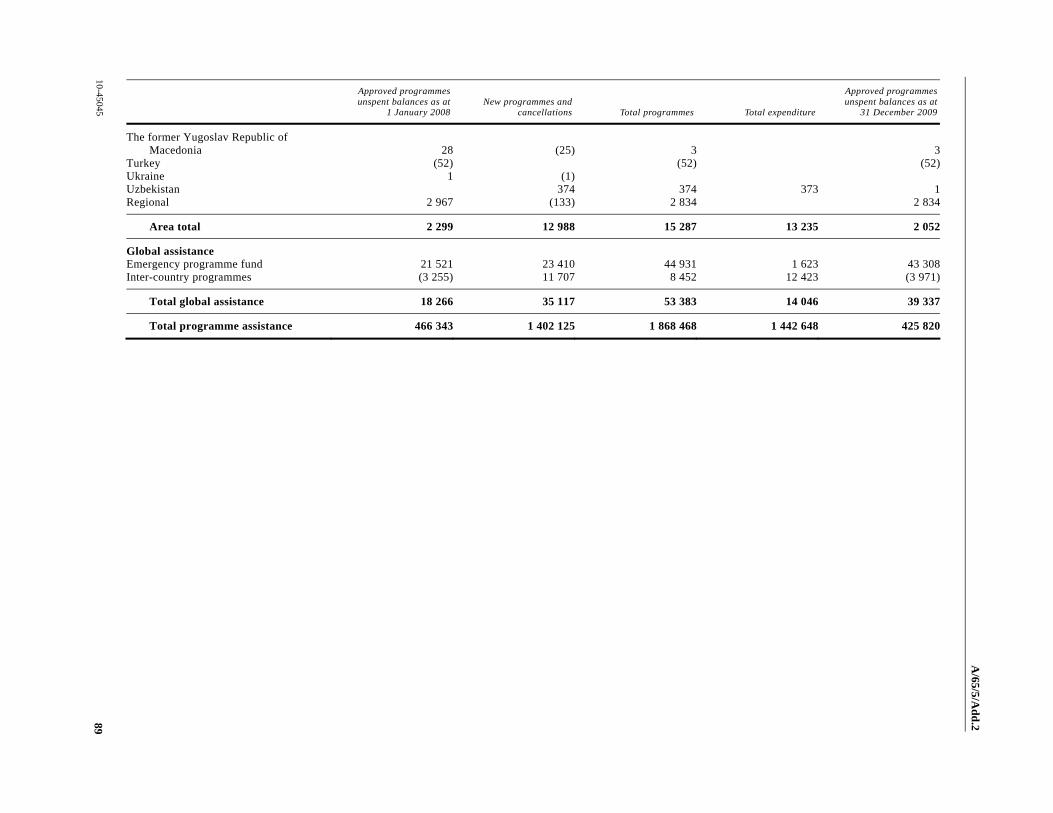
A/65/5/A
dd.2
10-45045 89
Approved programmes unspent balances as at
1 January 2008New programmes and
cancellations Total programmes Total expenditure
Approved programmes unspent balances as at
31 December 2009
The former Yugoslav Republic of Macedonia 28 (25) 3 3
Turkey (52) (52) (52)Ukraine 1 (1)Uzbekistan 374 374 373 1Regional 2 967 (133) 2 834 2 834
Area total 2 299 12 988 15 287 13 235 2 052
Global assistance Emergency programme fund 21 521 23 410 44 931 1 623 43 308Inter-country programmes (3 255) 11 707 8 452 12 423 (3 971)
Total global assistance 18 266 35 117 53 383 14 046 39 337
Total programme assistance 466 343 1 402 125 1 868 468 1 442 648 425 820
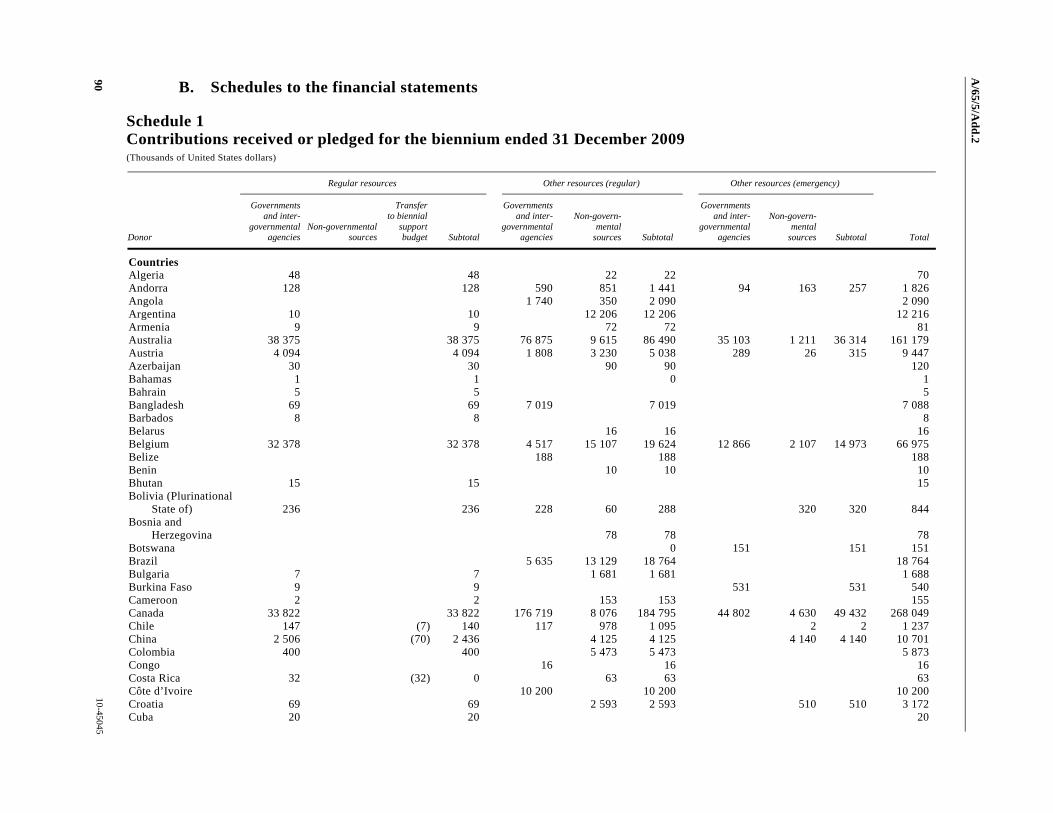
A/65/5/A
dd.2
90 10-45045
B. Schedules to the financial statements
Schedule 1 Contributions received or pledged for the biennium ended 31 December 2009 (Thousands of United States dollars)
Regular resources Other resources (regular) Other resources (emergency)
Donor
Governments and inter-
governmental agencies
Non-governmental sources
Transfer to biennial
support budget Subtotal
Governments and inter-
governmental agencies
Non-govern-mental
sources Subtotal
Governments and inter-
governmental agencies
Non-govern-mental
sources Subtotal Total
Countries Algeria 48 48 22 22 70 Andorra 128 128 590 851 1 441 94 163 257 1 826 Angola 1 740 350 2 090 2 090 Argentina 10 10 12 206 12 206 12 216 Armenia 9 9 72 72 81 Australia 38 375 38 375 76 875 9 615 86 490 35 103 1 211 36 314 161 179 Austria 4 094 4 094 1 808 3 230 5 038 289 26 315 9 447 Azerbaijan 30 30 90 90 120 Bahamas 1 1 0 1 Bahrain 5 5 5 Bangladesh 69 69 7 019 7 019 7 088 Barbados 8 8 8 Belarus 16 16 16 Belgium 32 378 32 378 4 517 15 107 19 624 12 866 2 107 14 973 66 975 Belize 188 188 188 Benin 10 10 10 Bhutan 15 15 15 Bolivia (Plurinational
State of) 236 236 228 60 288 320 320 844 Bosnia and
Herzegovina 78 78 78 Botswana 0 151 151 151 Brazil 5 635 13 129 18 764 18 764 Bulgaria 7 7 1 681 1 681 1 688 Burkina Faso 9 9 531 531 540 Cameroon 2 2 153 153 155 Canada 33 822 33 822 176 719 8 076 184 795 44 802 4 630 49 432 268 049 Chile 147 (7) 140 117 978 1 095 2 2 1 237 China 2 506 (70) 2 436 4 125 4 125 4 140 4 140 10 701 Colombia 400 400 5 473 5 473 5 873 Congo 16 16 16 Costa Rica 32 (32) 0 63 63 63 Côte d’Ivoire 10 200 10 200 10 200 Croatia 69 69 2 593 2 593 510 510 3 172 Cuba 20 20 20

A/65/5/A
dd.2
10-45045 91
Regular resources Other resources (regular) Other resources (emergency)
Donor
Governments and inter-
governmental agencies
Non-governmental sources
Transfer to biennial
support budget Subtotal
Governments and inter-
governmental agencies
Non-govern-mental
sources Subtotal
Governments and inter-
governmental agencies
Non-govern-mental
sources Subtotal Total
Cyprus 28 28 28 Czech Republic 360 360 142 1 852 1 994 526 104 630 2 984 Democratic People’s
Republic of Korea 159 (159)
Democratic Republic of the Congo 2 433 2 433 2 433
Denmark 68 490 68 490 31 405 12 042 43 447 43 020 2 531 45 551 157 488 Ecuador 22 22 1 629 1 629 1 651 Egypt 147 147 1 443 391 1 834 1 981 El Salvador 1 1 1 Estonia 122 122 169 20 189 396 396 707 Ethiopia 100 100 100 Finland 44 564 44 564 5 125 7 723 12 848 11 701 1 566 13 267 70 679 France 31 276 31 276 2 109 30 322 32 431 2 436 12 699 15 135 78 842 Gabon 316 100 416 416 Germany 17 400 17 400 15 925 51 279 67 204 985 33 531 34 516 119 120 Greece 600 600 225 2 886 3 111 328 328 4 039 Guinea 10 10 10 Guyana 11 11 11 Haiti 20 20 1 1 21 Honduras 60 60 60 Hong Kong 7 866 7 866 21 988 21 988 29 854 Hungary 284 284 643 643 0 927 Iceland 822 822 1 050 1 704 2 754 200 41 241 3 817 India 886 886 3 448 3 901 7 349 47 47 8 282 Indonesia 200 200 4 445 4 445 56 56 4 701 Iran, Islamic
Republic of 55 55 323 323 12 12 390 Ireland 35 876 35 876 6 303 2 026 8 329 7 899 982 8 881 53 086 Israel 240 240 65 65 305 Italy 21 652 21 652 18 505 43 829 62 334 29 155 11 735 40 890 124 876 Japan 31 148 31 148 166 939 20 674 187 613 119 637 24 083 143 720 362 481 Kazakhstan 100 100 100 Kenya 208 208 26 26 234 Kuwait 400 400 400 Lebanon 5 5 1 250 1 250 1 255 Lesotho 3 3 3 Liechtenstein 69 69 263 263 88 88 420 Lithuania 57 57 31 31 88 Luxembourg 7 411 7 411 11 620 1 033 12 653 1 386 51 1 437 21 501 Madagascar 4 875 4 875 1 481 1 481 6 356 Malawi 6 6 6
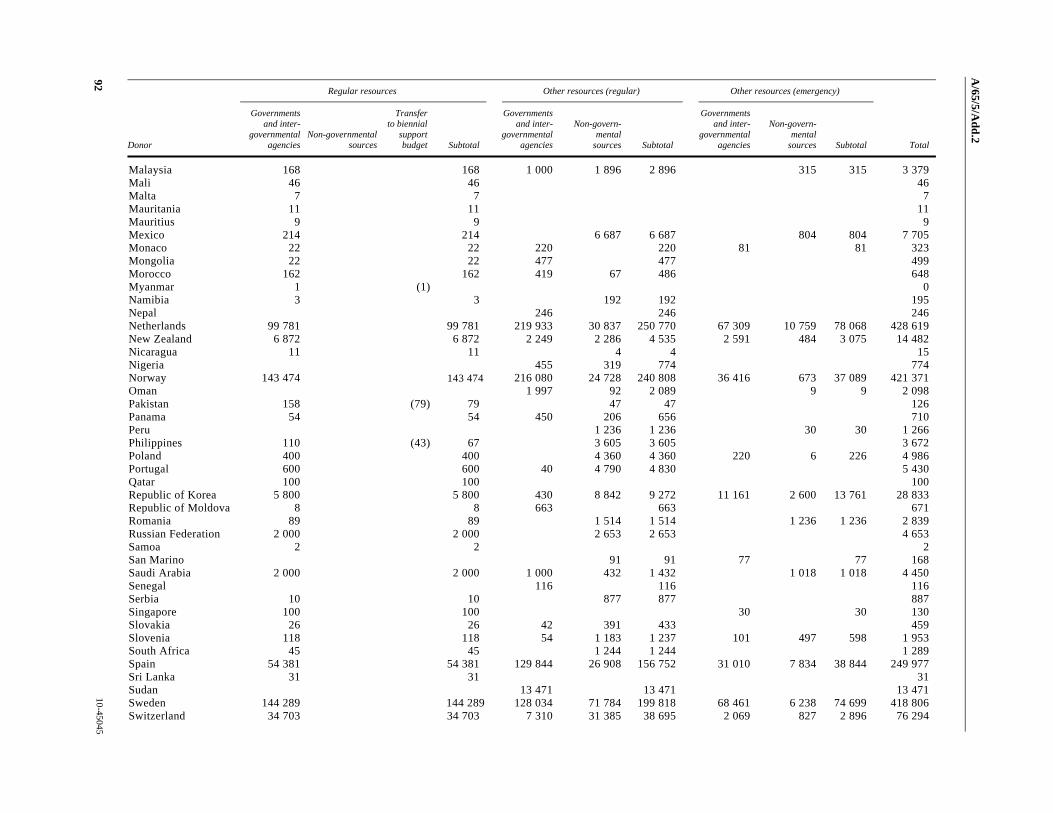
A/65/5/A
dd.2
92 10-45045
Regular resources Other resources (regular) Other resources (emergency)
Donor
Governments and inter-
governmental agencies
Non-governmental sources
Transfer to biennial
support budget Subtotal
Governments and inter-
governmental agencies
Non-govern-mental
sources Subtotal
Governments and inter-
governmental agencies
Non-govern-mental
sources Subtotal Total
Malaysia 168 168 1 000 1 896 2 896 315 315 3 379 Mali 46 46 46 Malta 7 7 7 Mauritania 11 11 11 Mauritius 9 9 9 Mexico 214 214 6 687 6 687 804 804 7 705 Monaco 22 22 220 220 81 81 323 Mongolia 22 22 477 477 499 Morocco 162 162 419 67 486 648 Myanmar 1 (1) 0 Namibia 3 3 192 192 195 Nepal 246 246 246 Netherlands 99 781 99 781 219 933 30 837 250 770 67 309 10 759 78 068 428 619 New Zealand 6 872 6 872 2 249 2 286 4 535 2 591 484 3 075 14 482 Nicaragua 11 11 4 4 15 Nigeria 455 319 774 774 Norway 143 474 143 474 216 080 24 728 240 808 36 416 673 37 089 421 371 Oman 1 997 92 2 089 9 9 2 098 Pakistan 158 (79) 79 47 47 126 Panama 54 54 450 206 656 710 Peru 1 236 1 236 30 30 1 266 Philippines 110 (43) 67 3 605 3 605 3 672 Poland 400 400 4 360 4 360 220 6 226 4 986 Portugal 600 600 40 4 790 4 830 5 430 Qatar 100 100 100 Republic of Korea 5 800 5 800 430 8 842 9 272 11 161 2 600 13 761 28 833 Republic of Moldova 8 8 663 663 671 Romania 89 89 1 514 1 514 1 236 1 236 2 839 Russian Federation 2 000 2 000 2 653 2 653 4 653 Samoa 2 2 2 San Marino 91 91 77 77 168 Saudi Arabia 2 000 2 000 1 000 432 1 432 1 018 1 018 4 450 Senegal 116 116 116 Serbia 10 10 877 877 887 Singapore 100 100 30 30 130 Slovakia 26 26 42 391 433 459 Slovenia 118 118 54 1 183 1 237 101 497 598 1 953 South Africa 45 45 1 244 1 244 1 289 Spain 54 381 54 381 129 844 26 908 156 752 31 010 7 834 38 844 249 977 Sri Lanka 31 31 0 0 31 Sudan 13 471 13 471 13 471 Sweden 144 289 144 289 128 034 71 784 199 818 68 461 6 238 74 699 418 806 Switzerland 34 703 34 703 7 310 31 385 38 695 2 069 827 2 896 76 294
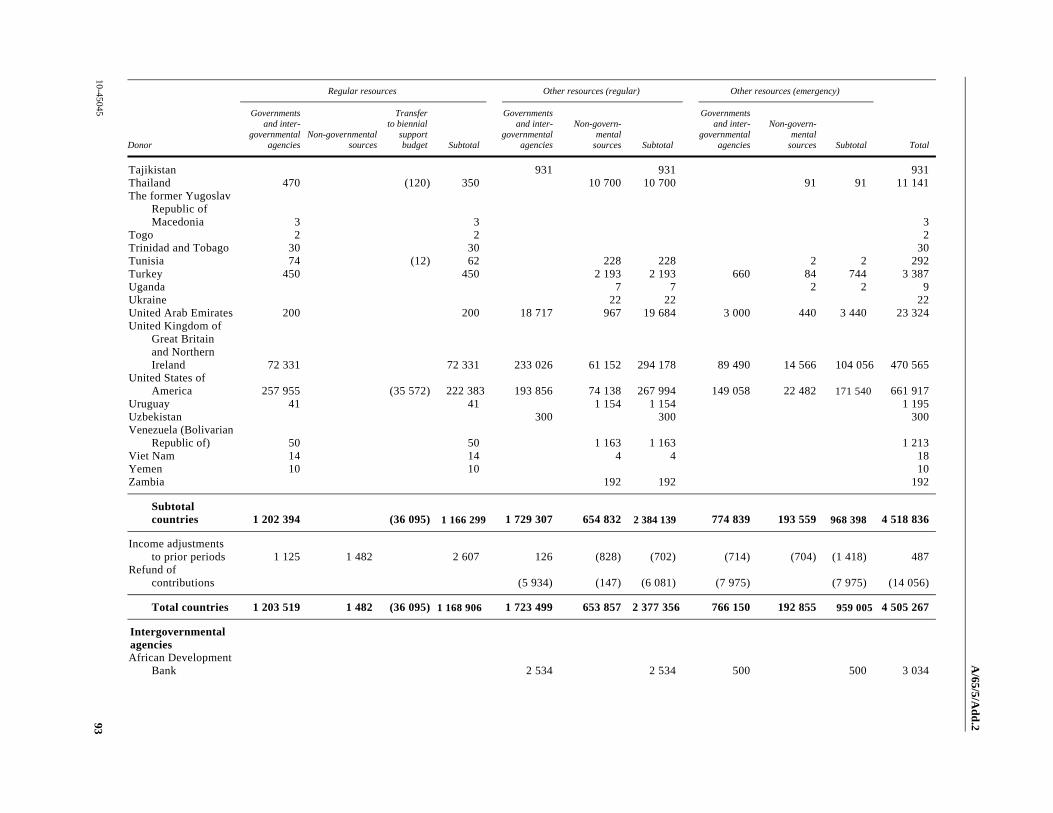
A/65/5/A
dd.2
10-45045 93
Regular resources Other resources (regular) Other resources (emergency)
Donor
Governments and inter-
governmental agencies
Non-governmental sources
Transfer to biennial
support budget Subtotal
Governments and inter-
governmental agencies
Non-govern-mental
sources Subtotal
Governments and inter-
governmental agencies
Non-govern-mental
sources Subtotal Total
Tajikistan 931 931 931 Thailand 470 (120) 350 10 700 10 700 91 91 11 141 The former Yugoslav
Republic of Macedonia 3 3 3
Togo 2 2 2 Trinidad and Tobago 30 30 30 Tunisia 74 (12) 62 228 228 2 2 292 Turkey 450 450 2 193 2 193 660 84 744 3 387 Uganda 7 7 2 2 9 Ukraine 22 22 22 United Arab Emirates 200 200 18 717 967 19 684 3 000 440 3 440 23 324 United Kingdom of
Great Britain and Northern Ireland 72 331 72 331 233 026 61 152 294 178 89 490 14 566 104 056 470 565
United States of America 257 955 (35 572) 222 383 193 856 74 138 267 994 149 058 22 482 171 540 661 917
Uruguay 41 41 1 154 1 154 1 195 Uzbekistan 300 300 300 Venezuela (Bolivarian
Republic of) 50 50 1 163 1 163 1 213 Viet Nam 14 14 4 4 18 Yemen 10 10 10 Zambia 192 192 192
Subtotal countries 1 202 394 (36 095) 1 166 299 1 729 307 654 832 2 384 139 774 839 193 559 968 398 4 518 836
Income adjustments to prior periods 1 125 1 482 2 607 126 (828) (702) (714) (704) (1 418) 487
Refund of contributions (5 934) (147) (6 081) (7 975) (7 975) (14 056)
Total countries 1 203 519 1 482 (36 095) 1 168 906 1 723 499 653 857 2 377 356 766 150 192 855 959 005 4 505 267
Intergovernmental agencies African Development
Bank 2 534 2 534 500 500 3 034

A/65/5/A
dd.2
94 10-45045
Regular resources Other resources (regular) Other resources (emergency)
Donor
Governments and inter-
governmental agencies
Non-governmental sources
Transfer to biennial
support budget Subtotal
Governments and inter-
governmental agencies
Non-govern-mental
sources Subtotal
Governments and inter-
governmental agencies
Non-govern-mental
sources Subtotal Total
Arab Gulf Programme for United Nations Development Organizations 105 105 105
Asian Development Bank 70 70 70
Council of Europe Development Bank 607 607 607
European Commission 174 635 174 635 122 192 122 192 296 827 OPEC Fund 1 953 1 953 1 953 Secretariat of Pacific
Community 248 248 248
Subtotal intergovernmental agencies 180 152 180 152 122 692 122 692 302 844
Income adjustments to prior periods 6 460 6 460 (2 195) (2 195) (4 266) (4 266) (1)
Refund of contributions (31) (31) (1 036) (1 036) (1 067)
Total intergovernmental agencies 6 460 6 460 177 926 177 926 117 390 117 390 301 776
Total Governments and intergovernmental agencies 1 209 979 1 482 (36 095) 1 175 366 1 901 425 653 857 2 555 282 883 540 192 855 1 076 395 4 807 043
Non-governmental organizations Algeria 1 1 1 Canada 25 312 25 312 25 312 Cayman Islands 2 2 2 Ethiopia 10 10 10 Fiji 1 1 1 Global Alliance for
Vaccines and Immunization 17 550 17 550 17 550
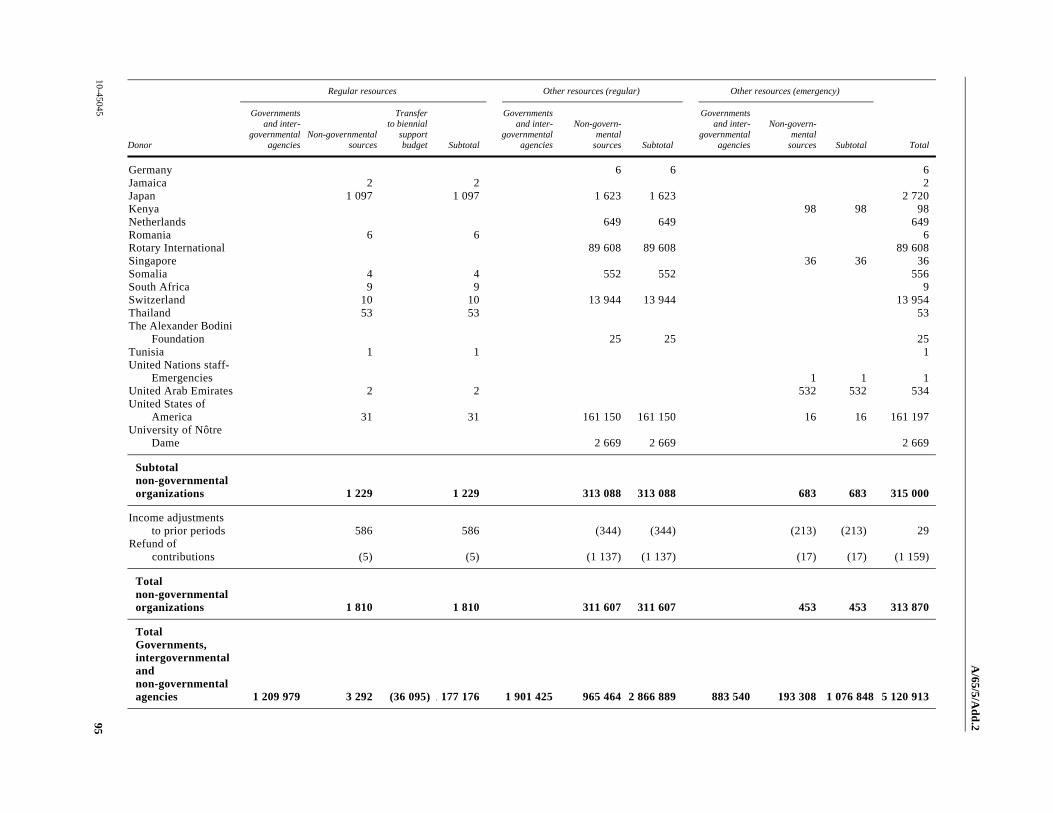
A/65/5/A
dd.2
10-45045 95
Regular resources Other resources (regular) Other resources (emergency)
Donor
Governments and inter-
governmental agencies
Non-governmental sources
Transfer to biennial
support budget Subtotal
Governments and inter-
governmental agencies
Non-govern-mental
sources Subtotal
Governments and inter-
governmental agencies
Non-govern-mental
sources Subtotal Total
Germany 6 6 6 Jamaica 2 2 2 Japan 1 097 1 097 1 623 1 623 2 720 Kenya 98 98 98 Netherlands 649 649 649 Romania 6 6 6 Rotary International 89 608 89 608 89 608 Singapore 36 36 36 Somalia 4 4 552 552 556 South Africa 9 9 9 Switzerland 10 10 13 944 13 944 13 954 Thailand 53 53 53 The Alexander Bodini
Foundation 25 25 25 Tunisia 1 1 1 United Nations staff-
Emergencies 1 1 1 United Arab Emirates 2 2 532 532 534 United States of
America 31 31 161 150 161 150 16 16 161 197 University of Nôtre
Dame 2 669 2 669 2 669
Subtotal non-governmental organizations 1 229 1 229 313 088 313 088 683 683 315 000
Income adjustments to prior periods 586 586 (344) (344) (213) (213) 29
Refund of contributions (5) (5) (1 137) (1 137) (17) (17) (1 159)
Total non-governmental organizations 1 810 1 810 311 607 311 607 453 453 313 870
Total Governments, intergovernmental and non-governmental agencies 1 209 979 3 292 (36 095) 1 177 176 1 901 425 965 464 2 866 889 883 540 193 308 1 076 848 5 120 913

A/65/5/A
dd.2
96 10-45045
Regular resources Other resources (regular) Other resources (emergency)
Donor
Governments and inter-
governmental agencies
Non-governmental sources
Transfer to biennial
support budget Subtotal
Governments and inter-
governmental agencies
Non-govern-mental
sources Subtotal
Governments and inter-
governmental agencies
Non-govern-mental
sources Subtotal Total
Inter-organizational arrangements
Food and Agriculture Organization 353 353 353
Joint United Nations Programme on HIV/AIDS 24 321 24 321 38 38 24 359
Department of Peacekeeping Operations 529 529 529
United Nations Office at Geneva 118 118 118
United Nations Trust Fund for Human Security 3 103 3 103 3 103
Secretariat 173 173 173 United Nations
Development Group 21 916 21 916 21 916
United Nations Development Programme 110 073 110 073 103 382 103 382 213 455
United Nations Educational, Scientific and Cultural Organization 3 324 3 324 3 324
United Nations Population Fund 10 615 10 615 10 615
United Nations High Commissioner for Refugees 114 114 114
United Nations Development Fund for Women 100 100 100
United Nations Office for Coordination of Humanitarian Affairs 218 548 218 548 218 548
United Nations Human Settlements Programme 63 63 140 140 203

A/65/5/A
dd.2
10-45045 97
Regular resources Other resources (regular) Other resources (emergency)
Donor
Governments and inter-
governmental agencies
Non-governmental sources
Transfer to biennial
support budget Subtotal
Governments and inter-
governmental agencies
Non-govern-mental
sources Subtotal
Governments and inter-
governmental agencies
Non-govern-mental
sources Subtotal Total
United Nations Environmental Programme 310 310 310
United Nations Office for Project Services 27 27 27
United Nations joint programmes 19 756 19 756 3 064 3 064 22 820
World Health Organization 20 680 20 680 140 140 20 820
World Bank 15 935 15 935 5 909 5 909 21 844 World Food Programme 255 255 255
Subtotal inter-organizational arrangements 231 651 231 651 331 335 331 335 562 986
Income adjustments to prior periods 243 243 (150) (150) (154) (154) (61)
Refund of contributions (790) (790) (10 003) (10 003) (10 793)
Total inter-organizational arrangements 243 243 230 711 230 711 321 178 321 178 552 132
Total 1 209 979 3 535 (36 095) 1 177 419 1 901 425 1 196 175 3 097 600 883 540 514 486 1 398 026 5 673 045
Summary Regular
resources Other resources
(regular) Other resources
(emergency) Total
Governments 1 167 424 1 723 499 766 150 3 657 073 Intergovernmental agencies 6 460 177 926 117 390 301 776 National committees 1 482 653 857 192 855 848 194 Non-governmental organizations 1 810 311 607 453 313 870 Inter-organizational arrangements 243 230 711 321 178 552 132
Total 1 177 419 3 097 600 1 398 026 5 673 045
Contributions in cash 5 652 097 Contributions in kind 20 948
Total contributions 5 673 045

A/65/5/A
dd.2
98 10-45045
Schedule 2 Contributions receivable for regular resources, other resources (regular) and other resources (emergency) as at 31 December 2009 (Thousands of United States dollars)
Regular resources Other resources (regular) Other resources (emergency)
Donor
Governments and inter-
governmental agencies
Non-governmental sources Subtotal
Governments and inter-
governmental agencies
Non-governmentalsources Subtotal
Governments and inter-
governmental agencies
Non-govern-mental sources Subtotal Total
Governments Australia 3 913 3 913 3 913 Austria 4 4 289 289 293 Belgium 1 198 1 198 4 098 4 098 5 296 Bhutan 15 15 15 Canada 16 380 16 380 16 380 Democratic People’s
Republic of Korea 159 159 159
Denmark 7 399 7 399 874 874 8 272 France 216 216 216 Gabon 110 110 110 Italy 5 217 5 217 5 217 Japan 4 397 4 397 4 397 Lesotho 2 2 2 Mauritania 11 11 11 Mexico 214 214 214 Mongolia 294 294 294 Morocco 16 16 16 Nepal 209 209 209 Netherlands 5 303 5 303 5 303 New Zealand 20 20 20 Samoa 1 1 1 Sweden 5 579 5 579 5 579 Switzerland 100 100 255 255 355 United States of
America 61 242 61 242 72 975 72 975 134 217 United Kingdom 232 232 4 581 4 581 4 813 Viet Nam 14 14 14
Subtotal Governments 431 431 111 812 111 812 83 071 83 071 195 314

A/65/5/A
dd.2
10-45045 99
Regular resources Other resources (regular) Other resources (emergency)
Donor
Governments and inter-
governmental agencies
Non-governmental sources Subtotal
Governments and inter-
governmental agencies
Non-governmentalsources Subtotal
Governments and inter-
governmental agencies
Non-govern-mental sources Subtotal Total
Intergovernmental agencies
European Commission 72 813 72 813 3 025 3 025 75 838 European Commission
humanitarian aid office 1 732 1 732 19 190 19 190 20 921
Subtotal intergovernmental agencies 74 545 74 545 22 215 22 215 96 760
Non-governmental organizations
Micronutrient Initiative 72 72 72
Rotary International 22 071 22 071 22 071
Subtotal non-governmental organizations 22 143 22 143 22 143
Inter-organizational arrangements United Nations
Office for Coordination of Humanitarian Affairs 306 306 306
World Bank 15 000 15 000 15 000
Subtotal inter-organizational arrangements 15 000 15 000 306 306 15 306
Miscellaneous adjustments 157 43 200 200
Subtotal miscellaneous adjustments 157 43 200 200
Total 588 43 631 186 357 37 143 223 500 105 286 306 105 592 329 723

A/65/5/A
dd.2
100 10-45045
Regular resources Other resources (regular) Other resources (emergency)
Donor
Governments and inter-
governmental agencies
Non-governmental sources Subtotal
Governments and inter-
governmental agencies
Non-governmentalsources Subtotal
Governments and inter-
governmental agencies
Non-govern-mental sources Subtotal Total
Summary Governments 431 111 812 83 071 195 314 Intergovernmental
agencies 74 545 22 215 96 760 Non-governmental
organizations 22 143 22 143 Inter-organizational
arrangements 15 000 306 15 306 Miscellaneous
adjustments 200 200
Total 631 223 500 105 592 329 723

A/65/5/A
dd.2
10-45045 101
Schedule 3 Receipts, disbursements and changes in trust fund balances for the biennium ended 31 December 2009 (Thousands of United States dollars)
Balances as at
1 January 2008 Funds received and
adjustments Funds disbursed Balances as at
31 December 2009
Government and others Procurement services 236 897 1 004 536 911 861 329 572 Procurement services on behalf of the Global Alliance for Vaccines and
Immunization (6 227) 698 445 698 115 (5 897) Junior Professional Officers 16 740 26 450 24 675 18 515 Other trust funds 43 490 69 510 86 298 26 701
Subtotal 290 900 1 798 941 1 720 949 368 891
United Nations System Joint United Nations Programme on HIV/AIDS 19 (19) Special Representative of the Secretary-General on Violence against Children 1 203 158 1 045 United Nations High Commissioner for Refugees 1 438 385 54 United Nations Development Programme 3 655 79 223 64 318 18 560 United Nations Office for Project Services 431 334 97 United Nations Population Fund 429 716 1 093 52 World Food Programme 16 1 040 945 111 World Health Organization 6 652 50 082 8 331 48 403 Others 231 (7) 224 Common services activities with other organizations in the United
Nations system 354 2 294 2 288 360 Joint programmes with other organizations in the United Nations system 2 371 51 458 53 160 669
Subtotal 13 728 186 859 131 236 69 351
Net balance 304 628 1 985 800 1 852 185 438 242
Receivables 9 942 9 480
Gross balance 314 570 447 722
A/65/5/Add.2
10-45045 102
C. Notes to the financial statements
Note 1 Statement of the objectives and activities of the United Nations Children’s Fund
1. UNICEF is mandated by the United Nations General Assembly to advocate for the protection of children’s rights, to help meet their basic needs and to expand their opportunities to reach their full potential. The organization mobilizes political will and material resources to help countries, particularly developing countries, ensure a “first call for children” and build their capacity to form appropriate policies and deliver services for children and their families.
Note 2 Summary of significant accounting policies
United Nations Children’s Fund
Accounting convention
2. The financial statements are prepared in accordance with the Financial Regulations and Rules of UNICEF and the United Nations system accounting standards.
3. With the goal of achieving harmonization in the presentation of the accounts by agencies in the United Nations system, the financial statements are presented in line with the formats agreed upon by the United Nations System Chief Executives Board for Coordination.
Financial period
4. In accordance with the UNICEF Financial Regulations and Rules, the accounts are maintained on a biennial basis.
Unit of account
5. The accounting unit is the United States dollar. The equivalent in United States dollars of other currencies is established on the basis of the United Nations operational rate of exchange.
Translation of currencies
6. Assets and liabilities in currencies other than United States dollars are revalued for accounting purposes at the prevailing United Nations operational rates of exchange. Any variance due to fluctuation of those rates is accounted for as income or loss and shown in the statement of income and expenditure. In accordance with UNICEF Executive Board decision 1990/28, differences resulting from the payment of contributions pledged in currencies other than United States dollars are recorded against the contributions.
Income
7. Income consists of regular resources, other resources and funds for emergency relief and rehabilitation. Regular resources include funds from the voluntary annual contributions of Governments, intergovernmental agencies and non-governmental organizations, the income from the Private Fund-raising and Partnerships Division, non-earmarked funds contributed by the public and other income. Other resources

A/65/5/Add.2
103 10-45045
are funds contributed to UNICEF by Governments, intergovernmental organizations, non-governmental organizations and the United Nations system, for specific purposes within the programmes approved by the UNICEF Executive Board. Emergency relief and rehabilitation funds include those contributed for emergency operations.
8. Income is recorded on the basis of funds or pledges received for the current year. Funds received for future years for purposes specified by donors are considered deferred income and recorded as “contributions received in advance”.
9. Contributions income received from National Committees for UNICEF is accounted for on a cash basis, with the exception of contributions for other resources (regular and emergency resources), which may be recorded on the basis of a valid pledge from a National Committee. The validity of the pledge is determined by the existence of funds raised and a statement from the National Committee that it is committing funds to UNICEF in the form of a pledge.
10. The statement of income and expenditure does not include funds received and disbursements made from trust funds.
11. All other income received by UNICEF is credited as regular resources.
12. Contributions in kind are valued by management and reflect the cost UNICEF would normally pay for similar items.
13. Supported deliveries are not reflected in the financial accounts of UNICEF, although they are handled through the administrative structures of the organization.
Expenditure
14. All expenditures of UNICEF are accounted for on an accrual basis, except for certain expenditures relating to staff entitlements, which are accounted for on the basis of cash disbursements only.
Cash
15. All funds received are initially deposited into UNICEF bank accounts and reflected as cash holdings.
Provision for uncollectible contributions receivable
16. In line with the recommendations of the external auditors (A/51/5/Add.2, chap. II, para. 37 and A/63/5/Add.2 and Corr.1, chap. II, para. 31), UNICEF maintains a provision for potentially uncollectible contributions receivable.
Inventory
17. The inventory of programme supplies at the UNICEF Supply Division warehouses is shown at average cost. All costs associated with bringing the goods to the warehouse are considered as part of the average cost. Goods in transit to the warehouse are valued at actual cost.
Capital assets
18. Capital assets consist of office buildings and staff housing and are presented at their acquisition cost.
A/65/5/Add.2
10-45045 104
Unliquidated obligations
19. Cancellation of unliquidated obligations is recorded as a reduction of expenditure if the budgetary account is valid, or as savings on or cancellation of prior-period obligations if the budgetary account has expired.
Consolidation
20. The financial report and statements reflect the net operating income, assets and liabilities of the Private Fund-raising and Partnerships Division. Transactions between UNICEF and the Private Fund-raising and Partnerships Division are eliminated on consolidation.
After-service health insurance and other end-of-service liabilities
21. The liabilities for after-service health insurance, annual leave and repatriation benefits are disclosed in the notes to the financial statements. UNICEF engages the services of an independent, qualified actuary to carry out an actuarial valuation of the accrued liabilities for these end-of-service benefits.
Non-expendable property
22. Furniture, equipment and other non-expendable property are not included in the assets of the organization. Acquisitions are charged against budgetary accounts in the year of purchase.
Reclassifications
23. Certain amounts classified as miscellaneous income for the biennium ended 31 December 2007 have been reclassified to allow comparison with the same amounts for the biennium ended 31 December 2009.
24. In order to clarify the financial impact of currency exchange rates, for the biennium ended 31 December 2009, two separately reported activities, namely, “gains and losses on foreign exchange transactions” and “currency exchange adjustments”, were reported as a new activity, “net currency exchange adjustments and gains on foreign exchange”, under other income in the statement of income and expenditure. Prior to the biennium ended 31 December 2009, “gains and losses on foreign exchange transactions” were reported as miscellaneous income, and currency exchange adjustments were reported separately. The reclassification of amounts reported for the biennium ended 31 December 2007 resulted in a decrease in amounts reported as miscellaneous income and an increase in amounts reported as net currency exchange adjustments and gains on foreign exchange of $10.1 million.
25. For the biennium ended 31 December 2009, the cancellation of unliquidated obligations related to expired budgetary accounts is reported against the fund balance as “savings on or cancellation of prior-period obligations”. For the biennium ended 31 December 2007, these amounts were reported as miscellaneous income. This change resulted in a $19.5 million decrease in miscellaneous income and a $19.5 million increase in savings on or cancellations of prior-period obligations.

A/65/5/Add.2
105 10-45045
Private Fund-raising and Partnerships Division
Accounting convention
26. The Private Fund-raising and Partnerships Division accounts are maintained in accordance with the Financial Regulations and Rules of UNICEF and the Greeting Card Operation special supplement.
Unit of account
27. The accounting unit is the United States dollar. The equivalent in United States dollars of other currencies is established on the basis of the United Nations operational rates of exchange on the transaction date.
Translation of currencies
28. Assets and liabilities in currencies other than the United States dollar are valued for accounting purposes at the prevailing United Nations rates of exchange. Any variance in valuation caused by fluctuation of those rates is accounted for as a gain or loss and is included in the statement of income and expenditure under exchange rate adjustment.
Income
29. Gross proceeds from the sale of cards and gifts are recorded in local currency and accrued on the basis of the provisional sales reports received from the sales partners at year-end. They are converted into United States dollars at the United Nations operational rates of exchange prevailing on 31 December. The accrual is adjusted in the following year on the receipt of the final sales report. If the provisional sales report is not received from a sales partner by end-of-year closure, gross proceeds are accrued on deliveries to that sales partner for the year, less an allowance for unsold goods.
30. Income from private fund-raising activities and related expenses is recorded separately in the Private Fund-raising and Partnerships Division accounts. The net proceeds raised by National Committees from private fund-raising activities for regular resources are recorded on the basis of the provisional reports submitted. These are then adjusted in the following year upon receipt of the final reports. Net proceeds raised by field offices from private fund-raising activities are recorded upon receipt of funds.
Allowance for doubtful accounts receivable
31. In accordance with Private Fund-raising and Partnerships Division accounting policy, a provision to cover accounts receivable that are considered doubtful for collection may be established. This provision is shown as a deduction from accounts receivable on the statement of assets and liabilities.
Inventory
32. The inventory of work in process and finished goods is valued at standard cost, while raw materials are valued at moving average cost. It is the policy of the Private Fund-raising and Partnerships Division to write down unsold cards and dated gifts at the end of the first sales campaign year and all other gifts at the end of the second sales campaign year. Gifts that have been written down and carried forward are valued at their add-on cost. All publicity and promotional materials produced in the
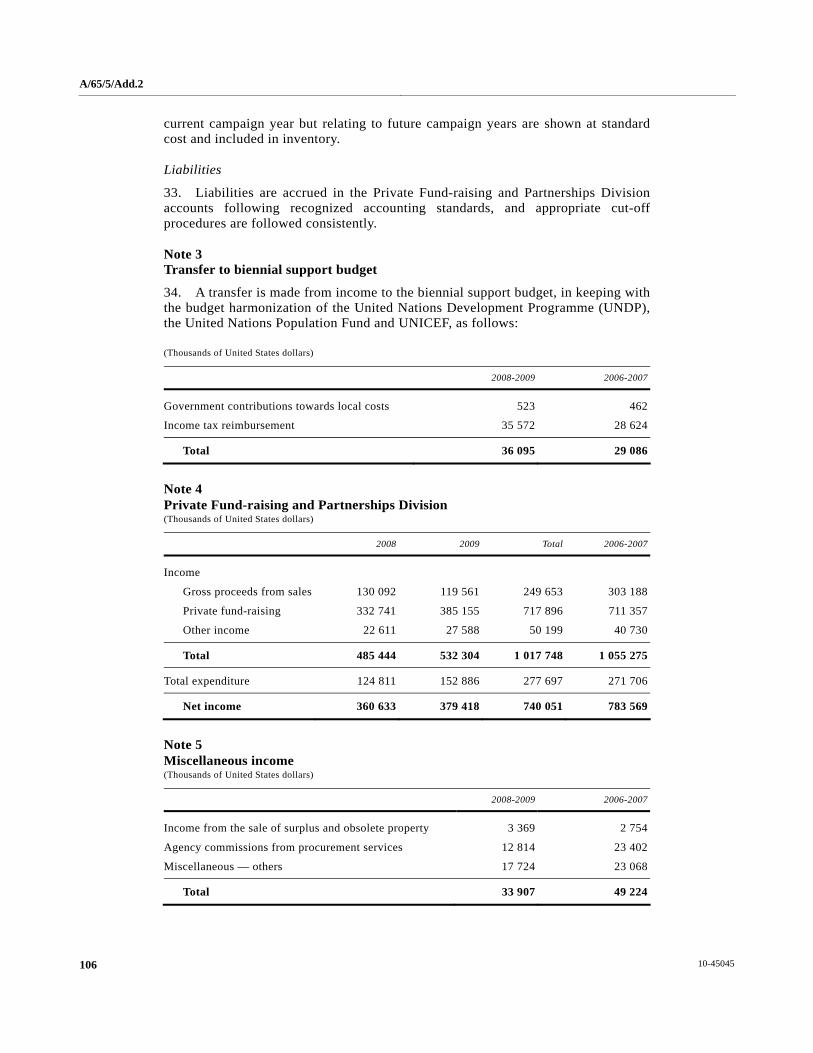
A/65/5/Add.2
10-45045 106
current campaign year but relating to future campaign years are shown at standard cost and included in inventory.
Liabilities
33. Liabilities are accrued in the Private Fund-raising and Partnerships Division accounts following recognized accounting standards, and appropriate cut-off procedures are followed consistently.
Note 3 Transfer to biennial support budget
34. A transfer is made from income to the biennial support budget, in keeping with the budget harmonization of the United Nations Development Programme (UNDP), the United Nations Population Fund and UNICEF, as follows:
(Thousands of United States dollars)
2008-2009 2006-2007
Government contributions towards local costs 523 462
Income tax reimbursement 35 572 28 624
Total 36 095 29 086
Note 4 Private Fund-raising and Partnerships Division (Thousands of United States dollars)
2008 2009 Total 2006-2007
Income
Gross proceeds from sales 130 092 119 561 249 653 303 188
Private fund-raising 332 741 385 155 717 896 711 357
Other income 22 611 27 588 50 199 40 730
Total 485 444 532 304 1 017 748 1 055 275
Total expenditure 124 811 152 886 277 697 271 706
Net income 360 633 379 418 740 051 783 569
Note 5 Miscellaneous income (Thousands of United States dollars)
2008-2009 2006-2007
Income from the sale of surplus and obsolete property 3 369 2 754
Agency commissions from procurement services 12 814 23 402
Miscellaneous — others 17 724 23 068
Total 33 907 49 224
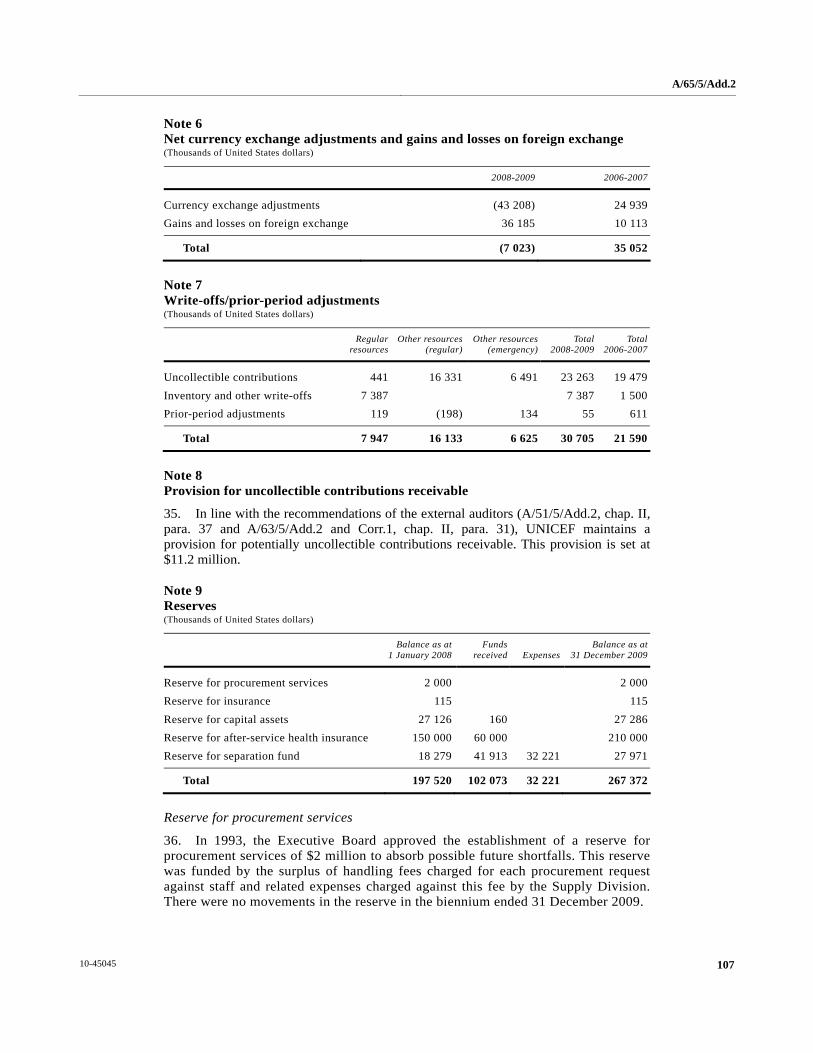
A/65/5/Add.2
107 10-45045
Note 6 Net currency exchange adjustments and gains and losses on foreign exchange (Thousands of United States dollars)
2008-2009 2006-2007
Currency exchange adjustments (43 208) 24 939 Gains and losses on foreign exchange 36 185 10 113
Total (7 023) 35 052
Note 7 Write-offs/prior-period adjustments (Thousands of United States dollars)
Regular
resourcesOther resources
(regular)Other resources
(emergency)Total
2008-2009 Total
2006-2007
Uncollectible contributions 441 16 331 6 491 23 263 19 479 Inventory and other write-offs 7 387 7 387 1 500 Prior-period adjustments 119 (198) 134 55 611
Total 7 947 16 133 6 625 30 705 21 590
Note 8 Provision for uncollectible contributions receivable
35. In line with the recommendations of the external auditors (A/51/5/Add.2, chap. II, para. 37 and A/63/5/Add.2 and Corr.1, chap. II, para. 31), UNICEF maintains a provision for potentially uncollectible contributions receivable. This provision is set at $11.2 million.
Note 9 Reserves (Thousands of United States dollars)
Balance as at
1 January 2008Funds
received ExpensesBalance as at
31 December 2009
Reserve for procurement services 2 000 2 000 Reserve for insurance 115 115 Reserve for capital assets 27 126 160 27 286 Reserve for after-service health insurance 150 000 60 000 210 000 Reserve for separation fund 18 279 41 913 32 221 27 971
Total 197 520 102 073 32 221 267 372
Reserve for procurement services
36. In 1993, the Executive Board approved the establishment of a reserve for procurement services of $2 million to absorb possible future shortfalls. This reserve was funded by the surplus of handling fees charged for each procurement request against staff and related expenses charged against this fee by the Supply Division. There were no movements in the reserve in the biennium ended 31 December 2009.

A/65/5/Add.2
10-45045 108
37. The income and expenditure relating to procurement services amounted to: (Thousands of United States dollars)
2008-2009 2006-2007
Funds received 38 684 44 261 Less: staff and related expenses (25 870) (20 859)
Transfer to miscellaneous income 12 814 23 402
Reserve for insurance
38. In 1950, the Executive Board approved the establishment of a reserve for insurance of $200,000 to absorb losses of UNICEF programme supplies and equipment not covered by commercial insurance. This amount was funded by approved freight allocations. In 1987, an additional $100,000 from regular resources was added to the reserve to self-insure for property losses. There were no movements in the reserve in the biennium ended 31 December 2009.
Reserve for capital assets
39. In 1990, the Executive Board approved the establishment of a capital asset reserve of $22 million from regular resources to better control future purchases of capital assets, mainly office buildings and staff housing in the field. The increase in the reserve during the biennium ended 31 December 2009 resulted from rental income on staff housing.
Reserve for after-service health insurance
40. In 2003, the Executive Board approved the establishment of a funded reserve for after-service health insurance and an initial allocation of $30 million from regular resources. The reserve was increased each year thereafter, bringing the balance to $210 million in the biennium ended 31 December 2009. Currently, disbursements for retirees are charged against the budget appropriations of the periods when actual payments are made.
Reserve for separation fund
41. In 2006, the Executive Board approved the establishment of a separation fund to cover separation and termination liabilities and an initial allocation of $10 million from regular resources. The fund is built up on an annual basis by the net of total contributions less payments made. There was an increase of $9.7 million in the reserve during the biennium ended 31 December 2009.
Note 10 Cash and term deposits (Thousands of United States dollars)
2009 2007
Term deposits 2 070 226 2 100 992 Cash (convertible) 57 101 116 130 Cash (non-convertible) 11 164 12 707
Total 2 138 491 2 229 829
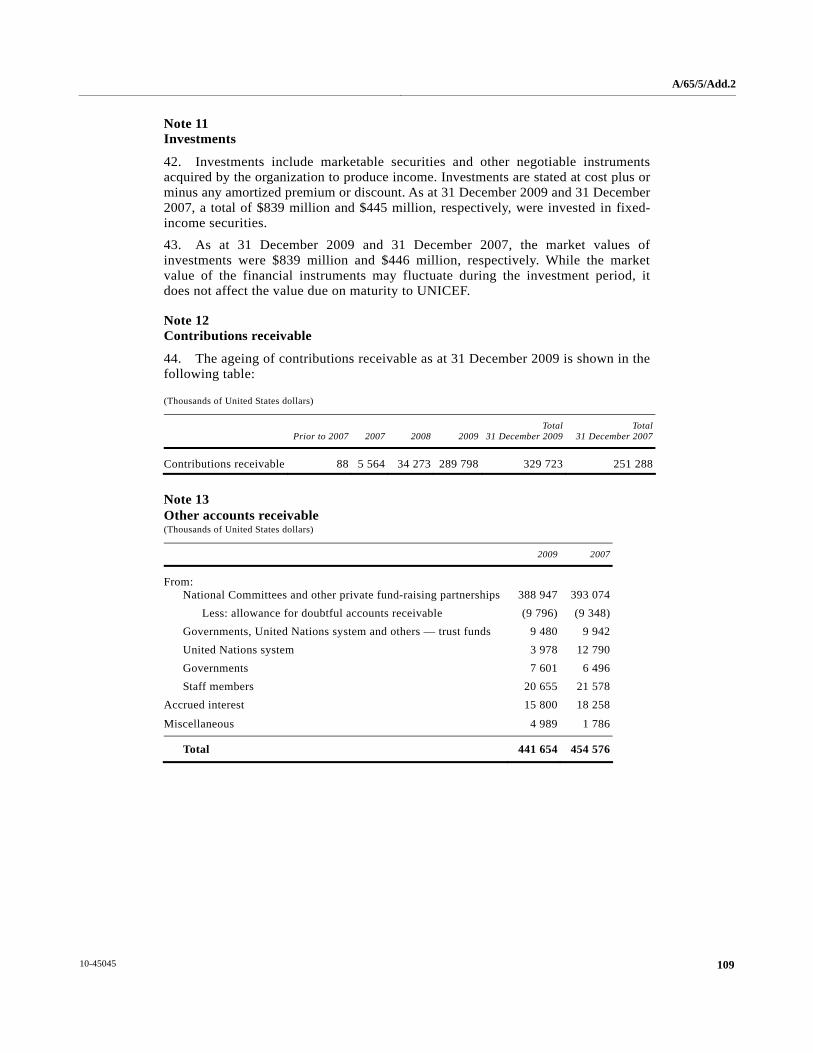
A/65/5/Add.2
109 10-45045
Note 11 Investments
42. Investments include marketable securities and other negotiable instruments acquired by the organization to produce income. Investments are stated at cost plus or minus any amortized premium or discount. As at 31 December 2009 and 31 December 2007, a total of $839 million and $445 million, respectively, were invested in fixed-income securities.
43. As at 31 December 2009 and 31 December 2007, the market values of investments were $839 million and $446 million, respectively. While the market value of the financial instruments may fluctuate during the investment period, it does not affect the value due on maturity to UNICEF.
Note 12 Contributions receivable
44. The ageing of contributions receivable as at 31 December 2009 is shown in the following table: (Thousands of United States dollars)
Prior to 2007 2007 2008 2009Total
31 December 2009Total
31 December 2007
Contributions receivable 88 5 564 34 273 289 798 329 723 251 288
Note 13 Other accounts receivable (Thousands of United States dollars)
2009 2007
From: National Committees and other private fund-raising partnerships 388 947 393 074 Less: allowance for doubtful accounts receivable (9 796) (9 348) Governments, United Nations system and others — trust funds 9 480 9 942 United Nations system 3 978 12 790 Governments 7 601 6 496 Staff members 20 655 21 578 Accrued interest 15 800 18 258
Miscellaneous 4 989 1 786
Total 441 654 454 576
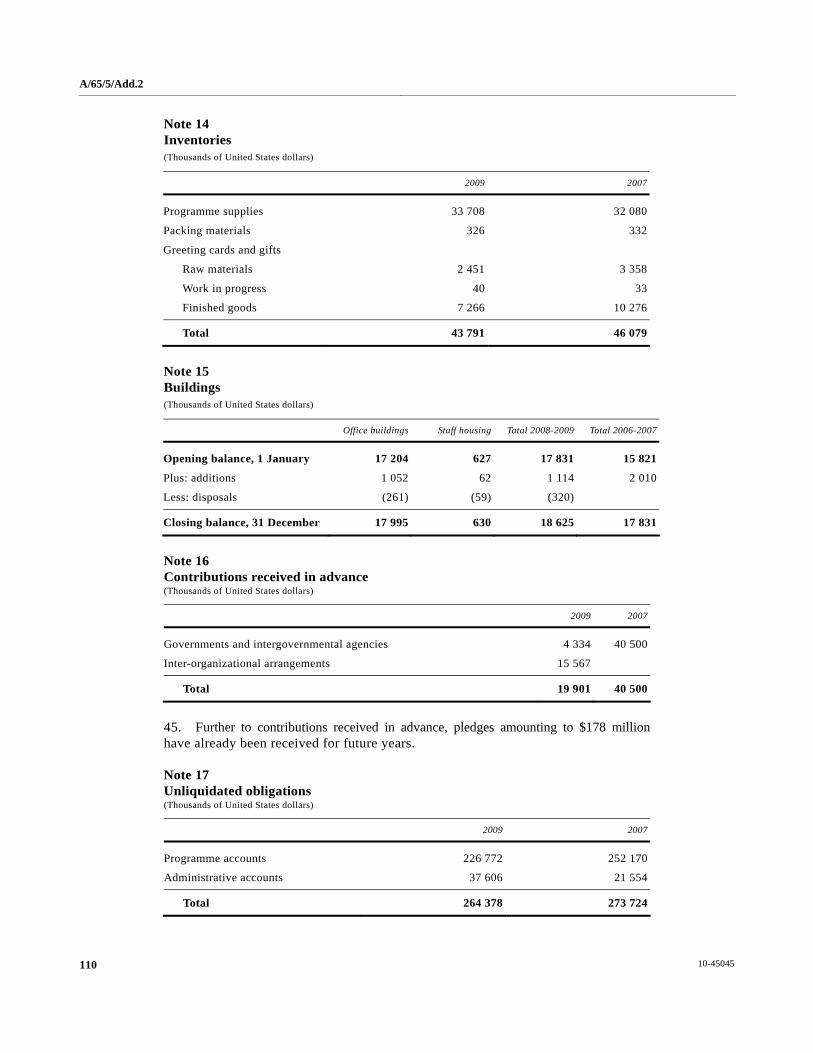
A/65/5/Add.2
10-45045 110
Note 14 Inventories (Thousands of United States dollars)
2009 2007
Programme supplies 33 708 32 080
Packing materials 326 332
Greeting cards and gifts
Raw materials 2 451 3 358
Work in progress 40 33
Finished goods 7 266 10 276
Total 43 791 46 079
Note 15 Buildings (Thousands of United States dollars)
Office buildings Staff housing Total 2008-2009 Total 2006-2007
Opening balance, 1 January 17 204 627 17 831 15 821
Plus: additions 1 052 62 1 114 2 010
Less: disposals (261) (59) (320)
Closing balance, 31 December 17 995 630 18 625 17 831
Note 16 Contributions received in advance (Thousands of United States dollars)
2009 2007
Governments and intergovernmental agencies 4 334 40 500
Inter-organizational arrangements 15 567
Total 19 901 40 500
45. Further to contributions received in advance, pledges amounting to $178 million have already been received for future years.
Note 17 Unliquidated obligations (Thousands of United States dollars)
2009 2007
Programme accounts 226 772 252 170
Administrative accounts 37 606 21 554
Total 264 378 273 724
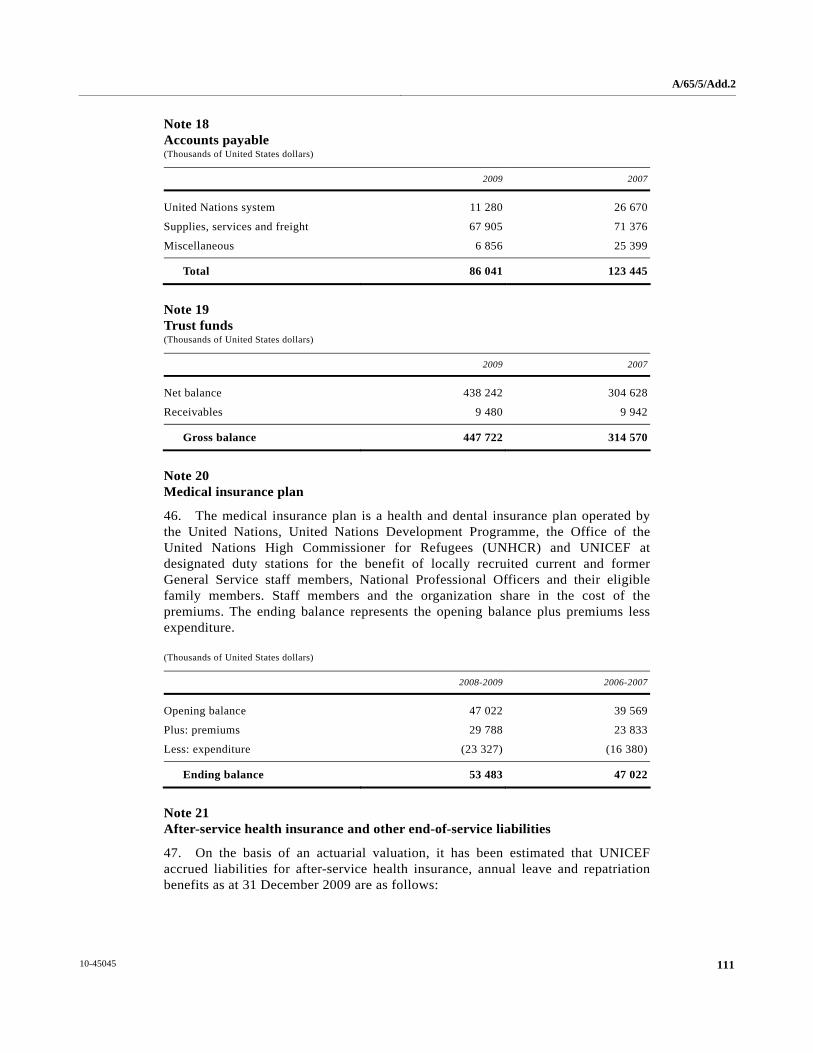
A/65/5/Add.2
111 10-45045
Note 18 Accounts payable (Thousands of United States dollars)
2009 2007
United Nations system 11 280 26 670
Supplies, services and freight 67 905 71 376
Miscellaneous 6 856 25 399
Total 86 041 123 445
Note 19 Trust funds (Thousands of United States dollars)
2009 2007
Net balance 438 242 304 628
Receivables 9 480 9 942
Gross balance 447 722 314 570
Note 20 Medical insurance plan
46. The medical insurance plan is a health and dental insurance plan operated by the United Nations, United Nations Development Programme, the Office of the United Nations High Commissioner for Refugees (UNHCR) and UNICEF at designated duty stations for the benefit of locally recruited current and former General Service staff members, National Professional Officers and their eligible family members. Staff members and the organization share in the cost of the premiums. The ending balance represents the opening balance plus premiums less expenditure.
(Thousands of United States dollars)
2008-2009 2006-2007
Opening balance 47 022 39 569
Plus: premiums 29 788 23 833
Less: expenditure (23 327) (16 380)
Ending balance 53 483 47 022
Note 21 After-service health insurance and other end-of-service liabilities
47. On the basis of an actuarial valuation, it has been estimated that UNICEF accrued liabilities for after-service health insurance, annual leave and repatriation benefits as at 31 December 2009 are as follows:
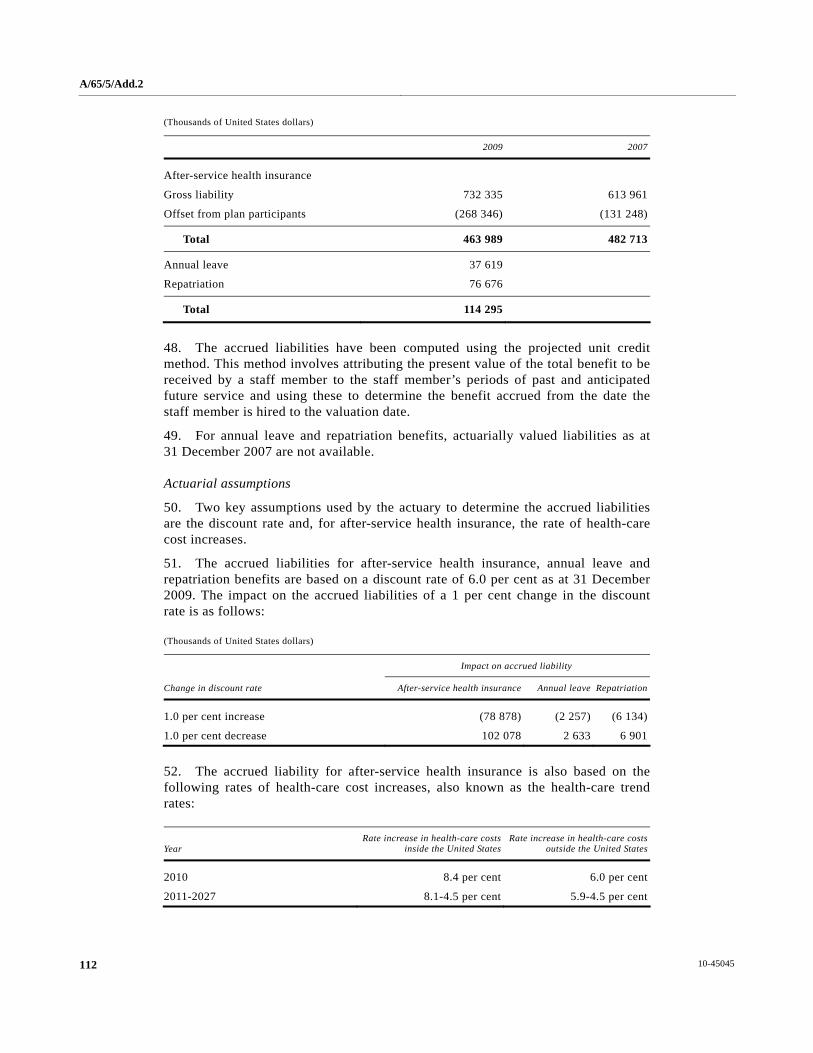
A/65/5/Add.2
10-45045 112
(Thousands of United States dollars)
2009 2007
After-service health insurance
Gross liability 732 335 613 961
Offset from plan participants (268 346) (131 248)
Total 463 989 482 713
Annual leave 37 619
Repatriation 76 676
Total 114 295
48. The accrued liabilities have been computed using the projected unit credit method. This method involves attributing the present value of the total benefit to be received by a staff member to the staff member’s periods of past and anticipated future service and using these to determine the benefit accrued from the date the staff member is hired to the valuation date.
49. For annual leave and repatriation benefits, actuarially valued liabilities as at 31 December 2007 are not available.
Actuarial assumptions
50. Two key assumptions used by the actuary to determine the accrued liabilities are the discount rate and, for after-service health insurance, the rate of health-care cost increases.
51. The accrued liabilities for after-service health insurance, annual leave and repatriation benefits are based on a discount rate of 6.0 per cent as at 31 December 2009. The impact on the accrued liabilities of a 1 per cent change in the discount rate is as follows:
(Thousands of United States dollars)
Impact on accrued liability
Change in discount rate After-service health insurance Annual leave Repatriation
1.0 per cent increase (78 878) (2 257) (6 134)
1.0 per cent decrease 102 078 2 633 6 901
52. The accrued liability for after-service health insurance is also based on the following rates of health-care cost increases, also known as the health-care trend rates:
Year Rate increase in health-care costs
inside the United StatesRate increase in health-care costs
outside the United States
2010 8.4 per cent 6.0 per cent
2011-2027 8.1-4.5 per cent 5.9-4.5 per cent

A/65/5/Add.2
113 10-45045
53. The impact on the accrued liability of a 1 per cent change in the health-care trend rates is as follows:
(Thousands of United States dollars)
Change in health-care trend rates Impact on accrued liability
1.0 per cent increase 97 224
1.0 per cent decrease (76 042)
54. As at 31 December 2007, the accrued liabilities for after-service health insurance, annual leave and repatriation benefits were based on a discount rate of 5.5 per cent and on the following rates of health-care cost increases:
Year Rate increase in health-care costs
inside the United StatesRate increase in health-care costs
outside the United States
2008 9.5 per cent 5.7 per cent
2009-2015 8.8-5.0 per cent 5.4-4.5 per cent
55. Another factor affecting the after-service health insurance valuation is the contributions made by plan participants. These contributions, identified above as “offset from the plan participants”, are deducted from the gross liability to determine the residual liability of UNICEF. Retirees and active staff members participate in the same health-care plans. Their collective contributions are offset against the total cost of providing health care in accordance with the cost-sharing ratios approved by the General Assembly. The actuarial valuation as at 31 December 2007 was based on the determination that only contributions from retirees should be included in the offset. The actuarial valuation as at 31 December 2009 is based on the refined determination that contributions from retirees and a portion of the contributions from active staff should be included in the offset.
56. The actuarial valuation for after-service health insurance as at 31 December 2009 includes actuarial gains of $113 million resulting from changes in the major assumptions used by the actuary since the previous valuation.
Census data
57. The actuarial valuations were based on census data collected prior to 31 December 2009. Census data as at 31 December 2009 became available subsequent to the completion of the financial statements. The estimate of UNICEF accrued liabilities might have increased by 3 per cent, or $17 million, had this data been used in the actuarial valuation.
Other
58. Previous to the biennium ended 31 December 2009, the liabilities disclosed for repatriation and annual leave were based on current costs at the reporting date without discounting or other adjustments. The change in accounting policy to an actuarial basis for measuring the liabilities and to the inclusion of travel and shipment within repatriation has not been applied retroactively, owing to the impracticality of undertaking an actuarial valuation as at 31 December 2007. Had
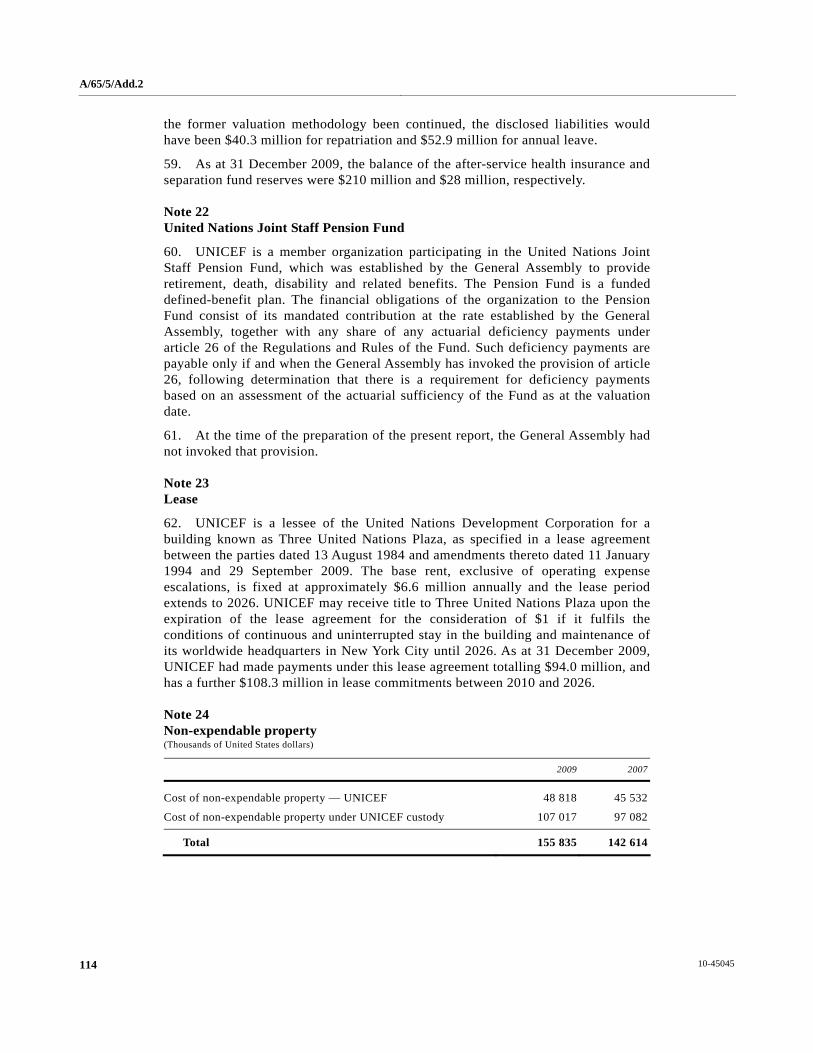
A/65/5/Add.2
10-45045 114
the former valuation methodology been continued, the disclosed liabilities would have been $40.3 million for repatriation and $52.9 million for annual leave.
59. As at 31 December 2009, the balance of the after-service health insurance and separation fund reserves were $210 million and $28 million, respectively.
Note 22 United Nations Joint Staff Pension Fund
60. UNICEF is a member organization participating in the United Nations Joint Staff Pension Fund, which was established by the General Assembly to provide retirement, death, disability and related benefits. The Pension Fund is a funded defined-benefit plan. The financial obligations of the organization to the Pension Fund consist of its mandated contribution at the rate established by the General Assembly, together with any share of any actuarial deficiency payments under article 26 of the Regulations and Rules of the Fund. Such deficiency payments are payable only if and when the General Assembly has invoked the provision of article 26, following determination that there is a requirement for deficiency payments based on an assessment of the actuarial sufficiency of the Fund as at the valuation date.
61. At the time of the preparation of the present report, the General Assembly had not invoked that provision.
Note 23 Lease
62. UNICEF is a lessee of the United Nations Development Corporation for a building known as Three United Nations Plaza, as specified in a lease agreement between the parties dated 13 August 1984 and amendments thereto dated 11 January 1994 and 29 September 2009. The base rent, exclusive of operating expense escalations, is fixed at approximately $6.6 million annually and the lease period extends to 2026. UNICEF may receive title to Three United Nations Plaza upon the expiration of the lease agreement for the consideration of $1 if it fulfils the conditions of continuous and uninterrupted stay in the building and maintenance of its worldwide headquarters in New York City until 2026. As at 31 December 2009, UNICEF had made payments under this lease agreement totalling $94.0 million, and has a further $108.3 million in lease commitments between 2010 and 2026.
Note 24 Non-expendable property (Thousands of United States dollars)
2009 2007
Cost of non-expendable property — UNICEF 48 818 45 532
Cost of non-expendable property under UNICEF custody 107 017 97 082
Total 155 835 142 614

A/65/5/Add.2
115 10-45045
Note 25 Liquidity
63. The UNICEF liquidity requirement recommends a minimum year-end balance of regular resources convertible cash equal to 10 per cent of projected regular resources income for the following year.
64. The financial plan for 2009 recommended a minimum regular resources convertible cash balance of $98 million.
65. For the purpose of meeting this requirement, UNICEF cash holdings and investments, excluding trust funds, are estimated to be split between regular resources and other resources as follows:
(Thousands of United States dollars)
Regular resources Other resources
Term deposits, cash (convertible) and investments 822 742 1 695 815
Cash (non-convertible) 11 164
Total 833 906 1 695 815
66. UNICEF met its internal liquidity requirement for the year 2009.
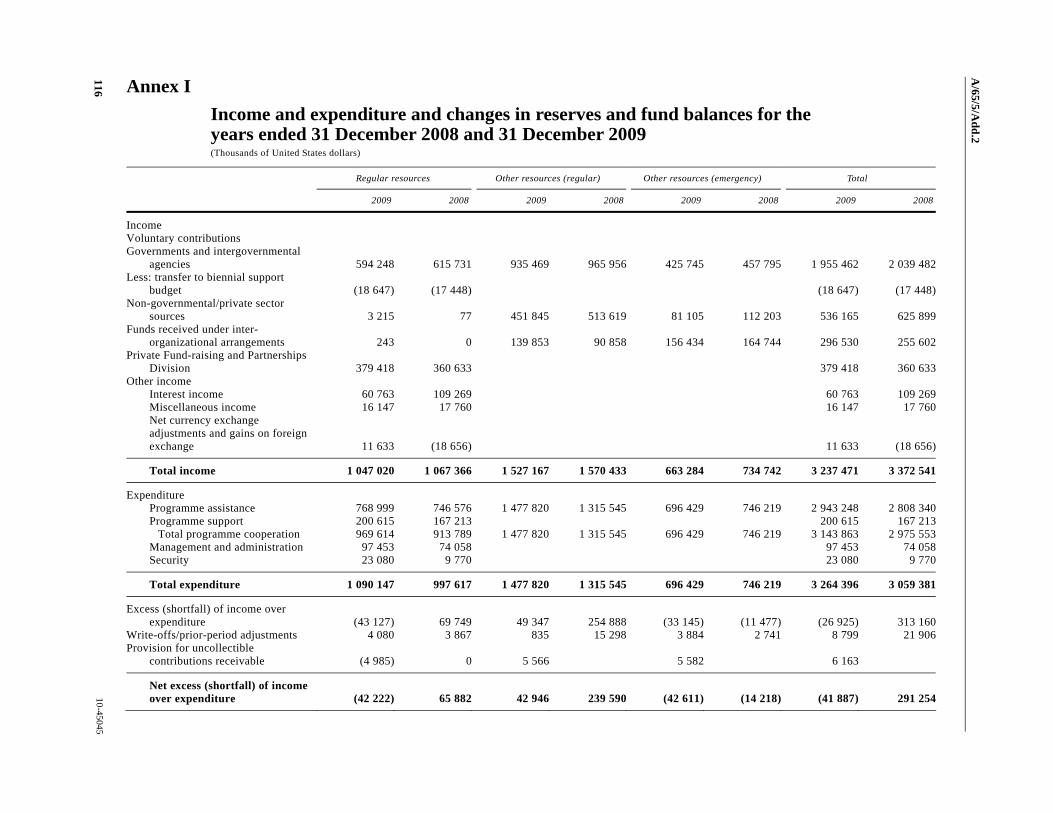
A/65/5/A
dd.2
116 10-45045
Annex I
Income and expenditure and changes in reserves and fund balances for the years ended 31 December 2008 and 31 December 2009 (Thousands of United States dollars)
Regular resources Other resources (regular) Other resources (emergency) Total
2009 2008 2009 2008 2009 2008 2009 2008
Income Voluntary contributions Governments and intergovernmental
agencies 594 248 615 731 935 469 965 956 425 745 457 795 1 955 462 2 039 482Less: transfer to biennial support
budget (18 647) (17 448) (18 647) (17 448)Non-governmental/private sector
sources 3 215 77 451 845 513 619 81 105 112 203 536 165 625 899Funds received under inter-
organizational arrangements 243 0 139 853 90 858 156 434 164 744 296 530 255 602Private Fund-raising and Partnerships
Division 379 418 360 633 379 418 360 633Other income Interest income 60 763 109 269 60 763 109 269 Miscellaneous income 16 147 17 760 16 147 17 760 Net currency exchange
adjustments and gains on foreign exchange 11 633 (18 656) 11 633 (18 656)
Total income 1 047 020 1 067 366 1 527 167 1 570 433 663 284 734 742 3 237 471 3 372 541
Expenditure Programme assistance 768 999 746 576 1 477 820 1 315 545 696 429 746 219 2 943 248 2 808 340 Programme support 200 615 167 213 200 615 167 213 Total programme cooperation 969 614 913 789 1 477 820 1 315 545 696 429 746 219 3 143 863 2 975 553 Management and administration 97 453 74 058 97 453 74 058 Security 23 080 9 770 23 080 9 770
Total expenditure 1 090 147 997 617 1 477 820 1 315 545 696 429 746 219 3 264 396 3 059 381
Excess (shortfall) of income over expenditure (43 127) 69 749 49 347 254 888 (33 145) (11 477) (26 925) 313 160
Write-offs/prior-period adjustments 4 080 3 867 835 15 298 3 884 2 741 8 799 21 906Provision for uncollectible
contributions receivable (4 985) 0 5 566 5 582 6 163
Net excess (shortfall) of income over expenditure (42 222) 65 882 42 946 239 590 (42 611) (14 218) (41 887) 291 254

A/65/5/A
dd.2
10-45045 117
Regular resources Other resources (regular) Other resources (emergency) Total
2009 2008 2009 2008 2009 2008 2009 2008
Fund balances, 1 January 893 718 833 332 1 388 669 1 149 079 446 193 460 411 2 728 580 2 442 822Savings on or cancellations of prior-
period obligations 4 483 24 504 4 483 24 504Transfer to reserve for after-service
health insurance (30 000) (30 000) (30 000) (30 000)Reserve balances, 1 January 228 039 197 520 228 039 197 520Increase in reserves 39 333 30 519 39 333 30 519
Reserves and fund balances, 31 December 1 093 351 1 121 757 1 431 615 1 388 669 403 582 446 193 2 928 548 2 956 619

A/65/5/Add.2
10-45045 118
Annex II
Glossary
accounts, audited. The financial statements of the organization for a specified period or at a specified date, audited by the external auditors (United Nations Board of Auditors).
accrual basis of accounting. The accrual basis of accounting for income in each financial period means that income is recognized when it is due and not when it is received. Accrual of expenditures in each financial period means that costs are recognized when obligations arise or liabilities are incurred and not when payments are made.
asset. An asset is a resource owned by or due to the organization as a result of past events.
budget. A plan in financial terms for carrying out proposed activities in a specified time.
budget appropriation. The total appropriation of funds approved by the Executive Board for UNICEF programme support, management and administration costs and programme assistance against which obligations may be incurred for those purposes up to the amount so approved.
cash holdings. The aggregation of all the funds of the organization, including coins, banknotes, cheques, balances in current and call accounts, savings accounts and interest-bearing deposits.
cash in current bank accounts. The aggregate of money maintained in UNICEF bank accounts, as reflected in the UNICEF books of account, to sustain operational requirements.
cash in interest-bearing deposits. Funds temporarily available over those needed for immediate requirements, held in short-term, interest-bearing deposits and ready to be drawn down when needed.
cash-on-hand (also called “petty cash”). Cash kept on hand by authorized officers as a convenience for making small payments on behalf of the organization.
cash, non-convertible. Currencies the use of which (mainly in respect of transferability and convertibility) is limited because of foreign exchange regulations or a donor’s wish. When those limitations do not exist, UNICEF considers the currencies as “unrestricted” because they are fully convertible.
contributions, voluntary. Contributions to UNICEF that are offered and accepted without reference to a scale of assessments determined by any United Nations legislative body.
contributions receivable. Contributions pledged to UNICEF but not received until a future time.
earmark. To give expression to a restriction imposed by agreement or by administrative action on the use of an account or an equivalent amount of assets.
expenditure. The sum of disbursements and valid unliquidated obligations made against the appropriation/allocation for the period.
A/65/5/Add.2
119 10-45045
financial period. The operating period of the organization covered by the financial statements is a biennium.
financial regulations. Until 31 December 1987, the UNICEF accounts were maintained in accordance with the Financial Regulations and Rules of the United Nations, with such modifications as required by the nature of UNICEF work. Since 1 January 1988, the UNICEF accounts have been maintained in accordance with the UNICEF Financial Regulations and Rules. In 2012, the UNICEF Financial Regulations and Rules will be updated to ensure consistency with the International Public Sector Accounting Standards (IPSAS).
fund balance. Fund balances and reserves represent the difference between the assets and the liabilities of the organization. They consist of funds available for the implementation of programmes funded by regular resources and other resources as well as funds available for the acquisition of capital assets and set aside for procurement service shortfalls, losses not covered by commercial insurance, after-service health insurance and separation costs.
income. Money or money equivalent received or accrued during the financial period which increases existing net assets. UNICEF income is recorded on the basis of funds or pledges received for the current year.
income, deferred. Funds received or pledges recorded as receivable, attributable to future financial periods and, therefore, not credited to the income account of the period reported on.
income, regular resources. Non-earmarked income, which includes funds from voluntary annual contributions of Governments, the net income from the Private Fund-raising and Partnerships Division, funds contributed by the public and certain “other (or miscellaneous) income”.
income, other. Also referred to as “miscellaneous income” for regular resources. Miscellaneous income is income other than the value of the voluntary contributions and the net income of the Private Fund-raising and Partnerships Division.
income, other resources (regular). Specific contributions for programmes approved by the UNICEF Executive Board, in addition to regular resources, which then become part of UNICEF programmes. They consist of funds contributed to UNICEF by Governments, non-governmental organizations and United Nations agencies for specific purposes.
income, other resources (emergency). Consists of funds contributed to UNICEF by Governments, non-governmental organizations and United Nations agencies for emergency appeals.
inventory. Supplies and equipment for programmes held by the Supply Division, as well as raw materials held by the Private Fund-raising and Partnerships Division at the end of an accounting or financial period.
liability. A present obligation of the organization arising from past events, the settlement of which is expected to result in an outflow of resources from the organization.
liquidity policy. Owing to the nature of programme implementation and UNICEF cash flows, there may be, from time to time, short-term imbalances between regular resources cash disbursements and cash receipts. The UNICEF liquidity policy
A/65/5/Add.2
10-45045 120
allows these temporary imbalances to be offset by up to one half of the balance of other resources (regular), other resources (emergency) and supplementary cash on hand. These imbalances must be settled by year-end.
liquidity requirement. In order to meet UNICEF liquidity requirements, regular resources convertible cash balances, at the end of each fiscal year, are required to equal 10 per cent of projected regular resources income for the next fiscal year.
local currency. The currency of the country or area in which the local financial records of an activity are kept and/or in which its local financial transactions take place.
non-expendable property. Items of property and equipment with an individual unit cost of at least $1,500.
obligation. Obligations are amounts of orders placed, contracts awarded, services received and other transactions that involve a charge against the resources of the current financial period. Obligations may be maintained either for that period or until liquidated or cancelled.
pledge. A written commitment by a prospective donor to make a voluntary contribution to UNICEF and which may be subject to the need to secure an appropriate national legislative approval is considered a pledge.
procurement services. UNICEF assists Governments, United Nations agencies and non-governmental organizations working in fields of benefit to children by undertaking, on request and on a reimbursable basis, the procurement of goods and services. UNICEF adds a small handling charge to the cost of the supplies and services to cover the costs of extra administration and documentation (see trust funds).
rates of exchange. The UNICEF accounts are maintained in United States dollars. Transactions in other currencies are converted for recording into United States dollars, in principle, at the United Nations operational rates of exchange.
schedule. Explanatory or supporting analyses accompanying financial statements.
trust funds. Funds accepted by UNICEF mainly to cover the costs of procurement of supplies and services undertaken by UNICEF on behalf of others. They also include financing provided by sponsors to cover the costs of Junior Professional Officers as well as those relating to projects funded by the World Bank and the Global Alliance for Vaccines and Immunization. These funds are not considered to be UNICEF income.
write-off. An adjustment to the accounts in order to record the loss of or reduction in the value of an asset.
10-45045 (E) 130810 *1045045*