united nations centre for regional … nations centre for regional development in collaboration with...
TRANSCRIPT
Discussion paper issued without formal editing
FOR PARTICIPANTS ONLY
19 November 2014 ENGLISH ONLY
UNITED NATIONS CENTRE FOR REGIONAL DEVELOPMENT In collaboration with Ministry of Environment and Renewable Energy (MERE), Government of Sri Lanka Ministry of Transport (MOT), Government of Sri Lanka Ministry of the Environment, Government of Japan, and Clean Air Asia (CAA)
EIGHTH REGIONAL ENVIRONMENTALLY SUSTAINABLE TRANSPORT (EST) FORUM IN ASIA,
19-21 NOVEMBER, 2014, COLOMBO, SRI LANKA
Impact of Road Traffic Crashes in Asia: A Human and Economic Assessment
(Background Paper for Plenary Session 4 of the Provisional Programme)
Final Draft ------------------------------------- This background paper has been prepared by Prof. Dinesh Mohan, for the Eighth Regional EST Forum in Asia. The views expressed herein are those of the author only and do not necessarily reflect the views of the United Nations.

Dinesh Mohan Impact of Road traffic Crashes
2
IMPACT OF ROAD TRAFFIC CRASHES IN ASIA: A HUMAN AND
ECONOMIC ASSESSMENT
Dinesh MOHAN Professor Emeritus
Transportation Research and Injury Prevention Programme Indian Institute of Technology Delhi
E-mail: [email protected] Abstract: The traffic patterns, modal shares and accident patterns in low and middle-income countries differ significantly from those obtaining in high-income countries. Since road safety research and development has not had a high priority in India and many other Asian countries, we have not been particularly successful in arresting the growth in fatalities and injuries due to road traffic crashes. Estimates of social and economic losses due road traffic crashes have been grossly estimated in all past studies. Studies need to be done with greater scientific rigour to set the record straight. According to our estimates road traffic crashes may be contributing losses of 2-4 per cent of the annual GDP and environmental degradation similar amounts. Therefore, we conclude that: (1) If costs of accidents and environmental degradation are included in calculating feasibility of road projects then, we may arrive at different policy options than those considered at present; (2) The costs of road accidents have to be internalised at the planning stage itself. Once this is done, it will become obvious that much more attention needs to be given to the design of safer roads and highways and that the investment required can be justified on economic grounds; (3) National Governments must establish an independent agency for road safety staffed by professionals; (4) All road projects must be subjected to road safety audits and environmental impact assessments with special reference to the vulnerable road users. (5) A special effort must be made to train a large number of professionals in the scientific approach to road safety. Key Words: Traffic safety, Asia, India, Economic Impact
INTRODUCTION
The World Health Organization (W.H.O.) released its World Report On Road Traffic Injury Prevention in 2004 (Peden, M. et al., 2004). This report focused on road traffic injuries (RTI) and fatalities as a worldwide health problem and included a summary of the known risk factors associated with road traffic crashes and possible countermeasures that should be put in place to control the problem. It also pointed out that “Without new or improved interventions, road traffic injuries will be the third leading cause of death by the year 2020”. The publication of this report spurred some national and international agencies and civil society groups to give a little more attention to the problem of road safety and a number of resolutions have been passed by the United Nations General Assembly, World Health Assembly and the Executive Board of the W.H.O. (W.H.O., 2009b). As a follow up, the Russian Federation to hosted the First Global Ministerial Conference on Road Safety on 19-20 November 2009. Before this conference the WHO released a Global Status Report On Road Safety: Time For Action in July 2009 (W.H.O., 2009a), and followed up with Global Status Report On Road Safety 2013: Supporting a Decade of Action (W.H.O., 2013) (GSRRS13). These reports give a broad assessment of the status of road safety in ~178 countries. The data were obtained from
Dinesh Mohan Impact of Road traffic Crashes
3
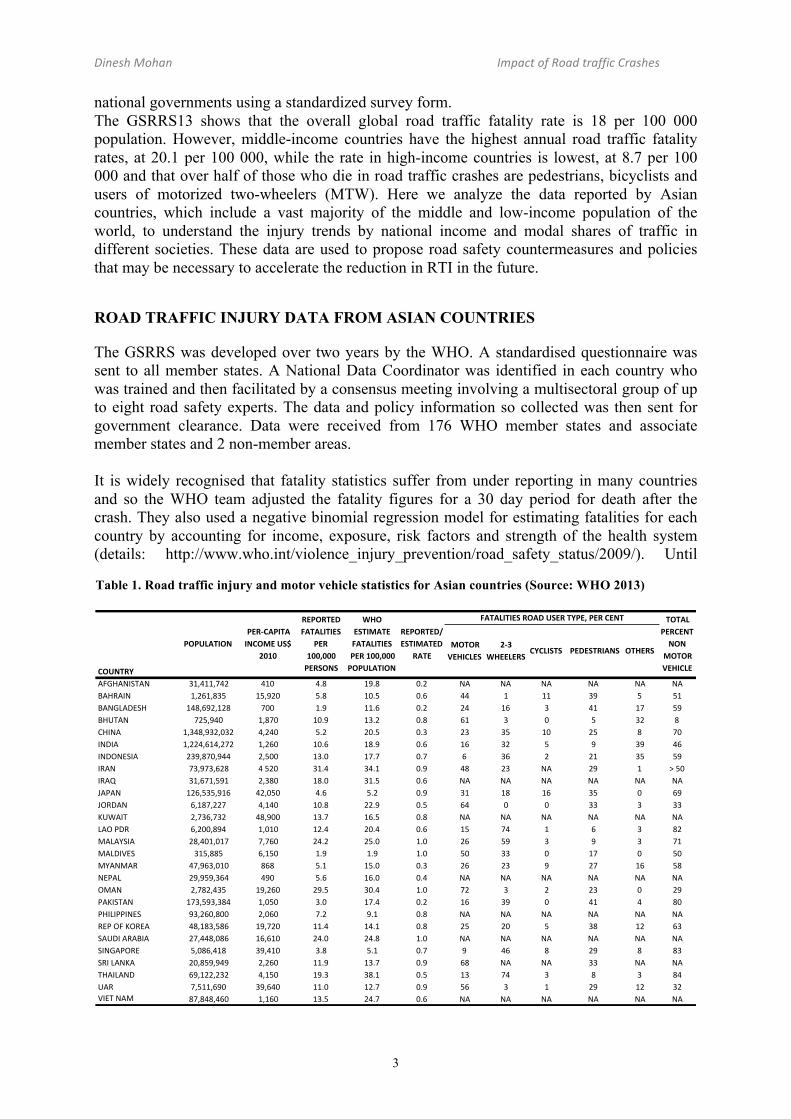
national governments using a standardized survey form. The GSRRS13 shows that the overall global road traffic fatality rate is 18 per 100 000 population. However, middle-income countries have the highest annual road traffic fatality rates, at 20.1 per 100 000, while the rate in high-income countries is lowest, at 8.7 per 100 000 and that over half of those who die in road traffic crashes are pedestrians, bicyclists and users of motorized two-wheelers (MTW). Here we analyze the data reported by Asian countries, which include a vast majority of the middle and low-income population of the world, to understand the injury trends by national income and modal shares of traffic in different societies. These data are used to propose road safety countermeasures and policies that may be necessary to accelerate the reduction in RTI in the future.
ROAD TRAFFIC INJURY DATA FROM ASIAN COUNTRIES
The GSRRS was developed over two years by the WHO. A standardised questionnaire was sent to all member states. A National Data Coordinator was identified in each country who was trained and then facilitated by a consensus meeting involving a multisectoral group of up to eight road safety experts. The data and policy information so collected was then sent for government clearance. Data were received from 176 WHO member states and associate member states and 2 non-member areas. It is widely recognised that fatality statistics suffer from under reporting in many countries and so the WHO team adjusted the fatality figures for a 30 day period for death after the crash. They also used a negative binomial regression model for estimating fatalities for each country by accounting for income, exposure, risk factors and strength of the health system (details: http://www.who.int/violence_injury_prevention/road_safety_status/2009/). Until
Table 1. Road traffic injury and motor vehicle statistics for Asian countries (Source: WHO 2013)
MOTOR%VEHICLES
2.3%WHEELERS
CYCLISTS% %PEDESTRIANS OTHERS
AFGHANISTAN 31,411,742 410 4.8 19.8 0.2 NA NA NA NA NA NABAHRAIN 1,261,835 15,920 5.8 10.5 0.6 44 1 11 39 5 51BANGLADESH 148,692,128 700 1.9 11.6 0.2 24 16 3 41 17 59BHUTAN 725,940 1,870 10.9 13.2 0.8 61 3 0 5 32 8CHINA 1,348,932,032 4,240 5.2 20.5 0.3 23 35 10 25 8 70INDIA 1,224,614,272 1,260 10.6 18.9 0.6 16 32 5 9 39 46INDONESIA 239,870,944 2,500 13.0 17.7 0.7 6 36 2 21 35 59IRAN 73,973,628 4=520 31.4 34.1 0.9 48 23 NA 29 1 >=50IRAQ 31,671,591 2,380 18.0 31.5 0.6 NA NA NA NA NA NAJAPAN 126,535,916 42,050 4.6 5.2 0.9 31 18 16 35 0 69JORDAN 6,187,227 4,140 10.8 22.9 0.5 64 0 0 33 3 33KUWAIT 2,736,732 48,900 13.7 16.5 0.8 NA NA NA NA NA NALAO=PDR 6,200,894 1,010 12.4 20.4 0.6 15 74 1 6 3 82MALAYSIA 28,401,017 7,760 24.2 25.0 1.0 26 59 3 9 3 71MALDIVES 315,885 6,150 1.9 1.9 1.0 50 33 0 17 0 50MYANMAR 47,963,010 868 5.1 15.0 0.3 26 23 9 27 16 58NEPAL 29,959,364 490 5.6 16.0 0.4 NA NA NA NA NA NAOMAN 2,782,435 19,260 29.5 30.4 1.0 72 3 2 23 0 29PAKISTAN 173,593,384 1,050 3.0 17.4 0.2 16 39 0 41 4 80PHILIPPINES 93,260,800 2,060 7.2 9.1 0.8 NA NA NA NA NA NAREP=OF=KOREA 48,183,586 19,720 11.4 14.1 0.8 25 20 5 38 12 63SAUDI=ARABIA 27,448,086 16,610 24.0 24.8 1.0 NA NA NA NA NA NASINGAPORE 5,086,418 39,410 3.8 5.1 0.7 9 46 8 29 8 83SRI=LANKA 20,859,949 2,260 11.9 13.7 0.9 68 NA NA 33 NA NATHAILAND 69,122,232 4,150 19.3 38.1 0.5 13 74 3 8 3 84UAR 7,511,690 39,640 11.0 12.7 0.9 56 3 1 29 12 32VIET=NAM 87,848,460 1,160 13.5 24.7 0.6 NA NA NA NA NA NA
REPORTED/%ESTIMATED%
RATE
FATALITIES%ROAD%USER%TYPE,%PER%CENT TOTAL%PERCENT%NON%
MOTOR%VEHICLE
POPULATION
COUNTRY
PER.CAPITA%INCOME%US$
2010
REPORTED%FATALITIES%
PER100,000%PERSONS
WHO%ESTIMATE%FATALITIES%PER%100,000%POPULATION

Dinesh Mohan Impact of Road traffic Crashes
4
recently it was not possible to compare RTI trends across countries in Asia as a majority of them do not use similar definitions and have varied degree of under-reporting. The GSRRS has used a scientific approach to estimate the number of RTI fatalities and this makes it possible for us to do some comparisons. In this paper we report how the understanding of RTI changes if we analyse the GSRRS estimates and compare them with self reported statistics from different countries. A summary of the data reported for 27 Asian countries is given in Table 1. These data show that 8 countries (30%) were not able to supply data on the proportion of different types of road users killed in crashes. Though a majority of the countries provided details, the reliability of data can only be judged by persons who are aware of the procedures used in their country for collection of data. We give an example of the problems by examining the data submitted by India. Data from India for fatalities by different road user type in the GSRRS13 and from detailed studies from India are given in Table 2. The data included in GSRRS13 indicate that the proportion of 4-wheeler occupants killed in India is greater than that of pedestrians or bicyclists and the unknown proportion is 17%. The in-depth studies conducted in India show a much higher proportion of vulnerable road users killed in cities and highways (Mohan, D. et al., 2013, Tiwari, G. et al., 2000). This difference is explained by the fact that the data submitted for India is partly based on official national statistics reported for “fatalities by vehicle type” (NCRB, 2012). In this table the “vehicle type” is probably recorded as one which was thought to be at “fault” and not the one in which the victim was travelling. This is the reason that bicyclists and pedestrians are reported to have low proportions in India in the WHO report. This analysis for India illustrates the problems in collecting reliable traffic injury data from around the world. Figure 1 shows the country reported and WHO estimates for RTI fatality rates per 100,000 persons plotted against national per-capita income. Only 8 (30%) of the countries have reported fatality rates close to the WHO estimates. The WHO status report uses negative binomial regression model for estimating fatalities for each country by accounting for income, exposure, risk factors and strength of the health system, and the report also gives 90% confidence intervals for fatality estimates. For some countries the lower end of the estimate
Table 2. Proportion of road traffic fatalities in India by road user type as reported in the WHO Global Status Report on Road Safety 2013 and in-depth studies conducted at different locations in India.
!Cars!&!heavy!vehicles
Motorised!2/3!
wheelersBicyclists Pedestrians Other
(a)!As!reported!for!India!in!WHO!Global!Status!Report!on!Road!Safety!2013
37 32 5 9 17
(b)!Data!from!InKdepth!studies!form!IndiaDelhi* 9 37 6 46 2Vadodara* 9 29 8 54 0Agra* 11 39 9 41 0Highways+ 32 24 11 32 1
Fatalities!by!type!of!road!user,!per!cent
*,Mohan,,D.,et,al.,,2013,,,+,,Tiwari,,G.,et,al.,,2000

Dinesh Mohan Impact of Road traffic Crashes
5
may be more realistic than the point estimate. For example, the WHO estimate for India is 78% greater than the reported fatality rate, however, studies from India suggest the reported rate may underestimate the actual number by around 10%-20% and not 78% (Mohan, D. et al., 2009). It is widely recognised that the official estimates for road traffic fatalities are underestimates (Jacobs, G. et al., 2000). The WHO estimates give a more scientific estimate for these numbers, and the if we take 20% as the estimate for under-reporting in India, then the Indian statistic comes close to the lower limit (90% confidence) of the WHO estimate. The important point to note is that such a large number of countries may be under-reporting even though the WHO estimate may not be absolutely accurate. Only 4 out of 27 countries report fatality rates within 10% of the WHO estimate (Reported/Estimated rate ratio in Table 1). While more high-income countries seem to have reported rates close to WHO estimates than low-income countries, it is interesting that both low-income and high-income countries can have under reporting and realistic reporting. For example, a high-income region like Kuwait (KW) and Republic of Korea (KR) seem to have underreporting according to the WHO estimate, but low and middle-income countries like Sri Lanka (LK) and Malaysia (MY) report fatality rates close to the WHO estimate. Even if the estimates do not reflect the reality accurately, they do reflect the extent of under-reporting. However, it appears that is not necessary to have high-income levels to develop reliable RTI reporting systems as commonly assumed. Figure 1 also shows that national RTI fatality rates per 100,000 persons as reported by countries nor WHO estimates have a high correlation with national per capita income in Asia. The WHO estimates seem to have a lower correlation with income than the rates reported by
Figure 1. Road traffic fatality rates for Asian countries vs. national per capita income (Source: W.H.O. 2013).
MV#
SG# JP#
PH#BH#BD#
UA#BT# LK#KR#MM#
NP# KW#PK# ID#IN#
AF#LA# CN#
VN# SA#MY#
OM#IQ#IR#
TH#
MV# SG#JP#
PH#BH#
BD#
UA#BT#LK# KR#
MM#NP##
KW#
PK#
ID#
IN#
AF#
LA#
CN#
VN#
SA#MY#
OM#
IQ#
IR#
TH#
0"
5"
10"
15"
20"
25"
30"
35"
40"
45"
100" 1,000" 10,000" 100,000"
Fatali.es"per"100,000"persons"
Per"capita"income,"2010"US$"
WHO"Es.mate" Reported"by"country"

Dinesh Mohan Impact of Road traffic Crashes
6
individual countries. Some high-income countries like Oman (OM) and Saudi Arabia (SA) have higher rates than low and middle-income countries like Indonesia (ID) and Philippines (PH). This suggests that higher national incomes do not necessarily produce better road safety policies. This is contrary to the widely held belief that RTI rates are highly dependent on per capita incomes (Kopits, E. and Cropper, M., 2005). This is probably because all earlier analyses depended on official fatality rates as reported by individual countries. Figure 2 shows that in general countries that have a higher proportion of 2/3-wheel vehicles in their fleet have a higher proportion of 2/3 occupant fatalities (Data from: W.H.O., 2009a). However, there is a reasonable spread of fatality proportions around each vehicle proportion. Japan (JP) and Singapore (SG) are high income countries that have similar 2/3-wheeler fleet ratios (reporting is likely to be reliable, country and WHO fatality estimates are similar) but Singapore fatality ratio is 2.7 times greater than that of Japan though their overall fatality rates are similar. This indicates that even countries that have similar incomes, vehicle fleet ratios, motor vehicle standards and traffic regulations can have different fatality patterns. This is probably due to other factors influencing fatality rates - urban living patterns, street and highway infrastructure, etc. (Mohan, D. and Bangdiwala, S., 2013). Figure 3 also indicates that data supplied by some of the countries may not be reliable. Bangladesh (BD), a low-income country with a high proportion of 2/3-wheeled vehicles reports very low proportion of fatalities. It is possible that the data reported does not reflect reality in all cases. In order to propose safety policies for the future it is necessary to have some idea about how vehicle fleet distributions change with increase in income, especially motorcycle ownership. It is important for us to understand motorcycle ownership trends because these vehicles have a very high risk of being involved in fatal crashes. It is assumed by many policy makers that car ownership increases and motorcycle ownership decreases with increasing per-capita incomes.
Figure 2. Proportion of 2/3-wheeler occupant fatalities vs. proportion of 2/3-wheeled vehicles in country fleet (Source: W.H.O. 2009a).
!
Figure 3. Proportion of 2/3-wheelers and motor cars in vehicle fleet vs. per-capita income in Asian countries (Source: W.H.O. 2009a).

Dinesh Mohan Impact of Road traffic Crashes
7
Figure 3 shows that this is only roughly true and generally car proportions increase and 2/3-wheeler proportions decrease with increases in per-capita incomes (The numbers do not add up to 100 for each country as other vehicles are not included). However, there are large variations at similar levels of income. The correlation by income is weak for both under incomes less than $10,000 per-capita. Since most countries are below US% 10,000 income levels at present, it is unlikely that many country annual per-capita incomes will exceed US$ 10,000 in the next two decades. At present Japan is the only high-income country in Asia with a large population. Therefore, we are likely to see continuing high use of MTWs in most Asian countries. The above analysis indicates that:
• RTI rates in middle and low-income countries are unacceptably high with the majority of the victims being vulnerable road users.
• MTW use will continue to be high in most Asian countries in the medium term future. • Reliable fatality and injury rates are not available for most Asian countries, therefore,
it is not easy to calculate social and economic impacts of RTI on society. • Any calculations based on official statistics are likely to be underestimates for most
Asian countries.
IMPACT OF RTI ON SOCIETY
A very large number of HMCs have been estimating the costs of road traffic crashes over the past three decades. The methods used and costs allocated have generated a great deal of discussion and debate, in particular because of the difficulty of putting monetary values on pain and suffering. A study undertaken by the European Federation of Road Traffic Victims on impact of road death and injury in collaboration with the Commission for European Union gives the following qualitative conclusions regarding the effect of road traffic crashes on victims (European Federation of Road Traffic Victims, 1995): • Physical and mental impairment through road traffic injury can have long-term effects
which deny victims the ability to maintain their standard of living. • A large proportion of the relatives of dead and disabled victims, as well as the disabled
themselves, suffer psychological disorders. The worst situation is that of the relatives of the dead.
• The bereaved are the worst affected - 70% - by relationship problems, communication difficulties and sexual problems. The figure for relatives of disabled victims is 40%, and for the disabled themselves 50%. After 3 years these problems do not decrease as one would expect, but worsen for each category by about 5 points.
• About 50% of the relatives of victims, and the victims themselves, state that for extended periods they consume more psychotropic products like tranquillisers, sleeping tablets, tobacco, alcohol and drugs than before the incident.
• It is sometimes believed that due to the tragedy, the relationship of the respondents with their normal social partners deteriorates
• The capacity to enjoy life as before the crash tragically disappears for 91% of the relatives of dead victims for the first 3 years. After this period, the loss persists for long periods for 84% of them. For many this loss will be permanent.
We have quoted from this report extensively because it is important to note that economic costing of human tragedies can only be used as an inefficient tool to understand the partial costs of the problem.

Dinesh Mohan Impact of Road traffic Crashes
8
SOCIAL COST OF ROAD TRAFFIC INJURIES
Calculation of direct and indirect costs of injuries, deaths and damage due to road traffic crashes started in the 1970s and many such analyses have been done in USA and Europe (Braddock, M. et al., 1992, Brazier, J. et al., 1996, Carlsson, G., 1997, De Blaeij, A. et al., Elvik, R., 1994, Elvik, R., 2000a, Elvik, R., 2000b, Elvik, R., 2001, Lensminde, K., 2004, Mayeres, I. et al., 1996).The main objective of assessing costs has been to provide an objective tool for help in selecting more cost-effective countermeasures for road safety and also to justify expenditures for the same. However, critics like Hauer (1994) question the very basic principles of cost-benefit analysis where human lives, pain and suffering are involved. Professionals like Hauer working in this area take the position that putting a monetary value on human life is ethically unacceptable. As far as the liberal economists are concerned the objective of cost-benefit analysis is welfare maximisation. The process is neutral with respect to distributive outcomes and is insensitive to how the impacts are distributed between various groups of the population. For example, in India a large proportion of the pedestrians who get killed would come from the low-income strata of the population and car drivers from the high-income strata. If a cost-benefit analysis is attempted for increase in speeds of cars in urban areas then the increase in costs due to higher incidence of deaths among poor pedestrians could be offset by timesaving of rich drivers. Most people would consider such a justification immoral and unacceptable. However, governments, municipalities, and car and companies do incur costs when human beings are injured or killed in traffic crashes. No matter what methods are used, the economic costs of traffic crashes turn out to be so high that it becomes easier for professionals to justify higher expenditures in promoting road safety. A report commissioned by the Global Road Safety Partnership of the World Bank summarise the efforts in the area and conclude that “overall it does appear that in most countries, costs exceed 1 per cent of GDP which may now be considered to be an underestimate of national accident costs” (Jacobs, G. et al., 2000). A more recent report by IRAP (Mcmahon, K. and Dahdah, S., 2008) discusses the background to valuation of safety benefits, briefly reviews the main methodologies that are in use, and presents recommendations for values for use in economic appraisal. They state that “estimates of the value of statistical life are heavily influenced by income regardless of the method that is used. Both Willingness-to- pay and the Human Capital/Lost Output approach provide estimates that are income dependent. A study of Valuation in a range of European countries found that about 40% of the variation between fatality values in the different countries could be accounted for by variation in Gross Domestic Product (GDP) per capita (Alfaro, J.-L. et al., 1994)”. Table 3 shows the Value of Statistical Life as a ratio of per capita income (2004) for selected countries. IRAP recommends that a reasonable rule of thumb for the default value for the economic appraisal model is 70 as a central ratio value, with a range of 60 to 80 for sensitivity analysis. They recommend for the purposes of IRAP to use 10 as the default ratio of the number of serious injuries to the number of fatalities and for sensitivity analysis this ratio will vary between 8 and 12. However in some countries this ration can vary between 15-20 (Mohan, D. et al., 2009). Further, they suggest that a reasonable value of serious injury for the economic appraisal model is
Table 3. Value of Statistical Life as a ratio of per capita income (2004) for selected countries (Adapted from Mcmahon, K. and Dahdah, S., 2008).
Country Economy
Value/of/Statistical/Life/(VSL),/2004/US$
VSL/per/capita/income
Australia/ HIC 1,304,135 45Netherland HIC 1,806,000 58USA HIC 3,000,000 83Malaysia MIC 722,022 76Vitenam LIC 53,063 21India LIC 147,403 56
HIC,0MIC,0LIC:0High,0Middle0and0Low<Income0country

Dinesh Mohan Impact of Road traffic Crashes
9
25% of the value of a fatality, with a range of 20% to 30% for sensitivity analysis. The equivalent values in terms of multiplier of GDP per capita are a central value of 17 with a range of 12 to 24 for sensitivity analysis.
COST OF INJURY IN INDIA
The last study on evaluation of RTI costs in India was sponsored by the Ministry of Surface Transport (India) and conducted by M/s Tata Consultancy Services (2000). A summary of the values calculated in these studies is given in Table 4. The study conducted by Tata Consultancy Services an estimate of road accident costs as 0.69 per cent of GDP of India but the study makes the following mistakes (Mohan, D., 2002): (a) The “useful life” of an Indian is assumed to be 62 years. However, the probability of an Indian dying before age 5 was 97 per thousand in 1999 which would give a low life expectancy at birth. This is why even the disability-adjusted life expectancy in India at age 60 was found more than 11 years. Other estimates show that even in 1992-1992 persons at age 10 could expect to live up to 68 years and those at 50 up to 73 years of age (Bose, A., 1996). Therefore, this study has also underestimated the life expectancy by more than 10 years (>15%). This is critical, because with improving health standards individuals are active and provide very useful social functions well beyond the age of 62. (b) The study did not account for the undercounting inherent in the official statistics on road accidents. (c) The costs of medical treatment are taken from government hospitals which include a large number of hidden subsidies. (d) There is no attempt made to understand the differentials in wages of different road users and to account for it. Since pedestrians and bicyclists are likely to belong to the poorer sections of the population they will lower the accident costs in this way of calculation as they have a higher involvement in crashes. This method therefore does not satisfy the condition of acceptability to the public. (e) The major statistical error, however, is the underestimate of injuries and vehicle damage in this study. For 1995 they use the figures of 68,351 for fatalities and 266,541 for injuries. This is a ratio of 1:3.9 for fatalities:injuries. If we take the conservative ratio of 1:15:70 for fatalities:serious-injuries:minor injuries and a 5 per cent under count for fatalities we get the figures as shown in Table 5. The cost of injuries alone according to this estimate is approximately Rupees 322,000 million against total estimate of Rupees 69,502 million by the Tata Consultancy
Table 4. Estimates of costs due to road traffic crashes in India (Adapted from Anon, 2000)
Fatal 535,489Serious,injury 106,959*–*242,736Minor,injury 18,855Property,damage .Damage,to,buses 47,100Damage,to,trucks 48,700Damage,to,cars 16,200Damage,to,2;wheelers 4,100
Type,of,accident Estimated,cost,in,Indian,Rs.,(1999)
Table 5. Revised estimates for costs of road traffic crash injuries in India for 1995 (Source: Mohan, D. 2002)
Injury'severityEstimated'number'of'persons
Estimated'cost'in'1995'Rs'(million)
Fatalities 71,948 38,527Serious,major/injuries
1,079,220 188,698*
Minor/injuries 5,036,360 94,960TOTAL 322,186
3.2/per/centTotal/cost/as/per/cent//of/GDP*"Note:"cost"of"serious"injuries"is"taken"as"the"average"of"serious"and"major"injuries"(Rs.174847.5)"as"stated"in"the"in"the"TCS"report"

Dinesh Mohan Impact of Road traffic Crashes
10
report. This revised estimate indicates the road accident costs to 3.2 per cent of the GDP of India in 1995. Estimate Based on IRAP Guidelines 2008 Table 6 shows estimates for cost of RTI in India in 2012 based on IRAP guidelines (Mcmahon, K. and Dahdah, S., 2008). These rough estimates also suggest that the cost of Road traffic injuries in India could well amount to 2.8 per cent of GDP of the country. Summary The above discussion suggests that societal cost of road traffic crashes could well be around 3 per cent of the GDP of Asian countries including India. Besides the economic costs associated with RTI, it is possible that the social costs may be higher in low and middle-income countries (LIC & MIC) than high-income countries (HIC) for the following reasons:
• LIC and MIC generally have higher rates of road crashes than HIC. • Since cost of life is reflected in the per-capita income of the country and its GDP, the
proportion of costs due to loss of life should be similar all countries. • As a proportion of per capita income, costs of similar levels of medical care are higher
in LIC/MIC as compared to those in HIC. • Because of a scarcity of good rehabilitation care facilities and lack of aids for the
disabled, road crash victims suffering permanent disability would suffer greater lack of access and employment opportunities in LIC/MIC.
• Owing to lack of welfare functions provided by the state and health care facilities, families of injury victims have to spend much more time looking after injury victims in LIC/MIC. This causes greater time and economic losses overall.
THE ROAD AHEAD
The fact that road traffic crashes may be contributing losses of 3 per cent of the annual GDP in India and other Asian countries and environmental degradation similar amounts, makes it imperative that we use this knowledge for making policy making more rational regarding the following issues: (a) Modal choices concerning motorised transport, bicycling and walking Investments in transportation must be made very carefully so that the returns are optimised. If costs of RTI and environmental degradation are included in calculating feasibility of road projects then, we may arrive at different policy options than those considered at present. (b) Investments in safety features and designs for urban roads and rural highways Estimates of social and economic losses due road traffic crashes have been grossly estimated in all past studies. Studies need to be done with greater scientific rigour to set the record straight. In the next few years large investments are going to be made in urb and and rural
Table 6. Estimates for cost of RTI in India in 2012 based on IRAP guidelines
Statistical(value IRAP(Ratio
Estimated(number(2012
Total(amount(for(country,(million(Rs.
Life 56*PCI 150,000 756,000Serious(Injury 17*PCI 1,500,000 2,295,000Total((for(life(lost(and(injury
3,051,000
Per(cent(of(GDP
2.8
Notes:'(1)'All'values'used'based'on'median''numbers'suggeted'by'IRAP'(Mcmahon,'K.'and'Dahdah,'S.,'2008.)'(2)'Per'capita'income'(PCI)'in'India'and'GDP'vales'used'for'2012.'(3)'10%'undercount'assumed'for'total'fatalities'in'India'in'2012)

Dinesh Mohan Impact of Road traffic Crashes
11
infrastructure. The discussion in previous sections illustrates that the losses due to RTI are very high on our roads and the victims include a disproportionate share of pedestrians, bicyclists and other road users. Highways, once constructed, have a long life span and design faults continue to have their deleterious effects over this period. To reduce these losses the actual costs of road accidents have to be internalised at the planning stage itself. Once this is done, it will become obvious that much more attention needs to be given to the design of safer highways and that the investment required can be justified on economic grounds. (c) Independent agency for road safety All states must establish an independent agency for road safety staffed by professionals. Since the annual losses amount to more than 3 per cent of GDP, even a 5 per cent in decrease in RTI per year can effect huge savings. The international experience suggests that there is a strong correlation between scientific research and reduction in RTI. At present insignificant amounts are spent on safety research in most Asian countries. This agency would have the responsibility of promoting and commissioning such work. As a start, 0.5 per cent of highway construction funds may be allocated for starting the department. (d) Integration of safety and environmental issues The environment impact assessment and road safety audit reports of all highway and road construction projects must be considered in a joint meeting to clear conflicting policy options and to strengthen synergistic policies. (e) Capacity building A special effort must be made to train a large number of professionals in the scientific approach to road safety. To do this special road safety centres (stand alone and in universities) will need to be established and existing ones strengthened in all regions of the country. The World Bank has published a special report regarding the role and responsibilities of road safety professionals (Bliss, T. and Breen, J., 2009), and the recently released India Transport Report includes a special chapter on safety that outlines the steps needed to build build professional capacity in India (National Transport Development Policy Committee, 2014).
ACKNOWLEDGEMENT
Assistance in data analysis was provided by Rachit Khare and Shivansh Agarwal. The work was partially supported by The Volvo Research and Educational Foundations and PURGE.
REFERENCES
2000. Evaluation of Road Accident Costs - Research Digest. Indian Highways, 28, 27-44. Alfaro, J.-L., Chapuis, F. & Fabre, F. 1994. Cost 313: Socio-economic costs of road
accidents. Brussels: Commission of the European Community. Bliss, T. & Breen, J. 2009. Implementing the recommendations of the World Report on Road
Traffic Injury Prevention, Wahington D.C., The World Bank Global Road Safety Facility.
Bose, A. 1996. India's Basic Demographic Statistics, Delhi, B.R. Publishing Corporation.

Dinesh Mohan Impact of Road traffic Crashes
12
Braddock, M., Schwartz, R., Lapidus, G., Banco, L. & Jacobs, L. 1992. A population-based study of motorcycle injury and costs. Annals of Emergency Medicine, 21, 273-278.
Brazier, J., Nicholl, J. & Snooks, H. 1996. The cost and effectiveness of the London Helicopter Emergency Medical Service. J Health Serv.Res.Policy, 1, 232-237.
Carlsson, G. 1997. Cost-Effectiveness of information, campaigns and enforcement and the costs and benefits of speed changes. European Seminar On Cost-Effectiveness Of Road Safety Work And Measures. Luxembourg.
De Blaeij, A., Florax, R. J. G. M., Rietveld, P. & Verhoef, E. The value of statistical life in road safety: a meta-analysis. Accident Analysis & Prevention, In Press, Corrected Proof.
Elvik, R. 1994. The external costs of traffic injury: Definition, estimation, and possibilities for internalization. Accident Analysis & Prevention, 26, 719-732.
Elvik, R. 2000a. How much do road accidents cost the national economy? Accident Analysis & Prevention, 32, 849-851.
Elvik, R. 2000b. Which are the relevant costs and benefits of road safety measures designed for pedestrians and cyclists? Accident Analysis & Prevention, 32, 37-45.
Elvik, R. 2001. Cost-benefit analysis of road safety measures: applicability and controversies. Accident Analysis & Prevention, 33, 9-17.
European Federation of Road Traffic Victims 1995. Impact of road death and injury – Research into the principal causes of the decline and quality of life & living standards suffered by road crash victimes and victim families. Geneva: European Federation of Road Traffic Victims.
Hauer, E. 1994. Can One Estimate the Value of Life or is it Better to be Dead Than Stuck in Traffic? Transportation Research Series A, 28, 109-118.
Jacobs, G., Aeron-Thomas, A. & Astrop, A. 2000. Estimating Global Road Fatalities. Crowthorne, U.K.: Transport Research Laboratory.
Kopits, E. & Cropper, M. 2005. Traffic fatalities and economic growth. Accident Analysis & Prevention, 37, 169-178.
Lensminde, K. 2004. Cost-benefit analyses of walking and cycling track networks taking into account insecurity, health effects and external costs of motorized traffic. Transportation Research Part A: Policy and Practice, 38, 593-606.
Mayeres, I., Ochelen, S. & Proost, S. 1996. The marginal external costs of urban transport. Transportation Research Part D: Transport and Environment, 1, 111-130.
Mcmahon, K. & Dahdah, S. 2008. The true cost of road crashes: valuing life and the cost of a serious injury, Hampshire, UK, International Road Assessment Programme.
Mohan, D. 2002. Traffic safety and health in Indian cities. Journal of Transport and Infrastructure, 9, 79-94.
Mohan, D. & Bangdiwala, S. 2013. Urban street structure and safety In: Mohan, D. (ed.) Safety, sustainability and future urban transport. New Delhi: Eicher Goodearth Pvt Ltd.
Mohan, D., Tiwari, G. & Mukherjee, K. 2013. A study on community design for traffic safety. Final report for IATSS. New Delhi: Transportation Research and Injury Prevention Programme, Indian Institute of Technology Delhi.
Mohan, D., Tsimhoni, O., Sivak, M. & Flannagan, M. J. 2009. Road safety in India: Challenges and opportunities. Ann Arbor, MI: University of Michigan Transportation Research Institute.
National Transport Development Policy Committee 2014. Safety. India Transport Report: Moving India to 2032. New Delhi: Routledge.
NCRB 2012. Accidental Deaths & Suicides in India - 2011. New Delhi: National Crime Records Bureau, Ministry of Home Affairs.

Dinesh Mohan Impact of Road traffic Crashes
13
Peden, M., Scurfield, R., Sleet, D., Mohan, D., Hyder, A. A., Jarawan, E. & Mathers, C. 2004. World report on road traffic injury prevention, Geneva World Health Organization
Tiwari, G., Mohan, D. & Gupta, D. P. 2000. Evaluation of Capacity Augmentation Projects of National Highways and State Highways. New Delhi: Ministry of Surface Transport, GOI.
W.H.O. 2009a. Global status report on road safety: time for action, Geneva, World Health Organization.
W.H.O. 2009b. Road traffic injuries publications and resources: Related resolutions. Geneva. W.H.O. 2013. Global status report on road safety 2013: supporting a decade of action,
Geneva, World Health Organization.