united asia active allocation fund - uob group.com wai fai cheo chai hong goh yu min thio boon kiat...
TRANSCRIPT
United Asia Active Allocation FundSemi Annual Report
for the half year ended 30 June 2017


MANAGERUOB Asset Management LtdRegistered Address:80 Raffles PlaceUOB PlazaSingapore 048624Company Registration No. : 198600120Z
OPERATIONS ADDRESS80 Raffles Place#06-00, UOB Plaza 2Singapore 048624Tel: 1800 22 22 228
DIRECTORS OF UOB ASSET MANAGEMENTLee Wai FaiCheo Chai HongGoh Yu MinThio Boon Kiat
TRUSTEEState Street Trust (SG) Limited168 Robinson Road#33-01, Capital TowerSingapore 068912
CUSTODIAN / ADMINISTRATOR / REGISTRARState Street Bank and Trust Company, acting through its Singapore Branch168 Robinson Road#33-01, Capital TowerSingapore 068912
AUDITORSPricewaterhouseCoopers LLP8 Cross Street#17-00, PWC BuildingSingapore 048424
SOLICITORS TO THE MANAGERTan Peng Chin LLC30 Raffles Place#11-00, Chevron HouseSingapore 048622
SOLICITORS TO THE TRUSTEEShook Lin & Bok LLP1 Robinson Road#18-00, AIA TowerSingapore 048542
United Asia Active Allocation Fund(Constituted under a Trust Deed in the Republic of Singapore)
-1-

A) Fund Performance
Fund Performance/Benchmark Returns
3 mth%
Growth
6 mth%
Growth
1 yr%
Growth
3 yrAnn
CompRet
5 yrAnn
CompRet
10 yrAnn
CompRet
SinceInception
13 November2007Ann
CompRet
United AsiaActive AllocationFund 2.95 7.79 14.56 3.43 5.58 N/A 1.08
Benchmark 3.90 9.51 19.20 8.78 8.84 N/A 4.14
Source: Lipper, a Thomson Reuters Company.
Note: The performance returns of the Fund are in Singapore dollar based on a NAV-to-NAV basis with net dividends and distributions
reinvested, if any.
The benchmark of the Fund: Composite BM Feb 08 – Jan 11; 40% MSCI AC FE Ex Japan, 20% MSCI AC Asia Pacific Ex Japan
Small Cap Index and 40% JP Morgan Asia Credit Index TR; from Feb 11 - Nov 16; 40% MSCI AC FE ex Japan, 20% MSCI AC
Asia Pacific ex Japan Mid Cap Index and 40% JP Morgan Asia Credit Index TR. Nov16-Current; Composite of 60% MSCI AC Asia
ex Japan and 40% JP Morgan Asia Credit Index Total Return Composite.
For the sixmonths ended 30 June 2017, the net asset value of the Fund increased 7.79%, comparedwith an increase of 9.51%in the composite benchmark, consisting of 40% JPM Asia Credit Index, 40%MSCI Far East ex Japan and 20%MSCI AC AsiaPacific ex-Japan Mid Cap Index. The fixed income fund (United Asian Bond Fund), in which the Fund is invested, achieved areturn of 0.8% versus the fixed income benchmark (JPM Asia Credit Index) of 0.9% in the review period. The United Asia Fundachieved a return of 11.6% and the United Asian Growth Opportunities Fund achieved a return of 7.1% during the period.During the period The Fund benefited from being overweight on equities but each of the underlying funds were slightly belowtheir respective benchmarks.
As of the end of the period the Fund was invested 61.03% in the United Asia Fund, 11.55% in the United Asian GrowthOpportunities Fund (for a total equity weight of 72.58%), and 29.23% in the United Asian Bond Fund. This positioning wasoverweight on equities compared to the benchmark which contains 60% equities and 40% bonds. The Fund was overweight onequities throughout the first half of 2017.
Economic and Market Review
Financial markets showed major divergences going into 2017. The USD, which had appreciated sharply after the USPresidential election in November 2016 in anticipation of stronger growth and higher interest rates, started to weaken in early2017. USTreasury (UST) yields, which had spiked post-election, also began to ease, as the newTrumpadministrationwas seento unable to push through its policy initiatives, including repealing the Affordable Care Act, tightening trade policies andintroducing tax reforms.
On the other hand, the US equity markets continued to hit fresh highs, as investors took comfort in improving economic dataand strong corporate earnings. Global equity markets took the cue from the US and “climbed the wall of worries”, includingmixed economic data and rising geo-political risks. These risks are noteworthy and include North Korea’s attempts at missiletesting, a French Presidential election that could have elected an anti-euro right-wing candidate, a political spat between SaudiArabia and Qatar in the Middle East, and a series of political missteps and allegations of possible misconducts from the newUS President.
In spite of the above risks, the US Federal Reserve hiked interest rates two more times (in March and June 2017), and beganto discuss plans to shrink its balance sheet by gradually reducing the amount it would reinvest as its bond holdingsmature.Whilethese actions would have previously been seen as monetary tightening measures and cause UST yields to rise, bond marketswere unconvinced leading UST yields to eventually fall to post-US election levels in June. Global bond yields started climbingin late June as the European Central Bank (ECB) signalled that it was preparing to phase out its monetary easing measures,including its asset purchase programme (often referred to as quantitative easing, or QE).
United Asia Active Allocation Fund(Constituted under a Trust Deed in the Republic of Singapore)
-2-

A) Fund Performance (continued)
In the first half of 2017, Asian equities posted positive returns, with the MSCI Asia ex-Japan Index gaining 12.9% in SingaporeDollar (SGD) terms. The JPM Asia Credit Index gained 0.9%, in SGD terms.
Outlook and Fund Strategy
We turn marginally more cautious entering into the second-half of 2017, as we find evidence that positive macro trends havelargely been priced into equity markets and economic trendsmay be shifting.We continue to highlight better broad-based grossdomestic product (GDP) growth in 2017 which is supporting strong global corporate earnings. However, valuations are nolonger attractive and leading indicators are less impressive with the reflation theme fading.
Previously, we had highlighted that “reflation”, or the normalisation of inflation, growth and interest rates was a trend that wasvery favourable for equities and a headwind for fixed income. Over recent months, economic growth has remained favourableand supportive of equities. However, as inflation trends have disappointed, long termgovernment bond yields have declined andglobal fixed income markets have been performing as well. As the reflation theme fades, the risk of normalisation of interestrates decreases.
This means the outlook for fixed income outlook turns more attractive on a risk-adjusted basis, while the prospects for equitieson a risk-return basis turn marginally weaker after the sharp rally.
After peaking in January 2017, oil prices saw three rounds of sharp corrections and rebounds, each adjusting by over 10% inmagnitude. This suggests a tug-o-war of views on the supply-demand balance in the energy sector. We believe this brings inadditional uncertainty in financial markets, as investors assess the impact on inflation (and hence interest rates) as well as theprospects of the energy industry, which is a not insignificant part of global indices aswell as amajor borrower in the bondmarketand banking system.
On the whole, despite the many positives, valuations of global equities have risen above average levels, implying that marketexpectations might be outpacing earnings improvements and investors are counting on positive surprises to maintain the rally.This makes it harder for economic and earnings trends to surprise on the positive side, and for equity market to repeat its strongperformance, in the near term.
We continue to believe that Asia’smostly favourable demographic trends and rising incomes underpin the long-term growth andinvestment case. Our strategy is to take advantage of these structural opportunities by investing in companies that have soundbusiness models, are positioned in segments offering attractive growth and that have demonstrated operational and financialdiscipline in the way they manage their businesses.
United Asia Active Allocation Fund(Constituted under a Trust Deed in the Republic of Singapore)
-3-
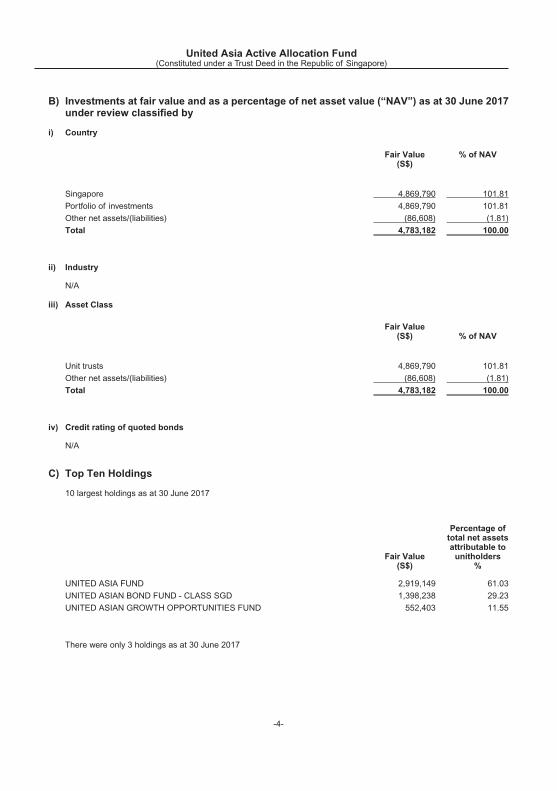
B) Investments at fair value and as a percentage of net asset value (“NAV”) as at 30 June 2017under review classified by
i) Country
Fair Value(S$)
% of NAV
Singapore 4,869,790 101.81
Portfolio of investments 4,869,790 101.81
Other net assets/(liabilities) (86,608) (1.81)
Total 4,783,182 100.00
ii) Industry
N/A
iii) Asset Class
Fair Value(S$) % of NAV
Unit trusts 4,869,790 101.81
Other net assets/(liabilities) (86,608) (1.81)
Total 4,783,182 100.00
iv) Credit rating of quoted bonds
N/A
C) Top Ten Holdings
10 largest holdings as at 30 June 2017
Fair Value(S$)
Percentage oftotal net assetsattributable tounitholders
%
UNITED ASIA FUND 2,919,149 61.03
UNITED ASIAN BOND FUND - CLASS SGD 1,398,238 29.23
UNITED ASIAN GROWTH OPPORTUNITIES FUND 552,403 11.55
There were only 3 holdings as at 30 June 2017
United Asia Active Allocation Fund(Constituted under a Trust Deed in the Republic of Singapore)
-4-

C) Top Ten Holdings (continued)
10 largest holdings as at 30 June 2016
Fair Value
Percentage oftotal net assetsattributable tounitholders
(S$) %
UNITED ASIAN BOND FUND 2,614,166 45.38
UNITED ASIA FUND 2,030,931 35.26
UNITED ASIAN GROWTH OPPORTUNITIES FUND 1,031,788 17.91
There were only 3 holdings as at 30 June 2016
D) Exposure to derivatives
i) fair value of derivative contracts and as a percentage of NAV as at 30 June 2017
N/A
ii) net gains/(losses) on derivative contracts realised during the financial period from 01 January 2017 to 30 June 2017
N/A
iii) net gains/(losses) on outstanding derivative contracts marked to market as at 30 June 2017
N/A
E) Amount and percentage of NAV invested in other schemes as at 30 June 2017
Please refer to the Statements of Portfolio.
F) Amount and percentage of borrowings to NAV as at 30 June 2017
N/A
G) Amount of redemptions and subscriptions for the financial period from 01 January 2017 to30 June 2017
Total amount of redemptions SGD 1,153,758
Total amount of subscriptions SGD 143,422
H) The amount and terms of related-party transactions for the financial period from 01 January2017 to 30 June 2017
i) As at 30 June 2017, the Fund maintained current accounts with State Street Bank and Trust Company as follows:
Bank balances SGD 12,796
United Asia Active Allocation Fund(Constituted under a Trust Deed in the Republic of Singapore)
-5-

H) The amount and terms of related-party transactions for the financial period from 01 January2017 to 30 June 2017 (continued)
ii) Purchase/holdings of UOBAM unit trusts by UOB or its affiliated companies as at 30 June 2017
N/A
iii) Investment in Initial Public Offerings managed by UOB Group
N/A
iv) As at 30 June 2017, there was no brokerage income earned by UOB Kay Hian Pte Ltd.
I) Expense ratios
2017 2016
$ $
Total operating expenses 121,904 106,985
Average daily net asset value 5,578,270 6,278,622
Weighted average of the Underlying Funds’ expense ratio 1.63% 1.32%
Expense ratio 3.82% 3.03%
Note: The expense ratio has been computed based on the guidelines laid down by the Investment Management Association of
Singapore (“IMAS”). This is the sum of the Fund’s expense ratio and the weighted average of the underlying funds’ unaudited
expense ratios. The calculation of the Fund’s expense ratio at 30 June 2017 was based on total operating expenses divided by
the average net asset value respectively for the year. The total operating expenses do not include (where applicable) brokerage
and other transaction costs, performance fee, interest expense, distribution paid out to unitholders, foreign exchange
gains/losses, front or back end loads arising from the purchase or sale of other funds and tax deducted at source or arising out
of income received. The Fund does not pay any performance fee. The average net asset value is based on the daily balances.
The unaudited expense ratios of the underlying funds are obtained from underlying funds’ Manager.
J) Turnover ratios
2017 2016
$ $
Lower of total value of purchases or sales 573,931 978,181
Average daily net assets value 5,367,294 5,855,039
Turnover ratio 10.69% 16.71%
Note: The portfolio turnover ratio is calculated in accordance with the formula stated in the Code on Collective Investment Schemes.
The calculation of the portfolio turnover ratio was based on the lower of the total value of purchases or sales of the underlying
investments divided by the average daily net asset value.
K) Any material information that will adversely impact the valuation of the scheme such ascontingent liabilities of open contracts
N/A
United Asia Active Allocation Fund(Constituted under a Trust Deed in the Republic of Singapore)
-6-

L) For schemes which invest more than 30% of their deposited property in another scheme, thefollowing key information on the second-mentioned scheme (“the underlying scheme”)1
should be disclosed as well
i) top 10 holdings at fair value and as percentage of NAV as at 30 June 2017 and 30 June 2016 & 31 December 2016 and31 December 2015
10 largest holdings as at 30 June 2017
United Asia Fund
Fair Value
Percentage oftotal net assetsattributable tounitholders
(S$) %
SAMSUNG ELECTRONICS CO LTD 4,576,704 8.24
ALIBABA GROUP HOLDING LTD 3,103,971 5.59
TENCENT HOLDINGS LTD 2,954,607 5.32
TAIWAN SEMICONDUCTOR MANUFACTU 2,170,508 3.91
BRILLIANCE CHINA AUTOMOTIVE HO 1,404,497 2.53
UNITED OVERSEAS BANK LTD 1,328,452 2.39
HON HAI PRECISION INDUSTRY CO 1,323,894 2.38
LAND MARK OPTOELECTRONICS CORP 1,291,578 2.33
PING AN INSURANCE GROUP CO OF 1,088,929 1.96
UNITED ASEAN INCOME FUND - USD ACC 1,019,238 1.83
10 largest holdings as at 30 June 2016
United Asia Fund
Fair Value
Percentage oftotal net assetsattributable tounitholders
(S$) %
SAMSUNG ELECTRONICS 3,330,134 6.19
TAIWAN SEMICONDUCTOR MFG CO LTD 2,711,910 5.04
TENCENT HOLDINGS LIMITED 2,291,324 4.26
LARGAN PRECISION COMPANY LIMITED 1,474,444 2.74
HOUSING DEVELOPMENT FINANCE CORP 1,424,869 2.65
SUN HUNG KAI PROPERTIES LTD 1,404,434 2.61
CNOOC LTD 1,335,152 2.48
INARI AMERTRON BERHAD 1,288,979 2.40
ALIBABA GROUP HOLDING LTD 1,284,473 2.39
HERMES MICROVISION INC 1,261,872 2.35
United Asia Active Allocation Fund(Constituted under a Trust Deed in the Republic of Singapore)
-7-

L) For schemes which invest more than 30% of their deposited property in another scheme, thefollowing key information on the second-mentioned scheme (“the underlying scheme”)1should be disclosed as well (continued)
i) top 10 holdings at fair value and as percentage of NAV as at 30 June 2017 and 30 June 2016 & 31 December 2016 and31 December 2015 (continued)
10 largest holdings as at 31 December 2016
United Asian Bond Fund
Fair Value
Percentage oftotal net assetsattributable tounitholders
(S$) %
UNITED ASIAN HIGH YIELD BOND FUND – CLASS SGD DIST 12,200,045 5.52INDUSTRIAL & COMMERCIAL BANK OF CHINA LIMITED 4.875% DUE21/09/2025 7,409,880 3.35
CHINA RAILWAY XUNJIE COMPANY LIMITED 3.25% DUE 28/07/2026 6,834,382 3.09
KOREA GAS CORPORATION 3.5% DUE 21/07/2025 5,541,420 2.51
RHB BANK BERHAD 2.503% DUE 06/10/2021 5,252,817 2.38
PERUSAHAAN LISTRIK NEGARA PT 5.5% DUE 22/11/2021 4,643,563 2.10
DAH SING BANK LIMITED 5.25% DUE 29/01/2024 4,476,397 2.03YESTAR INTERNATIONAL HOLDINGS COMPANY LIMITED 6.9% DUE15/09/2021 4,428,114 2.00
MPM GLOBAL PRIVATE LIMITED 6.75% DUE 19/09/2019 4,427,898 2.00TINGYI CAYMAN ISLANDS HOLDING CORPORATION 3.875% DUE20/06/2017 4,360,242 1.97
10 largest holdings as at 31 December 2015
United Asian Bond Fund
Fair Value
Percentage oftotal net assetsattributable tounitholders
(S$) %
UNITED ASIAN HIGH YIELD BOND FUND – CLASS SGD DIST 11,558,975 6.56INDUSTRIAL & COMMERCIAL BANK OF CHINA LIMITED 4.875% DUE21/09/2025 7,203,647 4.09
WANDA PROPERTIES INTERNATIONAL CO LIMITED 7.25% DUE 29/01/2024 5,884,052 3.34
KOREA GAS CORPORATION 3.5% DUE 21/07/2025 5,513,802 3.13
PERUSAHAAN LISTRIK NEGARA PT 5.5% DUE 22/11/2021 4,338,872 2.46
KOREAN REINSURANCE CO 4.5% DUE 21/10/2044 FRN 4,023,754 2.29
LONGFOR PROPERTIES CO LIMITED 6.75% DUE 29/01/2023 3,652,293 2.07
UNITED ASIAN LOCAL CURRENCY BOND FUND – CLASS USD DIST 3,472,902 1.97INDONESIA GOVERNMENT INTERNATIONAL BOND 4.125% DUE15/01/2025 3,385,335 1.92
CNOOC FINANCE 2015 USA LLC 3.5% DUE 05/05/2025 3,379,837 1.92
United Asia Active Allocation Fund(Constituted under a Trust Deed in the Republic of Singapore)
-8-

L) For schemes which invest more than 30% of their deposited property in another scheme, thefollowing key information on the second-mentioned scheme (“the underlying scheme”)1should be disclosed as well (continued)
ii) expense ratios for the financial period ended 30 June 2017 and 30 June 2016& 31December 2016 and 31December 2015
United Asia Fund
30 June 2017 1.71%
30 June 2016 1.68%
United Asian Bond Fund - Class SGD
31 December 2016 1.32%
31 December 2015 1.19%
Note: The expense ratio has been computed based on the guidelines laid down by the Investment Management Association of
Singapore (“IMAS”). The calculation of the Fund’s expense ratio at 30 June 2017was based on total operating expenses divided
by the average net asset value respectively for the year. The total operating expenses do not include (where applicable)
brokerage and other transaction costs, performance fee, interest expense, distribution paid out to unitholders, foreign exchange
gains/losses, front or back end loads arising from the purchase or sale of other funds and tax deducted at source or arising out
of income received. The Fund does not pay any performance fee. The average net asset value is based on the daily balances.
iii) turnover ratios for the financial period ended 30 June 2017 and 30 June 2016 & 31December 2016 and 31December 2015
United Asia Fund
30 June 2017 42.45%
30 June 2016 98.69%
United Asian Bond Fund
31 December 2016 26.57%
31 December 2015 30.27%
Note: The portfolio turnover ratio is calculated in accordance with the formula stated in the Code on Collective Investment Schemes.
The calculation of the portfolio turnover ratio was based on the lower of the total value of purchases or sales of the underlying
investments divided by the average daily net asset value.
1 where the underlying scheme is managed by a foreign manager which belongs to the same group of companies as, or has a
formal arrangement or investment agreement with, the Singapore manager, the above information should be disclosed on the
underlying scheme. In other cases, such information on the underlying scheme should be disclosed only if it is readily available
to the Singapore manager.
M) Soft dollar commissions/arrangements
UOB Asset Management has entered into soft dollars arrangements with selected brokers from whom products andservices are received from third parties. The products and services relate essentially to computer hardware and softwareto the extent that they are used to support the investment decision making process, research and advisory services,economic and political analyses, portfolio analyses including performance measurements, market analyses, data andquotation services, all of which are believed to be helpful in the overall discharge of UOB Asset Management’s duties toclients. As such services generally benefit all of UOB Asset Management’s clients in terms of input into the investmentdecision making process, the soft credits utilised are not allocated on a specific client basis. The Manager confirms thattrades were executed on a best execution basis and there was no churning of trades.
There were no soft dollar arrangements, rebates, commissions or other monetary incentives received by UOB AssetManagement Ltd.
United Asia Active Allocation Fund(Constituted under a Trust Deed in the Republic of Singapore)
-9-

N) Where the scheme offers pre-determined payouts, an explanation on the calculation of theactual payouts received by participants and any significant deviation from thepre-determined payouts
N/A
United Asia Active Allocation Fund(Constituted under a Trust Deed in the Republic of Singapore)
-10-

STATEMENT OF TOTAL RETURNFor the half year ended 30 June 2017 (Un-audited)
30 June 30 June
2017 2016
$ $
Income
Dividends 31,404 45,837
Total 31,404 45,837
Less: Expenses
Management fee 39,961 43,805
Less: Management fee rebate (32,522) (34,249)
Trustee fee 2,479 2,492
Audit fee 7,369 7,409
Registrar fee 7,641 7,642
Valuation fee 3,331 3,650
Custody fee 580 903
Interest expenses - 10
Other expenses 34,533 14,302
Total 63,372 45,964
Net income/(losses) (31,968) (127)
Net gains/(losses) on value of investments
Net gains/(losses) on investments 459,634 (305,285)
Net foreign exchange gains/(losses) (177) (202)
459,457 (305,487)
Total return/(deficit) for the period before income tax 427,489 (305,614)
Less: Income tax (5,339) (7,135)
Total return/(deficit) for the period 422,150 (312,749)
United Asia Active Allocation Fund(Constituted under a Trust Deed in the Republic of Singapore)
-11-

STATEMENT OF FINANCIAL POSITIONAs at 30 June 2017 (Un-audited)
30 June 31 December
2017 2016
$ $
Assets
Portfolio of investments 4,869,790 5,575,148
Receivables 18,190 36,214
Cash and bank balances 12,796 65,872
Total assets 4,900,776 5,677,234
Liabilities
Payables 60,517 114,301
Distribution payable 57,077 69,353
Total liabilities 117,594 183,654
Equity
Net assets attributable to unitholders 4,783,182 5,493,580
United Asia Active Allocation Fund(Constituted under a Trust Deed in the Republic of Singapore)
-12-

STATEMENT OF MOVEMENTS OF UNITHOLDERS’ FUNDSFor the half year ended 30 June 2017 (Un-audited)
30 June 31 December
2017 2016
$ $Net assets attributable to unitholders at the beginning of the financialperiod/year 5,493,580 6,300,899
Operations
Change in net assets attributable to unitholders resulting from operations 422,150 38,532
Unitholders’ contribution/(withdrawal)
Creation of units 143,422 314,766
Cancellation of units (1,153,758) (861,022)
Change in net assets attributable to unitholders resulting from net creation andcancellation of units (1,010,336) (546,256)
Distributions (122,212) (299,595)
Total increase/(decrease) in net assets attributable to unitholders (710,398) (807,319)
Net assets attributable to unitholders at the end of the financial period/year 4,783,182 5,493,580
United Asia Active Allocation Fund(Constituted under a Trust Deed in the Republic of Singapore)
-13-

STATEMENT OF PORTFOLIOAs at 30 June 2017 (Un-audited)
Holdings at Fair value at
Percentage oftotal net assetsattributable tounitholders at
30 June2017
30 June2017$
30 June2017%
By Geography - Primary
Unit Trusts
SINGAPORE
UNITED ASIA FUND 1,359,641 2,919,149 61.03
UNITED ASIAN BOND FUND - CLASS SGD 747,321 1,398,238 29.23
UNITED ASIAN GROWTH OPPORTUNITIES FUND 254,212 552,403 11.55
TOTAL SINGAPORE 4,869,790 101.81
Portfolio of investments 4,869,790 101.81
Other net assets/(liabilities) (86,608) (1.81)
Net assets attributable to unitholders 4,783,182 100.00
United Asia Active Allocation Fund(Constituted under a Trust Deed in the Republic of Singapore)
-14-

STATEMENT OF PORTFOLIOAs at 30 June 2017 (Un-audited)
Percentage oftotal net assetsattributable tounitholders at30 June2017%
Percentage oftotal net assetsattributable tounitholders at31 December
2016%
By Geography - Primary (Summary)
Singapore 101.81 101.48
Portfolio of investments 101.81 101.48
Other net assets/(liabilities) (1.81) (1.48)
Net assets attributable to unitholders 100.00 100.00
As the Fund invests only into three underlying unit trusts, no secondary representation is provided.
United Asia Active Allocation Fund(Constituted under a Trust Deed in the Republic of Singapore)
-15-

United Asia Active Allocation Fund(Constituted under a Trust Deed in the Republic of Singapore)
This page has been intentionally left blank.

