unit 20 c photosynthesis and cellular respiration
TRANSCRIPT
Unit 20 C Photosynthesis and Cellular Respiration
ARE YOU READY? (Pages 4–5) Knowledge 1. ((a) and (b)) A – nucleus, overall control B – cell membrane, gatekeeping C – chloroplast, food production D – vacuole, water and nutrient storage E – mitochondrion, energy production F – Golgi apparatus, protein storage G – endoplasmic reticulum, material transport within the cell H – flagellum, locomotion I – cell wall, protection 2. (a) simple diffusion (b) osmosis (c) selectively permeable membrane (d) water 3.Passive transport by osmosis and diffusion involves the movement of material down a concentration
gradient (high to low), requires no energy input, and may or may not involve the use of protein carrier molecules.
Active transport moves material up the concentration gradient (low to high), requires energy input, and often involves the use of protein carrier molecules.
4. A – Epidermis B – Palisade Tissue C – Vascular Tissue D – Spongy Tissue E – Guard Cells F – Xylem G – Phloem 5. (a) The dark circles are likely air bubbles. (b) Air bubbles may be avoided by lowering the cover slip more gently onto the microscope slide. Skills 6. (a) No, the equation is not balanced. The numbers of atoms are not equal on both sides of the arrow.
There are 4 hydrogen atoms on the reactant side of the equation and only 2 on the product side. Also, there are 4 oxygen atoms on the reactant side and 3 on the product side.
The balanced equation should be : CH4 + 2 O2 CO2 + 2 H2O (b) Methane is a compound because it is a molecule composed of two different elements. 7. A – Revolving nose piece B – Arm C – Stage D – Ocular lens E – Condenser F – Objective lens G – Stage Clips H – Coarse- adjustment knob I – Light source J – Base K – Fine adjustment knob 8. 1st (e) Make sure the low-power objective lens is in place.
2nd (c) Place the slide on the stage and hold in place with clips. 3rd (d) Use the coarse-adjustment knob to bring the low-power objective lens close to slide. 4th (a) Rotate the nosepiece to the medium-power objective lens. 5th (b) Use the fine adjustment knob to bring the image into focus.
CHAPTER 7 Photosynthesis Starting Points (Page 6) 1. (a) 6CO2(g) + 6H2O(1) light energy chlorophyll C6H12O6(aq) + 6O2(g) (b) The O2 molecules produced by photosynthesis come from H2O molecules. (c) Water is used as both a reactant and a product in photosynthesis. It provides the protons and
electrons required for the dark reaction of photosynthesis. 2. Deciduous leaves are green in the summer due to the high levels of chlorophyll pigments in them and
are yellow, orange, or red in the fall because chlorophyll pigments are degraded at low temperatures, while the carotenoid and xanthophylls pigments are not.
3. Carbon fixation means the incorporation of carbon from carbon dioxide into carbohydrates such as the glucose molecule (C6H12O6).
4. ATP is produced during the first stage of photosynthesis (light reaction) and also by the plant cells own mitochondria which are able to perform cellular respiration.
5. Photosynthesis requires CO2, which is produced by cellular respiration. Photosynthesis produces O2 and glucose, which are the reactants in cellular respiration.
Exploration: Global Photosynthesis in Action (Page 7) (a) Answes will vary, but many students will suggest that more photosynthesis will occur in tropical
regions, and then decrease as you move north and south. (b) (c) The animation shows photosynthesis increasing and decreasing with the seasons in the northern
parts of the globe, so that rates here are higher at some times than in the more equatorial areas, for both land and oceans. The highest amount of photosynthesis in the oceans is in equatorial regions year-round, however.
(d) Answers will vary, but students are likely to be surprised at the extent to which photosynthesis varies, and by the large regions in Africa, Australia, and the Middle East that consistently have very low rates of photosynthesis.
(e) Changes in the seasons 7.1 CHLOROPLASTS AND PHOTOSYNTHETIC PIGMENTS Case Study: A Brief History of Photosynthesis Research (Pages 9-10) 1. Student answers will vary. Their timelines should include the following people and experiments. Year Name(s) Nationality Experiment Results Contributions Early 1600s
J.B. Van Helmont
Belgian Planted a willow tree and measured mass of tree and soil
The tree increased its biomass 74.4 kg while the soil lost only 0.060 kg.
Soil was not responsible for the increase in the tree’s mass.
1771 Joseph Priestly
English Burned candle in a container with a plant.
The candle went out, but after ten days the candle could be relit for a short time.
Plants release a gas into the air that support combustion.
1796 Jan Ingenhousz
Dutch Identified that the gas released by plants was oxygen, that sunlight is essential for

photosynthesis, and that carbon dioxide is the source of carbon in photosynthesis.
1882 T.W. Engleman
German Grew filamentous Spirogyra in different wavelengths of light and added aerobic bacteria.
The bacteria grew most in the red and blue-violet light.
Determined the action spectrum for photosynthesis.
1905 F.F. Blackman
English Measured the effect that changes in light intensity, CO2 concentration, and temperature have on the rates of photosynthesis in green plants
At low light, the rate photosynthesis could be increased by increasing light intensity but not by increasing temperature. At high light intensities, increasing temperature increase the rate of photosynthesis.
Photosynthesis occurs in two stages. 1. Photochemical stage 2. Biochemical stage that is affected by temperature
Controlled temperature and subjected plants to varying concentrations of carbon dioxide.
When the concentration of carbon dioxide increases, the rate of photosynthesis increases.
The rate of photosynthesis is proportional to the carbon dioxide concentration.
Early 1930s
C.B. Van Niel
Worked with purple sulfur bacteria.
The bacteria produced elemental sulfur.
The oxygen produced by photosynthesis comes from the splitting of water.
1938 S.M. Ruben M. Kamen
Use heavy isotope of oxygen, H2
18O(g)
Measured with a mass spectrometer the oxygen gas released from plants as 18O2(g)
Confirmed Van Niel’s findings.
2. (a) The candle consumes all the oxygen in the air of the container and releases carbon dioxide. (b) The plant produces oxygen and removes carbon dioxide by photosynthesis. 3. (a) Van Helmont measured the mass of a young willow tree and the soil it was planted in and then
performed the same measurements five years later. He found that the tree had gained 74.4 kg of mass, while the soil has lost only 0.0060 kg of mass.
(b) Van Helmont applied some controls in his experiment. He apparently made sure that only the tree grew in the pot (controlled for other plants growing in the pot); he added only water to the soil over the course of tree growth. Controls he should have applied include light and temperature conditions and air composition including humidity, etc.
Mini Investigation: Photosynthesis and Light (Page11) (a) (i) Oxygen is produced causing the leaf discs to float. (ii) No. If this experiment was performed in the dark, oxygen would not be produced. (b) This will add oxygen atoms to the solution. (c) They may not all float at the same time because their rates of photosynthesis will differ. (d) Instead of using a basic light bulb, use different coloured filters to shine different wavelengths of light
over different syringes.

Investigation 7.1: Separating Plant pigments from Leaves (Page 13; 25-26)
Purpose To separate some of the different pigments found in a plant leaf using paper chromatography
Problem How many different pigments in plant leaves can be separated out using paper chromatography?
Hypothesis Plant leaves contain chlorophyll a and chlorophyll b, carotenoids, and other accessory pigments, all of which have different chemical properties. Chromatography separates out compounds according to their solubility.
Prediction Some of the pigments in plant leaves will have different solubilities, and so will be separated from one another on the chromatograph.
Design Extracts of plant leaves will be applied to a piece of filter paper. This paper will be suspended extract-end down in chromatography solvent consisting of 90 % petroleum ether; 10 % acetone, v/v. The different pigments in the plant leaves will rise up the chromatography paper according to their solubility, and will then be identified according to the relative distance they traveled. The manipulated variable is the plant extract, and the responding variable is extent to which the various pigments dissolve in the solvent and travel up the filter paper. The controlled variables include the filter paper strip, the solvent solution, the time, and the starting point of each pigment on the filter paper.
Materials safety goggles laboratory apron spinach leaf chromatography solvent (90 % petroleum ether; 10 % acetone, v/v) filter paper, 12 cm long dime test tube rack scissors pencil chromatography tube with cork stopper cork stopper with a paperclip hook
Procedure 1. A piece of chromatography paper was suspended in the test tube such that the tip toughed the solvent.
The paper was held by the edges only, to avoid transferring oil from skin. 2. The chromatography paper was trimmed to a point at one end. At 3 cm above the point, a light pencil
line was drawn across the width of the filter paper. 3. A fresh spinach leaf was placed over the pencil line on the filter paper. 4. A dime was rolled across the leaf, so that the dime edge crushed the leaf tissue onto the filter paper
along the pencil line. 5. Step 4 was repeated several times until the pencil line was soaked with a thin, dark band of spinach
leaf extract. 6. The paper clip hook (attached to the stopper) was inserted into the top (straight) edge of the
chromatography paper strip. 7. A chromatography tube containing 3 mL of chromatography solvent was tightly stoppered and placed
upright in the test tube rack.
8. Under the fume hood, the cork stopper that was in the chromatography tube was replaced with the stopper to which the paper strip was attached (Figure 1). The tip of the paper just touched the solvent, and the line of leaf extract remained above the surface of the solvent. The chromatography paper did not touch the sides of the chromatography tube. The tube was tightly stoppered and placed upright in the test tube rack.
9. The movement of solvent and extract was observed for 15 to 30 min. The paper strip was removed before the solvent reached the top of the paper, and the stopper was replaced in the tube.
10. Still working under the fume hood, a pencil line was drawn across the paper strip at the uppermost point reached by the solvent before it dried. Also, each pigment band was marked and its colour quickly recorded. The paper strip was kept under the fume hood until it was completely dry.
(a) The distance from the original pencil line to the middle of each pigment band was measured, as well as the distance the solvent travelled from the pencil line.
Evidence Students should include their original chromatograph, with the end-point of each pigment marked, or a sketch of their chromatographs. The distances that the solvent front and that each pigment travelled should also be marked.
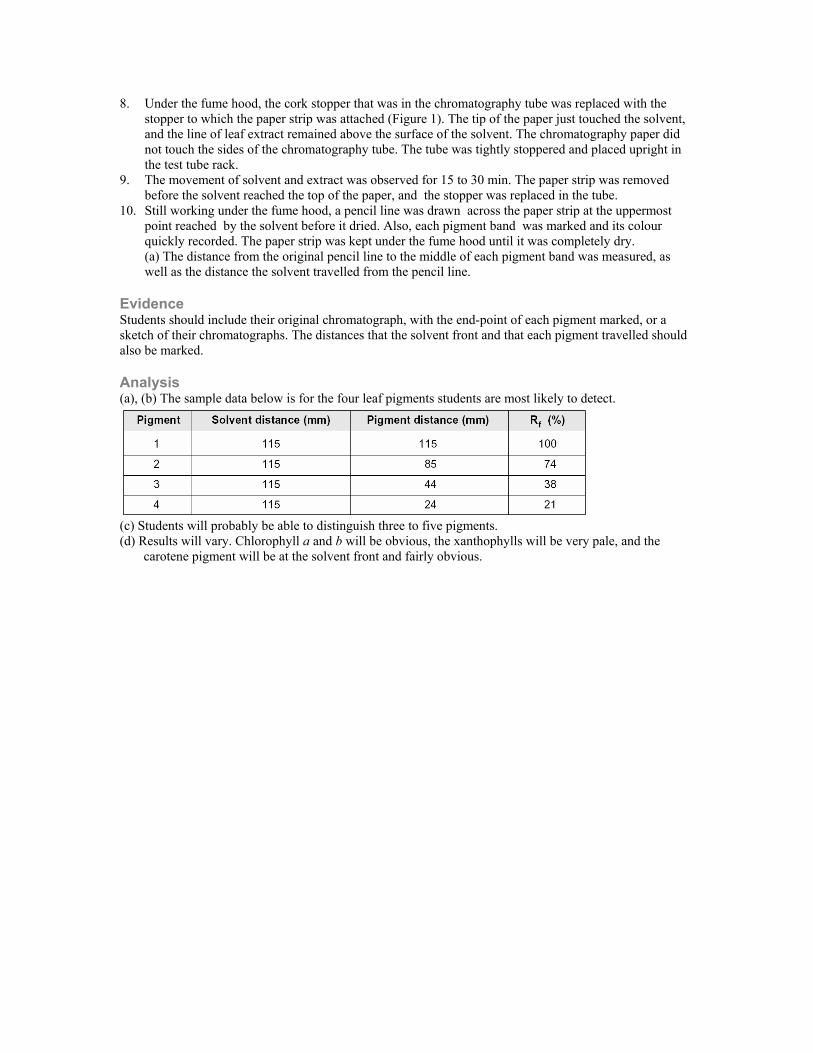
Analysis (a), (b) The sample data below is for the four leaf pigments students are most likely to detect.
(c) Students will probably be able to distinguish three to five pigments. (d) Results will vary. Chlorophyll a and b will be obvious, the xanthophylls will be very pale, and the
carotene pigment will be at the solvent front and fairly obvious.
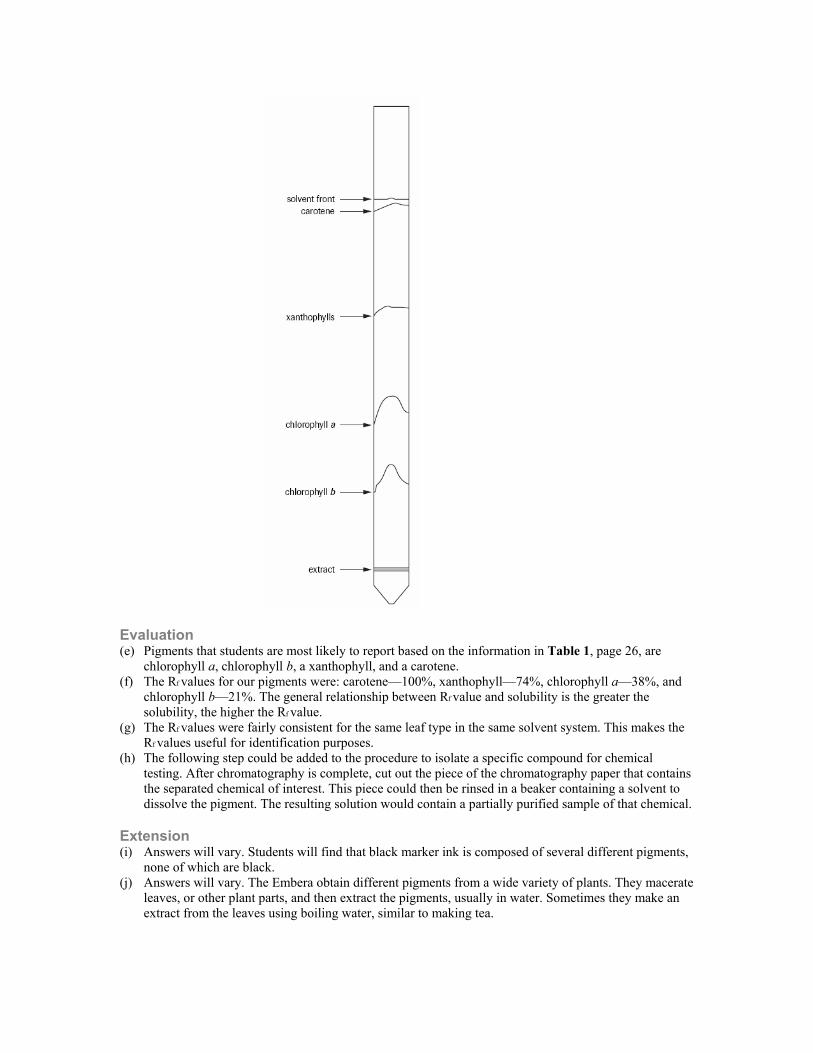
Evaluation (e) Pigments that students are most likely to report based on the information in Table 1, page 26, are
chlorophyll a, chlorophyll b, a xanthophyll, and a carotene. (f) The Rf values for our pigments were: carotene—100%, xanthophyll—74%, chlorophyll a—38%, and
chlorophyll b—21%. The general relationship between Rf value and solubility is the greater the solubility, the higher the Rf value.
(g) The Rf values were fairly consistent for the same leaf type in the same solvent system. This makes the Rf values useful for identification purposes.
(h) The following step could be added to the procedure to isolate a specific compound for chemical testing. After chromatography is complete, cut out the piece of the chromatography paper that contains the separated chemical of interest. This piece could then be rinsed in a beaker containing a solvent to dissolve the pigment. The resulting solution would contain a partially purified sample of that chemical.
Extension (i) Answers will vary. Students will find that black marker ink is composed of several different pigments,
none of which are black. (j) Answers will vary. The Embera obtain different pigments from a wide variety of plants. They macerate
leaves, or other plant parts, and then extract the pigments, usually in water. Sometimes they make an extract from the leaves using boiling water, similar to making tea.

Case Study: Using Satellite and Airborne Technology to Monitor photosynthesis and Productivity (Pages 14-15) 1. The amount of red and infrared light reflected by a plant indicates stress in a plant because stressed
plants having lower chlorophyll concentrations. 2. This is due to the difference in the amount of chlorophyll present in the plant. Healthy plants have more
chlorophyll, and therefore reflect less light. 3. The amount of red light and infrared light reflected by the plant. 4. It allows farmers to manage their fields in a more precise approach by allowing them to treat specific
areas of their field with the necessary requirements (fertilizer, drainage, etc). 5. Soil erosion, damage to fisheries and wildlife, threat to water supplies. This is a concern for Canada as
forestry is one of Canada’s largest industries, and soil erosion will affect future forests. 6. Remote monitoring allows for a better view of how an area is performing or responding to any changes
made in the area. 7. Precipitation levels will vary between the 2 regions with soil erosion being a much greater concern in a
tropical rainforest. 8. First Nations people have benefited from their forest reserves financially, socially, and spiritually. Forest
lands on reserves is very small, but they allow for Aboriginal communities to develop technical forestry expertise and business relationships off-reserve.
9. Answers will vary. Investigation 7.2: Is Light Necessary for Photosynthesis? (Pages 15; 27-28)
Purpose To determine whether plants require light in order to produce starch
Problem Do plants require light to produce starch?
Hypothesis (a) Plants require light in order to photosynthesize. Photosynthesis produces glucose which can be stored
in the form of starch. Therefore, light is required to produce starch in plants.
Prediction Only parts of the plant leaf that are exposed to light will produce starch.
Design A leaf on a living plant that has been left in a dark room for a period of time will be covered with folded piece black paper to prevent exposure to light. One half of the folded black paper will have a stencil cut out of it in the shape; this part will be placed over the top side of the leaf. The plant will be placed in sunlight for two days, and then the covered leaf and an uncovered leaf will be examined for the presence of starch using Lugol’s iodine solution. The manipulated variable is exposure to light. The responding variable is the presence of starch. The controlled variables include the plant used, the time, the volume and temperature of solvents used to process the leaves after removal, and the Lugol’s iodine solution used.
Materials safety goggles laboratory apron black paper scissors plant that has been kept in the dark for 48 h paperclips 250 mL beaker hot plate

two 20 mm x 200 mm test tubes wax pencil ethanol test-tube rack 2 glass, or plastic, petri dishes large test-tube holder Lugol’s iodine solution in dropper bottle
Procedure 1. Safety goggles and a lab apron were worn. 2. A rectangular piece of opaque black paper or photographic negative was folded in half to create two
squares. The left-half of the paper was left intact while on the right-half of the paper, a shape was cut out to create a stencil.
3. The plant was removed from the darkroom and the paper was fixed to a leaf using paper clips. The stencil side was on the top (Sun-facing side) of a leaf and the other piece of paper to the bottom of the same leaf.
4. The plant was placed on a sunny windowsill or under a bright light source for one or two days making sure that the covered leaf faced the Sun or light.
5. After two days, 100 mL of water was placed into the 250 mL beaker and heated to a boil on the hot plate.
6. Two 20 mm x 200 mm test tubes were labelled “light” and “without light.” 7. Fifty mL of ethanol was poured into each of the test tubes and the test tubes were then placed in a test-
tube rack. 8. The black paper or photographic negative was removed from the leaf and the leaf was placed into the
test tube labelled “without light.” 9. Another leaf from the plant was removed from the plant and placed into the test tube labelled “light.” 10. The test tubes were placed into the beaker containing boiling water and left until the there was no
colour remaining in the leaves. 11. One petri dish was labelled “light” and the other petri dish labelled “without light.” 12. Test-tubes were removed from the boiling water bath. 13. The ethanol was poured into a designated container designated and then the leaves were removed from
the test tubes and placed in their corresponding petri dishes. 14. Leaves were gently washed under running tap water. 15. A few drops of iodine solution was placed onto each leaf and leaves were observed for any colour
changes. 16. Plant leaves were discarded.
Evidence When the plant was exposed to light, the area of the plant that was left exposed turned dark when placed into a solutions of iodine. The areas that were not exposed to sunlight remained a lighter colour.
Analysis (b) Plants do require light to photosynthesize. Only the areas exposed to light reacted with the iodine test
to show the presence of starch. (c) They were kept in the dark to remove any starch that might be present in the leaf. This would result in
only the areas being exposed to light showing the positive starch test with iodine. (d) Ethanol removes the chlorophyll from the leaf. Since chlorophyll is soluble in ethanol, the leaf was
bleached out in order to see the starch present with the iodine test.
Evaluation (e) If the experiment is left for too long, the starch produced in the area exposed to the light will move
from a high concentration to a lower concentration in the shaded areas. (f) You could perform the test on the same leaf to look for areas exposed and not exposed. This will allow
you to compare the same leaf for any possible errors or differences.

(g) The same experiment could be done with different filters to expose the plants to different wavelengths of light. The same could be done with different light intensities. Microscopic analysis of leaf epidermal guard cells could be shown using an iodine stain to actually see the starch grains produced.
Section 7.1 Questions (Page 16) 1. plants, plantlike protests, cyanobacteria 2. (a) Light, or electromagnetic radiation, is a form of energy that travels at 3 x 10⁸ m/s in the form of
photons. (b) A photon is a small unit of energy of a particular wavelength. (c) As wavelength gets longer, the energy in a photon decreases, and as wavelength increases, the energy
increases. (d) Green light possesses a higher energy value than red light because it has a shorter wavelength. (e) The colour of light is determined by its wavelength. A higher wavelength has lower energy. Red light
is 750 nm whereas violet is 380 nm. 3. Plants regenerated the oxygen lost from the bell jar in his experiment by taking in carbon dioxide. 4. Blackburn noticed that photosynthesis was controlled by light intensity and temperature. 5. (a) Green plants contain chlorophyll a, chlorophyll b, carotenoids, xanthophylls, and anthocyanins. (b) Yellow-coloured pigments are only visible in autumn leaves, because the chlorophyll pigments
mask the yellow-coloured pigments the rest of the year. Plants stop producing chlorophyll in the autumn, so only the yellow, red, and brown colours are visible.
6. All photosynthetic organisms contain the molecule chlorophyll to capture electromagnetic radiation. 7. A – thylakoid B - stroma C - inner envelope membrane D - outer envelope membrane 8. They all have shorter wavelengths and therefore higher energies. 9. Gro-Lux, Plant-Gro, and other specialty fluorescent lamps are designed to provide a balance of red and
blue light suited for plant growth. However, in most cases, it is the quantity and brightness of light that is more important than the quality of the light for ideal plant growth conditions.
10. (a) Examples are: chlorophyll-containing gum, chlorophyll-containing shoe deodorizers, chlorophyll liquid tonic, pure planet chlorella: available at health food stores, wheat grass juice, bodymint
(b) (c) Pure plant chlorella • available as tablets • used to lower cholesterol, reverse progression of atherosclerosis, aid body in breakdown of heavy
metals, enable better absorption of polysaccharides in cell wall • allows for higher absorption and digestion of essential nutrients Wheat grass juice • in juice form or can be eaten directly (chewed) • increases hemoglobin production, helps prevent tooth decay, creates unfavourable environment for
“unfriendly” bacteria growth, neutralizes toxins, improves digestion, reduces high blood pressure. Bodymint • deodorant taken in tablet form • made of chlorphyllin, a special derivative of chlorophyll • one table taken each morning and evening 11. (a) Another green plastic is polyhydroxyalkanoate (PHA). PHA has been used to make biodegradable
razor handles and shampoo bottles. (b) Costs: Fossil fuels like oil, coat, or natural gas are required to power the process that produces
green plastics. The biological breakdown of green plastics releases carbon dioxide gas and methane gas into the atmosphere, both heat-trapping greenhouse gases. Growing plants for plastic production may compete for land resources with growing plants for food.
Benefits: Oil and gas are non-renewable resources. Oil-based plastics production consumes about 270 million tons of oil and gas every year. Plants, however, are biodegradable, renewable resources.
12. (a) Remote sensing systems can detect vegetation distribution, plant age, leaf pigmentation values, water status, mineral stresses, and the overall health of leaves.
(b) In many cases, farmers raise very large amounts of crops that cover a very large area. It would be too time consuming to assess overall plant health by personal observation. In some cases, plants are in inaccessible locations.
7.2 THE REACTIONS OF PHOTOSYNTHESIS
Investigation 7.3 How Does Carbon Dioxide Concentration Affect the Rate of Photosynthesis?
Problem 1. How do changes in light intensity, temperature, and CO2 concentration affect the rate of photosynthesis? 2. Students are likely to include variables such as the colour of light, type of plant, the relative greenness of
leaves (leaves kept in dark versus leaves kept in light), among others.
Hypothesis Since the energy from light drives photosynthesis, photosynthetic rate increases with light intensity. Since photosynthesis depends on the action of enzymes such as rubisco, and enzyme activity has an optimum temperature, photosynthetic rate has an optimum temperature. Since CO2 is a substrate in photosynthesis, photosynthetic rate increases with increases in CO2 concentration. Students hypotheses for their stated problem should connect the variable with a specific aspect of the biochemistry of photosynthesis.
Prediction (a) (i) By changing the level of the light intensity, the rate of photosynthesis will also change. If the light
intensity is reduced by 50%, the rate of photosynthesis will also decrease by 50%. (ii) As the temperature increases, the rate of photosynthesis will also increase. It will continue to
increase until an optimal temperature of 30 °C is reached. (iii) As the concentration of CO2 increases, the rate of photosynthesis will also increase. (iv) Answers will vary depending on the variable chosen by the students. Answers may involve colour
of plant, amount of pigment present, type of plant, etc .
Design The procedure provides a method for measuring the rate of photosynthesis of plants submersed in an aqueous sodium bicarbonate buffer (pH 7). Sodium bicarbonate is used as a source of CO2 (aq). This procedure was used to measure the rate of photosynthesis in four experiments. Fresh spinach (5 g) was cut up and loosely packed into a 20 mm �150 mm test tube. A 1% NaHCO3 solution was poured into the test tube, covering the spinach completely. A two-holed stopper was placed in the top of the test tube. One hole was connected to a 1 mL graduated pipette and the other hole was connected to a syringe. The mixture was allowed to equilibrate to the desired conditions for 5 minutes, before oxygen production was measured. A 200-watt light bulb was used as the light source, and a heat shield (water in a jar) was placed between the light source and the test tube containing the spinach. (i) The distance of the light source to the sample was changed. The manipulated variable was the intensity
of light, and the responding variable was the rate of photosynthesis, determined by counting the number of bubbles released in 1 min. The controlled variables were the temperature, the concentration of sodium bicarbonate, the volume of water, the mass of spinach, and the type of plant used.
(ii) The temperature at which the leaves were incubated was changed. The manipulated variable was the temperature, and the responding variable was the rate of photosynthesis, determined by counting the number of bubbles released in 1 min. The controlled variables were the light intensity, the concentration of sodium bicarbonate, the volume of water, the mass of spinach, and the type of plant used.
(iii) The concentration of CO2 was changed. The manipulated variable was the concentration of CO2 (concentration of sodium bicarbonate solution) and the responding variable was the rate of photosynthesis, determined by counting the number of bubbles released in 1 min. The controlled
variables were the temperature, light intensity, the volume of water, the mass of spinach, and the type of plant used.
(iv) The manipulated variable will change according to the problem that students propose. The responding variable will be the rate of photosynthesis, determined by counting the number of bubbles released in 1 min. The controlled variables will be light intensity, the temperature, the concentration of sodium bicarbonate, the volume of water, the mass of spinach, and the type of plant used.
Part I
Materials safety goggles laboratory apron 500 mL conical flask or large test tube plants (terrestrial plants or water plants) sodium bicarbonate buffer, pH 7 rubber stopper with glass tubing 50 mL burette distilled water 500 mL beaker utility stand and clamp rubber bulb ice sodium bicarbonate thermometer light intensity meter other materials as necessary 200 W light bulb
Procedure 1. The assay tube (with 1% NaHCO3 and 5 g of spinach) was placed into a water bath at 29°C for 5
minutes, and then oxygen production was measured for 15 minutes. 2. The assay was conducted at varying distances from the light source and the light intensity was
measured using a light meter. The same plant material was used for each light condition. Part II
Materials safety goggles laboratory apron 500 mL conical flask or large test tube plants (terrestrial plants or water plants) sodium bicarbonate buffer, pH 7 rubber stopper with glass tubing 50 mL burette distilled water 500 mL beaker utility stand and clamp rubber bulb ice sodium bicarbonate thermometer light intensity meter other materials as necessary 200 W light bulb

Procedure 1. The assay tube (with 1% NaHCO3 and 5 g of spinach) was placed into a water bath at 11°C for 5
minutes, and then oxygen production was measured for 15 minutes. 2. The assay was repeated at 20°C, 30°C, 40°C and 45°C. The same plant material was used for each
temperature. 3. The assays were performed under a light intensity of 21.6 klux. Part III
Materials safety goggles laboratory apron 500 mL conical flask or large test tube plants (terrestrial plants or water plants) rubber stopper with glass tubing 50 mL burette distilled water 500 mL beaker utility stand and clamp rubber bulb ice sodium bicarbonate thermometer light intensity meter other materials as necessary 200 W light bulb sodium bicarbonate buffer, pH 7 (0.0%, 1.0%, 2.0%, 3.0% and 4.0%)
Procedure 1. Five concentrations of NaHCO3 at 0.0%, 1.0%, 2.0%, 3.0% and 4.0% were prepared. 2. The assay tube (with 0% NaHCO3 and 5 g of spinach) was placed into a water bath at 21°C for 5
minutes, and then oxygen production was measured for 15 minutes. 3. The assay was repeated at 1.0%, 2.0%, 3.0% and 4.0% NaHCO3. The same plant material was used for
each concentration. 4. The assays were performed under a light intensity of 21.6 klux. Part IV Students may design and perform any of the above procedures.
Evidence (b) Part 1

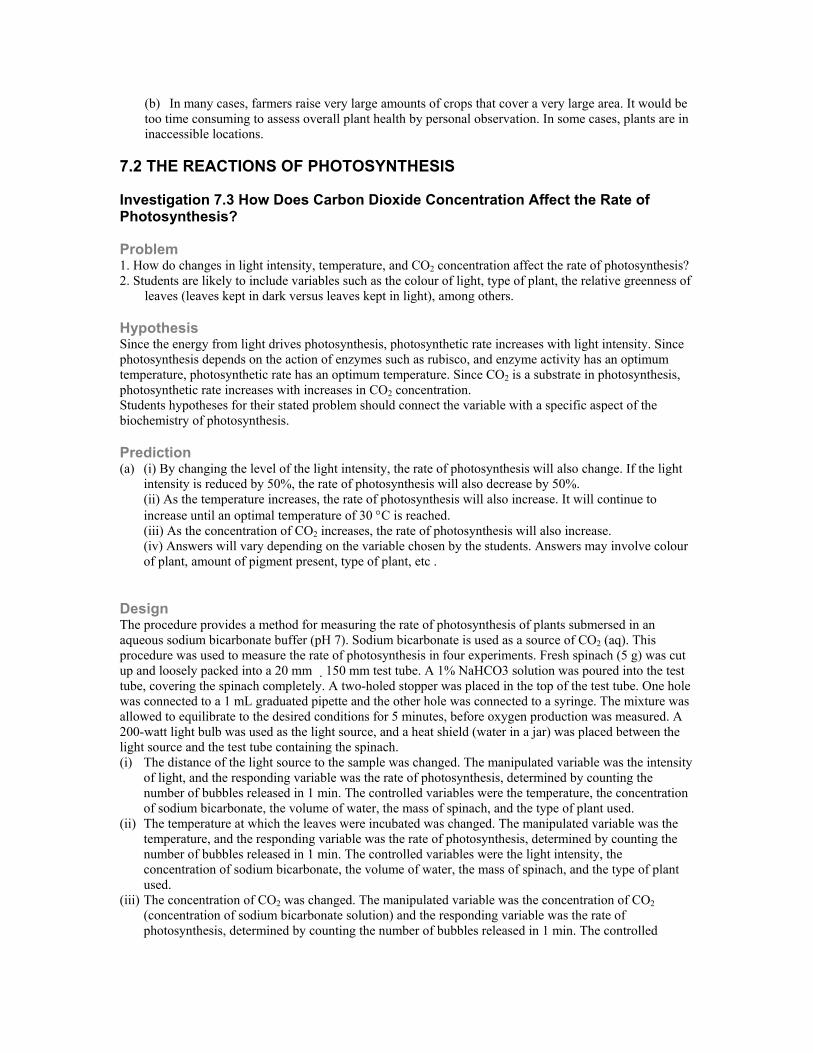
(e) Part I: As the light intensity increased, the rate of photosynthesis increased. At high intensities, the plant
material appeared to be becoming saturated, as evidence by the plateau in the graph. This suggests that the pigments were absorbing at their maximum capacity.
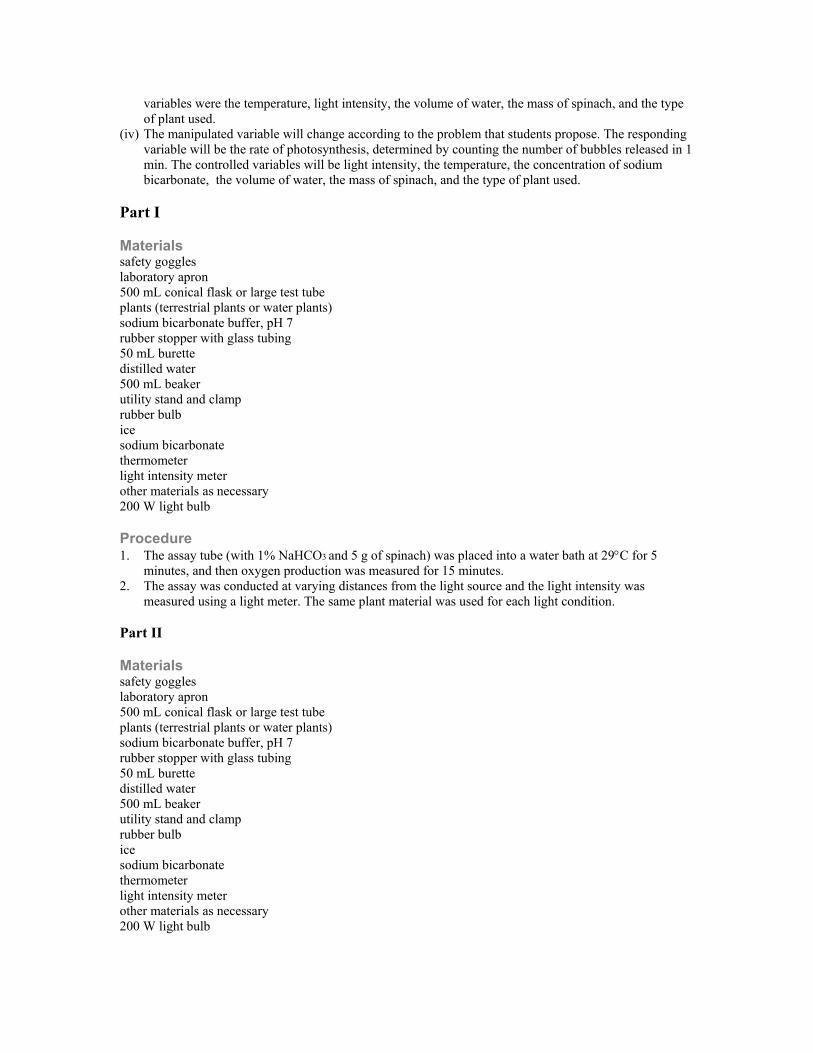
Part II: As the temperature increased to 30 ºC, the rate of photosynthesis increased. Above 30 ºC, the rate of
photosynthesis decreased. At high temperatures, the enzymes involved in photosynthesis may be denatured.
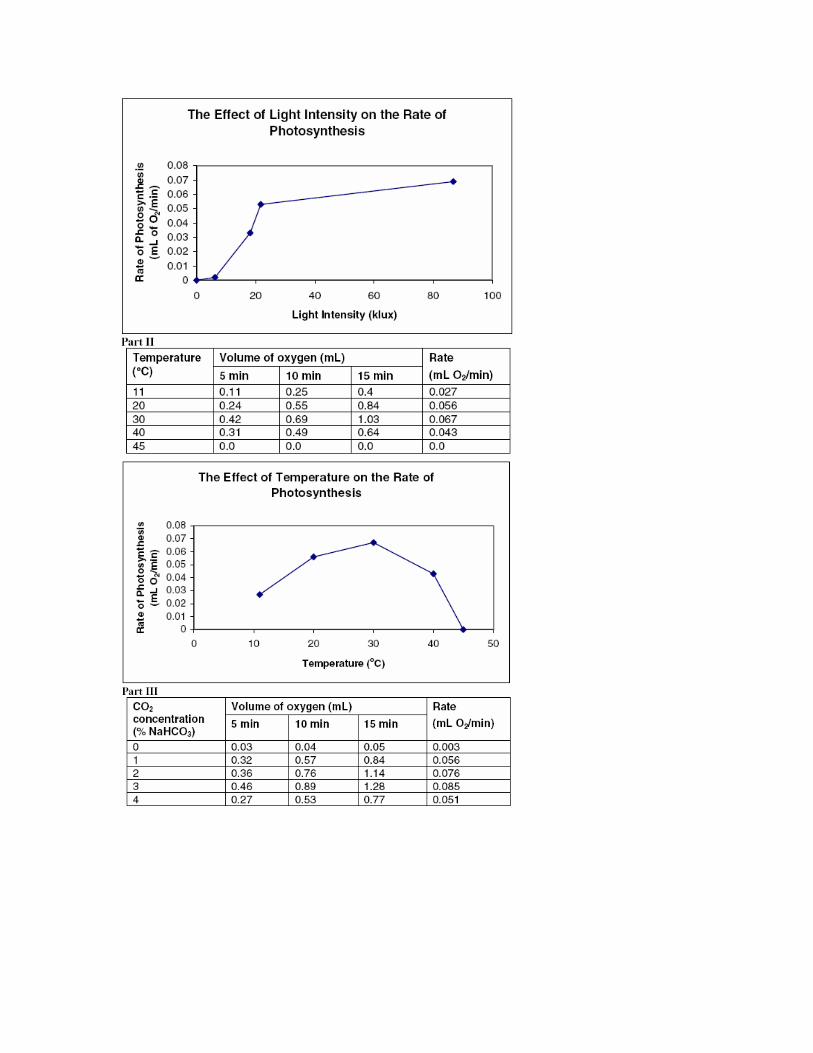
Part III: As the CO2 concentration increased, the rate of photosynthesis increased. However, at higher CO2
concentrations, the rate of photosynthesis decreased.
Analysis (d) All graphs should show an increase in photosynthetic rate as each variable increases levelling out at a
certain level then stabilizing at that level. For Temperature, photosynthesis should decrease after 30 degrees.
(e) The data collected show that for an increase in light intensity, there is a corresponding increase in the photosynthetic rate. There is also an increase in the photosynthetic rate as carbon dioxide and temperature increase; however once the temperature reaches 30°C, the photosynthetic rate decreases.
(f) Student results should be the same or similar to those of other groups.
Evaluation (g) The predictions made are deemed to be accurate. Some possible sources of error could have been the
distance plants were placed from a light source, maintaining an equal concentration of sodium bicarbonate throughout the experiment, and maintaining temperature in the ice bath or incubator. There are possible errors that may have arisen due to equipment problems, but these should be seen as negligible due to the correct experimental setup.
(h) The experiment could have been improved by being able to accurately monitor each plant using digital analysis that could monitor the effects on the same plant as the temperature, CO2 level, or light intensity was gradually increased.
(i) Use a bromothymol blue solution placed into a beaker of water. Blowing air into the container using a straw, the solution will turn a yellow colour. The solution could be placed into 2 separate test tubes, each containing a plant. Test tubes could be placed under different intensities of light. After 24 hours, the solution in the tube left exposed to the higher light intensity should have turned blue, whereas the colour of the solution in the test tube under low light intensity should still be yellow-green.
(k) The carbon dioxide level would be difficult to test as there is very little dissolved CO2 in water. Other compounds are used that contain molecules similar to CO2 that could be easily converted into CO2 by the plant.

Synthesis Using a glowing splint test would allow the experimenter to determine if the gas collected is oxygen. A wooden splint is lit and then extinguished to produce a glowing ember. The stick is then inserted into the test tube and if it ignites then the gas present is oxygen: oxygen is required for combustion. Explore an Issue: Artificial Photosynthesis (Page 22) 1. (a) No (b) Project Ingenhousz is an initiative designed to create light driven technologies and to use
photosynthetic organismsto clean up water supplies and to produce new medications and other useful chemicals,
(c) Some of the major applications would be advanced computer chips, molecular scale electronics, and light controlled enzymes. These types of technology would no require other energy sources.
(d) The major drawback of our current sources of energy is that they are not environmentally friendly, and are non-renewable. Harnessing the process of splitting water would result in a clean burning fuel (hydrogen) and also allow certain technologies to operate in much the same way as the process of photosynthesis beginning with the light reaction.
2. Answers will vary. Section 7.2 Questions (Page 24) 1. ATP is the short name for the molecule adenosine triphosphate. Composed of a ribose sugar, adenine,
and three phosphate groups, ATP is the usable form of chemical energy for all organisms; its phosphate bonds contain large amounts of stored energy.
2. Electron transport chains accept electrons and release energy that can be used to produce ATP. 3. 6 CO2 + 6 H2O 6 O2 + C6H12O6 4. (a) The primary function of photosynthesis is to capture electromagnetic radiation (solar energy) and
convert it to chemical potential energy. (b) The light reactions of photosynthesis occur on the thylakoid membranes of chloroplasts. (c) The products of noncyclic electron flow light reactions are oxygen, ATP and NADPH. (d) The products of the light reactions are used during the Calvin cycle. 5. (a) The gas released as a byproduct of the light reactions of photosynthesis is oxygen, O2(g). (b) The two water molecules are split to produce one molecule of oxygen gas. 6. The photosynthetic rate of the bean plant exposed to blue light will be much higher than the bean
exposed to green light because the pigments in the chloroplasts absorb more light in the blue wavelengths and the blue light has more energy than green light.
7. (a) The enzyme that catalyzes the carbon fixation reaction of the Calvin cycle is ribulose bisphosphate carboxylase/oxygenase (rubisco).
(b) The product of the rubisco enzyme is 3-phospholycerate. (c) The reaction involving rubisco occurs in the stroma of the chloroplast. 8. The final product of the Calvin cycle is glyceraldehydes 3-phosphate (G3P). G3P can be used in the
chloroplast to produce glucose, which can be stored as starch, or exported to the cytoplasm to be used directly or indirectly as sucrose in cellular respiration, or transported to other parts of the plant as sucrose by translocation. [Erratum: this question and answer is beyond the current version of this chapter, and will be deleted in the final resource.]
9. (a) 12 molecules of C02 are required. (b) 36 ATP molecules are required (18 for each 6-carbon glucose molecule) (c) 24 NADPH molecules are required (12 for each 6-carbon glucose molecule) 10. Student solutions will vary, and should be a basic diagram showing in inputs and outputs of
photosynthesis in language that a grade 4 student would understand. Sample answer: carbon dioxide (what we breathe out) + water + light energy (from the Sun) → glucose (sugar for energy) + oxygen (what we breath in), perhaps with the inputs and outputs drawn on the leaves of a green plant.

CHAPTER 7 SUMMARY Make a Summary (Page 30) 1. Note that this sample answer shows far more detail that is required: this diagram will be revised for the final resource.
2. Students’ responses to the Starting Point questions should show greater understanding of the concepts
than at the start of the chapter, and they should be able to describe any misconceptions that they have since revised.
CHAPTER 7 REVIEW (Pages 31-33) Part 1 1. B 2. B 3. B 4. D 5. A 6. B 7. A 8. D 9. C 10. B 11. (a) The shorter the wavelength, the greater the energy; therefore, a shorter wavelength has more
energy. (b) Plants can use wavelengths from 380 nm to 480 nm and from 620 nm to 680 nm in photosynthesis. 12. There are various pigments found in the antenna complexes to capture light energy of all visible
wavelengths. 13. (a) Old textbooks often referred to the Calvin cycle as the dark reactions because it did not appear to
require light to occur.

(b) The term “dark reaction” is misleading because, although the Calvin cycle does not require light energy directly, it does require light to activate and produce certain Calvin cycle enzymes.
14. Line A represents the light-response curve for a sun plant because the Calvin cycle has increased its capacity and can handle higher levels of light before it reaches its light-saturation point.
15. (a)
(b) Purple, blue, orange, and red are least visible in spinach leaves. This is because these colours are
most absorbed by the pigments in spinach. (c) Green and yellow wavelengths are the least absorbed in the pigment extract. Chlorophyll reflects
the green light rather than absorbing it. (d) The pigment most responsible for the peak at 670 nm is chlorophyll a. (e) There are no peaks between 500 nm and 620 nm, because chlorophyll does not absorb green light –
it reflects it. (f) According to Figure 9 on page 13, chlorophyll a, chlorophyll b, are responsible for absorption in the
range of 400 nm to 480 nm. 16. The H+ ion concentration in the pH 4 solution does not favour the transport of H+ ions and thus does
not allow for the creation of ATP. Once placed in the pH 8 solution, the H+ ions have dropped resulting in an environment that will allow for the movement of H+ and the formation of ATP.
17. She did not want the light reactions to create additional H+. 18. The products of the Calvin cycle would appear due to the abundance of H+ ions that would create
NADPH that could be used in the Calvin Cycle. 19. Hydrogen fuel is clean burning (water is the product of its combustion), whereas methane produces
carbon dioxide. 20. Both of these products are extremely flammable. 21. The plants would be removing CO2 from their environment in order to produce the methane. This
would result in an equilibrium between the CO2 added to the environment and the CO2 removed. 22. (a) First, raw biomass is converted into a variety of gaseous, liquid, or solid fuels before it is used to
generate electricity. The conversion process can be chemical (e.g., conversion of plant oils into diesel fuel), thermochemical (e.g., heating plant matter may convert it into solids, liquids, or gases such as methane), or biochemical (e.g., using bacteria and yeast, plant carbohydrates may be converted into ethanol that is used as a fuel). The heat generated by combusting the various fuels is used to convert liquid water into steam, which then turns the turbines of a generator in a thermal generating plant.
(b) Approximately 5.9% of Canada’s electricity is produced using biomass. The potential to increase this proportion is very large.
(c) The cost of this process is that it is more difficult to convert biomass to fuel. However, the production of these fuels is more environmentally friendly and it is a renewable energy source.
Of the 1.1 billion acres of farmland in North America (Canada and the United States), approximately 150 million acres could be dedicated to energy farming without appreciably affecting food production. For example, using hay pellets as a biofuel:
• A total biomass production capacity of 480 million tonnes could be achieved. • Biofuel contains approximately 18.5 GJ of energy/tonne.

• About 8.9 billion GJ (an energy equivalent of 1.5 billion barrels of oil) could be produced each year.
• Heat costs for natural gas, oil, and electricity are approximately $10 to $13/GJ USD. • Heat costs for hay pellet biofuel would be approximately $2/GJ USD. • Hay pellet biofuels can provide lower and more stable heating costs while dramatically cutting
greenhouse gas emissions.