unit 11: more tests for averages (chapter 27)
TRANSCRIPT
Unit 11: More tests for averages (Chapter 27)
Marius Ionescu
11/17/2011
Marius Ionescu () Unit 11: More tests for averages (Chapter 27) 11/17/2011 1 / 19
Other types of tests:
1 Di�erence between two samples
Null hypothesis: the samples come from boxes with the same average.
2 Experiments:
Null hypothesis: the treatment does not a�ect the response.
Marius Ionescu () Unit 11: More tests for averages (Chapter 27) 11/17/2011 2 / 19
Other types of tests:
1 Di�erence between two samples
Null hypothesis: the samples come from boxes with the same average.
2 Experiments:
Null hypothesis: the treatment does not a�ect the response.
Marius Ionescu () Unit 11: More tests for averages (Chapter 27) 11/17/2011 2 / 19
Other types of tests:
1 Di�erence between two samples
Null hypothesis: the samples come from boxes with the same average.
2 Experiments:
Null hypothesis: the treatment does not a�ect the response.
Marius Ionescu () Unit 11: More tests for averages (Chapter 27) 11/17/2011 2 / 19

Other types of tests:
1 Di�erence between two samples
Null hypothesis: the samples come from boxes with the same average.
2 Experiments:
Null hypothesis: the treatment does not a�ect the response.
Marius Ionescu () Unit 11: More tests for averages (Chapter 27) 11/17/2011 2 / 19
Di�erences
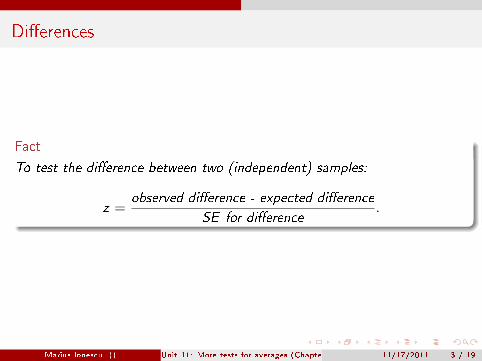
Fact
To test the di�erence between two (independent) samples:
z =observed di�erence - expected di�erence
SE for di�erence.
Marius Ionescu () Unit 11: More tests for averages (Chapter 27) 11/17/2011 3 / 19

What is SE for di�erence?
Fact
If a = SE of the �rst quantity and b =SE of the second quantity and the
quantities are independent then
SE for di�erence =√a2 + b2.
Marius Ionescu () Unit 11: More tests for averages (Chapter 27) 11/17/2011 4 / 19

What is SE for di�erence?
Fact
If a = SE of the �rst quantity and b =SE of the second quantity and the
quantities are independent then
SE for di�erence =√a2 + b2.
Marius Ionescu () Unit 11: More tests for averages (Chapter 27) 11/17/2011 4 / 19
Example
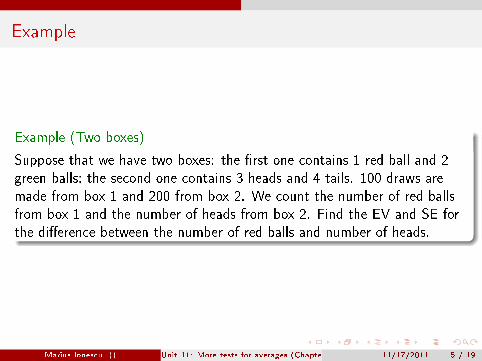
Example (Two boxes)
Suppose that we have two boxes: the �rst one contains 1 red ball and 2green balls; the second one contains 3 heads and 4 tails. 100 draws aremade from box 1 and 200 from box 2. We count the number of red ballsfrom box 1 and the number of heads from box 2. Find the EV and SE forthe di�erence between the number of red balls and number of heads.
Marius Ionescu () Unit 11: More tests for averages (Chapter 27) 11/17/2011 5 / 19
Example
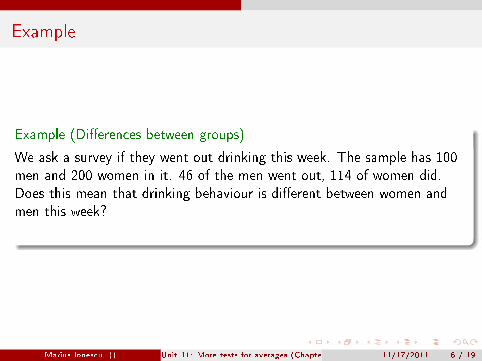
Example (Di�erences between groups)
We ask a survey if they went out drinking this week. The sample has 100men and 200 women in it. 46 of the men went out, 114 of women did.Does this mean that drinking behaviour is di�erent between women andmen this week?
What is the Null hypothesis?
Marius Ionescu () Unit 11: More tests for averages (Chapter 27) 11/17/2011 6 / 19

Example
Example (Di�erences between groups)
We ask a survey if they went out drinking this week. The sample has 100men and 200 women in it. 46 of the men went out, 114 of women did.Does this mean that drinking behaviour is di�erent between women andmen this week?
What is the Null hypothesis?
Marius Ionescu () Unit 11: More tests for averages (Chapter 27) 11/17/2011 6 / 19
Example
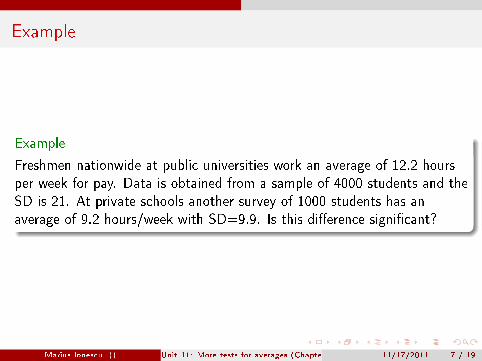
Example
Freshmen nationwide at public universities work an average of 12.2 hoursper week for pay. Data is obtained from a sample of 4000 students and theSD is 21. At private schools another survey of 1000 students has anaverage of 9.2 hours/week with SD=9.9. Is this di�erence signi�cant?
Marius Ionescu () Unit 11: More tests for averages (Chapter 27) 11/17/2011 7 / 19
Experiments
Fact (Experiments)
Suppose that we have a treatment group (1st sample) and a control group
(2nd sample) and we want to compute the average response (or percentage
that respond if the answer is qualitative). There are two problems here:
1 Selection is not independent (unless they actually chose for control
and then chose for treatment); treating them as if they are
independent reduces the spread in the di�erence.
2 The draw is without replacement; this usually in�ates the spread (SE).
Fortunately the two cancel each other and we can still use the methods
that we learned to study experiments.
Marius Ionescu () Unit 11: More tests for averages (Chapter 27) 11/17/2011 8 / 19
Experiments
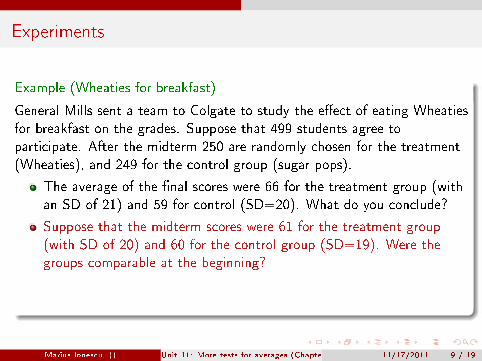
Example (Wheaties for breakfast)
General Mills sent a team to Colgate to study the e�ect of eating Wheatiesfor breakfast on the grades. Suppose that 499 students agree toparticipate. After the midterm 250 are randomly chosen for the treatment(Wheaties), and 249 for the control group (sugar pops).
The average of the �nal scores were 66 for the treatment group (withan SD of 21) and 59 for control (SD=20). What do you conclude?
Suppose that the midterm scores were 61 for the treatment group(with SD of 20) and 60 for the control group (SD=19). Were thegroups comparable at the beginning?
What if the midterm scores were 68 for treatment (with SD=21) and59 for control (SD=20)?
Marius Ionescu () Unit 11: More tests for averages (Chapter 27) 11/17/2011 9 / 19
Experiments
Example (Wheaties for breakfast)
General Mills sent a team to Colgate to study the e�ect of eating Wheatiesfor breakfast on the grades. Suppose that 499 students agree toparticipate. After the midterm 250 are randomly chosen for the treatment(Wheaties), and 249 for the control group (sugar pops).
The average of the �nal scores were 66 for the treatment group (withan SD of 21) and 59 for control (SD=20). What do you conclude?
Suppose that the midterm scores were 61 for the treatment group(with SD of 20) and 60 for the control group (SD=19). Were thegroups comparable at the beginning?
What if the midterm scores were 68 for treatment (with SD=21) and59 for control (SD=20)?
Marius Ionescu () Unit 11: More tests for averages (Chapter 27) 11/17/2011 9 / 19
χ2-test
Fact
Often a test of signi�cance will involve many comparisons instead of one.
For example:
Is a die loaded?
Is the distribution of voting behavior random?
Marius Ionescu () Unit 11: More tests for averages (Chapter 27) 11/17/2011 10 / 19
χ2-test
Fact
Often a test of signi�cance will involve many comparisons instead of one.
For example:
Is a die loaded?
Is the distribution of voting behavior random?
Marius Ionescu () Unit 11: More tests for averages (Chapter 27) 11/17/2011 10 / 19
χ2-test
Fact
Often a test of signi�cance will involve many comparisons instead of one.
For example:
Is a die loaded?
Is the distribution of voting behavior random?
Marius Ionescu () Unit 11: More tests for averages (Chapter 27) 11/17/2011 10 / 19
χ2-statistics
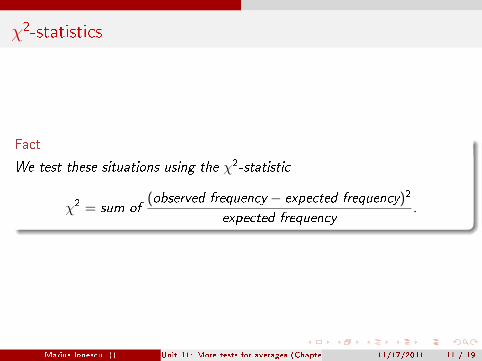
Fact
We test these situations using the χ2-statistic
χ2 = sum of(observed frequency− expected frequency)2
expected frequency.
Marius Ionescu () Unit 11: More tests for averages (Chapter 27) 11/17/2011 11 / 19
Example
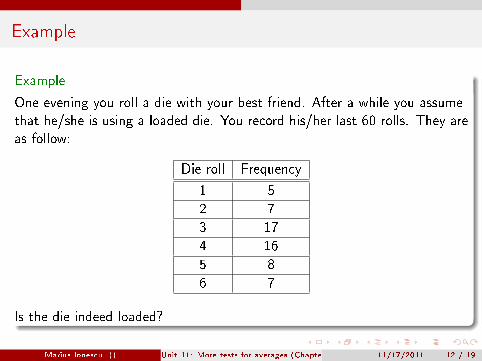
Example
One evening you roll a die with your best friend. After a while you assumethat he/she is using a loaded die. You record his/her last 60 rolls. They areas follow:
Die roll Frequency
1 5
2 7
3 17
4 16
5 8
6 7
Is the die indeed loaded?
Marius Ionescu () Unit 11: More tests for averages (Chapter 27) 11/17/2011 12 / 19
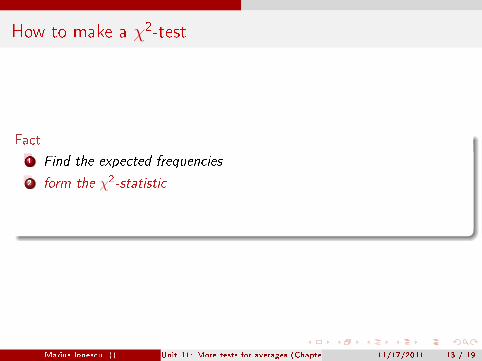
How to make a χ2-test
Fact
1 Find the expected frequencies
2 form the χ2-statistic
3 The degrees of freedom = n − 1.
4 Find the P-value
Marius Ionescu () Unit 11: More tests for averages (Chapter 27) 11/17/2011 13 / 19
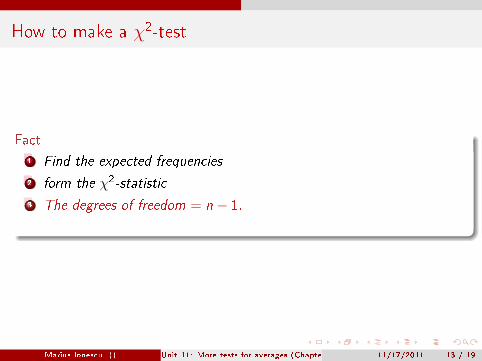
How to make a χ2-test
Fact
1 Find the expected frequencies
2 form the χ2-statistic
3 The degrees of freedom = n − 1.
4 Find the P-value
Marius Ionescu () Unit 11: More tests for averages (Chapter 27) 11/17/2011 13 / 19
How to make a χ2-test
Fact
1 Find the expected frequencies
2 form the χ2-statistic
3 The degrees of freedom = n − 1.
4 Find the P-value
Marius Ionescu () Unit 11: More tests for averages (Chapter 27) 11/17/2011 13 / 19
How to make a χ2-test
Fact
1 Find the expected frequencies
2 form the χ2-statistic
3 The degrees of freedom = n − 1.
4 Find the P-value
Marius Ionescu () Unit 11: More tests for averages (Chapter 27) 11/17/2011 13 / 19

How to make a χ2-test
Fact
1 Find the expected frequencies
2 form the χ2-statistic
3 The degrees of freedom = n − 1.
4 Find the P-value
Marius Ionescu () Unit 11: More tests for averages (Chapter 27) 11/17/2011 13 / 19
Example
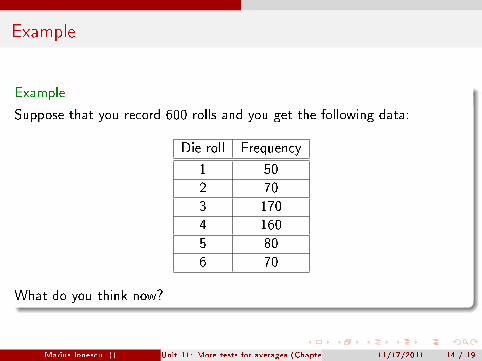
Example
Suppose that you record 600 rolls and you get the following data:
Die roll Frequency
1 50
2 70
3 170
4 160
5 80
6 70
What do you think now?
Marius Ionescu () Unit 11: More tests for averages (Chapter 27) 11/17/2011 14 / 19
Example
Example
Let's see if the age distribution of jurors is representative of the entirecounty:
Age %of county # of jurors Expected
21-40 42% 5
41-50 25% 9
51-60 16% 19
61 and over 17% 33
100% 66
What is the Null hypothesis?
Marius Ionescu () Unit 11: More tests for averages (Chapter 27) 11/17/2011 15 / 19
Example
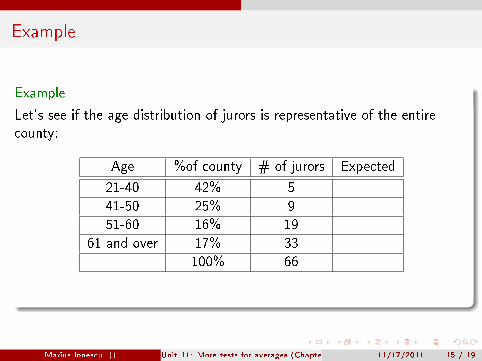
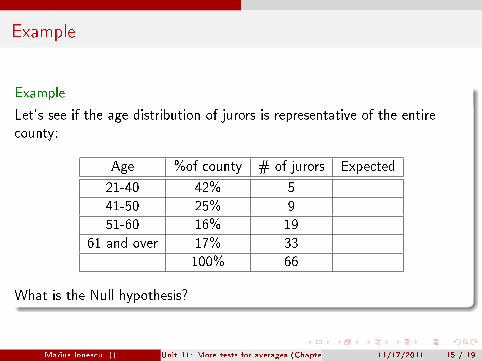
Example
Let's see if the age distribution of jurors is representative of the entirecounty:
Age %of county # of jurors Expected
21-40 42% 5
41-50 25% 9
51-60 16% 19
61 and over 17% 33
100% 66
What is the Null hypothesis?
Marius Ionescu () Unit 11: More tests for averages (Chapter 27) 11/17/2011 15 / 19
Test of Independence
Fact (Question)
Are two category variables correlated?
Usually data is given as a table.
Null hypothesis is that the two variables are independent; that is, all
groups have same proportions.
Marius Ionescu () Unit 11: More tests for averages (Chapter 27) 11/17/2011 16 / 19
Test of Independence
Fact (Question)
Are two category variables correlated?
Usually data is given as a table.
Null hypothesis is that the two variables are independent; that is, all
groups have same proportions.
Marius Ionescu () Unit 11: More tests for averages (Chapter 27) 11/17/2011 16 / 19
Test of Independence
Fact (Question)
Are two category variables correlated?
Usually data is given as a table.
Null hypothesis is that the two variables are independent; that is, all
groups have same proportions.
Marius Ionescu () Unit 11: More tests for averages (Chapter 27) 11/17/2011 16 / 19
Test of Independence
Fact
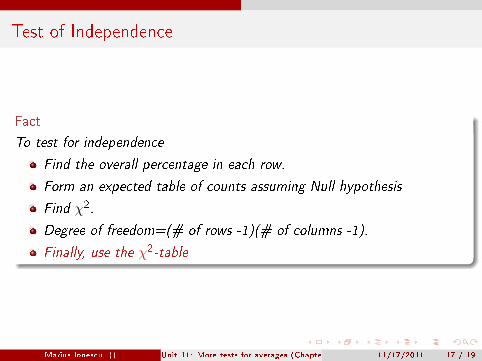
To test for independence
Find the overall percentage in each row.
Form an expected table of counts assuming Null hypothesis
Find χ2.
Degree of freedom=(# of rows -1)(# of columns -1).
Finally, use the χ2-table
Marius Ionescu () Unit 11: More tests for averages (Chapter 27) 11/17/2011 17 / 19
Test of Independence
Fact
To test for independence
Find the overall percentage in each row.
Form an expected table of counts assuming Null hypothesis
Find χ2.
Degree of freedom=(# of rows -1)(# of columns -1).
Finally, use the χ2-table
Marius Ionescu () Unit 11: More tests for averages (Chapter 27) 11/17/2011 17 / 19
Example
Example
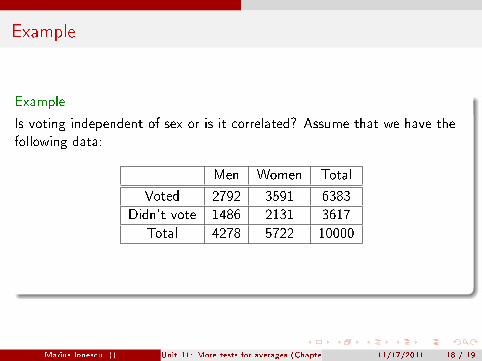
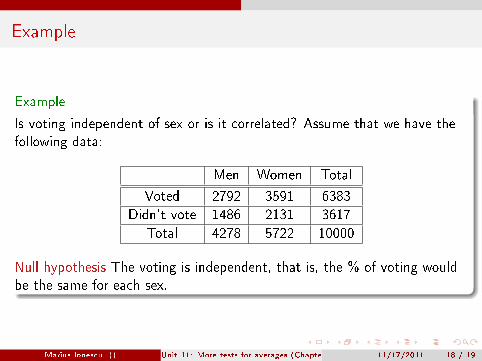
Is voting independent of sex or is it correlated? Assume that we have thefollowing data:
Men Women Total
Voted 2792 3591 6383
Didn't vote 1486 2131 3617
Total 4278 5722 10000
Null hypothesis The voting is independent, that is, the % of voting wouldbe the same for each sex.
Marius Ionescu () Unit 11: More tests for averages (Chapter 27) 11/17/2011 18 / 19
Example
Example
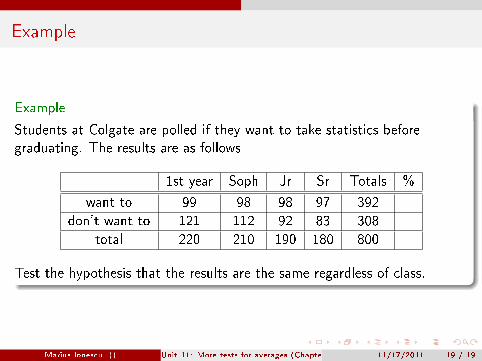
Students at Colgate are polled if they want to take statistics beforegraduating. The results are as follows
1st year Soph Jr Sr Totals %
want to 99 98 98 97 392
don't want to 121 112 92 83 308
total 220 210 190 180 800
Test the hypothesis that the results are the same regardless of class.
Marius Ionescu () Unit 11: More tests for averages (Chapter 27) 11/17/2011 19 / 19