union vs. right-to-work states
TRANSCRIPT

Union vs. Right-to-Work States
Lloyd Corder, Ph.D.CorCom, Inc. | Carnegie Mellon University
A Comparison of Members’ Opinions of Union Performance, Management and Practices
AUGUST 2017


AUGUST 2017
EMPLOYEEFREEDOMWEEK.COM
Union vs. Right-to-Work States
Lloyd Corder, Ph.D.CorCom, Inc. | Carnegie Mellon University
A Comparison of Members’ Opinions of Union Performance, Management and Practices
National Employee Freedom Week is a nationwide campaign offering an unparalleled focus on the freedoms
union employees have to opt out of union membership. Featuring a diverse and nonpartisan coalition of
state-based and national organizations, National Employee Freedom Week empowers union employees
with information to make the decision about union membership that’s best for them, including identifying
non-union alternatives that better suit their needs.

2 | NATIONAL EMPLOYEE FREEDOM WEEK
EXECUTIVE SUMMARYAs the union landscape continues to shift—with membership rates declining, increasing adoption of Right-to-Work laws, and other changes—it is unclear whether employees working in non-Right-to-Work states (henceforth “Union”) fare better than their Right-to-Work counterparts. Some argue that union employees in Right-to-Work states are at a significant disadvantage and not able to experience the same level of pro-tection as employees in Union states.
To gauge union employee opinions about the role and effectiveness of the unions representing them, a national survey of 1,687 union members was administered to identify any differences between Union (943) and Right-to-Work (744) states in terms of contract negotiations, protec-tions, and operations.
More than one-third of union members thought their most recent contract negotiations were very effective (Union, 36%; Right-to-Work, 36%) and said they were very satisfied with the out-come (Union, 36%; Right-to-Work, 35%). Union members in both Union and Right-to-Work states rated their current contracts’ working conditions, number of hours, job security, health-care benefits, wages and overtime wages highly. While many were satisfied with workplace train-ing, vacation days, sick days, and their pension plans, about half of employees rated programs for continuing education, promotion systems, pay raises for cost of living increases, and bonus pay poorly.
A majority said that their union provided several protections, including protecting them from em-ployer actions (discipline or firing), ensuring their employer abides by their contract, and improv-ing safety at their workplace. One-in-ten experi-enced a contract violation (Union, 10%; Right-to-Work, 8%), with about half pleased with how it was resolved (Union, 48%; Right-to-Work, 52%).
Although union members surveyed in Union and Right-to-Work states mirrored each other demo-
graphically, only nominal differences were found between the responses from employees in Union and Right-to-Work states. In several instances, a slightly higher percentage of workers from Right-to-Work states provided favorable ratings of their union’s role and performance.
• For instance, 68 percent of union mem-bers in Right-to-Work states were satisfied with the wage component of their contract, compared to 67 percent in Union states;
• 77 percent of union members in Right-to-Work states were satisfied with the working conditions set by their contract, compared to 71 percent of those in Union states;
• Similarly, 59 percent of union members in Right-to-Work states reported that their union was helpful in improving workplace safety, compared to 57 percent in Union states.
Union members in both Right-to-Work and Union states expressed broad support for the opportu-nity to regularly vote on whether to keep rep-resentation from their current union (a process often called “recertification.”) Over 70 percent of all respondents approved of such a legal change. Additionally, union members were supportive of a policy called “Workers Choice,” where em-ployees who opt out of the union can represent themselves with employers.
The data from this study suggests that there is no appreciable difference between union em-ployees from Union and Right-to-Work states and that union employees in Right-to-Work states are not inadvertently suffering from the prohibition of union security agreements. There is also significant interest among union employ-ees in all states in certain labor law reforms that would give them greater ability to select their representation.

UNION VS. RIGHT-TO-WORK STATES | 3
SURVEYING THE IMPACT OF UNION REPRESENTATION IN UNION AND RIGHT-TO-WORK STATESThe union membership rate, or the percentage of wage and salary workers who were union mem-bers, was 10.7 percent in 2016 and has declined steadily in recent decades.1 This year, Kentucky and Missouri adopted Right-to-Work laws, bring-ing the total number to 28 states that have en-acted legislation that prohibits union security agreements that compel employees in unionized workplaces to pay dues or fees, as a condition of their employment.
Some suggest that the decline in union member-ship has been exacerbated by Right-to-Work laws. Opponents argue that these laws contribute to lower wages and benefits, provide less employee protections, and discourage companies from ne-gotiating with their workforce.
It is unclear whether these claims are representative of the experiences of employees from unionized workforces. The issue is: Do employees from Union and Right-to-Work states have differing opinions on the effectiveness of their union representation?
To better understand how employees from union-ized workforces view the role and effectiveness of their unions, a national survey of 1,687 union em-ployees was administered in Union and Right-to-Work states.
METHODSAn online survey of 1,687 union employees was conducted between April 24, 2017 and May 2, 2017. Table 1 (on the next page) provides a demo-
graphic profile of employees from 23 Union states and the District of Columbia, as well as Missouri and Kentucky, who only recently enacted Right-to-Work laws (943, MOE: +/- 3%), and 25 Right-to-Work (744, MOE: +/- 4%) states (that had Right-to-Work laws effective at the time of the survey).2
Participants were recruited through Amazon’s Me-chanical Turk and screened for union workplaces. To ensure an adequate cross-section, state quo-tas were established based on current union rep-resentation. As the survey progressed, states that received the target response rate were closed on the survey form. Completed responses were fur-ther verified by union name and local number. Each qualified respondent was paid $2 for partici-pating in this survey.
Overall, the samples for Union and Right-to-Work states mirror each other demographically, sug-gesting that the respondents from Union and Right-to-Work states are very similar in this sam-ple. The majority are dues paying members, work for private sector unions, and primarily represent service providers or goods-producing companies. Respondents included a mix of genders and total household incomes. On average, they paid $402.73 in annual union dues and are represented by 254 different unions (including separate union locals).
CONTRACT NEGOTIATIONSEmployees were asked to rate how effective their union was in its most recent contract negotiation, how satisfied they are with the outcome of those negotiations and how they view the various ele-ments of their current contract.
Negotiation ProcessAs Table 2 (on the next page) shows, employees give their union high marks for both how well the contract was negotiated and what was in it, re-gardless of whether they are in Union or Right-to-Work states. About one-in-ten thought they were not effective and were not at all satisfied.
1U.S. Bureau of Labor Statistics, “Economic News Release,” January 26, 2017.2 In separate results not reported here, 117 surveyed members who had opted out of their union were excluded. The results did not change meaningfully, with no more than a one-percentage-point swing occurring.

4 | NATIONAL EMPLOYEE FREEDOM WEEK
**
*As of December 31, 2016.

UNION VS. RIGHT-TO-WORK STATES | 5
While about one-third thought the negotiations were “very effective” or are “very satisfied” with the outcome of their most recent negotiation, there are some differences based on demographics:
• More individuals working for goods-produc-ing companies think their union is “very effec-tive” (Union, 42%; Right-to-Work, 48%) and are “very satisfied” (Union, 44%; Right-to-Work, 45%) that those in other sectors.
• Respondents from households with higher incomes—especially those in Union states (44%)—were more likely to rate the negoti-ations as being “very effective” than those from Right-to-Work states (32%).
• Likewise, those who pay annual union dues of $2,000 or more were much more likely to say that their union was “very effective” in its most recent negotiation (Union, 48%; Right-to-Work, 54%) than those paying less.
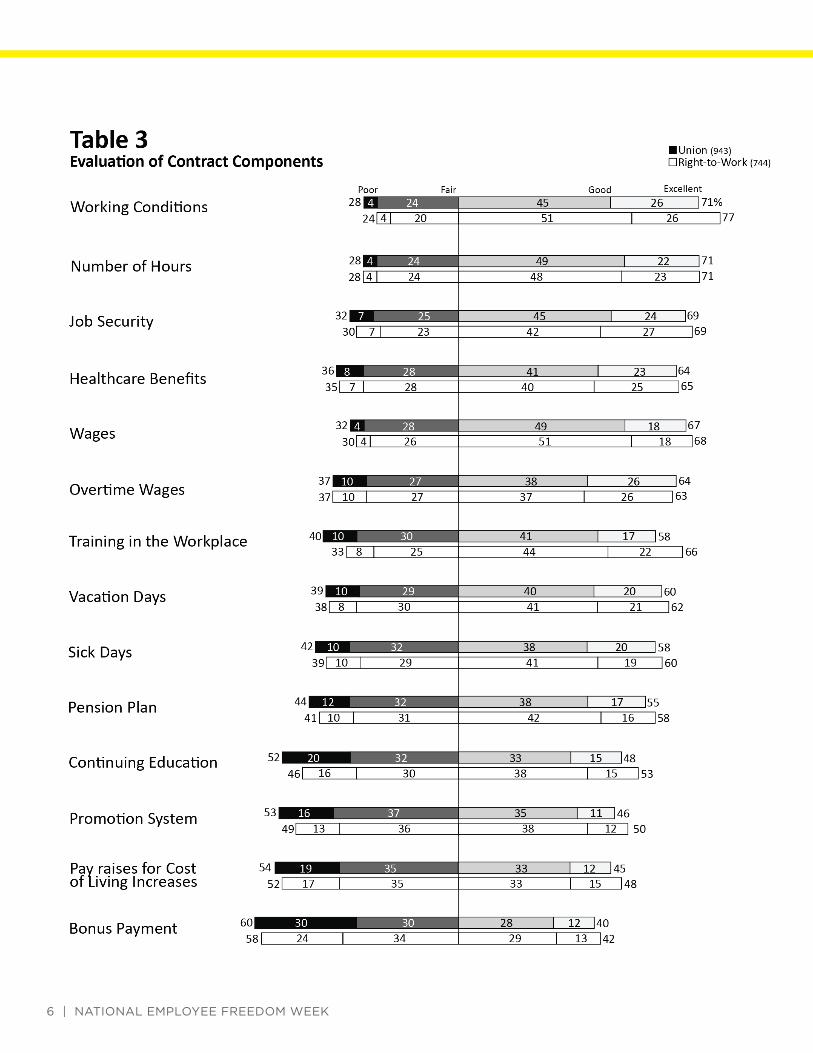
Evaluation of Current ContractNext, employees were asked to rate 14 compo-nents of their current contract, which is presented in Table 3 (on next page). Overall, union employ-ees gave mixed reviews about their contracts.
• Most employees thought that their work-ing conditions, number of hours, job securi-ty, healthcare benefits, wages, and overtime were the strongest parts of their contracts, and a majority rated them as “good” to “ex-cellent,” regardless of Union or Right-to-Work state.
• Employees were divided on training in the workplace, vacation days, sick days, and their pension plans, with most rating them pos-itively, but sizeable groups rating them as “fair” or “poor.”
• Programs for continuing education, promo-tion systems, pay raises for cost of living in-creases, and bonus payments were the weak-est parts of employees’ contracts, with a majority rating them as “fair” or “poor.”
When considering differences by Union and Right-to-Work states, these results suggest that employees in Right-to-Work states are equal-ly—if not more—pleased with the components of their contract. In most cases, union employees in Right-to-Work states rated each component a few points higher than did union employees from Union states. Conversely, more union employees in Union than Right-to-Work states tended to be dissatisfied with components of their contract, rating each item as “fair” or “poor.”
6 | NATIONAL EMPLOYEE FREEDOM WEEK

UNION PROTECTIONSIn addition to negotiating contracts, unions pro-vide workers several other benefits, including resolving disputes, improving safety, and other important working conditions and rules. Respon-dents were asked if their union was helpful in these areas. Table 4 provides a summary of the findings and again shows nominal differences between Union and Right-to-Work states, with slightly more union employees from Right-to-Work states saying their union was helpful.
Overall, two-thirds find their union helpful in pro-tecting them from employer actions, such as dis-cipline or firing (Union, 66%; Right-to-Work, 69%) and ensuring their employer abides by their con-tract (Union, 63%; Right-to-Work, 65%). More than half believe their union helps improve safety at their workplace (Union, 57%; Right-to-Work, 59%) and resolves conflicts with co-workers and man-agement (Union, 56%; Right-to-Work, 56%). Less than half think their union helps get proper train-ing for their job (Union, 41%; Right-to-Work, 45%).
CONTRACT VIOLATIONS AND OFFICER ELECTIONSIn both Union and Right-to-Work states, about one-in-ten union employees reported contract
violations, as shown in Table 5, on the next page (Union, 10%; Right-to-Work, 10%). By type of union membership, one-in-four of agency fee payers or religious objectors reported a problem, regardless of whether they were in a Union or Right-to-Work state (Union, 25%; Right-to-Work, 23%).
Of those who said there were violations, half were pleased with how their union addressed this prob-lem (Union, 48%; Right-to-Work, 52%), while many were not (Union, 42%; Right-to-Work, 40%) or were unsure (Union, 10%; Right-to-Work, 8%).
Additionally, these employees from Right-to-Work states were significantly more pleased with both local and national union officer election results. Regardless of the state, nearly two-thirds or more were pleased with the results of local union officer elections (Union, 64%; Right-to-Work, 80%), while half or more were pleased with their national union officer elections (Union, 51%; Right-to-Work, 66%).
UNION MANAGEMENTFinally, employees were asked their opinions about union management, in terms of manage-ment compensation, national leadership and union selection, and opting out, which are presented in Table 6 (on page 9).
UNION VS. RIGHT-TO-WORK STATES | 7

8 | NATIONAL EMPLOYEE FREEDOM WEEK
Management CompensationUnion employees from Union and Right-to-Work states are in general agreement on union manage-ment compensation. While over half think they are paid “just enough” (Union, 59%; Right-to-Work, 57%), one-fourth think they are paid “too much” (Union, 28%; Right-to-Work, 27%), and one-in-ten think they are paid “too little” (Union, 12%; Right-to-Work, 15%).
National LeadershipLess than half of union employees report that they participated in their national union officer elections (Union, 45%; Right-to-Work, 46%). Con-sidering differences by respondent profile, about half of dues paying members participated (Union, 46%; Right-to-Work, 47%), while agency fee pay-ers or religious objectors are more likely to have participated in union officer elections (Union, 55%; Right-to-Work, 55%) than are those who have ex-ercised the right to opt out of their union (Union, 25%, Right-to-Work, 26%).
Additionally, less than half of union employees believe that their national leadership shares their concerns (Union, 43%; Right-to-Work, 49%), while one-in-five do not (Union, 18%; Right-to-Work, 17%) and one-third are unsure (Union, 38%; Right-to-Work, 33%). Those who pay $2,000 or more in annual dues are more likely to agree (Union, 52%; Right-to-Work, 57%) than are those who pay less than $500 annually (Union, 41%; Right-to-Work, 39%).
Union Selection and Opting OutThree-fourths of surveyed union employees think that they should have the right to vote regular-ly on which union represents them (Union, 71%; Right-to-Work, 74%).
Furthermore, most agree that employees who opt out of union membership and stop paying dues should represent themselves in negotiations (Union, 77%; Right-to-Work, 77%).

UNION VS. RIGHT-TO-WORK STATES | 9

20 | NATIONAL EMPLOYEE FREEDOM WEEK
NOTES


EMPLOYEEFREEDOMWEEK.COM