unified monitoring webinar with dustin whittle
TRANSCRIPT
Unified Monitoring Dustin Whittle, Developer Evangelist


Uptime is critical for enterprises and consumers

Performance impacts the bottom line
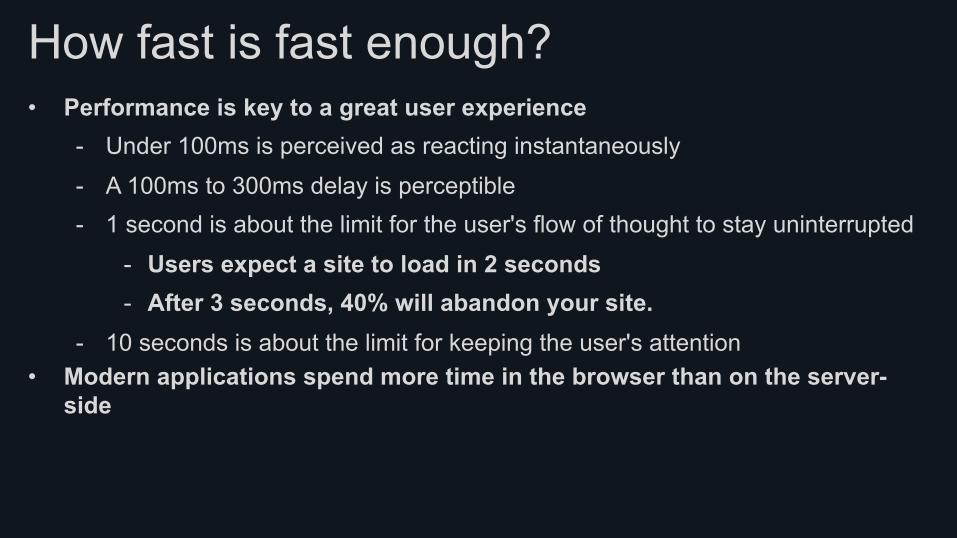
How fast is fast enough? • Performance is key to a great user experience
- Under 100ms is perceived as reacting instantaneously
- A 100ms to 300ms delay is perceptible - 1 second is about the limit for the user's flow of thought to stay uninterrupted
- Users expect a site to load in 2 seconds - After 3 seconds, 40% will abandon your site.
- 10 seconds is about the limit for keeping the user's attention • Modern applications spend more time in the browser than on the server-
side
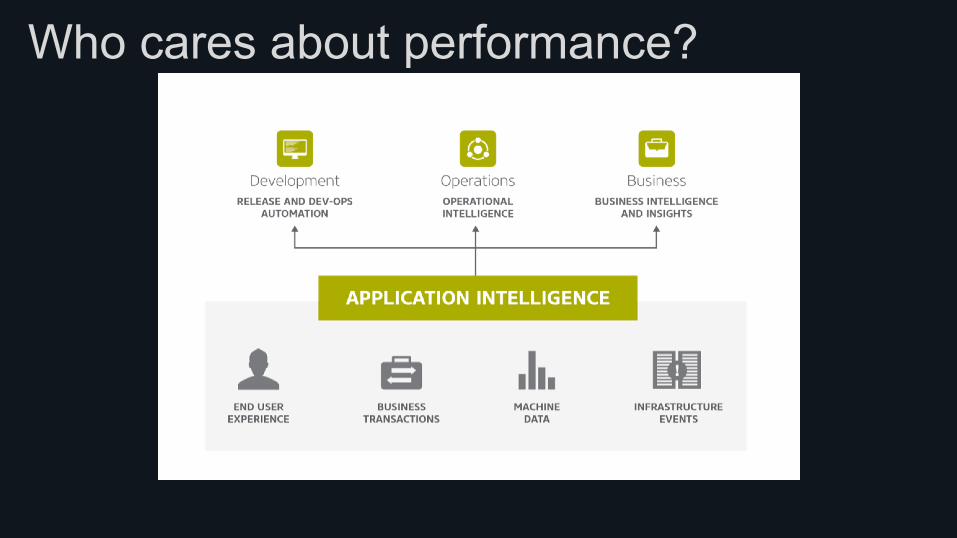
Who cares about performance?

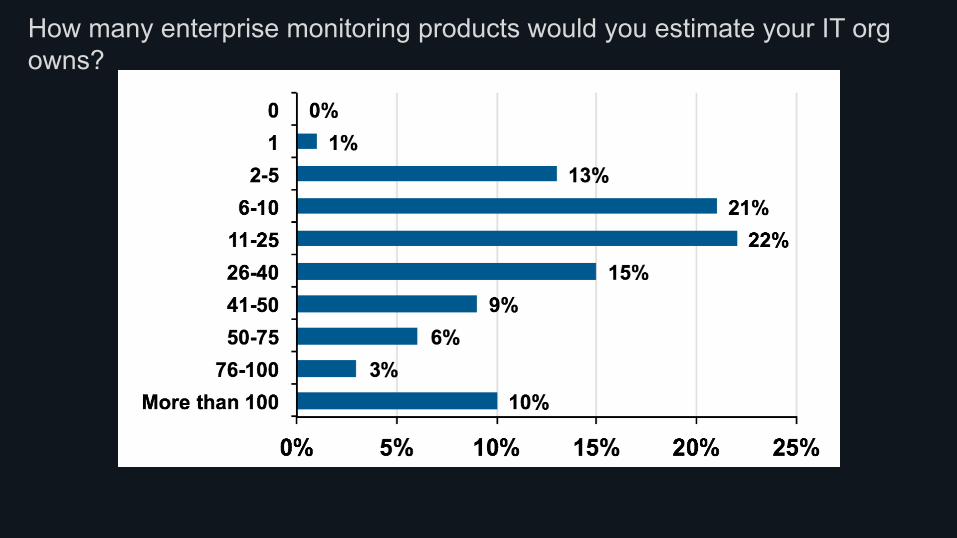
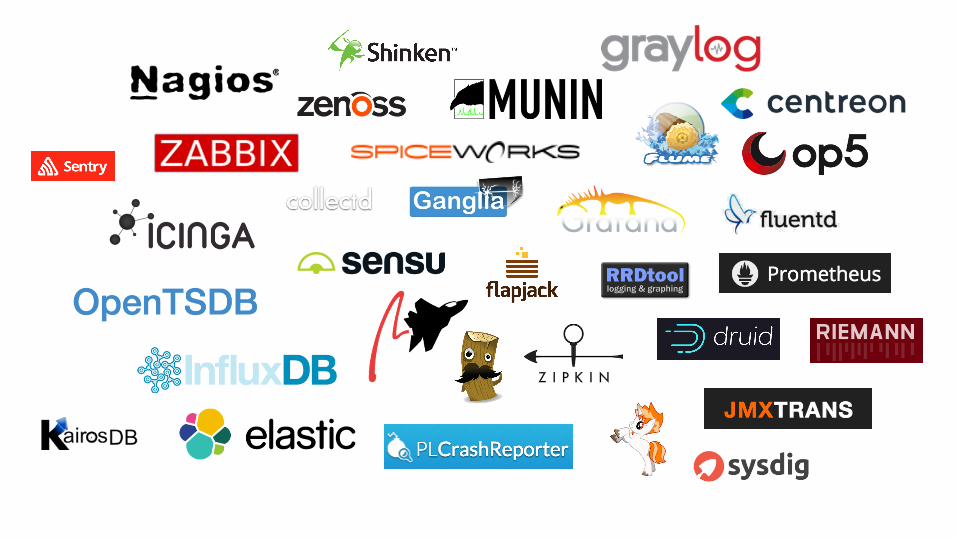
How many enterprise monitoring products would you estimate your IT org owns?
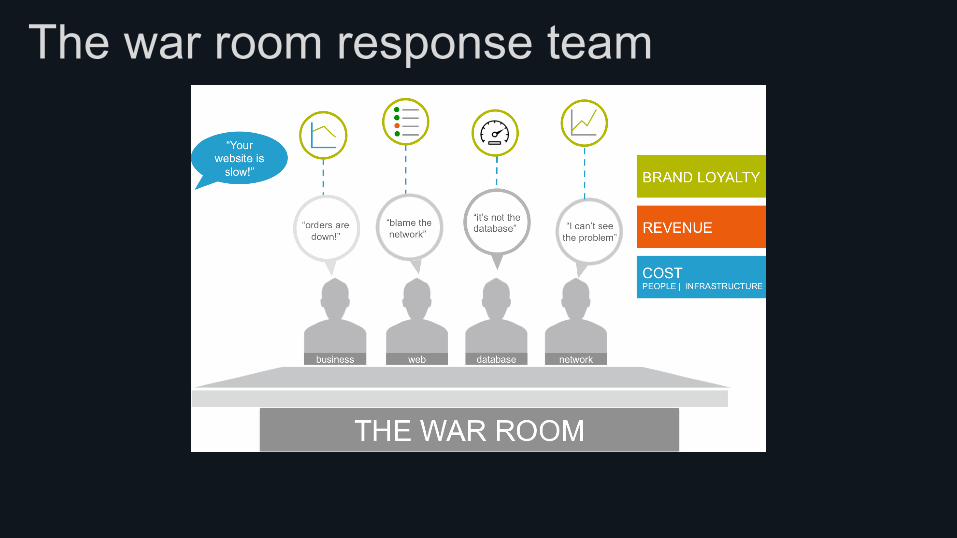
The war room response team
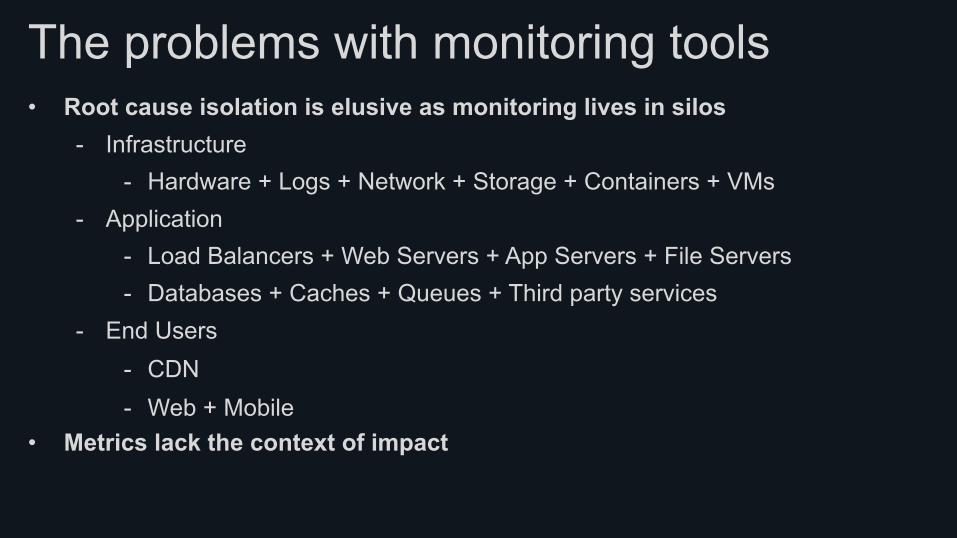
The problems with monitoring tools • Root cause isolation is elusive as monitoring lives in silos
- Infrastructure - Hardware + Logs + Network + Storage + Containers + VMs
- Application - Load Balancers + Web Servers + App Servers + File Servers - Databases + Caches + Queues + Third party services
- End Users - CDN - Web + Mobile
• Metrics lack the context of impact
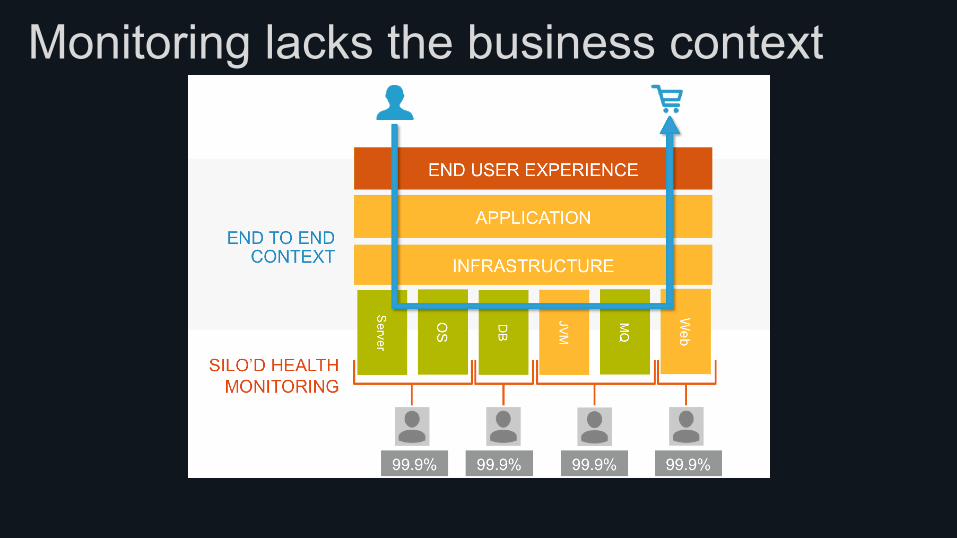
Monitoring lacks the business context
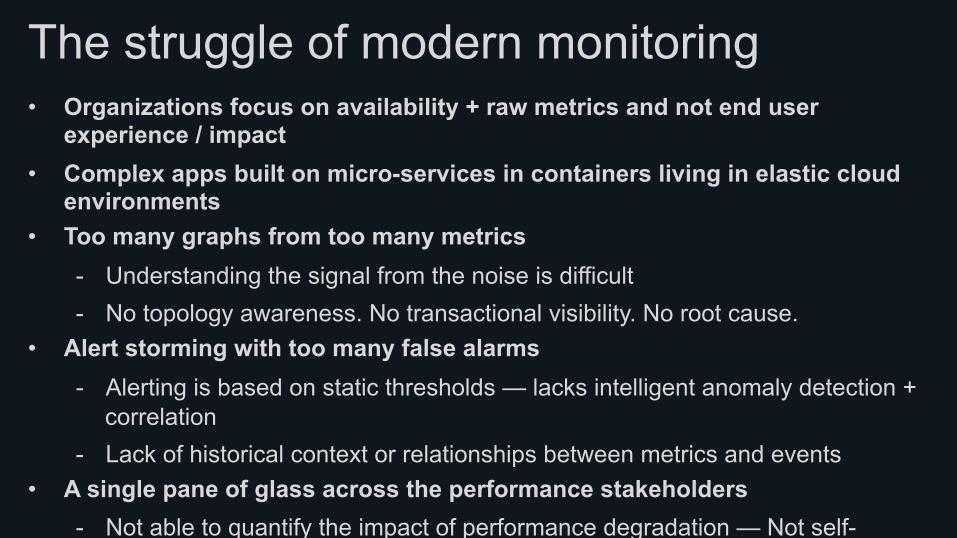
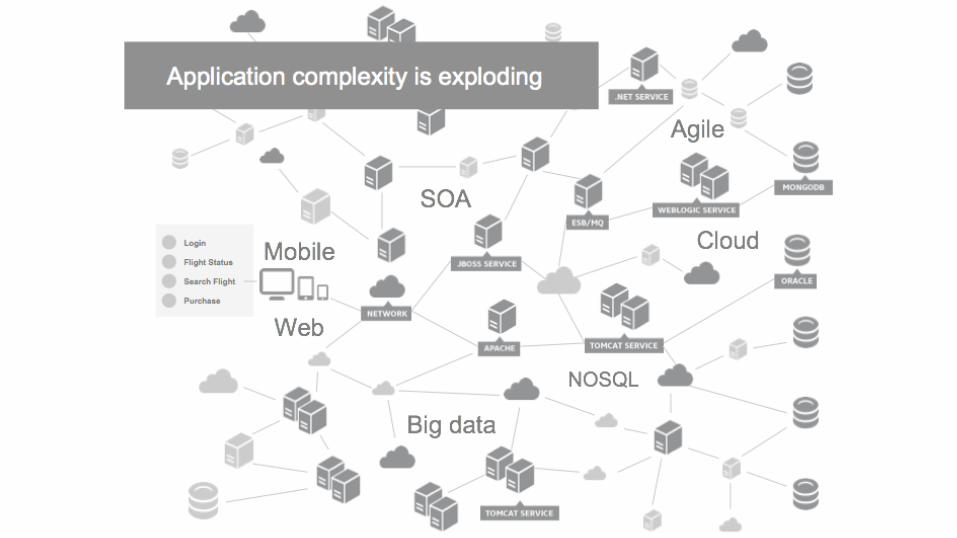
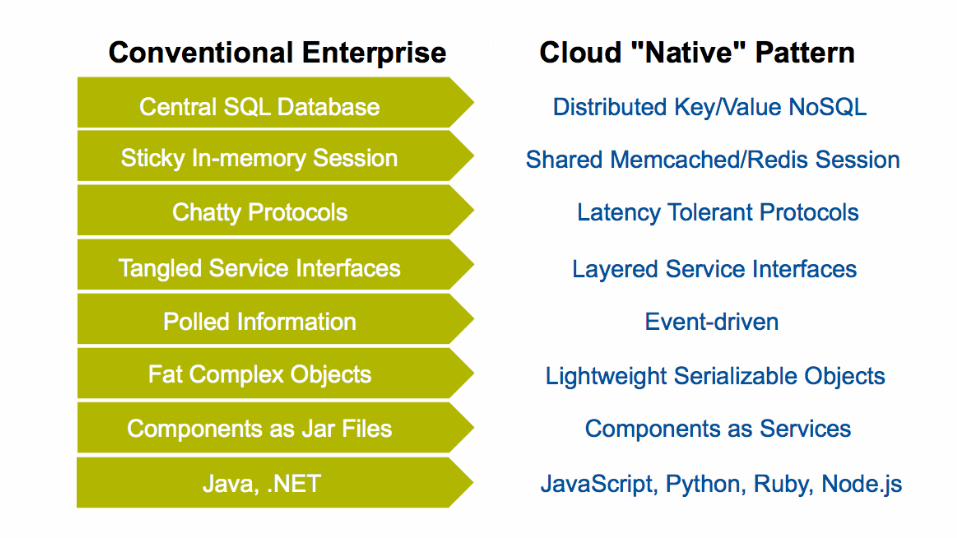
The struggle of modern monitoring • Organizations focus on availability + raw metrics and not end user
experience / impact • Complex apps built on micro-services in containers living in elastic cloud
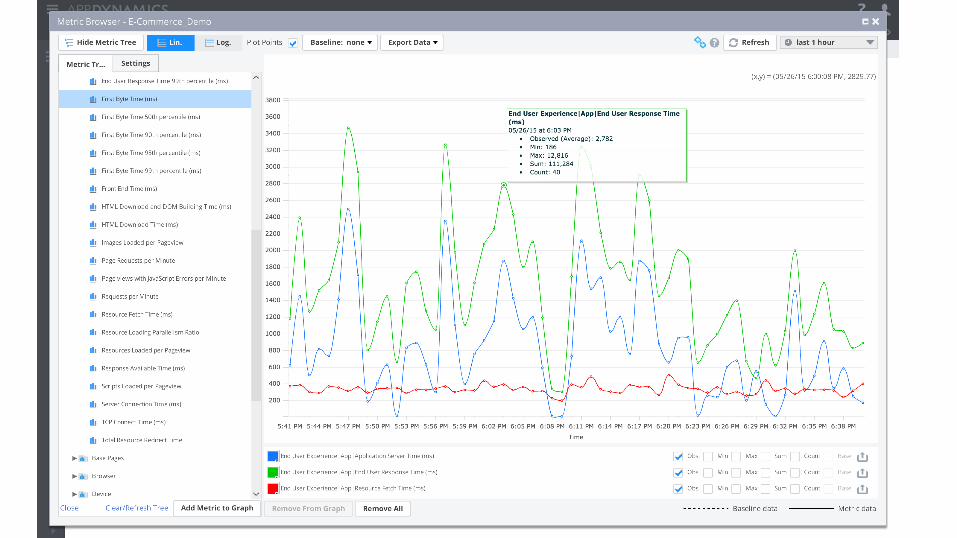
environments • Too many graphs from too many metrics
- Understanding the signal from the noise is difficult - No topology awareness. No transactional visibility. No root cause.
• Alert storming with too many false alarms - Alerting is based on static thresholds — lacks intelligent anomaly detection +
correlation - Lack of historical context or relationships between metrics and events
• A single pane of glass across the performance stakeholders - Not able to quantify the impact of performance degradation — Not self-
service
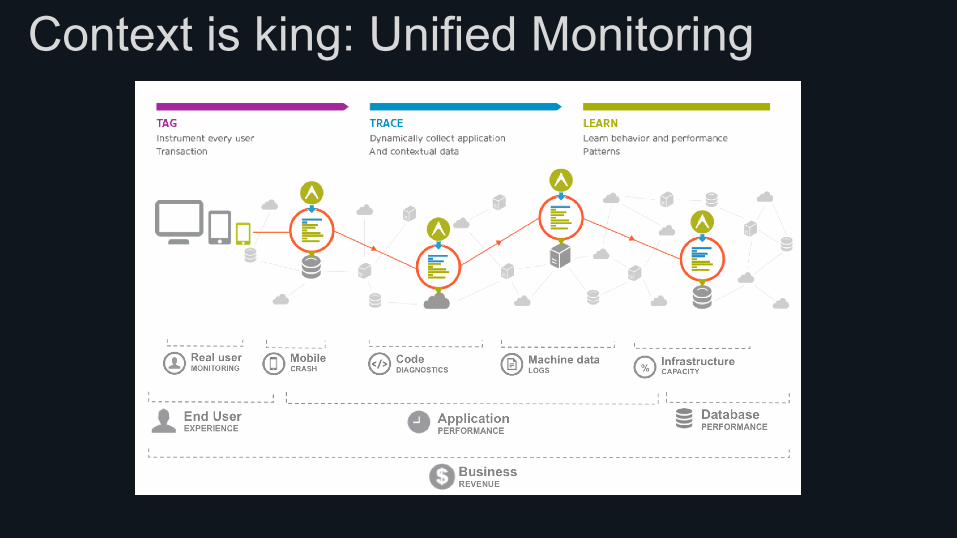
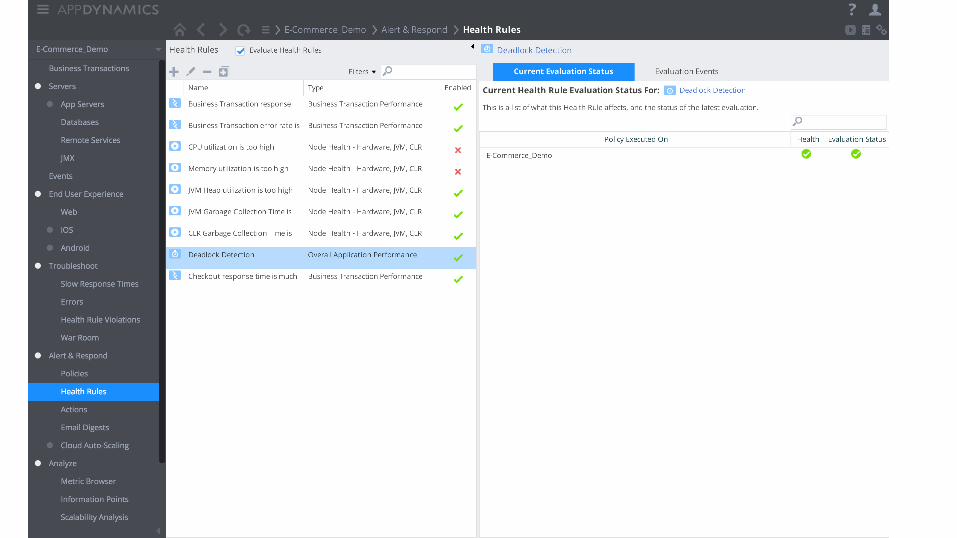
Context is king: Unified Monitoring

Breaking down the silos
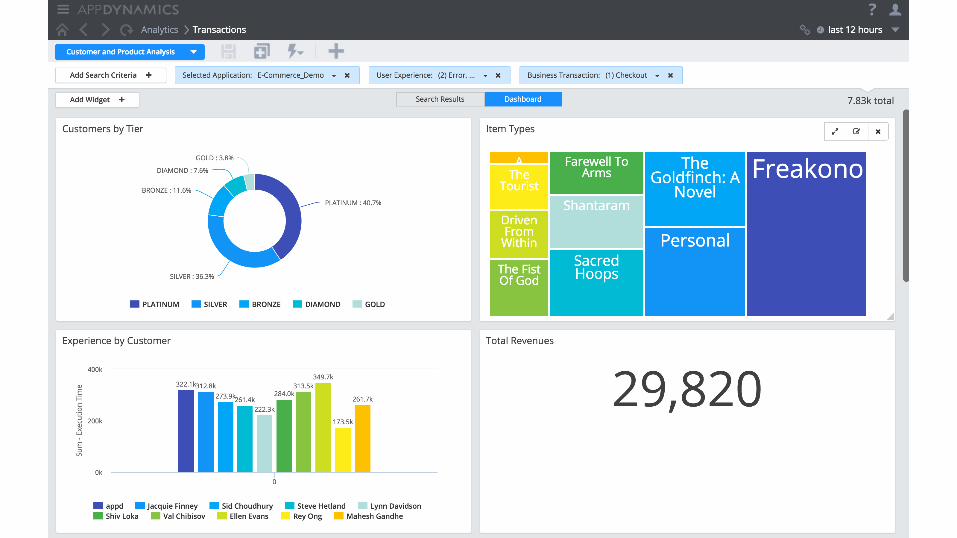

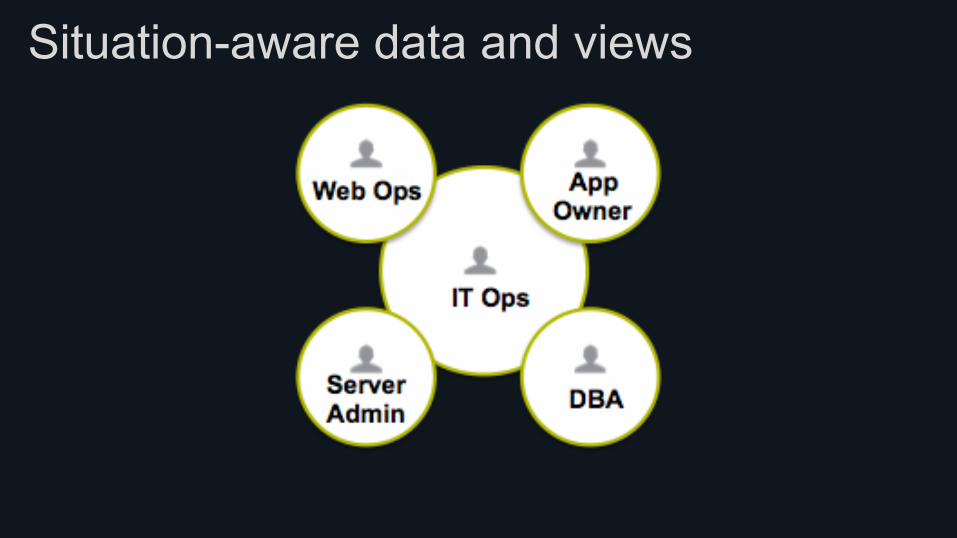
Situation-aware data and views
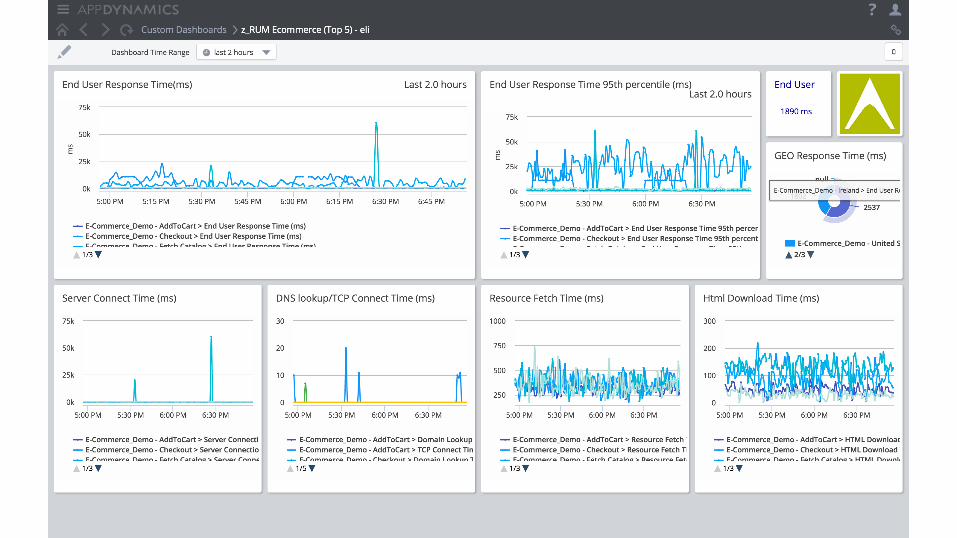


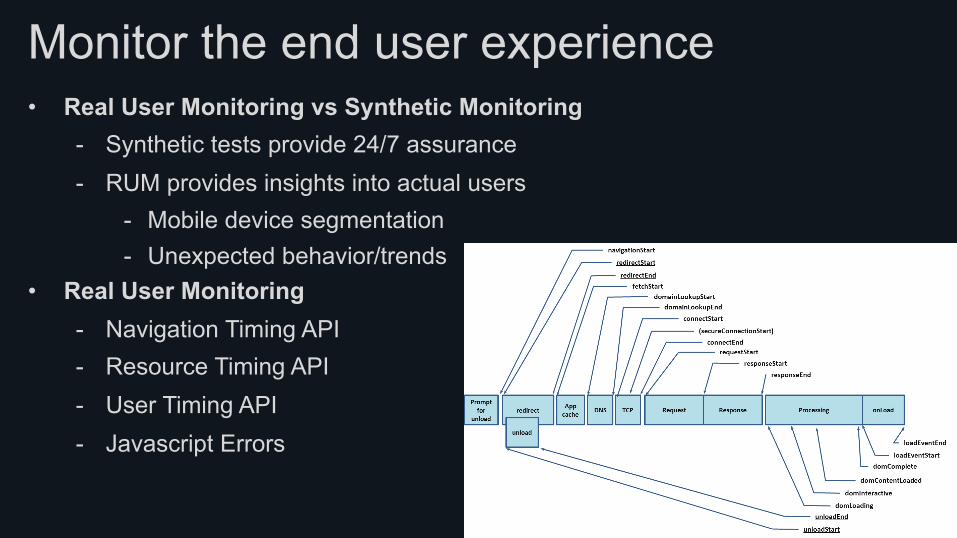
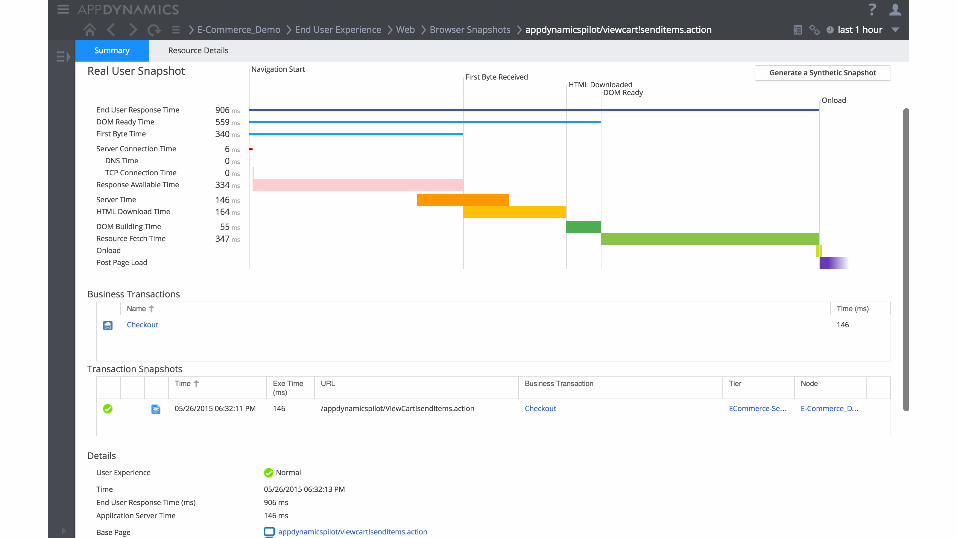
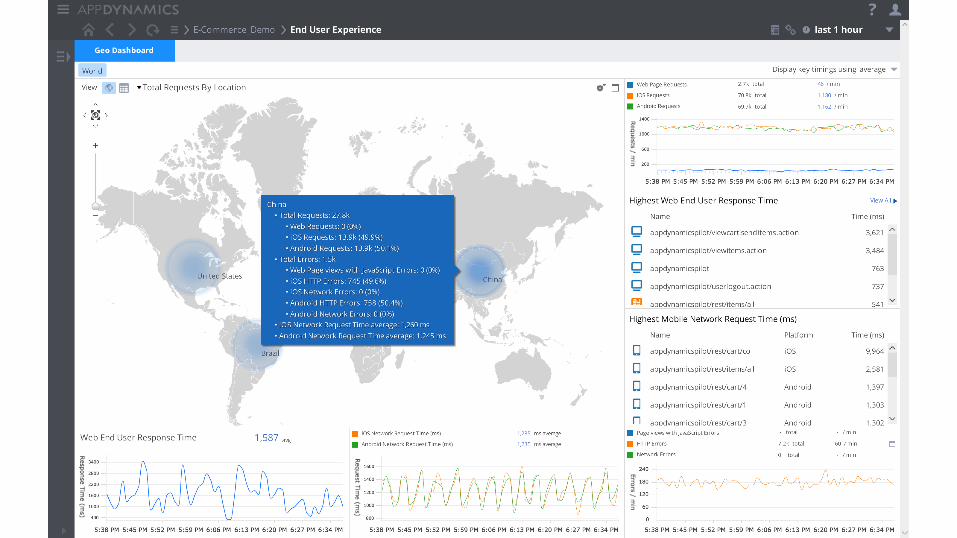
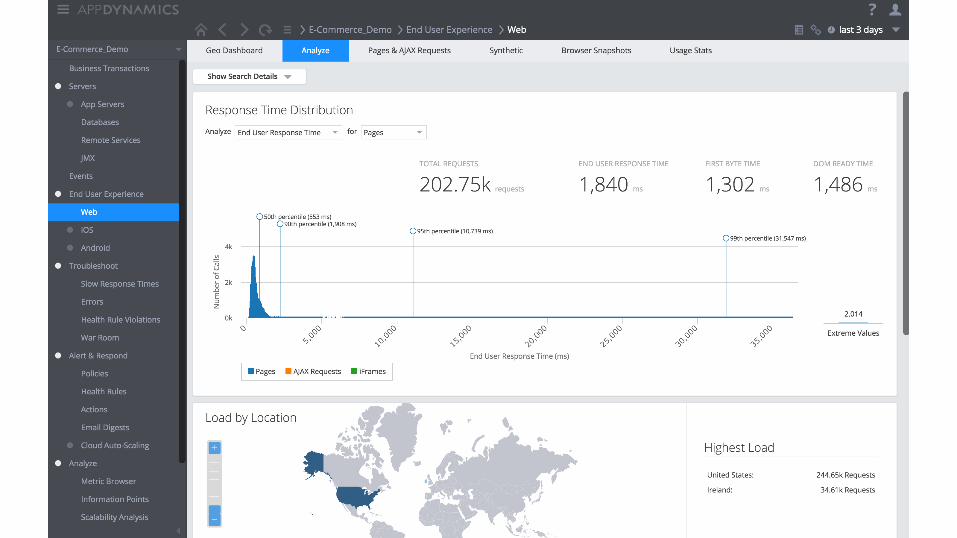
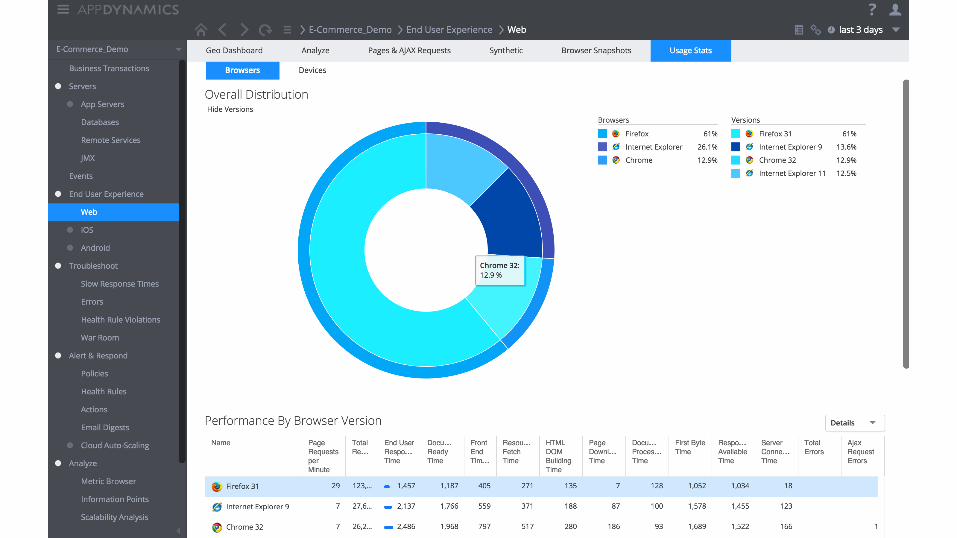
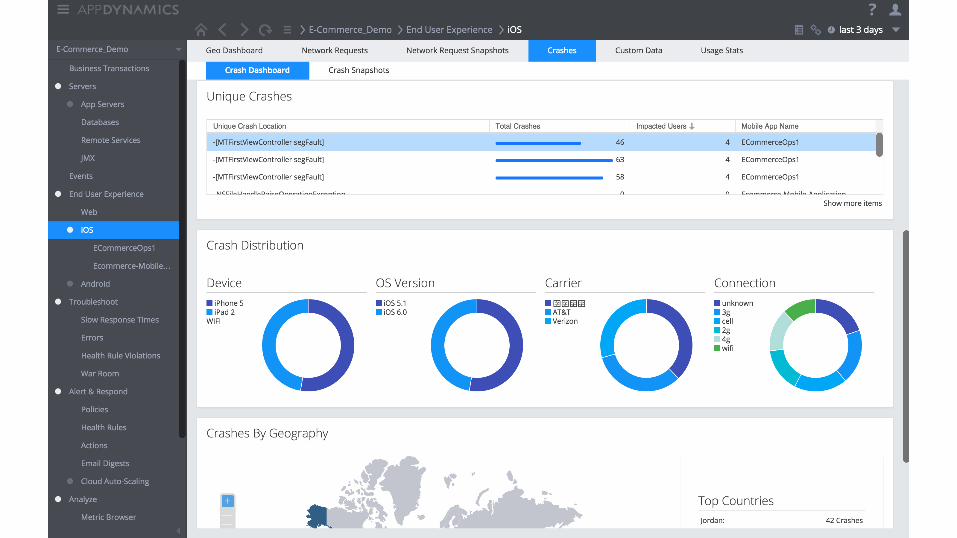
Monitor the end user experience • Real User Monitoring vs Synthetic Monitoring
- Synthetic tests provide 24/7 assurance - RUM provides insights into actual users
- Mobile device segmentation - Unexpected behavior/trends
• Real User Monitoring - Navigation Timing API - Resource Timing API - User Timing API - Javascript Errors
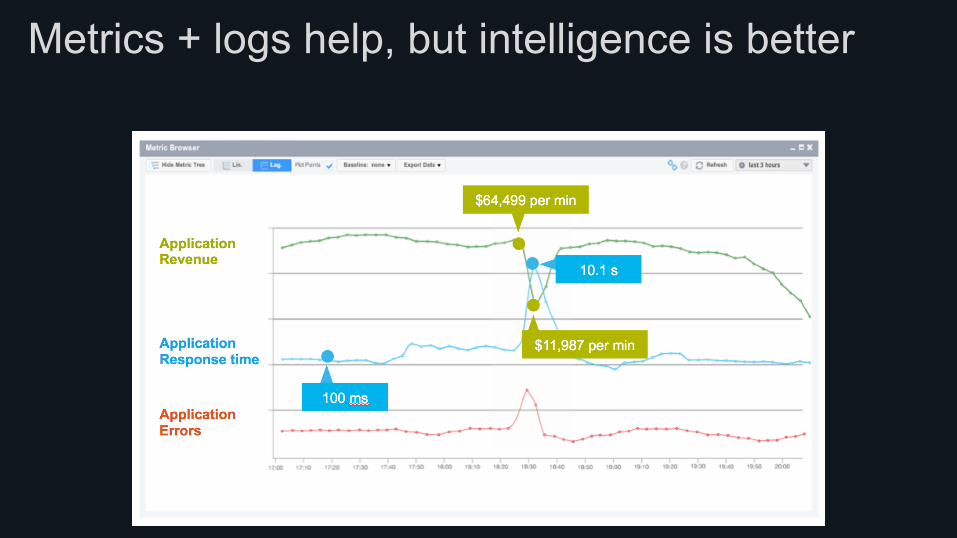
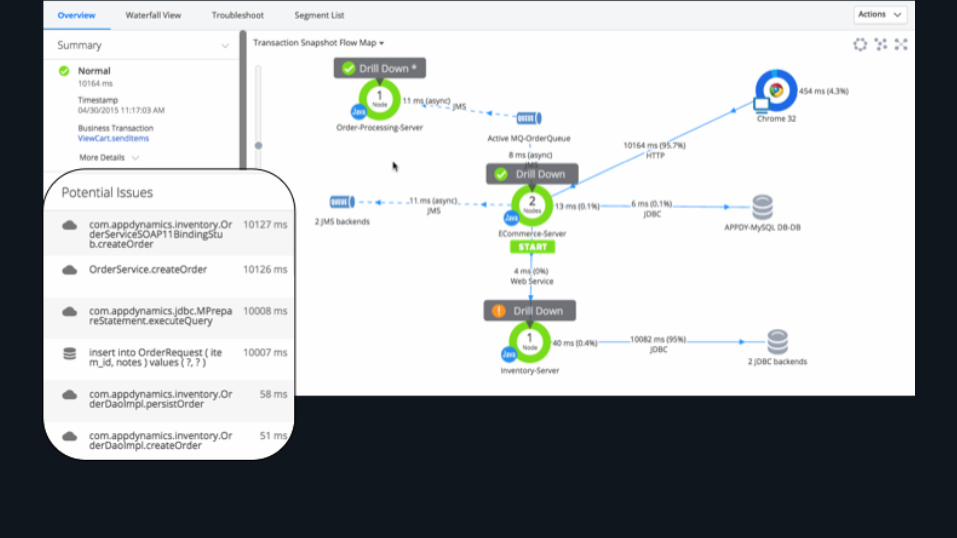
Metrics + logs help, but intelligence is better
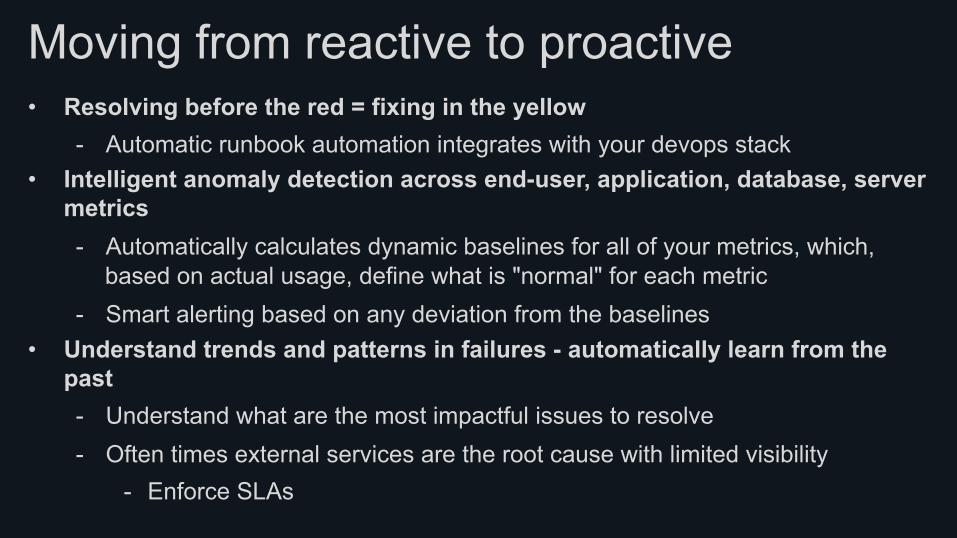
Moving from reactive to proactive • Resolving before the red = fixing in the yellow
- Automatic runbook automation integrates with your devops stack • Intelligent anomaly detection across end-user, application, database, server
metrics - Automatically calculates dynamic baselines for all of your metrics, which,
based on actual usage, define what is "normal" for each metric - Smart alerting based on any deviation from the baselines
• Understand trends and patterns in failures - automatically learn from the past - Understand what are the most impactful issues to resolve - Often times external services are the root cause with limited visibility
- Enforce SLAs
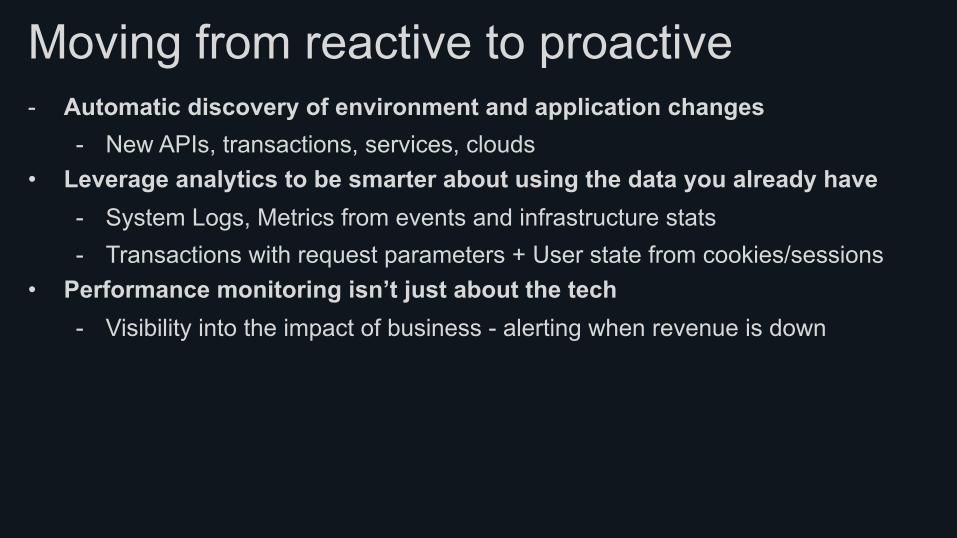
Moving from reactive to proactive - Automatic discovery of environment and application changes
- New APIs, transactions, services, clouds • Leverage analytics to be smarter about using the data you already have
- System Logs, Metrics from events and infrastructure stats - Transactions with request parameters + User state from cookies/sessions
• Performance monitoring isn’t just about the tech - Visibility into the impact of business - alerting when revenue is down
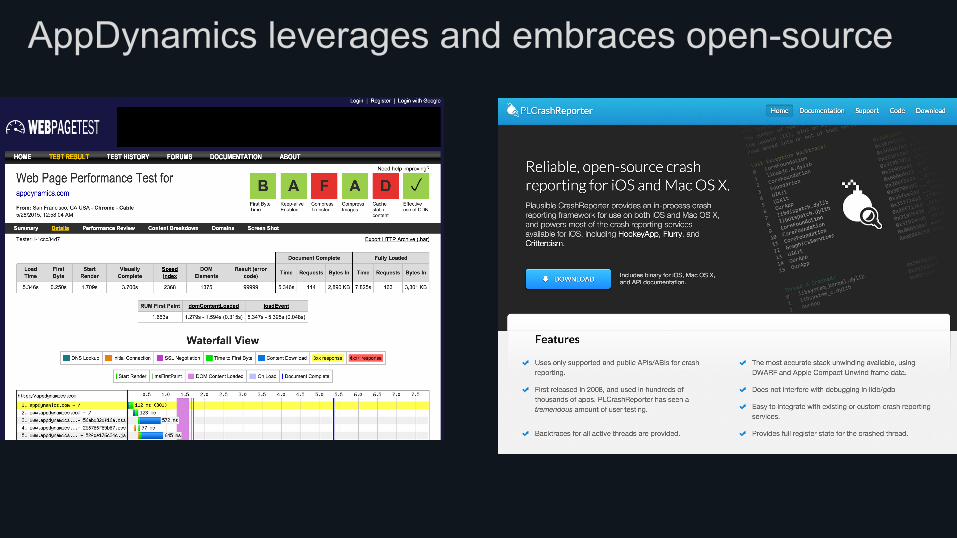
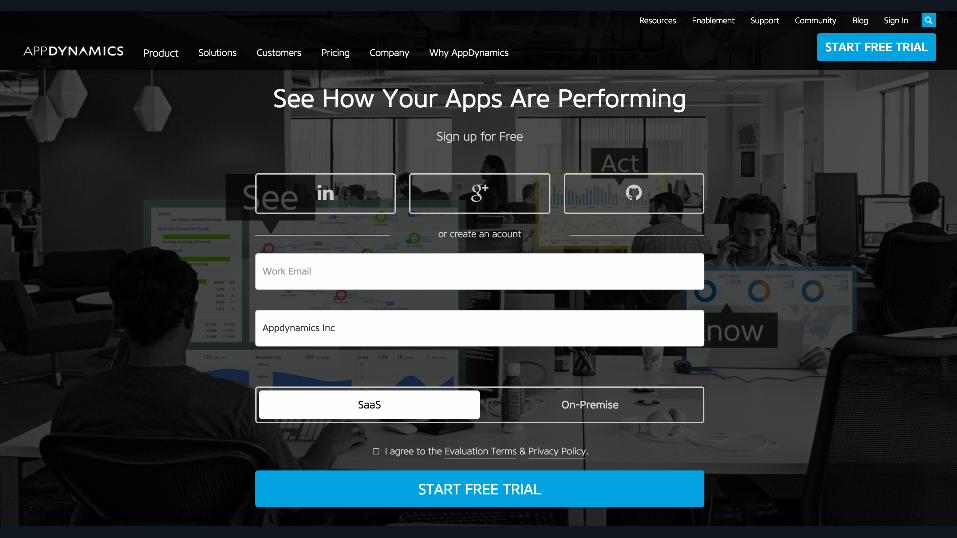
AppDynamics leverages and embraces open-source
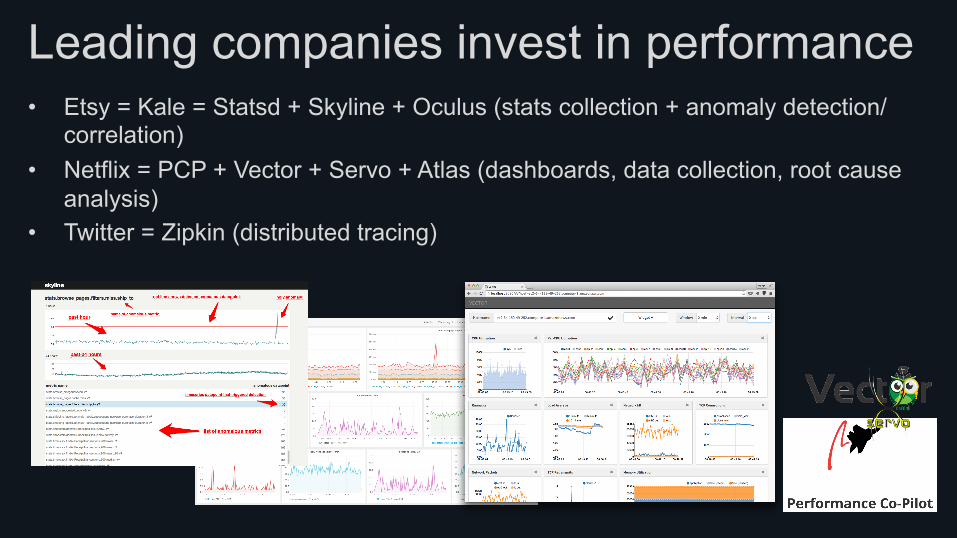
Leading companies invest in performance • Etsy = Kale = Statsd + Skyline + Oculus (stats collection + anomaly detection/
correlation) • Netflix = PCP + Vector + Servo + Atlas (dashboards, data collection, root cause
analysis) • Twitter = Zipkin (distributed tracing)
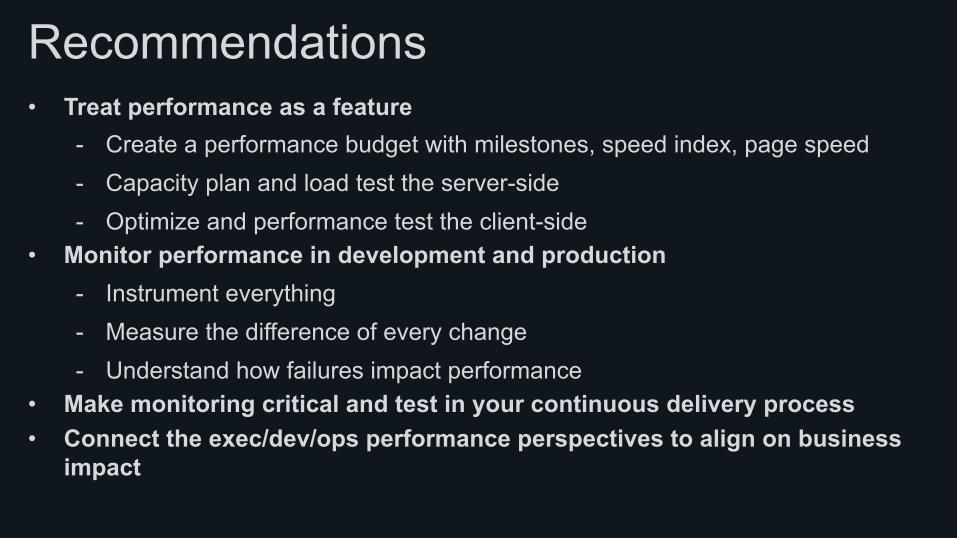
Recommendations • Treat performance as a feature
- Create a performance budget with milestones, speed index, page speed - Capacity plan and load test the server-side - Optimize and performance test the client-side
• Monitor performance in development and production - Instrument everything - Measure the difference of every change - Understand how failures impact performance
• Make monitoring critical and test in your continuous delivery process • Connect the exec/dev/ops performance perspectives to align on business
impact
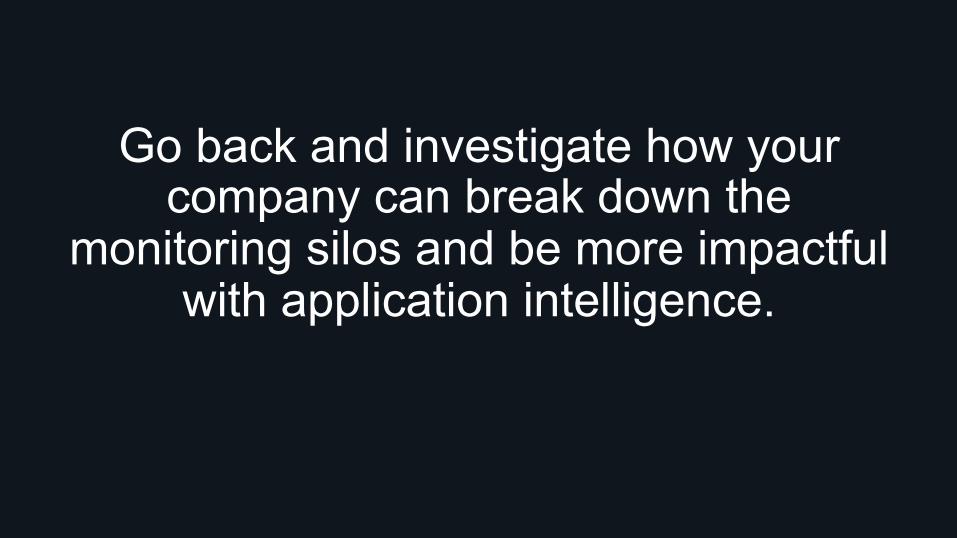
Go back and investigate how your company can break down the
monitoring silos and be more impactful with application intelligence.

QUESTIONS?
Thank You