unesco’s international literacy statistics...
TRANSCRIPT
28 March, 2005
Background paper prepared
Education for All Global Monitorin
Literacy for Life
UNESCO’s International L1950-2000
John A. Smyth 2005
This paper was commissioned by the Education for All Globinformation to assist in drafting the 2006 report. It has not been ediexpressed in this paper are those of the author(s) and should not beReport or to UNESCO. The papers can be cited with the followingEFA Global Monitoring Report 2006, Literacy for Life”. [email protected]
2006/ED/EFA/MRT/PI/90
for the
g Report 2006
iteracy Statistics
al Monitoring Report as background ted by the team. The views and opinions attributed to the EFA Global Monitoring reference: “Paper commissioned for the r further information, please contact
2
UNESCO’S INTERNATIONAL LITERACY STATISTICS 1950-2000
by
John A. Smyth
Introduction
International literacy statistics have long contributed to the world’s appreciation of the
scope of the challenge to eradicate poverty, ignorance and disease. The national literacy rate,
together with measures such as GNP per capita and life expectancy, is widely accepted today as
one of the main indicators of development.
Over the past fifty years the principal source of international literacy statistics has been
UNESCO. An early UNESCO publication, Progress of Literacy in Various Countries (1953),
brought together for the first time data concerning literacy as reported in national censuses carried
out since 1900. A subsequent publication, World Illiteracy at Mid-Century (1957), made the first
attempt to present estimates of illiteracy for all countries and regions of the world. From time to
time since then revised and updated estimates, including projections of future global and regional
trends, have been published.
From the beginning UNESCO aimed at global (worldwide) coverage of its literacy
statistics, notwithstanding the technical and other difficulties involved in achieving this. For the
international community, the usefulness of these statistics has generally outweighed doubts
concerning their validity (Do they measure what they purport to measure?). For UNESCO in
particular they have at various times provided the inspiration for some of the Organization’s major
policies and programmes in the field of education, especially in developing countries.
This paper traces the development of UNESCO’s literacy statistics over the period dating
from the Organization’s earliest publications of such data up until the late 1990s. In addition to
giving a summary account of the main steps in this development, the paper also examines the
3
principal challenges—both substantive and technical—encountered by the Organization’s
statistical service in obtaining worldwide estimates of illiteracy and literacy during the period
under review.
The paper has four sections. The first (and longest) provides an historical overview of the
development of UNESCO’s international literacy statistics in the context of the changing priorities
of the international community towards the worldwide advancement of education and the
eradication of illiteracy, and the Organization’s work on education statistics generally. The second
examines the sources and definitions utilized by UNESCO in assembling its literacy statistics.
The third considers the methods of projection that were utilized. The fourth and last section
concludes with a brief overall assessment of the policy relevance of these statistics during the
period under review.
The sources referenced in the paper are mainly UNESCO’s publications directly relating to
statistics of literacy and levels of educational attainment. It is assumed that the reader is broadly
familiar with UNESCO’s international educational statistics generally, especially with reference to
developing countries.
UNESCO’s statistical service is referred to throughout as the Statistics Division, although
for a certain period lasting from the late 1960s up until the mid-1980s it was known as the Office
of Statistics.
Overview
Before tracing out the main steps in the development of UNESCO’s international literacy
statistics, it may first be helpful to state the position taken by the paper with respect to the overall
policy relevance of these statistics. Literacy, the ability to read and write, has long been
considered by statisticians and non-statisticians alike as a useful indicator of the individual’s
potential for effective participation in the modern economy and society, but the policy relevance of
the literacy-illiteracy dichotomy has always depended in part on which country or group of
countries one is talking about. Arguably, it was the incidence of illiteracy (in the limited sense of

4
inability to read and write at all), rather than the incidence of literacy, which was the main concern
of the international community during most of the period under review, although today this may be
changing. Illiteracy is a problem that everyone can agree needs to be tackled, whereas literacy
(how much?) is a state that has been (or needs to be) achieved. Moreover, it has always been the
case that the majority of countries have significant percentages of their population who are
illiterate in the above sense. In countries where virtually all adults are to some extent literate, the
challenge to eradicate illiteracy readily dissolves into a more complex concern over the incidence
of functional literacy, levels of literacy and the imperative to ensure that everyone’s basic learning
needs are met. For these countries—a growing number to be sure—the traditional literacy-
illiteracy dichotomy is less relevant.
These considerations need to be borne in mind when examining the development of
UNESCO’s international literacy statistics. Considered from a normative standpoint (Why bother
to collect them at all?), they have represented in part a call for action, especially international
action, and it is arguably from this standpoint that their policy relevance is most appropriately
assessed. During most of the period under review, even in UNESCO’s early years when many
developing countries had not yet achieved independence and joined the Organization, the principal
challenge facing UNESCO with respect to its literacy statistics was to ensure that they conveyed a
reasonably accurate picture of the worldwide incidence of illiteracy. Towards the end of the period
under review, with the adoption at Jomtien (1990) of a Declaration on Education for All and
Framework for Action to Meet Basic Learning Needs,1 the challenge to eradicate illiteracy came to
be placed within the context of meeting everyone’s basic learning needs. To the extent that the
1 Paragraph 8 of the Jomtien Framework for Action suggested ‘targets’ that ‘Countries may wish to set … for the 1990s’, including a target for illiteracy: ‘Reduction of the adult illiteracy rate (the appropriate age group to be determined in each country) to, say, one-half its 1990 level by the year 2000, with sufficient emphasis on female literacy to significantly reduce the current disparity between male and female illiteracy rates’ (Inter-Agency Commission (UNDP, UNESCO, UNICEF, WORLD BANK) for the World Conference on Education for All, 1990). The subsequent Framework for Action adopted by the World Education Forum at Dakar in the year 2000 included the goal, ‘Achieving a 50 per cent improvement in levels of adult literacy by 2015, especially for women, and equitable access to basic and continuing education for all adults’ (UNESCO 2000a). Concerning the practicality of the Dakar literacy goal, the following passage taken from UNESCO’s first publication of international literacy statistics is relevant: ‘Both theoretically and practically, it is not possible to maintain indefinitely any relative rate of progress based on increase in percentage of literacy, for eventually the maximum limit of 100 per cent would be reached where no further progress is possible. On the other hand, any given rate of progress based on the reduction in the percentage of illiteracy can be maintained indefinitely, for the limit of zero per cent is approached but never actually reached. This agrees with the practical situation in regard to illiteracy, where there will always be an irreducible minimum percentage of illiterates in any given country or population age group. Therefore, we have chosen to measure progress of literacy in terms of reduction in percentage of illiteracy’ (UNESCO 1953).
5
worldwide incidence of illiteracy represents an immediately compelling aspect of that broader
challenge, statistics of illiteracy still matter.
One further introductory point about UNESCO’s literacy statistics may be noted. From the
outset they were to be based very largely on data concerning literacy and educational attainment
reported by national population censuses. In this respect the development of UNESCO’s literacy
statistics was to differ from that of its educational enrolment statistics, which, from the late 1950s
onwards, were based primarily on annual statistical questionnaires administered directly by
UNESCO to its Member States, supplemented where necessary by data available in national
publications. When the Organization (in co-operation with the United Nations Statistical
Division) started examining census reports in the early 1950s with a view to assessing the global
dimensions of the challenge to eradicate illiteracy, it found that 26 countries had been collecting
literacy data in their national censuses since around 1900 (UNESCO 1953), and over 65 countries
since 1945 (UNESCO 1957). Thus, UNESCO latched on, so to speak, to what had already
become well established internationally as the principal means of collecting national literacy data.
Turning now to the development of UNESCO’s literacy statistics, three broad phases may
be identified, each marked by a progressive deepening of the underlying database. The first phase
extending up until the mid-1950s began with the Preparatory Commission that was charged with
drawing up a plan of work for the Organization to be submitted to UNESCO’s first General
Conference in November-December 1946. The Commission’s proposals in the education field
focused on the need for programme activities in the area of what was then called ‘Fundamental
Education’, a term that eventually fell out of use in UNESCO but which broadly corresponded to
what is generally meant today by the term ‘basic education’.2 The worldwide incidence of
illiteracy formed part of the backdrop to these proposals. In the words of Julian Huxley, Executive
Secretary of the Commission and UNESCO’s first Director-General:
Where half the people of the world are denied the elementary freedom which consists in the ability to read
and write, there lacks something of the basic unity and basic justice which the United Nations are pledged
2 Concerning UNESCO’s early focus on Fundamental Education, see UNESCO (2000b).

6
together to further. Fundamental Education is only part of the wider and fuller human understanding to
which UNESCO is dedicated, but it is an essential part.3
Huxley’s estimate of ‘half the people of the world’ being unable to read and write was largely a
guess,4 but this hardly mattered. There could be little dispute over the reality of the challenge
facing UNESCO in the late 1940s. International co-operation in one form or another with a view
to the eradication of illiteracy was to be a continuing feature of the Organization’s education
programme in the decades that were to follow.
Some time was to elapse before UNESCO was in a position to publish its first literacy
statistics. A Division of Statistics was not set up until April 1950. In the meantime, activities
concerning educational statistics were handled under the Organization’s Education Clearing House
programme which had plans for publishing a periodic World Survey of Education. UNESCO’s
first publication concerning literacy statistics, the monograph, Progress of Literacy in Various
Countries (1953), cited earlier, was actually published as one of a series of monographs devoted to
various aspects of Fundamental Education. Prepared with assistance from the United Nations
Statistical Division in assembling available census data, it brought together data regarding literacy
and illiteracy in twenty-six countries that had administered questions concerning literacy in their
national population censuses going back to around 1900. It also presented a critical analysis and
commentary on some of the main issues involved in comparing the data reported by the different
countries, especially with respect to the types of questions concerning literacy that were utilized in
the various censuses. It acknowledged that differences between the questions utilized did not
wholly preclude making useful comparisons of interest to policy-makers, for example concerning
the ratio of male to female literacy rates. In fact, for those countries where the census questions
concerning literacy were basically consistent from one census to the next, the rates of progress (or
lack of it) over time in reducing illiteracy could be compared, with the understanding of course
that the definition of illiteracy might well vary considerably from one country to another. In this
connection, a finding of particular interest that emerged from the historical analysis for individual
countries, e.g. Brazil, was that the absolute number of illiterates could continue to grow even when
3 Quoted in UNESCO (2000b). 4 An international study published by the U.S. Bureau of Education before the Second World War (Abel and Bond 1929) concluded that around 62 per cent of the world’s population aged 10 years and over was illiterate (quoted in UNESCO 1957).
7
the percentage of illiterates in the total population declined. As noted in UNESCO (2000b), this
phenomenon was apparently to persist at the world level up until the late 1980s, if not later.
The Progress monograph was followed up by a study aiming to estimate the total number
of illiterates in the world ‘around 1950’, taking advantage of the large number of national censuses
and surveys (73) that had been carried since 1945 as well as other sources that had become
available. This was to result in the publication of another volume in the Monographs on
Fundamental Education series: World Illiteracy at Mid-Century (1957). Taking illiteracy to mean
‘the inability to read and write in any language (a relatively minimum concept commonly adopted
in national statistics mainly derived from population censuses)’, the study was frank in
acknowledging the limitations of its estimates, and presented them as applicable within ‘ranges’.5
The global pattern of the incidence of illiteracy revealed by the study has not greatly changed in
the years that have passed since World Illiteracy at Mid-Century was published:
Adult illiteracy is more widespread in Asia and Africa and in parts of Middle and South America, though
millions of illiterate persons are still to be found in many other countries where education is well
developed. The countries of South Central Asia contain about one-third of the world’s 700 million adult
illiterates. Rather more than a quarter of the world’s illiterates live in East Asia. In all Africa, there must
be at least 100 million illiterate persons, comprising some 80 or 85 per cent of the total adult population.
Another 100 million illiterates are accounted for in the countries of South East Asia and South West Asia.
The whole of Middle and South America, with some 40 million adult illiterates, has an illiteracy rate
approximately equal to the estimated world average. Southern European countries account for another 20
million illiterates. The remainder of the world’s illiterate population is scattered over the rest of Europe
(including the U.S.S.R.), Northern America and Oceania .
The study drew two conclusions for educational policy at the international level. One was
very general: ‘Although the phenomenon of illiteracy is on the decline throughout the world, it is
still of such magnitude as to challenge the efforts of all who believe in the wide diffusion of the
arts of written communication among people living in modern society’. The other was more
specific. Drawing on its analysis of the experience of selected countries, ‘where historical data on
both [school] enrolment and literacy rates are available’, the study concluded that, ‘The evidence
5 For example, an estimated 690-720 million adult (15 years old and over) illiterates in the world, representing an estimated 43-45 per cent of the adult population.
8
clearly points to the supreme importance of extending universal primary education as the basic
approach towards the elimination of illiteracy’. This conclusion was very much in line with the
priority given in UNESCO’s education programme in the 1950s to the promotion of Free and
Compulsory Education.6 However, it did not anticipate the possibility that many countries might
also favour undertaking national mass campaigns specifically focused on the promotion of literacy
among adults.
In demonstrating the similarity among the majority of national censuses in their definitions
of literacy/illiteracy, Progress of Literacy in Various Countries and World Illiteracy at Mid-
Century probably facilitated the consensus reached on the standard definitions that shortly
afterwards came to be included in the Recommendation concerning the International
Standardization of Educational Statistics, adopted by UNESCO’s General Conference in 1958:7
(a) A person is literate who can with understanding both read and write a short simple statement on his
(her) everyday life.
(b) A person is illiterate who cannot with understanding both read and write a short simple statement on his
(her) everyday life.
These definitions subsequently were to serve as the basis of UNESCO’s international literacy
statistics.
The second phase in the development of these statistics covers the twenty-year period up to
and including the next comprehensive review of worldwide census data that the Statistics Division
was to carry out in the mid-1970s. This period was largely one of building up the database as
more and more census reports became available, although a revised set of the Mid-Century
estimates was prepared for the World Congress of Ministers of Education on Illiteracy that met in
Teheran in 1965 (UNESCO 1965). During this period, the worldwide challenge to eradicate
illiteracy was the focus of much international attention and debate. Beginning in the early 1960s,
there were calls in the United Nations General Assembly and UNESCO’s General Conference for
immediate action, indeed a ‘world campaign’ against illiteracy (Jones 1988). The importance of 6 For example, the regional Conferences that were convened by UNESCO on this theme in South Asia and the Pacific (Bombay, 1952), Arab Countries of the Middle East (Cairo, 1955), and Latin America (Lima, 1956).
9
what was then called ‘cutting off illiteracy at its base’ through the development of the formal
education system was not denied but was regarded as a long term solution.8 A number of
countries initiated mass campaigns for the eradication of illiteracy among adults.9 Other countries,
more cautious, stressed the difficulties of organizing such campaigns and the likelihood that if they
were not organized properly then they would only result in the acquisition of superficial levels of
literacy. Still others advocated a selective approach focused on functional literacy for adults
especially in key economic sectors. International action eventually coalesced (in 1966) in the
inauguration of the joint UNESCO-UNDP Experimental World Literacy Programme, which was
conceived as a kind of ‘world campaign’, though largely one with a focus on functional literacy.
One consequence of all the activity and debate during the 1960s and early 1970s
concerning the eradication of illiteracy was the emergence of an international consensus around
the concept of ‘functional illiteracy’, as evidenced for example at the International Symposium for
Literacy that met in Persepolis, Iran, in 1975, in order to take stock of the situation of adult literacy
in the world in the light of developments that had occurred in the decade following the 1965
Teheran World Congress (Bataille 1976). The consensus came to be formalized later that year
when UNESCO’s General Conference adopted a Revised Recommendation Concerning the
International Standardization of Educational Statistics that included definitions of ‘functional
literacy’ and ‘functional illiteracy’ (UNESCO 1975):
A person is functionally literate who can engage in all those activities in which literacy is required for
effective functioning of his (her) group and community and also for enabling him (her) to continue to use
reading, writing and calculation for his (her) own and the community’s development.
A person is functionally illiterate who cannot engage in all those activities in which literacy is required for
effective functioning of his (her) group and community and also for enabling him (her) to continue to use
reading, writing and calculation for his (her) own and the community’s development.
7 Other definitions and classifications included in the Recommendation concerned statistics of educational attainment, educational institutions, and educational finance (UNESCO 1958).
8 This debate is broadly summarized in UNESCO (2000b). See also the reports on worldwide adult literacy activity given in UNESCO (1968, 1970, 1972, 1980). 9 For example, see Bhola (1984).

10
Nevertheless, the inclusion of these definitions in the 1975 Recommendation was largely
symbolic, for they were well in advance of actual practice in countries.10 At that time, neither the
international adult education community nor the international community of specialists in testing
and measurement, let alone national census administrations, had actually devised means for
measuring functional literacy/illiteracy among adults on an internationally comparable basis.11
It was probably as a consequence of the adoption of the 1975 Revised Recommendation
that the Statistics Division embarked on a comprehensive stocktaking of available census data
relating to both literacy and educational attainment. A link between literacy and level of
educational attainment (or duration of schooling) had been recognized by the Statistics Division
back in the early 1950s when the Division first began work on literacy statistics (UNESCO 1953,
1957); in fact at that time there was a commonly held belief that the acquisition of functional
literacy normally required the completion of at least four years of schooling (UNESCO 1957).12 .
The stocktaking was to result in the publication, Statistics of Educational Attainment and
Illiteracy 1945-1974 (UNESCO 1977a). Most national censuses that collected information on
literacy also collected information on levels of educational attainment. Statistics of Educational
Attainment and Illiteracy 1945-1974 brought together such data from censuses and surveys carried
out in 179 countries or territories since 1945. An immense effort of classification and estimation
was involved because of the extraordinary variety of classification protocols utilized by the
different censuses, especially in respect to level of educational attainment and age group. Some of
the main issues of classification and estimation that were encountered are considered in the next
section of the paper. For the present, it suffices to note that the central task of the whole exercise
was to present for each census, and each standard age group (15-19, 20-24, 24-29, etc.), where
possible, the percentage breakdown of the population by male/female and level of educational
attainment, and per cent illiterate, again by male/female. Part of the interest in carrying out the
10 The Statistics Division had long been aware of the notion of functional literacy (UNESCO 1953, 1957, 1961). 11 The first-ever international comparative study of reading achievement was not carried out until 1990 (Elley 1992, Postlethwaite and Ross 1992). Implemented under the auspices of the International Association for the Evaluation of Educational Achievement (IEA), it was confined to 14 year-olds in school in a selection of mostly industrial countries. The first international comparative study of functional literacy among adults was carried out in a selection of OECD countries in 1994 under the auspices of OECD (OECD 1995). 12 Apparently this idea originated in studies carried out in the United States in the 1920s on the use of literacy tests for the purpose of determining the qualification of new voters (UNESCO 1957).

11
exercise, although this was not stated explicitly at the time and only became evident afterwards (as
will shortly be seen), was to provide a basis for projecting future worldwide trends in illiteracy.
The period running from the publication of Statistics of Educational Attainment and
Illiteracy 1945-1974 up until the end of the 1990s covers the third phase in the development of
UNESCO’s international literacy statistics. During this phase the Statistics Division extended its
work to include projecting future worldwide trends in illiteracy. This largely reflected the growing
concern (within the United Nations system generally) to monitor more closely the overall
development experience and prospects of developing countries, particularly in the context of
successive United Nations Development Decades. Indeed, the national literacy rate, along with
other measures of development such as income per capita, acquired ‘official’ status as an
international development indicator in 1971, when a rate of 20 per cent or less was adopted by the
United Nations General Assembly as one of the criteria for classifying a country as ‘Least
Developed’. Thus, the publication of Statistics of Educational Attainment and Illiteracy 1945-
1974 was timely, even if it exposed many gaps in international coverage. The preparation of up to
date estimates was imperative, but required first the development of an appropriate methodology.
The United Nations Statistical Division completed in 1974 a set of worldwide demographic
estimates and projections, and on the basis of these UNESCO’s Statistics Division was able to
prepare its first set of worldwide school enrolment projections (UNESCO 1977a). At the same
time, the Division began work on methods of estimating rates of illiteracy and educational
attainment (UNESCO 1978b). There was immediate pressure too from UNESCO’s General
Conference; at its nineteenth session held in Nairobi in late 1976, the Conference had
contemplated the possibility of initiating a UNESCO Literacy Decade and planned to take up the
matter again at its twentieth session in Paris in late 1978.13
UNESCO’s first set of worldwide estimates and projections of illiteracy, Estimates and
Projections of Illiteracy (UNESCO 1978a), presented estimates and projections of the illiterate
population by male/female for the age group 15-19 in 137 countries or territories, with totals for
all major regions of the world, for the years 1970 and onwards at five year intervals up until the
13 In the event, the idea was dropped, but was revived at the end of the 1980s, and again at the end of the 1990s. During the 1980s UNESCO launched a series of Regional Programmes for the ‘Universalization and Renewal of Primary Education and the Eradication of Illiteracy’: Latin America and the Caribbean 1981, Africa 1984, Asia and the Pacific 1986, and Arab States 1989.
12
year 2000, and estimates and projections of the illiterate population by male/female aged 15 and
over for 109 countries or territories, again with totals for all major regions, for the years 1970 and
onwards at five year intervals up until 1990.14 The estimates and projections were obtained from
the application of a set of regression equations that the Statistics Division (in co-operation with
outside consultants) had derived earlier from an analysis of the data in its database of school
enrolment ratios and statistics of educational attainment and illiteracy (UNESCO 1978b).15 In the
projection exercise, school enrolment ratios for the 6-11 age group were utilized for estimating
future illiteracy rates for the 15-19 age group, and these in turn, together with the United Nations
demographic projections, were then utilized for estimating future illiteracy rates for the population
aged 15 and over. Specific aspects of the projection methodology are noted in a later section of
the paper. For the present, it suffices to note the intuitively compelling logic of the methodology’s
core assumption: that future trends in the illiteracy of the adult population largely depend on trends
in access to and participation in primary education.
Following the publication of the projections, the Division proceeded to update its data on
educational attainment and illiteracy, taking into account additional censuses and surveys that had
become available in the period 1970-1980. The result was a publication, Statistics of Educational
Attainment and Illiteracy 1970-1980 (UNESCO 1983b). While this was being prepared, the
Division also began work on preparing a revised set of estimates and projections, particularly with
reference to the Least Developed Countries (LDCs).16 A set of projections of illiteracy rates for 25
of the 31 LDCs, covering the years 1980, 1990 and 2000, was presented in a publication devoted
to statistical highlights of the development of education in general in the LDCs (UNESCO 1983a).
A summary table of the revised world totals of illiterates, male and female, for the years 1970,
1975 and 1980 was presented in the General Introduction of Statistics of Educational Attainment
14 The estimates and projections did not cover China, Democratic People’s Republic of Korea, and Vietnam. The regional estimates and projections were obtained by applying to each region’s total population the averages of the illiteracy rates of the countries or territories within the region for which individual estimates had been made. In most regions, whether for the age group 15-19 or that of 15 and over, the countries for which individual estimates were made accounted together for very large percentages of their region’s total population. 15 One of the consultants, Richard Stone of the University of Cambridge, was later awarded the Nobel Prize for Economics in recognition of his pioneering work on national income statistics; his cautious, though supportive, review of UNESCO’s initial methodological studies on projecting rates of illiteracy and educational attainment was published by the Statistics Division (Stone 1978). It is not known whether he had views on, or saw, the work on projections that was carried out later. 16 The United Nations had convened a Conference of the Least Developed Countries in Paris at UNESCO headquarters in September 1981 with a view to the adoption of a ‘Substantial New Programme of Action’ for the 1980s (Third Development Decade) on their behalf.

13
and Illiteracy 1970-1980, but the corresponding worldwide country-by-country figures, other than
those for the 25 LDCs, were never published.
Over the next five years (up to 1988), the census and survey data that had been presented in
Statistics of Educational Attainment and Illiteracy 1970-1980 were progressively updated; at the
same time a revised set of worldwide estimates of illiteracy rates in individual countries for 1985
was prepared, the previous set having been prepared ten years earlier when the first set of
projections was established. The outcome was the publication, Compendium of Statistics on
Illiteracy (UNESCO 1988.
Following the publication of the 1985 estimates, and under considerable pressure within
UNESCO in view of the upcoming International Literacy Year (1990) and World Conference on
Education for All (Jomtien, 1990),17 the Statistics Division embarked on a full-scale projection
exercise to establish worldwide country-by-country illiteracy estimates at intervals running up to
the year 2000, taking into account a revised set of population projections that had become
available from the United Nations Statistical Division. This was to result in the publication,
Compendium of Statistics on Illiteracy – 1990 Edition (UNESCO 1990), containing both updated
census data on illiteracy as well as the projections. Neither this compendium nor its immediate
predecessor (UNESCO 1988) included tables on levels of educational attainment, which had been
the practice up until then (UNESCO 1977b, 1983b). Although continuously updated tables on
levels of educational attainment were by this time being published annually in UNESCO’s
Statistical Yearbook, the break in practice was significant, for it marked the adoption by the
Statistics Division of a new projection methodology that did not rely on a causal link running from
non-participation in primary education—the lowest level of educational attainment that a census
could report—through to the likelihood of adult illiteracy, as had featured in the previous
methodology. It estimated future literacy/illiteracy rates from census data on literacy/illiteracy
alone, on the assumption that the evolution of a country’s literacy rate over time can basically be
described by a particular statistical curve,18 the general properties of which were assumed to be
17 Moreover, UNESCO’s General Conference, at its 23rd session in 1985, had invited the Director-General, ‘when the [Organization’s] third Medium-Term Plan is being drawn up, to prepare a plan of action to help Member States in all regions of the world to eradicate illiteracy by the year 2000’. The Director-General presented the Plan of Action to Eradicate Illiteracy by the Year 2000 to the General Conference at its 25th session in September 1989 (UNESCO 1989). 18 Logistic curve.

14
universally applicable, although its precise form for any given country needed to be inferred
directly from that country’s census data (UNESCO 1995b). Particular aspects of the new
methodology are noted later in the paper. For the present it suffices to note that the new
methodology basically amounted to projecting future literacy rates from the logistic trend (curve)
that best fitted the available census data. A more informal methodology was adopted for countries
for which no census data were available (UNESCO 1990).
A largely unexpected outcome of UNESCO’s publication of worldwide country-by-
country estimates of illiteracy was the discovery of a strong demand for such estimates on the part
of the UN agencies, UNDP and UNICEF, which had embarked at the end of the 1980s on the
production of annual flagship reports, respectively, the Human Development Report and State of
the World’s Children. During the 1990s, both of these reports (as well as UNESCO’s own
biennial World Education Report) depended to some extent on UNESCO’s literacy statistics;
indeed, these statistics came to be adopted by UNDP as a critical component of the Human
Development Report’s Human Development Index. The World Bank also began to include these
statistics in its annual publication of World Development Indicators.
One further updating of the compendium of statistics on illiteracy was to be undertaken
before the end of the decade, mainly prompted by the availability of a new set of population
projections from the United Nations Statistical Division; this resulted in the publication,
Compendium of Statistics on Illiteracy – 1995 Edition (UNESCO 1995a). A certain amount of
updating was also undertaken annually for individual countries as new census data became
available.
Sources and definitions
From the beginning, national censuses were to serve as UNESCO’s main sources of data
on illiteracy. In 1953 the situation in that regard was as follows (UNESCO 1953):
Unfortunately, census data on illiteracy are not available for many areas of the world. In those countries
which claim to have little or no illiteracy, such as Denmark, Germany, the Netherlands, Norway, Sweden,

15
Switzerland and the United Kingdom, the question on literacy has not been included in the census schedule,
at least since the beginning of this century. Other countries with very low illiteracy rates, such as Australia,
Austria, Canada, New Zealand and the continental United States, have discontinued the question on literacy
in their more recent censuses. These cases, however, are not serious since the number of illiterates thus left
unaccounted for is negligible. More serious is the lack of census data from areas where illiteracy is
believed to be still prevalent, but where its extent cannot be accurately estimated. For practically all of
Africa, except Egypt and the Union of South Africa, illiteracy statistics from census sources are unknown.
For large portions of Asia, including China, Mongolia, the States of Indo-China, and the Arab countries of
the Middle East, the situation is the same. Among the American nations, no recent census data on illiteracy
are available for Bolivia, Ecuador, Haiti, Paraguay or Uruguay. Thus, leaving out of consideration those
countries where the illiteracy rate is believed to be low, there still remains almost one-third of the world
population for whom no census data on illiteracy are available.
Moreover, such census data as were available were not always entirely reliable for various reasons:
In the first place, they are subject to all the difficulties inherent in census enumerations such as under-
enumeration (when, for example, some groups are unaccounted for), over-enumeration (when, for example,
certain groups or individuals are counted twice), omission of certain segments of the population
(particularly the indigenous peoples), inaccuracy of reporting, etc. In addition, criteria of literacy and
illiteracy are often vaguely stated and variously applied. Finally no actual test of literacy is feasible in
census enumerations, and the word of the respondent or the judgement of the enumerator must be accepted
at face value, with all the subjective elements of error involved.
And the data were not always comparable between countries:
The prospect is still more discouraging when an attempt is made to compare illiteracy data between one
country and another, or even between different censuses of the same country. Definitions of literacy and
illiteracy are widely divergent, ranging from ‘can read’ or ‘cannot read’ to ‘can or cannot write a short letter
to a friend and read the answer’. Ability to sign one’s name is in some cases considered as sufficient
evidence of literacy, while in others it is not. The population to which any criterion of literacy is applied
may be persons of all ages, even including infants who have not yet learned to talk! On the other hand,
various age limits have been specified for consideration of literacy, ranging from 5 to 15 years or older.
Methods of tabulation are different for each country and sometimes for each census of a given country.
Persons unspecified for literacy may or may not be included with the total population, with the literates, or

16
with the illiterates. Persons of unknown age may or may not be included in the total count of literates and
illiterates. Persons who can read only (or who can write only) may be included with the literates or with
the illiterates, or given as a separate group considered as neither literate nor illiterate.
In the light of these bleak early assessments, the challenges facing UNESCO were three-
fold: (1) to obtain a more comprehensive worldwide coverage of data on illiteracy, (2) to ensure
that the data reported were more reliable, and (3) to ensure better comparability between the data
reported by different countries. Since the Organization could not reasonably expect ever to have
the resources to carry out on its own account worldwide surveys of illiteracy, it could only address
these challenges indirectly at the policy level by encouraging countries to collect data on illiteracy,
and by advising them on related questions of reliability and comparability.
For countries unable or unwilling to mount special surveys of illiteracy, the only practical
means of collecting national data on illiteracy was the periodic national census.19 The established
mechanism within the United Nations system for advising countries on their censuses was the
United Nations Population Commission, at which UNESCO was represented as an observer, while
the established repository of national census reports was the United Nations Statistical Division
(on behalf of the Secretary-General), although UNESCO itself could of course approach Member
States directly for copies. From the beginning, therefore, in encouraging countries to collect data
on literacy/illiteracy, and in advising them on what to include in that respect in their census
schedules, UNESCO co-operated with United Nations Population Commission. In analyzing their
census reports, UNESCO was to develop over the years a close co-operative relationship with the
United Nations Statistical Division.
It remains now to consider the progressive improvement in the worldwide coverage of
illiteracy data over the years, as more and more countries undertook both to carry out national
censuses and to include items concerning literacy/illiteracy in their census questionnaires. It will
also be necessary to consider what UNESCO did with the data, in other words the relationship
between the data sources and the estimates that the Organization would publish from time to time
on current and future trends in the worldwide incidence of illiteracy.
19 In those days, national household sample surveys were uncommon.

17
The Organization’s first attempt to estimate the number of illiterates in the world, World
Illiteracy at Mid-Century (1957), took ‘around 1950’ as the reference year, and 15 years and over
as the reference age group. Estimates were prepared for 198 countries. The United Nations
Population Commission had somewhat earlier (1948) recommended to countries, with a view to
improving the comparability of census results in all countries, that literacy should be defined as
‘ability to read and write a simple message in any language’ (UNESCO 1957). It had also
recommended that if the census schedule’s question on literacy was confined to the population
above a stated minimum age, then ‘the minimum should not be higher than 15 years of age’. In
addition, it recommended that ‘tabulations [of literacy] data show, for each sex, at least the
following age groups: under 15 years (if the minimum age for data on this subject is below 15
years), 15 to19, 20 to 24, 10 year age groups from 25 to 64, 65 years and over’.
In preparing its estimates, UNESCO had recourse to reports of censuses and sample
surveys carried out in 73 countries since 1945. For 52 of these countries, the number and
percentage of illiterates (‘cannot read and write’) in the population aged 15 years and older could
be taken directly from the reports. For 21 countries these figures had to be estimated, in most
cases from census tabulations that utilized other age groups than 15 years and older. For the
remaining 125 countries, a variety of methods were utilized to establish the estimates:
For countries with census figures which are out-of-date, fairly satisfactory estimates can be made of their
present situation by projecting their population and literacy data forward from the latest census year, taking
into consideration their rate of progress in reducing illiteracy in the past…In the absence of census data, use
is made of official estimates based on marriage and military service records, percentage of school-age
children attending school, and other pertinent information. Estimates of illiteracy rates based on literacy
campaigns, adult education and similar programmes are not always reliable, since they often fail to take
into consideration such factors as the increase of population, its distribution between urban and rural areas,
and relapse into illiteracy among persons who have attended literacy classes, etc. Other estimates
unsupported by any statistical data, are obviously susceptible to a large margin of error. The relationships
between illiteracy and school enrolment, urban industrialization and estimates of national income will be
examined further in Chapters VIII to X. Where relevant, such related factors have been taken into
consideration in arriving at estimates of illiteracy rates for those countries for which more direct means of
estimation are not available. Finally, in order to fill the remaining gaps, tentative estimates have been made
for a number of countries on a subjective basis utilizing different kinds of background information, such as

18
the stage of economic, social and cultural development, educational traditions, existence of a written
language and of printed literature, extension of mass communication, etc. In view of the difficulties
involved, most of the estimated illiteracy rates will be shown in ranges of approximately 5 per
cent…[although] in certain cases even a range of 5 per cent may not be broad enough to indicate the
tentative nature of the estimates.
The paucity of census reports was particularly marked for Africa, and to a slightly lesser
(though still large) extent Asia. The prospect of effecting any significant improvement in the
worldwide coverage, reliability and international comparability of UNESCO’s literacy statistics
therefore depended as much if not more on how soon the practice of carrying out national censuses
developed in these regions, than on any actions that UNESCO itself could take. Nevertheless, in
the Recommendation concerning the International Standardization of Educational Statistics
(1958), cited earlier, UNESCO set out definitions (quoted earlier) to be utilized by Member States
for the purposes of ‘international reporting’ of statistics of illiteracy, as well as ‘methods of
measurement’ that could be used ‘to determine the number of literates and illiterates’:
(a) Ask a question or questions pertinent to the definitions given above, in a complete census or sample
survey of the population.
(b) Use a standardized test of literacy in a special survey. This method could be used to verify data
obtained by other means or to correct bias in other returns.
(c) When none of the above is possible, prepare estimates based on: (i) special censuses or sample surveys
on the extent of school enrolment; (ii) regular school statistics in relation to demographic data; (iii) data on
educational attainment of the population.
At the same time, the Recommendation set out a definition of ‘educational attainment’ and
related ‘methods of measurement’:
The following definition should be used for statistical purposes: The educational attainment of a
person is the highest grade or level of education completed by the person in the educational system of his
own or some other State.
To measure the educational attainment of the population, the following methods could be used:
(a) Ask a question or questions pertinent to the definition given above, at a complete census or sample
survey of the population.
19
(b) Where this is impossible, prepare estimates based on (i) data from previous censuses or surveys; (ii)
records over a number of years of school enrolment, of examinations, of school-leaving certificates, and of
degrees and diplomas granted.
The Statistics Division subsequently prepared a manual ‘intended to explain the various
suggestions concerning definitions, classifications and tabulations of educational statistics
included in the…Recommendation’ (UNESCO 1961). The intended audience was ‘government
officials responsible for the collection and compilation of educational statistics in their countries,
in order to elicit their views regarding the consequences and practicability of these suggestions [as
well as to serve as a basis] for discussion at various regional meetings on educational statistics to
be held during the coming years’.
By the time UNESCO next came to take stock of census-sourced data on illiteracy, twenty
years after the publication of World Illiteracy at Mid-Century (1957), the situation had improved
considerably as regards both the availability of such data, and possibly also their reliability and
international comparability. Statistics of Educational Attainment and Illiteracy 1945-1974
(UNESCO 1977a) was able to present statistics taken from censuses and surveys carried out in 164
countries and territories,20 i.e. well over double the number for which such statistics were available
twenty years earlier. As noted in the preceding section, the presentation of statistics on levels of
educational attainment was an innovation partly motivated by the Statistics Division’s emerging
interest in establishing a basis for making projections of illiteracy rates, but there was also another
reason:
In interpreting illiteracy statistics the reader is reminded that they are usually based on self-enumeration
(rather than on literacy tests) and that the borderline between illiterate and literate is much hazier than
between other types of educational conditions (e.g. no schooling and some schooling). Definitions in
censuses and surveys generally follow the UNESCO 1958 Recommendation, [but] the application of the
general definition varies between countries and the role of the enumerator can influence the results quite
considerably. In order to help overcome some of these deficiencies of the data, the present publication
shows statistics on educational attainment as well as on illiteracy, and the reader can compare the two sets
20 Statistics on illiteracy were actually presented for 179 countries, but for 15 countries the statistics were not in fact drawn from censuses or surveys but from estimates that the Statistics Division itself had made (on the basis of other sources) for its Statistical Background document prepared for the World Congress of Ministers of Education on Illiteracy (Teheran, 1965).
20
of data and form his (her) own conclusion regarding the significance of illiteracy with respect to regular
schooling.
In a remarkably concise presentation, Statistics of Educational Attainment and Illiteracy
1945-1974 enabled the reader readily to identify for each country: (1) the specific way (out of 115
different ways worldwide) that the data on educational attainment were classified by level and
years of education in the original source documents, and (2) the specific way (out of 133 different
ways worldwide) that the data on educational attainment and illiteracy were classified by age
group in the original source documents. For example, with reference to illiteracy: Brazil in its
1950 census classified the number of illiterates (whether male or female) by the age groups 5-9,
10-14, 15-19, 20-24, 25-34, 35-39, 40-49, 50-59, and 65 and over, and in its 1970 census it
classified them by single year up to age 39, then by five-year age groups up to 79, then 80 and
over. On the other hand, Uganda in its 1959 census classified them by the age groups 6-15, 16-45,
and 46 and over, and in its 1969 census by 15-19, 20-24, 25-34, 35-44, 45-54, 55-64, and 65 and
over. Egypt, in both its 1947 and 1960 censuses, classified them by 10-14, 15-19, 20-24, 25-34,
35-44, 45-54, 55-64, and 65 and over. In the cases of both Brazil and Egypt, therefore, the
literacy/illiteracy status of any given age cohort could be followed over time from one census to
the next. These and other similar cases, as will be seen in the next section of the paper, were to be
of particular interest to the Statistics Division when it began to explore ways of making projections
of illiteracy rates.
Also relevant for the same reason were cases where both the literacy rate and the level of
educational attainment could be identified for given age groups, especially the 15-19 age group (as
was noted in the preceding section). Thus, although Egypt’s two censuses above did not provide
for this, Brazil’s two censuses as well as Uganda’s 1969 census did, as also many other countries’
censuses. The levels adopted for classification purposes in Statistics of Educational Attainment
and Illiteracy 1945-1974 were those set out in the 1975 Revised Recommendation, the lowest
level (no schooling/never attended school) being of particular interest to the Statistics Division for
the reasons indicated in the preceding section.21
21 Up until the adoption of the 1975 Revised Recommendation, the concept of ‘level of education’ had been problematic. The 1958 Recommendation had suggested that countries report data on their population by level of educational attainment, but it didn’t advise on how such levels should be defined. This oversight was corrected with the adoption of ISCED in the 1975 Revised Recommendation, although in the event ISCED itself proved not to be
21
Statistics of Educational Attainment and Illiteracy 1945-1974 marked almost the high-
water level in the overall worldwide availability of census-sourced illiteracy data. In the years
following its publication, indeed up until the end of the 1990s, the coverage of countries barely
changed. Many countries of course carried out further censuses, although in some cases only one,
before the end of the 1990s, while some of the 20-30 countries that had not carried out a national
census before 1974 did so subsequently. Thus, at any given year during the 1980s and 1990s, up-
to-date data would be available for only a limited number of countries; there would be some
countries for which recent census data (less than five years old) were available, others for which
the most recent data were 10, 15, 20 or more years old, and some (including most of the industrial
countries) for which no data were available. This unavoidably was the nature of the database.
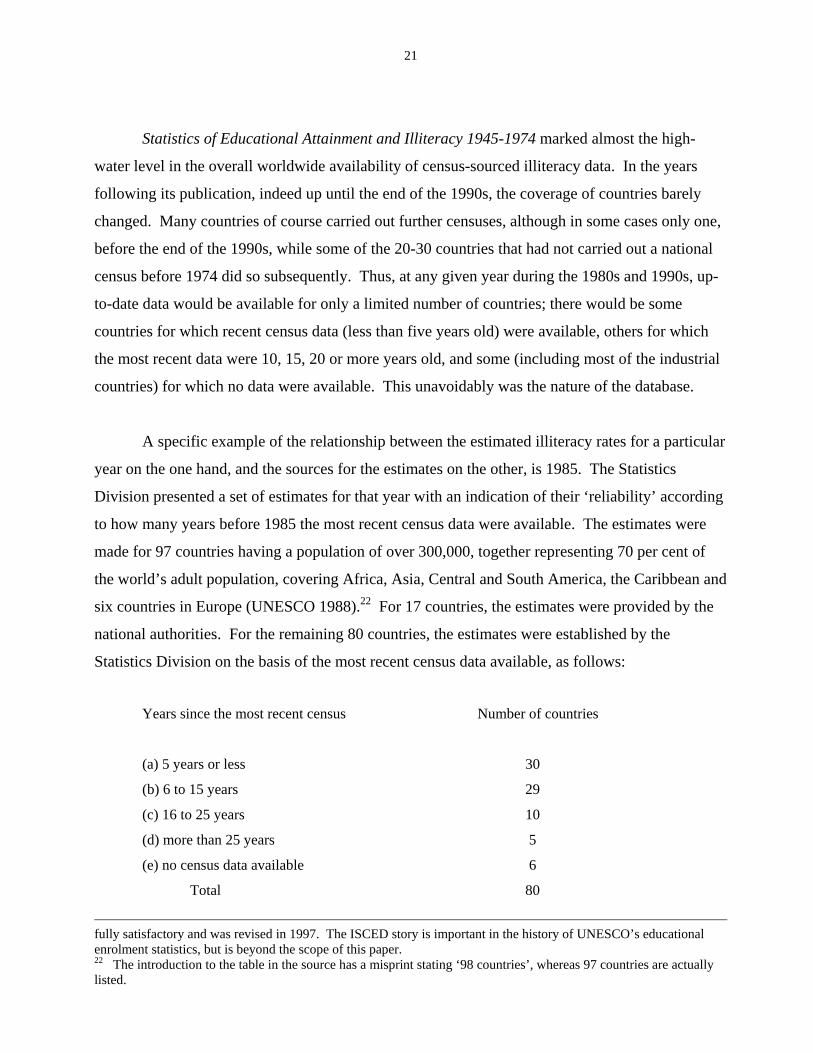
A specific example of the relationship between the estimated illiteracy rates for a particular
year on the one hand, and the sources for the estimates on the other, is 1985. The Statistics
Division presented a set of estimates for that year with an indication of their ‘reliability’ according
to how many years before 1985 the most recent census data were available. The estimates were
made for 97 countries having a population of over 300,000, together representing 70 per cent of
the world’s adult population, covering Africa, Asia, Central and South America, the Caribbean and
six countries in Europe (UNESCO 1988).22 For 17 countries, the estimates were provided by the
national authorities. For the remaining 80 countries, the estimates were established by the
Statistics Division on the basis of the most recent census data available, as follows:
Years since the most recent census Number of countries
(a) 5 years or less 30
(b) 6 to 15 years 29
(c) 16 to 25 years 10
(d) more than 25 years 5
(e) no census data available 6
Total 80
fully satisfactory and was revised in 1997. The ISCED story is important in the history of UNESCO’s educational enrolment statistics, but is beyond the scope of this paper. 22 The introduction to the table in the source has a misprint stating ‘98 countries’, whereas 97 countries are actually listed.

22
This pattern would have applied (more or less) to the estimates established for any year in the
1980s or 1990s.
Projections
A formal method (systematic procedure or approach) for making worldwide estimates and
projections of illiteracy rates was not devised by the Statistics Division until 1978, following
research carried out on the census data that had been accumulated earlier for the publication,
Statistics of Educational Attainment and Illiteracy 1945-1974. The research was published by
UNESCO (1978b). Before then, in respect to the first set of estimates (for ‘around 1950’), and
then later for the estimates prepared for the 1965 Teheran World Congress, the approach was
relatively informal.
The reasoning behind the 1978 approach, to state the matter in a somewhat oversimplified
way, was essentially based on three interlocking assumptions, in effect arguments. First, if a
person had not achieved literacy by the time he/she entered the 15-19 age-group, then, unless this
was subsequently corrected by some means of adult formal or non-formal education, it could be
assumed that he/she would still be illiterate upon reaching the age group 25-29 at the time of the
next census ten years later, and so on to higher age groups at succeeding censuses. Second,
assuming that the incidence of illiteracy in the 15-19 age group was basically related to the
percentage of persons in that age group who had either never attended school or did not complete
their primary education, then the future incidence of illiteracy in the 15-19 age group could be
estimated from projections of future participation in primary education. Third, and lastly, given
the projected incidence of illiteracy in the 15-19 age group, given also assumptions about the
future impact of adult education, whether formal or non-formal, and given projections of future
trends in mortality and net migration by age group, the total number of illiterates for all age groups
aged 15 years and over could be estimated.
The entire approach was operationalized by a set of regression equations derived from the
1945-1974 census data. The details of the regressions are available in UNESCO (1978a). It
23
suffices here to note that the literacy rate for the 15-19 age-group in a given year was estimated
from a regression equation which had the 6-11 age-specific school enrolment ratio of nine years
earlier as the independent variable, not quite an exact match in terms of age range (six years
compared to five), but close enough as didn’t matter.23 The illiteracy rate for the 15-19 age-group,
together with the census-sourced illiteracy rate for the age-group 15 and over in the base year
(1970), were then utilized as independent variables in other regression equations in order to
estimate the illiteracy rate of the population aged 15 and over in a future year (Fisher 1978a).
Stone’s review of the research study on which the regressions were based, as well as three related
studies that were carried out at the same time,24 may be consulted at source (Stone 1978). Among
other things, he thought that there might be room for trying out different forms of regression apart
from those that were chosen in the study. He noted too that the utilization of regressions based on
pooled data from many different countries at different census dates for the purpose of making
estimates for any one particular country was inherently problematic, given the differences between
countries in types of education system, levels of development, demographic conditions, and so
on.25 His overall conclusion, though, was broadly supportive of further work by the Statistics
Division in this area:
Apart from the immense effort involved in collecting and processing data in the different countries of the
world, [these studies] represent a major piece of statistical compilation and analysis. Throughout, the main
constraint on the methods adopted has been insufficiency of data; and it is largely for this reason that more
ambitious methods were abandoned from the outset. Within this limitation a great deal of experimentation
has been carried out and it seems doubtful whether substantial improvements can be expected with the
existing data. However, even as things are, the results obtained are interesting and useful. They bring out a
considerable measure of coherence in a body of data inevitably heterogeneous and hard to compare; they
enable some progress to be made in the difficult task of projecting educational attainment and literacy
ratios; and they point the way to likely sources of improvement in the future. All in all, they contribute to 23 Separate regression equations were utilized for males and females. With z representing the literacy rate for the 15-19 age-group (males), and x representing the 6-11 age-specific enrolment ratio (males) of nine years earlier, the regression equation utilized for estimating z from data available on x was z = 2x – 0.01x2. (Thus, if x = 50 per cent, then z = 75 per cent.) The regression equation was originally derived (R2 = 0.9980) in the earlier research from pairs of observations for 34 countries: Africa (1 country, Ghana), Latin America (12), Caribbean (3, Dominican Republic, Puerto Rico, Trinidad and Tobago), Asia (9, Hong Kong, Indonesia, Korea Rep., Nepal, Philippines, Singapore, Sri Lanka, Thailand, Turkey), Arab States (2, Bahrein, Lebanon), Europe (7, Greece, Hungary, Italy, Poland, Portugal, Spain, Yugoslavia). 24 See the related papers by Le Bras (1978), Magnuson (1978) and Sauvageot (1978).

24
the growing knowledge on recent changes in educational attainment and literacy and on the prospects
before us. Advances in the years to come may be expected from three main sources: further
experimentation with forms of relationships considered here; further studies of the structural and
technological characteristics of educational systems, which presumably contribute much to their
heterogeneity; and the introduction of new data which would permit the use of more ambitious methods.
Apart from these, some improvement can be expected from the mere passage of time, which will provide
more data of the kind available today.
It is not clear why the Statistics Division adopted a new approach in 1989. The research on
which it was based was never published. As mentioned earlier, it estimated future
literacy/illiteracy rates from census data on literacy/illiteracy alone. Like the previous approach, it
assumed that the literacy rate of a given population cohort (say 20-29 in 1970) remains stable over
time as the cohort ages (it will still be the same when the cohort reaches 30-39 in 1980). However,
it then went on to assume that the literacy rates (Y axis) of successive generations aged 15 and
over, when plotted against census years (X axis), trace out a logistic (S-shaped) curve, the precise
form of which is represented by the particular logistic curve that best fits the given census data
(UNESCO 1995b).26 The elegant simplicity of these two assumptions taken together, in enabling
future literacy rates to be read off the logistic curve, while dispensing with the need to account for
the literacy rate of the youngest cohort, was of course attractive.
Whether the assumptions are true is another matter. Although the earlier research carried
out by UNESCO would seem to have justified the first assumption, there doesn’t appear to be any
intuitively compelling reason for believing that the second assumption might be true except by
chance in particular cases.27 The second assumption was quite vital for the interpretation that the
Statistics Division placed on its estimates and projections, which was that they represented the
situation that would arise ‘‘if present trends continue’’ (e.g. UNESCO 1990). That the trends for
individual countries have a particular common form was, however, a hypothesis, possibly a
plausible one but impossible to judge whether it is so in the absence of published research showing
it to be so. 25 In effect, Stone was doubtful that it would be appropriate to utilize the regression equation derived from the 34 countries mentioned in footnote 23 above for estimating the values of z for all countries, as the Statistics Division was later to do when it prepared its worldwide country-by-country estimates. 26 The methodology outlined in UNESCO (1995b) is particularly difficult to follow (at least for this author) in the absence of worked numerical examples applied to two or three selected countries.
25
Policy relevance
There have always been limits to the policy relevance of UNESCO’s international literacy
statistics. In approaching this subject it may be helpful to distinguish between: (1) two levels of
policy relevance, the national and international, and (2) within each level the two kinds of statistics
that UNESCO published, namely, census data, as in Statistics of Educational Attainment and
Illiteracy 1945-1974 (UNESCO1977a), and estimates and projections, as in Estimates and
Projections of Illiteracy (1978a), or the later Compendium of Statistics on Illiteracy – 1995 Edition
(UNESCO 1995a).
Taking the question of policy relevance at the national level first, one may start by asking
what would any given developing country’s educational policy-makers know about the incidence
of illiteracy in their country in a given year if there were no UNESCO estimate? Besides their
own direct experience, they would probably know what was found by the most recent national
census, which in the best of circumstances would have been carried out two or three years earlier
(given the time that it normally takes to process a census), and in the majority of cases would most
likely have been carried out several years ago. They would also know that the way their census
measured illiteracy was uncertain for various reasons (type(s) of question utilized in the census
schedule, biases of enumerators, etc.). They would know too from UNESCO’s publications of
worldwide census statistics how their country’s illiteracy rate compared with the illiteracy rates
reported in the national censuses of other countries, not necessarily for the same year but in many
cases not too many years apart, and they would assume that the illiteracy rates for other countries
were probably just as uncertain as their own country’s illiteracy rate.
What more do the national policy-makers want (or need) to know? They know they’ve got
a problem that needs to be tackled, and that give or take a few thousand or a few million illiterate
citizens (depending on the country’s size), the problem will still be there tomorrow and in a year’s
time unless they can mobilize the resources and will to do something about it. What difference
will it make to their overall appraisal of the situation to have a UNESCO estimate of the number of
27 The particular case of Algeria is given in UNESCO (1995b).

26
illiterate citizens they have got this year? They know that the UNESCO estimate is just that, an
estimate, and they know that there is no practical way of discovering whether it is right, other than
by comparing it with the (uncertain) figure given by their own most recent national census;
provided that there was no radical discrepancy between the two, most national educational policy-
makers would have accepted UNESCO’s estimates for what they were, as representing a good
faith effort to identify patterns in the worldwide incidence of illiteracy. In cases where there was
disagreement with an individual Member State, this usually happened because experts in that State
had come up with a different estimate from UNESCO’s, but so long as their estimate was based on
a serious study of conditions particular to their country UNESCO had little choice other than to
substitute it for its own estimate (as was done for the 17 countries in the 1985 worldwide estimates
mentioned in the preceding section).28
Turning now to policy relevance at the international level, it is here perhaps that
UNESCO’s international literacy statistics were most useful. Two aspects of policy relevance at
this level may be mentioned: political and institutional. The political aspect is easily recognized:
the awareness of the worldwide incidence of illiteracy on the part of national leaders of all
countries (even if in most cases this awareness would only have been slight) formed part of their
awareness, and understanding even, of the nature of the relations that their own country could have
with others, whether neighbouring countries or countries far away in other continents. The
incidence of illiteracy, as Huxley observed when UNESCO came into existence, was a clear-cut
indicator of how far a country was from realizing the right to education, and other human rights
too. In the universal political forums of UNESCO’s General Conference and the United Nations
General Assembly, not to speak of any number of regional political forums, the worldwide
incidence of illiteracy was therefore a matter of continuing interest and debate, though more so at
some times (1960s/early 1970s, and late 1980s) than at others. UNESCO’s international literacy
statistics, whether just the census data or the estimates and projections, helped to inform that
interest and debate, and if UNESCO through research could find patterns in the worldwide
evolution of illiteracy rates, and could account for these patterns, then so much the better.
28 Thus illustrating Stone’s point about the inherently problematic nature of individual country estimates derived from cross-country regressions (Why should any particular country’s literacy/illiteracy rate for a given year be assumed to fall exactly on UNESCO’s regression line?). A similar argument applies to the estimates derived from the
27
The institutional impact of UNESCO’s international literacy statistics was readily apparent
in UNESCO’s own education programme, serving as a continuous reminder of the challenge to be
overcome in fulfilling the Organization’s purposes, and as a basic justification for a certain amount
of priority for programme activities relating to the eradication of illiteracy.29
For UNESCO’s major institutional partners, UNDP, UNICEF and the World Bank, the
direct relevance of UNESCO’s international literacy statistics in terms of programme activities
during the period under review would generally have been slight, except in the case of UNDP in
the 1960s when the Experimental World Literacy Programme got under way, and in the case of
UNICEF probably in the latter part of the 1990s. World Bank lending for adult literacy
programmes would have been very minor.30 UNDP’s decision to include UNESCO’s
literacy/illiteracy estimates in the calculation of its Human Development Index was its own choice.
References
Abel, J. F. and N. J. Bond (1929). Illiteracy in Several Countries of the World. Washington D.C.:
Government Printing Office (U.S. Bureau of Education, Bulletin, 1929, No.4).
Bataille, L. (1976). A Turning Point for Literacy. Oxford: Pergamon (Proceedings of the
International Symposium for Literacy, held in Persepolis, Iran, 3-8 September 1975.)
Bhola, H.S. (1984). Campaigning for Literacy. Paris: UNESCO.
Elley, W. B. (1992). How in the world do students read? Hamburg: International Association for
the Evaluation of Educational Achievement.
Fisher, A. (1978). “The Use of Variables Relating to Primary Education to Explain Literacy
Rates’’, in: UNESCO 1978b.
Statistics Division’s 1995 methodology (Why should any particular country’s literacy/illiteracy rate for a given year be assumed to fall exactly on UNESCO’s hypothetical logistic curve?). 29 And sometimes for education programme activities of a more general nature, such as the E-9 Programme (agreed at the meeting of the World Education Forum in New Delhi in 1993), the idea of which was based in part on UNESCO’s estimates showing that the E-9 countries accounted for around three-quarters of the world’s illiterate adults. 30 The extent to which this was due to the Bank’s unwillingness to lend for adult literacy activities, as distinct from the unwillingness of countries to borrow for them (as opposed to other education programmes), would be difficult to measure, though both factors certainly would have been relevant. Concerning the Bank’s education lending programme and policies, see World Bank (1971, 1974, 1980, 1995, 1999).
28
Inter-Agency Commission (UNDP, UNESCO, UNICEF, WORLD BANK) for the World
Conference on Education For All (1990). World Declaration on Education For All and
Framework for Action to Meet Basic Learning Needs. New York: UNICEF.
International Bureau of Education (IBE) (1990a). ‘‘Analysis of Replies to the Questionnaire on
the Theme of the Forty-Second Session of the International Conference on Literacy
Education (1990)’’, by V. Adamets and I. Kouassigan. Geneva: IBE. (IBE Document
Series, Number 3, July 1992.)
___ (1990b). ‘‘Replies to the Questionnaire on the Theme of the 42nd ICE on Literacy’’. Geneva:
IBE. (IBE Documents Series, Number 2, December 1991.)
Jones, P. (1988). International Policies for Third World Education: UNESCO, Literacy and
Development. London: Routledge, 1988.
Le Bras, H. (1978). ‘‘Methodological Study on the Projection of Educational Attainment for the
Population Aged 15 and Over’’, in: UNESCO 1978b.
Magnuson, O. (1978). ‘‘Developing a Model for Projecting the Future Educational Attainment of
the Population Aged 15019 and 20-24 in developing Countries’’, in: UNESCO 1978b.
OECD (1995). Literacy, Economy and Society. Paris: OECD.
Postlethwaite, N. and K. Ross (1992). Effective Schools in Reading: Implications for Educational
Planners. Hamburg: International Association for the Evaluation of Educational
Achievement.
Sauvageot, C. (1978). ‘‘The Relationship between School Enrolment Variables and the
Subsequent Educational Attainment of the Age-Group’’, in: UNESCO 1978b.
Stone, R. (1978). ‘‘Introduction’’, in: UNESCO 1978b.
UNESCO (1953). Progress of Literacy in Various Countries. Paris: UNESCO.
___ (1957). World Illiteracy at Mid-Century. Paris: UNESCO.
___ (1958). Recommendation concerning the International Standardization of Educational
Statistics. Paris: UNESCO.
___ (1961). Manual of Educational Statistics. Paris: UNESCO.
___ (1965). World Congress of Ministers of Education on the Eradication of Illiteracy (Teheran,
Iran), Final Report. Paris: UNESCO.
___ (1968). Literacy. Paris: UNESCO.
___ (1970). Literacy 1967-1969: Progress Achieved in Literacy Throughout the World. Paris:
UNESCO.

29
___ (1972). Literacy 1969-1971: Progress Achieved in Literacy Throughout the World. Paris:
UNESCO.
___ (1975). Revised Recommendation concern the International Standardization of Educational
Statistics. Paris: UNESCO.
___ (1977a). Statistics of Educational Attainment and Illiteracy 1945-1974. Paris: UNESCO.
(Statistical Reports and Studies, No. 22.)
___ (1977b). Trends and Projections of Enrolment by Level of Education and by Age. Paris:
UNESCO. (Current Surveys and Research in Statistics, No. 21.)
___ (1978a). Estimates and Projections of Illiteracy. Paris: UNESCO. (Current Surveys and
Research in Statistics, No. 29.)
___ (1978b). Towards a Methodology for Projecting Rates of Literacy and Educational
Attainment. Paris: UNESCO. (Current Surveys and Research in Statistics, No. 28.)
___ (1980). Literacy 1972-1976: Progress Achieved in Literacy Throughout the World. Paris:
UNESCO.
___ (1983a). Development of Education in the Least Developed Countries since 1970: A
Statistical Study. Paris: UNESCO. (Current Surveys and Research in Statistics, No.
42.)
___ (1983b). Statistics of Educational Attainment and Illiteracy 1970-1980. Paris: UNESCO.
(Current Surveys and Research in Statistics, No. 44.)
___ (1988). Compendium of Statistics on Illiteracy. Paris: UNESCO. (Statistical Reports and
Studies, No. 22.)
___ (1989). ‘‘Plan of Action to Eradicate Illiteracy by the Year 2000’’. Paris: UNESCO (General
Conference Document No. 25 C/71.)
___ (1990). Compendium of Statistics on Illiteracy – 1990 Edition. Paris: UNESCO. (Statistical
Reports and Studies, No. 31.)
___ (1995a). Compendium of Statistics on Illiteracy – 1995 Edition. Paris: UNESCO. (Statistical
Reports and Studies, No. 35.)
___ (1995b). Methodology used in the 1994 Estimation and Projection of Adult Illiteracy. Paris:
UNESCO. (Statistical Issues, No. 18.)
___ (1965-1997). Statistical Yearbook. Paris: UNESCO. (Various issues.)
___ (2000a). World Education Forum, Dakar, Senegal, 26-28 April, 2000, Final Report. Paris:
UNESCO.
30
___ (2000b). World Education Report 2000. The Right to Education: Towards Education for All
Throughout Life. Paris: UNESCO.
World Bank (1971). Education Sector Working Paper. Washington D.C.: World Bank.
___ (1974). Education Sector Working Paper. Washington D.C.: World Bank.
___ (1980). Education Sector Policy Paper. Washington D.C.: World Bank.
___ (1995). Priorities and Strategies for Education: A World Bank Review. Washington D.C.:
World Bank.
___ (1999). Education Sector Strategy. Washington D.C.: World Bank.
ADDENDUM
Questions and Comments on the Paper
1. Were there disputes within the UNESCO Statistics Division surrounding the worthiness of
collecting literacy statistics, of the operational definitions to be recommended to member states to
be employed, of the move to development of global projections of literacy in the late 1970s and
1980s, of the use being made of these ‘unreliable’ and ‘non-comparable’ statistics by other
international agencies like UNDP, UNICEF, and later World Bank? If so, what was the nature of
these debates/disputes/discussions and why were certain formulae eventually agreed upon?
There would certainly have been discussion and debate from time to time, but little is now
known about these since most of the principals have left UNESCO. No international expert
meetings were organized for the purpose of examining/analysing the issues involved in preparing
worldwide literacy/illiteracy estimates.
In the 1990s, the Division’s main concern over possible misinterpretation of its
literacy/illiteracy estimates was probably UNDP’s use of these estimates for the purpose of
computing the Human Development Index (HDI). UNDP would certainly have been aware of the
Statistics Division’s reservations concerning the validity/reliability of the literacy/illiteracy

31
estimates, but for reasons of its own decided to continue utilizing them anyway. UNESCO could
hardly stop it from doing so, short of not preparing such estimates at all. Given the importance
that UNDP obviously attached to having UNESCO’s literacy/illiteracy estimates (How could there
be an HDI without them?), UNDP funding of UNESCO research into new and improved methods
of obtaining worldwide literacy/illiteracy estimates would have been logical.
2. Why was no explicit language policy formulated by UNESCO in relation to the collection of
literacy/illiteracy data in national censuses? Why did the Division make no explicit mention of the
language in which census takers asked individuals about their literacy skills and about which they
had knowledge? Why was this fundamental aspect of the definition of literacy (both conceptual
and operational) never appreciated or discussed in international fora until quite recently? Did
the politics over which language were or were not considered national or official languages such
that such questions could not be discussed?
UNESCO adopted a neutral policy in its official definitions, leaving it up to Member States
to follow the United Nations Population Commission’s 1948 recommendation that literacy should
be defined as ‘ability both to read and to write a simple message in any language’. The Statistics
Division in 1961 noted that ‘it is not known how many countries have in fact adopted this
definition in their recent censuses of population’ (UNESCO 1961). There is no published record
showing that the Division later acquired such information, but this does not mean that UNESCO in
general was unaware of the issues involved. The question of the language(s) of literacy/illiteracy
was evoked, for example, at the 42nd session of the International Conference on Education
(Geneva, 1990), which had as its theme, ‘The Eradication or Massive Reduction of Illiteracy’.
Indeed, the Questionnaire on this theme that IBE addressed to Member States in preparation for
the Conference requested in its Item 3.8 that information be provided on the ‘Language of
instruction used in literacy courses (if the mother tongue is not the official language)’, and 83
countries replied. The replies were analysed in IBE(1990a,1990b):
The replies confirm that for a significant number of countries whose population speaks a wide variety of
languages and dialects, the language problem is at the centre of the educational authorities’ concerns. After

32
several experiments using various combinations of the official language and the mother tongue, many
countries have come to the conclusion that literacy in the mother tongue must take priority (IBE 1990a).
The language question in respect to literacy/illiteracy was probably regarded within
UNESCO during most of the period under review as part of the larger issue of the language of
instruction to be utilized in education generally. Over several decades the Organization’s
programmes in Education and/or Culture included activities devoted to the promotion of
indigenous languages and the use of the mother tongue in education. The documents and
publications of UNESCO’s Regional Education Office in Dakar in particular could be consulted in
that regard; those of PROAP (Bangkok) and OREALC (Santiago) too. Significantly, UNESCO’s
General Conference has never adopted a normative instrument on language policy in education.
3. Would it be possible to elaborate more on the policy relevance of literacy statistics in the
international arena, not only at the institutional level but at the global level, e.g. with regard to
world conferences such as Jomtien, Dakar, MDGs and conventions and agreements on Human
Rights and children’s rights?
Both the Jomtien and Dakar conferences adopted literacy/illiteracy goals or targets,
although in somewhat different form (see footnote 1). It is evident from the impracticality of its
formulation that statisticians were not involved in drawing up the Dakar goal, but even if this goal
had been expressed in terms of reducing the rate of illiteracy, rather than that of improving the rate
of literacy, there would have remained the question of how countries could be expected to monitor
progress. As indicated in the last two sections of the paper, UNESCO’s literacy/illiteracy
estimates were by their very nature ‘unmonitorable’: they were essentially speculative, their
methodological basis was complex and after 1989 even obscure, and UNESCO would periodically
revise them anyway in the light of new population projections from the United Nations Statistical
Division. Awareness of their limitations was pretty evident during the Mid-term review of the
follow-up to Jomtien (Amman, 1996), and resulted in much unfair criticism of UNESCO’s
Statistics Division. Unfair because the whole idea of setting literacy/illiteracy goals or targets in
quantitative terms that can’t be effectively monitored doesn’t make much sense, and didn’t
originate with the Division (or even with UNESCO?).

33
Unless and until improved methods of preparing worldwide estimates of literacy/illiteracy
are devised, it might make more sense to set goals or targets in this area in terms of activities to be
carried out by countries and their international partners, as was done in UNESCO’s ‘Plan of
Action to Eradicate Illiteracy by the Year 2000’ (UNESCO 1989).
As regards Conventions and agreements on Human Rights and children’s rights, literacy as
such doesn’t feature in them. Nevertheless, literacy arguably was a consideration when the
Universal Declaration of Human Rights was drawn up, particularly with reference to the inclusion
of the notion of ‘fundamental education’ in the Declaration’s Article 26, a notion that was intended
to cover the education of adults who had not had the opportunity to benefit from formal education
when they were young (see UNESCO 2000b). The Convention on the Rights of the Child (1989)
is concerned with the rights of persons under the age of 18 and doesn’t mention the education of
adults. The large amount of international attention given to the educational rights of the child in
the 1990s was not matched by a similar degree of international attention to the educational rights
of illiterate adults who did not have access to primary education—or to primary education of a
decent quality—when they were young.
4. We would like to ask if you could develop slightly the last paragraph of the paper. During the
conversation we had when you came to UNESCO you mentioned the comparatively low priority
given by the World Bank and some countries to the eradication of illiteracy. This is mentioned
very briefly in a footnote to the last paragraph of the paper. Would it be possible to elaborate a
little?
The issue is not the eradication of illiteracy, on which everyone was agreed, but the priority
to be accorded to literacy activities in the Bank’s education lending programme. Certainly the
Bank had priorities in its education lending, and even a quick scan of the Bank’s education policy
documents over the years (1971, 1974, 1980, 1995, 2000) will show that lending for adult literacy
activity was not one of them. The Bank could argue of course that in lending for the development
of the formal education system it was, in a certain sense, ‘cutting off illiteracy at the base’; what is
34
perhaps missing from the policy documents is a clear indication that this was in fact the Bank’s
overall policy in regard to the eradication of illiteracy.
That aside, the Bank’s lending priorities have always been in part a compromise between
its own experts’ views of what countries need, and the views that countries themselves have about
their needs. Did countries from time to time want to borrow for adult literacy activity, as against,
say, the expansion of secondary education? It is quite possible of course, but whether it can be
documented is another matter.
5. It is not easy to appreciate what UNESCO’s approach was at the end of the century. Would it
be possible to show it more clearly?
Its approach at the end of the century in regard to the statistical estimation of the
worldwide incidence of illiteracy was essentially speculative (see the response to Question 3
above). The estimates should be regarded as speculative.
6. In the spate of conventions and political commitments from the Convention on the Rights of the
Child onwards in the 1990s, was good use made of literacy data? Were the data influential? And,
if so, in what ways?
The Convention on the Rights of the Child (1989) was the last international convention to
be adopted containing provisions relating to the right to education, and it doesn’t mention literacy
or the education of adults. UNESCO’s estimates of world and regional totals of the numbers of
illiterates, and their breakdown by male/female, would certainly have been useful and influential
in orienting discussion and debate in international political forums, but their speculative nature
was not widely recognized.
7. Were/are data collected or analysed at sub-national levels?
Some countries in their census reports provided breakdowns by urban/rural, and in such
cases the Statistics Division would present the details in its tables of census-sourced illiteracy data
(see UNESCO’s Statistical Yearbook, various issues).