unemployment in britain: a european success...
TRANSCRIPT

Unemployment in Britain:
A European Success Story
Christopher A Pissarides
December 2003

Abstract Unemployment in Britain has fallen from high European-style levels to US levels. I argue that the key reasons are first the reform of monetary policy, in 1993 with the adoption of inflation targeting and in 1997 with the establishment of the independent Monetary Policy Committee, and second the decline of trade union power. I interpret the reform of monetary policy as an institutional change that reduced inflationary expectations in the face of falling unemployment. The decline of trade union power contributed to the control of wage inflation. The major continental economies failed to match UK performance because of institutional rigidities, despite low inflation expectations. Keywords: unemployment in UK, monetary policy, Beveridge curve, Phillips curve JEL Classification: E5, J5, J64 The Centre for Economic Performance is financed by the Economic and Social Research Council This paper was produced as part of the Centre’s Technology and Growth Programme. Acknowledgements Written for the conference “Unemployment in Europe: Reasons and Remedies” jointly organised by Yrjo Jahnsson Foundation and CESifo, Munich, December 6-7, 2002. I am most grateful to Vassileios Gkionakis of the CEP for excellent research assistance, and to Paloma Lopez Garcia and Giovanna Vallanti for help with the data. I have also benefited from the comments of the discussant at the conference, Pietro Garibaldi. The UK ESRC provided partial financial assistance through its grant to the CEP. Christopher Pissarides is a Programme Director at the Centre for Economic Performance, London School of Economics. He is also a Research Fellow at IZA and CEPR. Published by Centre for Economic Performance London School of Economics and Political Science Houghton Street London WC2A 2AE All rights reserved. No part of this publication may be reproduced, stored in a retrieval system or transmitted in any form or by any means without the prior permission in writing of the publisher nor be issued to the public or circulated in any form other than that in which it is published. Requests for permission to reproduce any article or part of the Working Paper should be sent to the editor at the above address. Christopher A. Pissarides, submitted 2003 ISBN 0 7530 1678 8 Individual copy price: £5

2
1. Introduction
Unemployment in the United Kingdom is one of the European success stories. Starting
in 1993, when it stood at 10.3 per cent of the labour force, it came down to 5.1 per cent in
2002. The beneficiary was employment. The percentage of the working-age population
employed since 1993 has risen in every year, from 70.4 per cent in 1993 to 74.7 per cent in
2001. The labour force changed very little, from 78.5 percent of the working age population
in 1993 to 78.7 percent in 2001. Moreover, both sexes and all ages participated in this
employment gain. This paper documents this success story and discusses the reasons behind
it.
Section 2 reviews the evidence and shows how the big swings of the 1980s gave way
to a long expansion of employment in the 1990s. What appeared like a permanent rise in
unemployment in the first half of the 1980s was reversed in the second half of the 1990s.
Section 3 discusses the British Beveridge curve, with a view to establishing shifts in the curve
which may indicate a structural break. We argue, perhaps unconventionally, that there is only
one convincing structural shift, in the second half of the 1970s. The long swings of the 1980s,
which appear like long-term shifts, can, in fact, be attributed to cyclical shifts. Section 4 does
the same for the Phillips curve and discovers the clue to the British success story. Whereas in
the past a prolonged fall in unemployment led to inflationary pressures and contraction, in the
1990s inflation did not materialise. The economy’s expansion was not halted by policy
because the inflation constraint did not bind. We argue that the key to this change is the
combination of the decline of trade union power and the credible reform of the monetary
policy regime, taking place first in 1993, when the exchange rate target was abandoned in
favour of an inflation target, and strengthened in 1997, when the Bank of England was given
operational independence.
In section 5 I review some of the institutional features of the UK labour market. I
argue that the reforms to the unemployment insurance system are unlikely to have contributed
much to the fall in unemployment. But the decline of trade union power almost certainly did,
in combination with the change in the monetary policy regime. Trade union power reached its
peak in Britain in the late 1970s and its trough in the 1990s (for reasons that we do not yet
fully understand). The fact that unions did not have the power to push for wage rises when
unemployment was falling in the 1990s reinforced the low-inflation credentials of the
monetary policy regime, and helped sustain the fall of unemployment.
3
Section 6 changes theme and reports growth accounting results to show whether the
expansion of employment associated with the fall in unemployment was autonomously
induced by institutional change or caused by exogenous output shocks. If unemployment falls
because of institutional change total factor productivity (TFP) progress and labour
productivity should be less important and employment a more important cause of output
growth. If, on the other hand, the reason for the fall is an exogenous output shock TFP should
be the main driving force of the output growth. I show that in the two big employment
expansions, in the late 1980s and in the period since 1993, employment played a bigger role
in output growth than in other periods. But although the evidence points to a slightly more
important role for employment in the more recent period, it is on the whole unconvincing.
Britain has always been a liberal economy when compared with continental Europe.
Employment protection legislation has never been very strong and product market regulation,
in the form of start-up costs for new businesses and ongoing business regulation, have been
weak (except for a large public sector, which was privatised in the 1980s). So two questions
need to be answered to establish our claim that the reform of the monetary policy regime was
behind the British success story. First, why was unemployment so low up to the mid 1970s,
well before the monetary policy reforms? And second, why did continental Europe, with even
stronger anti-inflationary credentials than Britain, not experience a similar success story?
The answer to the first question lies in the nature of the shocks that have hit the British
economy. In the period before 1974 the shocks that drove output growth were almost entirely
productivity shocks and there was hardly any employment growth. When productivity growth
slowed down in the 1970s wage demands did not follow suit and inflation became a constraint
to maintaining high employment. The answer to the second question lies in the institutional
structure of the labour market. The continental European countries with the anti-inflation
credentials have restrictive labour market institutions, which Britain does not have. With the
exception of trade union power, where Britain was firmly in the European arena until the
second half of the 1980s, British institutions have always been closer to US institutions than
to continental European ones. The constraint that stopped Britain short of achieving US-style
success in the 1970s and 1980s is the wage pressure and subsequent inflation that each fall in
unemployment caused. Once trade unions lost their power and the Bank of England
established its anti-inflation credentials, the inflation constraint eased and the British labour
market took the transition path from continental Europe to the United States.
4
2. Unemployment trends
Figure 1 shows the recorded rate of unemployment in Great Britain since 1970 and a
rate that is smoothed for short-term fluctuations. Most of the rise in unemployment from the
low values of 2 to 3 per cent before 1973 to nearly 12 per cent in 1986 is clearly due to a rise
in the smoothed rate. Commentators have concluded from this that the rise in UK
unemployment is a rise in the “natural rate,” namely, in the underlying unemployment rate
that cannot be reduced by expansionary aggregate demand management.1 Equally, the fall in
unemployment since then, to about 5 per cent of the workforce, is a fall in the natural rate.
Currently (2002), aggregate demand policy is neither expansionary nor contractionary,
something confirmed by the stability of inflation over the last few years.
Whether the smoothed rate shown in figure 1 is the natural rate and the deviation
between the smoothed rate and the actual rate is the cyclical component is open to question.
One thing that we can say is that the deviation between the two rates shown in figure 1 is not
the only component of cyclical unemployment. Cyclical shocks can be real and the natural
rate as defined in the preceding paragraph is a cyclical variable. It is certainly true to say,
however, that changes in unemployment due to unanticipated monetary policy are not
interesting in the British context.
The series shown in figure 1, which is based on the labour-force based ILO definition
of unemployment, rises fast between 1979 and 1983 and then falls fast again after 1986. This
is a feature of other definitions of unemployment in the 1980s, but whether the peak year is
1983, 84 or 86 varies according to definition. The underlying feature of unemployment in the
1980s (the “stylised fact”) is a fast rise in 1979-83, a plateau in 1983-86, and a fast decline in
1986-90. The plateau took place at a time when the economy and labour productivity were
growing fast, and it is the feature that gave rise to the “hysteresis” view of unemployment.
Namely, why did the rise in the actual rate of unemployment persist well into the recovery?2
In order to shed more light into what was really happening to unemployment during
this period we turn to employment data. The employment series shown in figure 2 shows a
fast decline between 1979 and 1983, and then a fast recovery between 1983 and 1989; i.e.,
there is no plateau. Naturally, this is reflected in the labour force series. Adding together the
employment and unemployment series gives the participation rate shown in figure 2.
1 This goes back at least to Bruno and Sachs (1985). The work of Layard and Nickell (see e.g. Layard et
al., 1991, Nickell, 1997, and Layard and Nickell, 1999), Phelps (1994), Blanchard and Wolfers (2000), as well as mine (Pissarides, 1986, 1999) also reaches similar conclusions.
2 See, for example, Blanchard and Summers (1986), Layard et al. (1991) and Pissarides (1992).

5
Participation rises between 1965 and 1980, falls sharply between 1980 and 1983 and rises
again between 1983 and 1986. The “hysteresis” years of 1983-86 appear to be years of rising
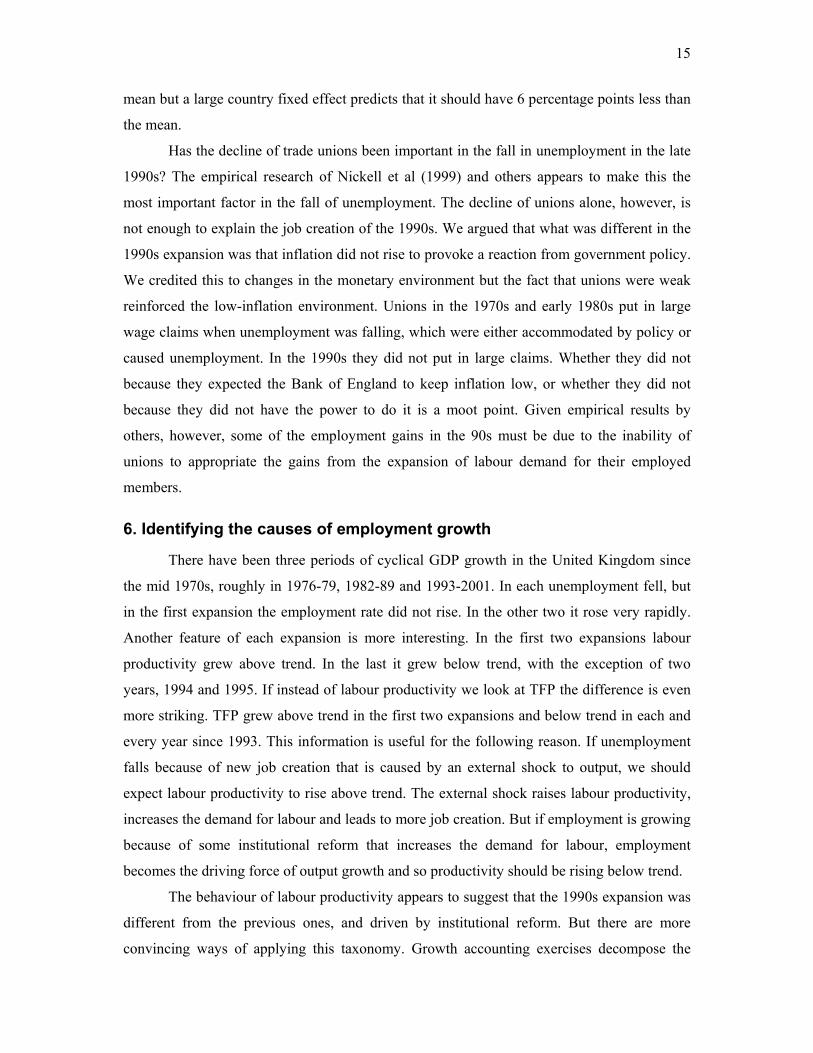
employment but not falling unemployment. In figure 3 I correct for the temporary changes in
the participation rate, which is a reflection of “discouraged” workers who were obviously
prepared to come back into employment when the opportunities presented themselves. The
participation rate was put through an HP filter and the difference between the filtered
participation series and the actual employment series plotted against the recorded
unemployment series. The two series track each other very closely, except for the period
1983-86. The plateau disappears and the constructed unemployment series shows a steep
cycle that peaks in 1983, and falls when the economy begins its recovery in that year. It
would appear that on this interpretation, the “mystery” that taxed the minds of labour
economists at the time – why is unemployment apparently immune to what is happening
elsewhere in the economy – is a peculiarity of the statistical definition of unemployment.
Namely, the fact that it ignores discouraged workers who are available to take up work but are
not searching when the number of vacancies is very low.
The duration of unemployment in the recent expansion has been relatively unaffected
until 1997, when the ratio of long term unemployment (over 52 weeks) to the total declined
sharply, and the ratio of under 26 weeks increased sharply (figure 4). This is consistent with
the view that in expansion the main vehicle for changes in the long-term unemployment rate
is the inflow from short-term unemployment and not the outflow. Namely, when the
expansion started the long-term unemployed did not initially benefit more from it than the
short term unemployed did, but their numbers declined because as more of the short-term
unemployed found jobs fewer entered long-term unemployment.
The number of new jobs created in the 1990s have mostly been full-time regular jobs.
Figures 5 and 6 show the proportion of part-time and temporary jobs for men and women
separately. The proportion of temporary jobs grew slightly for both sexes in the 1990s, but
only by about 1 percentage point in total. Temporary jobs are below 8 per cent for both sexes
and not an important ingredient of British labour markets, perhaps because employers do not
have much difficulty hiring and firing employees as needs arise.
Part-time jobs, however, are a different proposition altogether, especially for women.
Part-time jobs are an important element in the female labour market, accounting for about 45
per cent of total employment. Perhaps surprisingly, this proportion has been fairly constant
during the recent cycles in employment. Survey evidence shows that far from employers
using part-time jobs for women to smooth fluctuations, or to get around labour restrictions,

6
they are jobs which are in demand by women and used by employers in their normal
operations3
Part-time jobs for men account for a much smaller fraction of employment but this
fraction has grown by some three percentage points during the recent employment expansion.
The fastest growth, however, took place during the employment contraction of 1989-93, and it
continued in the subsequent expansion, especially in 1993-97. This goes against any argument
that the fall in male unemployment after 1993 is due to the expansion of part-time jobs. More
work is needed on the role of part-time jobs in the male labour force, as more Labour Force
Survey data become available and part-time jobs are acquiring an increasing role in it.4
3. The UK Beveridge Curve
Beveridge curves have become important tools for identifying the causes of changes in
unemployment. Their interpretation, however, is still open to question. Recent theoretical
advances show that both the cycle and structural changes can shift the Beveridge curve,
although the shift due to the business cycle should reverse when the cycle reverses.
The position of the Beveridge curve depends on the rate of job destruction in the
economy (the ratio of jobs destroyed to the stock of employment), the incentives that
unemployed workers have to look for a job and on mismatch. The Beveridge curve should be
further away from the origin in recession than in recovery. One reason for this claim is the
higher job destruction that takes place in recession. Another is connected with the search
disincentives that workers have in recession. Search disincentives are likely to be higher in
recession partly because non-market returns, including the real level of unemployment
benefits, are likely to be less cyclical than market returns, and partly because during recession
the average duration of unemployment lengthens and discouragement builds up. The
traditional classification of shocks as cyclical when they cause a movement along the curve
and structural when they shift the curve needs to be modified to take into account large
departures of the economy from the underlying curve that may appear as shifts to the
econometrician, although they are temporary deviations due to the cycle.
Generally speaking, a structural shift in the Beveridge curve is one that does not
reverse itself when the cycle returns to the point where it was when the curve started its shift.
3 Evidence on job satisfaction can be found in the European Household Panel. See Pissarides et al (2003) on this and other issues relating to the female labour market in Europe and the United Kingdom. The “women’s” literature dismisses part-time jobs as secondary, but without evidence beyond some anecdotes. See e.g. Franks (1999, p. 79-86).
4 For example, there has been a large rise in the number of full-time students holding part-time jobs, which needs more research.

7
One that reverses is a cyclical one. The problem with identifying some shifts is that the cycle
may be long, and the temporary shift in the Beveridge curve associated with it may last
sufficiently long to appear as a structural one.
The UK Beveridge curve, shown in figure 7, is consequently open to more than one
interpretation, depending on how one views the apparent shifts in the curve. My interpretation
of some of the observations on this curve is unconventional. A “textbook” interpretation is
provided by the experience of the 1970s. In 1974 vacancies were falling sharply and
unemployment was rising, so one would expect the 1975 observation to be to the left of the
1972 one. This is not the case in figure 7 so this would normally be evidence of a small shift.
But if instead of actual unemployment we use the corrected unemployment series of figure 3
this shift disappears: the 1975 observation in the corrected series is to the left of the 1972 one.
A much more pronounced shift in the curve took place between 1975 and 1978. The key to a
structural shift at this time lies in the fact that when vacancies recovered in 1978 and 1979,
they recovered at some 2 percentage points of unemployment above the level that the
observations from the early 1970s would lead one to expect. Between 1970 and 1981 there are
two Beveridge curves in the UK, each broadly associated with a growth cycle. The curve
traced by the 1978-81 observations is clearly to the right of the one traced by the 1970-74
observations. The shift in the curve in the second half of the 1970s was probably due to the
sharp realignment of relative input prices that took place in 1974-5, and the mismatches that it
created in the labour market.
An apparently uncontroversial interpretation of what happens next is that between
1981 and 1983 the curve shifted out, because of its north-eastern movement. But my
interpretation is that this shift is temporary, and is associated with an unusually long cycle.
The outward shift in the early 1980s was due to two events, the big structural change that took
place in the British economy in the early 1980s, with the associated fast decline of
manufacturing, and the built up of long-term unemployment, which followed the unusually
deep recession in 1981. Both these events eventually corrected themselves, in the recovery
phase of the cycle. The rate of growth of GDP increased in the UK in every year between
1980 and 1988 (except for 1984), the rate in 1988 being the highest observed since 1973.
Growth was still positive in 1990. The deep recession of 1981 was succeeded by the long
recovery of 1981-90. Because the recession in the early 1980s was so deep, the shift in the
curve associated with the cycle was bigger than in previous cycles. The return path was also
longer and slower than previously. The built-up of long-term unemployment and the
discouragement that it precipitated are key to the slow reversal of the shift. The observations

8
from 1980 to 1989 trace an unusually large anti-clockwise loop, with 1983-86 the deepest
points of the recession in the labour market.
The increase in long-term unemployment in the 1980s led to the introduction of active
labour market policies. ALMPs shift the Beveridge curve towards the origin and Britain had
some moderate success with these, especially with the restart programme for the long-term
unemployed (see Jackman et al, 1990, OECD, 1993). At best, however, these programmes
accelerated the self-correcting mechanism that took place during recovery. It is doubtful
whether the active labour market policy measures of the late 1980s had a permanent effect on
the position of the Beveridge curve.
1989 appears to be a turning point in the labour market. Growth was at 2 per cent,
unemployment down to 6 per cent and vacancies high. In 1990 growth and vacancies fell
sharply but unemployment continued for a while its downward path. A doubt that may be
raised about the cyclical interpretation of the shift in the 1980s is the question, why did
unemployment not fall more before recession came in 1990? The recession of the early 1990s,
however, was policy-induced. Monetary policy in Britain changed at this time, first
shadowing the deutchemark and then entering the ERM, and the 1989 inflation rate of 7.5 per
cent was unsustainable (the Chancellor of the Exchequer expressed “surprise” by how quickly
inflationary pressures followed his expansion of 1986-7). In 1990 the economy was subjected
to a large deflationary monetary shock which lacked credibility (see below for more on this)
and unemployment increased.
The question for the Beveridge curve is whether the fact that the 1989-93 increase in
unemployment is to the right of the 1979-81 increase is evidence of more mismatch in the
labour market in the 1990s than in the early 1980s. There can be no clear answer to this
question but my interpretation of it is that it is not. The Phillips curve discussion in the next
section gives more support. Inflation was much higher in the early 1980s but in the early
1990s external pressures forced a contractionary aggregate policy which stopped the economy
short of returning to its 1979-80 position.
The loop traced from 1989 to 1997 is another textbook Beveridge curve. But once in
the low unemployment equilibrium of 1997, no contraction took place, despite a small fall in
the GDP growth rate. Unemployment continued to fall, and by 2000-01 it reached its late
1970s position. Is this evidence of an inward shift or is it a return to the steady-state position
of the late 1970s, after the long recession and recovery of the 1980s and 1990s? There is
evidence to support both lines of reasoning. From 1994 onwards growth was steady or falling,
vacancies were steady, inflation was steady and yet unemployment was falling. Viewed in

9
this light, this is evidence that something happened in the labour market which improved the
natural rate. One can look for institutional reform in the labour market but these were also
years of fundamental reforms to monetary policy, which did not allow inflationary pressures
to build up. We claim that the monetary policy regime can be important in labour markets
beyond the short run, and argue that the dynamics of the natural rate observed in the 1990s
can be attributed to the reform of monetary policy. This introduces an old fashioned, yet
currently neglected “institution” in the dynamics of unemployment, monetary policy, but it
introduces it as an influence on the NAIRU, not on the short-run deviation between the
NAIRU and actual unemployment. To see the importance of this we turn to the Phillips curve.
4. The UK Phillips Curve
Before the advent of supply shocks and the Lucas critique of the Phillips curve, the
dynamics of unemployment in the UK were described in terms of the “stop-go” cycle. The
Phillips curve played a key role in this description. Starting from recession, the economy was
given the “go,” to bring unemployment down. But after a brief fall, inflation picked up. The
“brakes” were applied, to bring it under control. Both expansionary and contractionary
policies were real – fiscal policy, the regulation of hire-purchase5 – although interest rate
policy was also used as an anti-cyclical tool.
In modern language the stop-go cycle describes the interplay between a “shock,” real
aggregate policy, and an “institution,” the monetary policy regime. The monetary policy
regime determines expectations, and expectations determine the point at which inflation picks
up to check a further decline in unemployment. Inflation is a constraint on low
unemployment, and because inflation differentials across the world cannot be large for long
periods, countries with more inflationary bias in their monetary policy regime have to operate
at a higher level of average unemployment than countries with lower inflationary bias. A
close look at the UK Phillips curve tells this story. It is shown in figure 8 for the years 1965-
2001. The Phillips curve with corrected unemployment tells a similar story, except that the
recovery of 1986 shown in figure 8 starts in 1983.
In 1973-75 the supply shocks hit and moved the economy in a north-eastern direction,
increasing both inflation and unemployment. There have been three cycles in the UK since
1975 and each one traced a path in inflation-unemployment space that was increasingly flatter
5 Before the widespread use of credit cards, most durables were financed by hire-purchase, essentially a
loan arranged by the seller of the durable and repaid in instalments. Policy controlled the minimum down-payment, namely, the cash amount that the seller had to put up initially, and used this down-payment as a means of cyclical control of the economy.

10
and closer to the horizontal unemployment axis than the previous one. From 1975 to 1986 (or
to 1983 with corrected unemployment) the path traced by the economy is a textbook example
of a short-run Phillips curve, with a minor exception in 1979-80, when another oil shock
moved the economy north-eastwards. The predominant move from 1975 to 1986 is one of a
fall in demand and a move down, along a fairly steep curve. Inflation fell from 26 to nearly 3
per cent but unemployment rose from 3 to 12 per cent. The period 1986 to 1993 traces another
textbook Phillips cycle, but now along a flatter curve. The trade-off improves. Unemployment
went down from 12 to 6 per cent but inflation increased only from 3.3 to 7.5 per cent. Then,
in 1993, unemployment falls again, and the fall continues to the end of the sample, along an
even flatter Phillips curve. Unemployment fell from 10.5 to 5 per cent with hardly any move
in inflation.
Thus, excluding the oils shocks, we can trace three “Phillips curves” in the UK, with
increasing flatness. The less favourable curve of the 1975-86 period, the flatter and more
favourable trade-off of the 1986-93 period and the most favourable trade off, the post-1993
period. A natural interpretation of this downward shift of the Phillips curve is in terms of
inflation expectations. In the late 1970s inflation became so entrenched that a fall in demand –
justified by “monetarism,” which, despite popular belief, started in 1976 with the visit of the
IMF and not with Thatcher – caused a lot of unemployment before inflation could be brought
down. By 1986 the recession and the monetarist policy followed by the government finally
brought inflation expectations down, but they did not eliminate their cause. When the
government expanded the economy again in 1987, with an election imminent, unemployment
fell along a flatter Phillips curve. But inflation increased to a level that was still inconsistent
with government policy objectives. The objectives of monetary policy changed in the late
1980s to an exchange rate target, with sterling shadowing the deutchemark, first from outside
and then from inside the European Exchange Rate Mechanism (ERM). An inflation rate of 7.5
per cent was inconsistent with this target, necessitating disinflation and a new policy switch.
Late in 1992 Britain exited the ERM and the Bank of England introduced inflation
targeting. Although independence was not granted to the Bank until 1997, when inflation
expectations fell dramatically, the exit from the ERM and introduction of inflation targeting
did not increase expectations except perhaps slightly at first, which may explain the move of
inflation from 1.4 in 1994 to 3.3 in 1996. But inflation targeting soon brought inflation
expectations down and the granting of independence to the Bank in 1997, with low inflation

11
as the only objective, made the short-run Phillips curve essentially flat.6 The monetary policy
regime became an “employment-friendly” institution. The growth of the second half of the
1990s did not hit the inflation constraint but allowed unemployment to fall to the levels of the
high inflation era of the late 1970s.
Is it reasonable to attribute so much sluggishness to inflation expectations as is
apparent in the 1970s and 1980s? If we think of inflation expectations in the way that
economists used to think of them when they were estimating Phillips curves, as either
adaptive or rational, the plausible answer is no, it is unlikely that inflation expectations take
so long to adjust to events. But if we rethink the issue in terms of the credibility of monetary
policy the answer changes. In the 1970s and early 1980s the public could not believe that the
inflation bias in British monetary and fiscal policy was taken out of the system. The Treasury
refused to change the institutional rules of monetary policy and monetary policy was
discretionary and completely under Treasury control. The Thatcher disinflation lacked
credibility. It took a massive recession and a large increase in unemployment to bring
inflation down and it took four years to do it.
In 1987, when the expansion was obviously politically-motivated and the operational
ways of the Bank of England did not change, inflation fears built up, as unemployment fell.
But the fear of a complete return to the high inflation era of the late 1970s was averted, partly
because by this time the government established better anti-inflation credentials and partly
because of the switch to the exchange rate target. But the fears were enough to push prices up
to unsustainable levels, albeit much below the inflation levels of a decade earlier. In 1990
another policy-induced recession aimed at the high inflation led to an increase in
unemployment.
But in 1993 the change in the target was an important operational change and in 1997
it virtually acquired the force of law, with the establishment of the independent Monetary
Policy Committee. The economy could then be allowed to expand and bring unemployment
down beyond the levels of the late 1980s, because inflation was removed as an obstacle to the
expansion. Looking at the Beveridge diagram in figure 7 it is apparent that the critical era
began in 1997, when the economy returned to where it was in 1989. But whereas in 1989
inflation rose to 7.5 per cent and the policy brakes had to be applied, in 1997 inflation was
still on target, below 3 per cent, and expansion could be allowed to continue.
6 See Johnson (2002) and references therein for the negative influence of inflation targeting on inflation expectations in Britain and elsewhere. Nelson and Nikolov (2002) show that if monetary policy after the 1973 shocks was run on the same principles as after 1992 the high inflation of the mid 1970s would have been avoided.
12
5. Labour market institutions
Are there any other institutional changes that can explain the fall in the UK natural
unemployment rate?
Panel regressions for the OECD show that the important labour-market institutions
that influence unemployment are the unemployment insurance system and unionisation.7
Employment protection legislation is also sometimes found to be restricting employment
growth, but the results are not robust and usually (as suggested by theory) employment
protection’s influence on unemployment is ambiguous.8 More recently, product market
regulation has been found to be at least as important as labour market regulation in its
influence on unemployment,9 whereas general taxation, in the form of the tax wedge between
labour costs and take-home pay, has failed to show up significantly in unemployment
regressions. 10
Product market regulation includes entry costs for new enterprises, taxation of
entrepreneurial activity, state control of industry and regulation of domestic and international
trade. The United Kingdom has always been one of the least regulated countries in Europe
across the board. The OECD published a comprehensive ranking of 20 economies in 1997 in
terms of their performance along a number of dimensions of product market regulation (see
Nicoletti, Scarpetta and Boylaud, 2000). The United Kingdom came top, beating even the
United States. Of the major European economies Germany was 8th, France was 18th and Italy
20th. Unfortunately there is no time series information on product market regulation to draw
on, but with the exception of the privatisation programme of the 1980s, which reduced the
UK government’s state control of industry, there is no obvious reason to believe that the
relative ranking of the UK has changed in this respect. It is also unlikely that the privatisation
programme led to a big reduction in unemployment, although it may have contributed to the
decline of unions and the moderation of wage demands.
7 See, among others, Scarpetta (1996), Nickell (1997), Nickell et al (1999) and Blanchard and Wolfers
(2000). 8 Blanchard and Wolfers (2000) find it to be significant but they are the exception rather than the rule.
See OECD (1999), Bertola (1999) and Pissarides (2001) for more discussion. 9 See Nicoletti et al (2000), Fonseca et al (2000), Pissarides (2003) and Lopez-Garcia (2003) for some
OECD results and Bertrand and Kramarz (2002) for a more detailed study of the French retail sector. 10 Another possible candidate for the fall in the natural rate after 1997 is active labour market policy in
the form of the New Deal program for the unemployed, which was introduced by the new Labour Government in 1998. The program covered only young people aged 18-24, who had been unemployed for six months. Although its impact on the treatment group was large (Blundell et al, 2002, estimate that on average it increased the transition from unemployment to employment by about five percentage points, or 20 per cent, in the first four months of treatment), the treatment group was too small and the program too recent to have had an impact on aggregate unemployment dynamics.
13
The tax wedge grew in Britain between 1974 and 1981 but declined virtually
monotonically since then (figure 9). But although the timing is approximately right for the
underlying changes in unemployment, it is unlikely to be a major contributor to the fall of
unemployment in the 1990s. First, the fall in taxes from 1987 to 1990 was at about the same
order of magnitude as the fall between 1982 and 1985, and in the 1982-85 period
unemployment experienced its biggest rise. Second, the fall in the 1990s was of a much
smaller order of magnitude than in earlier periods. And finally, panel regressions of
unemployment do not find a significant influence of the tax wedge on unemployment.11
We turn now to a discussion of the two labour market institutions that usually are
found to be significant in panel regressions, unemployment insurance and unionisation. Two
parameters are usually used to capture the influence of the unemployment insurance system,
the ratio of compensation to the mean wage and the duration of entitlement. However, since
the most frequently used measure of duration is the percentage of benefit that an unemployed
worker retains after one year of claiming, this is equivalent to using two replacement ratio
measures, one that applies to the typical unemployed person with less that 52 weeks
unemployment and one applying to those with more than 52 weeks. The two series for the UK
are shown in figure 10.
The replacement ratios shown in figure 10 do not tell a very convincing story.
Replacement ratios are generally low by European standards. In the 1970s they fell and then
rose again but no major changes took place. Beginning in 1980, the replacement ratio for the
short-term unemployed declined fast, from its 1980 value of 33 per cent to 26 per cent in 1982
and to 21.5 per cent in 1988. The ratio for the long-term unemployed also declined, but the
decline started later and it was smaller, from nearly 20 per cent in 1982 to 15 per cent in 1990.
Since unemployment was rising fast in the UK up to 1984, the time of the biggest fall
in the replacement ratio, unemployment insurance policy cannot explain the rise in
unemployment. In 1983 the recovery started and unemployment benefits were falling. But
unemployment fell fast yet replacement ratios after the mid 1980s declined very little. It
would require a large impact of replacement ratios on unemployment and a very large
elasticity to explain the fall in unemployment, if UI is to be the driving force. Elasticities
estimated in micro studies are usually small. The fall in the replacement ratio from the mid
11 Taxes should influence unemployment, if at all, only when they are distortionary, e.g., when they are
progressive or when they distort incentives during job search through the differential taxation of unemployment benefits. Non-distortionary taxes should be absorbed by wages without effect on unemployment, given the long-run tendency of the supply of labour not to respond to changes such as the secular growth in productivity.

14
1980s may have contributed to the decline in unemployment, but it could not have been the
cause.
Unemployment insurance may, however, have played a role through other channels,
which may have come into play in the UK in the second half of the 1980s. One is the built-up
of long-term unemployment and another is trade unionism.
The built up of long-term unemployment in the UK was blamed for the persistence of
unemployment in the mid 1980s. Without generous and long-lasting unemployment benefits,
the argument goes, long-term unemployment would not have built up and unemployment
would not have persisted. The United States is again used as an example of a country with
limited duration benefits that has no long-term unemployment. Empirical evidence is not very
convincing but those who looked at it became convinced that the duration of benefits is
critical in the built up of long-term unemployment.12 The claim that long-term unemployment
causes persistence is also probably justified, although this requires duration-dependence in
exit probabilities, which has not been established beyond doubt in micro studies. It might
therefore be argued that the reforms to unemployment insurance at the end of the 1980s,
including the fall in the level of benefits and the introduction of active policies targeted to the
long-term unemployed, helped to contain the rise in long-term unemployment in the recession
of 1990-93. Figure 4 shows that long-term unemployment was falling throughout the 1990s.
The second institution that is found to be important in empirical studies is
unionisation. Unionisation expanded in the 1970s and reached its peak in the late 1970s
(figure 11). Beginning in 1979 union power declined and in the 1990s unions became
ineffective. Legislation that curtailed union power was passed in the early 1980s, with the
most important measure probably being the 1986 legislation, which prohibited the closed
shop.13 There has been a long debate whether the legislation was responsible for the decline of
unions in the UK, in light of the fact that unions declined also in other large European
countries which did not pass anti-union legislation. Checchi and Lucifora (2002), who looked
at union density in a large number of countries, concluded that the decline of public sector
employment in the UK and the Thatcher government’s anti-union legislation contributed to
the decline of unions. But in their summary evaluation the United Kingdom appears to be
exactly at the median of the sample. The absence of state insurance provision (in the form
generous unemployment benefits, employment protection legislation and wage indexation
clauses) predicts that the UK should have about 6 percentage points more coverage than the
12 Layard et al. (1991), Pissarides (1999). 13 See Booth (1995).
15
mean but a large country fixed effect predicts that it should have 6 percentage points less than
the mean.
Has the decline of trade unions been important in the fall in unemployment in the late
1990s? The empirical research of Nickell et al (1999) and others appears to make this the
most important factor in the fall of unemployment. The decline of unions alone, however, is
not enough to explain the job creation of the 1990s. We argued that what was different in the
1990s expansion was that inflation did not rise to provoke a reaction from government policy.
We credited this to changes in the monetary environment but the fact that unions were weak
reinforced the low-inflation environment. Unions in the 1970s and early 1980s put in large
wage claims when unemployment was falling, which were either accommodated by policy or
caused unemployment. In the 1990s they did not put in large claims. Whether they did not
because they expected the Bank of England to keep inflation low, or whether they did not
because they did not have the power to do it is a moot point. Given empirical results by
others, however, some of the employment gains in the 90s must be due to the inability of
unions to appropriate the gains from the expansion of labour demand for their employed
members.
6. Identifying the causes of employment growth
There have been three periods of cyclical GDP growth in the United Kingdom since
the mid 1970s, roughly in 1976-79, 1982-89 and 1993-2001. In each unemployment fell, but
in the first expansion the employment rate did not rise. In the other two it rose very rapidly.
Another feature of each expansion is more interesting. In the first two expansions labour
productivity grew above trend. In the last it grew below trend, with the exception of two
years, 1994 and 1995. If instead of labour productivity we look at TFP the difference is even
more striking. TFP grew above trend in the first two expansions and below trend in each and
every year since 1993. This information is useful for the following reason. If unemployment
falls because of new job creation that is caused by an external shock to output, we should
expect labour productivity to rise above trend. The external shock raises labour productivity,
increases the demand for labour and leads to more job creation. But if employment is growing
because of some institutional reform that increases the demand for labour, employment
becomes the driving force of output growth and so productivity should be rising below trend.
The behaviour of labour productivity appears to suggest that the 1990s expansion was
different from the previous ones, and driven by institutional reform. But there are more
convincing ways of applying this taxonomy. Growth accounting exercises decompose the

16
growth in output into one of three reasons, employment growth, capital growth or TFP. If
institutional reform is important in driving employment growth the contribution of
employment to output growth should be above historical levels. Figure 12 shows precisely
this indicator. It is the difference between the contribution to output growth of the combined
TFP growth and capital accumulation on the one hand and employment on the other. The
variable shown is very cyclical, rising in periods of output expansion and falling in recession.
But in the growth years of the 1980s the difference is large, indicating relatively more
important productivity growth. With the exception of one year, 1984, the contribution of
capital and TFP growth to output growth is more important in the 80s expansion than in the
expansion of the late 1990s.
This is confirmed by Table 1, which shows the average contribution of each factor to
output growth for selected periods since 1960. On average employment growth contributed
9.6 per cent to output growth. In the expansion of the 1960s the contribution of employment
was smaller and it was negative in the contraction of the 1970s. But it increased to 17.1 per
cent in the expansion of the 1980s and to 19.6 per cent in the expansion of the 1990s. Thus, in
the more recent cycles firms relied more on job creation than on investment and new
technology as vehicles for output growth. They could do this because of institutional changes
that reduced their expectations of wage growth: the decline of union power and the anti-
inflation credentials of the new monetary policy regime are again key to this.
Table 1
Growth accounting for the United Kingdom
Per cent contributions
Period GDP growth Employment Capital TFP
1960-2001 2.5 9.6 49.9 40.5
1960-1973 3.3 7.5 55.3 37.2
1974-1983 1.1 -34.2 79.7 54.5
1983-1992 2.5 17.1 39.1 43.8
1993-2001 3.0 19.6 33.1 47.2
But not much should be made of this because there are only two cyclical upswings,
and they exhibit very similar behaviour in the growth accounting sense. And the most

17
important influence on output is still productivity growth. The biggest contrast to emerge
from the growth accounting exercises is between the period before the mid 1980s and the
period after. This will prove useful in another context, to which we now turn.
7. Possible objections
Our claim that the key to the British success story is the combination of monetary
policy reform and the decline of trade union power needs to deal with two objections. First, it
has to explain why unemployment in European countries that have had credible low-inflation
institutions since the 1960s did not have the same unemployment history as Britain did.
Germany is a case in point. Unemployment in Germany is now amongst the highest in
Europe. Second, Britain had the inflation bias before 1974 but unemployment did not take off.
Why?
The answer to the first question is to be found in other labour market institutions.
Institutions such as high minimum wages, generous unemployment insurance and stringent
product market regulation can cause high unemployment whatever the monetary policy
regime. British institutions, especially since the mid 1980s, have been closer to those of the
United States than to those of Europe. Britain did not have minimum wages to speak of,
always ranked low on product market regulation and the level of its unemployment benefits
has been below other European countries’ levels. Yet, Britain’s unemployment history until
the early 1990s was the history of Europe. The reason is the British economy’s inability to
come out of the 1970s supply shocks with low inflation at prevailing unemployment rates.
Union demands in the 1970s and early 1980s were aggressive and created industrial strife,
with which the government was unable to deal without causing a big rise in unemployment. It
was also unable to deal with the price rises caused by the supply shocks with the prevailing
monetary policy regime. Other European countries could deal with inflation more effectively
but their labour markets were not flexible enough to adapt quickly to the new conditions
without causing high unemployment. So although the unemployment history of the UK was
similar to that of Europe, the causes for the rise in unemployment were different. By the early
1990s unions lost their power to push for big wage rises in the face of falling unemployment
and monetary policy was addressed specifically to inflation. The history of unemployment
and inflation in Britain since then has had more features in common with the history of
unemployment and inflation in the United States than with their history in continental Europe.
The answer to the second question, why was unemployment low in the 1960s, has to
be found in the type of shocks that hit the British economy. The problems that surfaced in the

18
1970s and 1980s were present in 1960s Britain, but were overshadowed by a buoyant
economy, protected from foreign competition and growing fast to reconstruct after the war.
The shocks that hit Britain in the 1960s and up to 1973 were positive productivity shocks. In
Table 1, the period up to 1963 is one of growth but of very small contribution from
employment and a large contribution from TFP progress and investment. The employment
rate in 1971-72 was at the same level as it was in 1965-66 (see figure 2). Between 1962 and
1973 the GDP growth rate exceeded 2 per cent in each and every year, and the rate of growth
of labour productivity was rising faster than trend from one year to the next. The economy
was operating at full employment, but despite the buoyant conditions employment was not
growing. When the negative supply shocks hit in the mid 1970s and the rate of growth of
productivity declined, neither the full employment nor the previous rate of increase of real
wages could be sustained at low inflation rates. Unions became more aggressive in their
demands and the Bank of England accommodated wage demands and public deficits. It was
realised that the policy was unsustainable as early as 1976, but the strong disinflation and
waning of union influence did not take place until after the election of a new government in
1979.
8. Conclusions
We argued that the recent history of UK unemployment is a success story, essentially
because the reforms of monetary policy that took place after 1993, combined with the decline
of trade union power, removed the inflation constraint from a prolonged expansion in real
aggregate demand. There is some evidence from growth accounting calculations that the
reforms also contributed independently to output growth, but it is doubtful whether in
themselves they have been a significant driving force of employment growth. It is more likely
that they enabled a larger fall in unemployment in the face of rising aggregate demand than
would have been possible under the regimes of the 1970s and 1980s.
The view that unemployment in Europe has been structural has been so entrenched in
the minds of economists that monetary factors no longer receive a mention in papers on the
rise and fall of unemployment. Yet, there is a fundamental difference between monetary
factors as reflected in temporary deviations between actual and expected prices and monetary
factors as reflected in the institutional structure of monetary policy. In a world where inflation
differentials between countries cannot deviate for very long, an institutional structure that has
the reputation that it accommodates union wage demands and large budget deficits can act as
a constraint on the expansion of economic activity. A change in the credibility of the regime,

19
backed by legal reforms, can have a large long-term impact on the real labour market
outcome.
This appears to be the factor behind the recent successes in the United Kingdom. With
respect to labour-market institutions, Britain has always been at the less interventionist end of
the European spectrum, resembling in many respects the United States. The reason its
employment performance failed to mimic employment performance in the United States was
the combination of strong trade unions and accommodating monetary policy. In the 1980s it
required a large increase in unemployment to bring inflation down, because strong trade
unions and the absence of institutional reforms to monetary policy led to large wage demands,
in the face of built-in expectations that inflation would erode real earnings. The decline of
union power and the reforms to the monetary policy regime that took place in the 1990s
removed inflation expectations from the labour market and allowed unemployment to fall
without causing big wage demands and inflation.
References
Bertola, G. (1999). "Microeconomic Perspectives on Aggregate Labor Markets." In
Handbook of Labor Economics, edited by O. Ashenfelter and D. Card. Amsterdam:
North-Holland.
Bertrand, M. and F. Kramarz (2002). "Does Entry Regulation Hinder Job Creation? Evidence
from the French Retail Industry." Discussion Paper No. 415, IZA, Bonn.
Blanchard, O. J. and J. Wolfers (2000). "The Role of Shocks and Institutions in the Rise of
European Unemployment: the Aggregate Evidence." Economic Journal 110, C1-C33.
Blanchard, O. J. and L. H. Summers (1986). "Hysteresis and the European Unemployment
Problem." In NBER Macroeconomics Annual, edited by S. Fischer. Cambridge, MA:
MIT Press.
Blundell, R., M. Costa Dias, C. Meghir and J. Van Reenen (2002). "Evaluating the
Employment Impact of a Mandatory Job Search Assistance Program." Working Paper
No. 01/20, Institute for Fiscal Studies.
Booth, A. (1995). The Economics of the Trade Union. Cambridge: Cambridge University
Press.
Bruno, M. and J. D. Sachs (1985). Economics of Worldwide Stagflation. Cambridge,
Massachusetts: Harvard University Press.

20
Checchi, D. and C. Lucifora (2002). "Unions and Labour Market Institutions in Europe."
Economic Policy, 363-408.
Fonseca, R., P. Lopez-Garcia and C. A. Pissarides (2001). "Entrepreneurship, Start-up Costs
and Employment." European Economic Review 45, 692-705.
Franks, S. (1999) Having None of It, London: Granta Books
Jackman, R., C. A. Pissarides and S. Savouri (1990). "Labour Market Policies and
Unemployment in the OECD." Economic Policy 11, 449-490.
Johnson, D. R. (2002). "The Effect of Inflation Targeting on the Behavior of Expected
Inflation: Evidence from an 11 Country Panel." Journal of Monetary Economics 49,
1521-1538.
Layard, R. and S. Nickell (1999). "Labor Market Institutions and Economic Performance." In
Handbook of Labor Economics, edited by O. Ashenfelter and D. Card. Amsterdam:
North-Holland.
Layard, R., S. Nickell and R. Jackman (1991). Unemployment: Macroeconomic Performance
of the Labour Market. Oxford: Oxford University Press.
Lopez-Garcia, P. (2003). "Labour Market Performance and Start-Up Costs: OECD Evidence."
Working Paper No. 849, CESifo, Munich.
Nelson, E. and K. Nikolov (2002). "Monetary Policy and Stagflation in the UK." Working
Paper No. 155, Bank of England.
Nickell, S. (1997). "Unemployment and Labor Market Rigidities: Europe versus North
America." Journal of Economic Perspectives, 55-74.
Nickell, S. J., L. Nunziata, W. Ochel and G. Quintini (2001). "The Beveridge Curve,
Unemployment and Wages in the OECD from the 1960s to the 1990s." Discussion
Paper no. 502, Centre for Economic Performance.
Nicoletti, G., R. C. G. Haffner, S. Nickell, S. Scarpetta and G. Zoega (2001). "European
Integration, Liberalization, and Labor-Market Performance." In Welfare and
Employment in a United Europe, edited by G. Bertola, T. Boeri and G. Nicoletti.
Cambridge, Mass and London: MIT Press.
Nicoletti, G., S. Scarpetta and O. Boylaud (2000). “Summary Indicators of Product Market
Regulation with an Extension to Employment Protection Legislation,” Working Paper
No. 226, OECD Economics Department.
OECD (1993). "Active Labour Market Policies: Assessing Macroeconomic and
Microeconomic Effects." In Employment Outlook. Paris: OECD.

21
OECD (1999). "Employment Protection and Labour Market Performance." In Employment
Outlook, Paris: OECD.
Phelps, E. S. (1994). Structural Slumps. Cambridge, MA: Harvard University Press.
Pissarides, C. A. (1986). "Unemployment and Vacancies in Britain." Economic Policy 3, 499-
559.
Pissarides, C. A. (1992). "Loss of Skill during Unemployment and the Persistence of
Employment Shocks." Quarterly Journal of Economics 107, 1371-1391.
Pissarides, C. A. (1999). "Policy Influences on Unemployment: The European Experience."
Scottish Journal of Political Economy 46, 389-418.
Pissarides, C. A. (2001). "Employment Protection." Labour Economics 8, 131-159.
Pissarides, C. A. (2003). "Company Start-Up Costs and Employment." In Knowledge,
Information, and Expectations in Modern Macroeconomics: In Honor of Edmund S.
Phelps, edited by P. Aghion, R. Friedman, J. Stiglitz and M. Woodford. Princeton, NJ:
Princeton University Press.
Pissarides, C. A., P. Garibaldi, C. Olivetti, B. Petrongolo and E. Wasmer (2003). "Women in
the Labour Force: How Well is Europe Doing?" In European Women at Work, edited
by T. Boeri, D. Del Boca and C. A. Pissarides. forthcoming: de Benedetti Foundation.
Scarpetta, S. (1996). "Assessing the Role of Labour Market Policies and Institutional Settings
on Unemployment: A Cross-Country Study." OECD Economic Studies no. 26.
Data sources
The main sources are the UK Office of National Statistics (available on line at
http://www.statistics.gov.uk/ ) and the OECD. Statistics are generally comparable in the two
sources. The institutional variables (tax wedge, replacement ratio for short and long-term
unemployed and union density) are not available at either side and were obtained from
Nickell et al (2001).

Figure 1Actual and Smoothed Unemployment Rates
7071 72
73 74
75
76 77 78 79
80
81
8283 84
85 86
87
88
89 90
91
92 93
949596
9798 99
0001 02
0.0%
2.0%
4.0%
6.0%
8.0%
10.0%
12.0%
14.0%
70 72 74 76 78 80 82 84 86 88 90 92 94 96 98 00 02

Figure 2Participation and Employment Rates(per cent of working age population)
01009998
9796959493
92
91
9089
88
878685
8483
82
81
8079787776
757473
727170696867
666564
6362616059
60.0%62.0%64.0%66.0%68.0%70.0%72.0%74.0%76.0%78.0%80.0%82.0%
1959196119631965196719691971197319751977197919811983198519871989199119931995199719992001
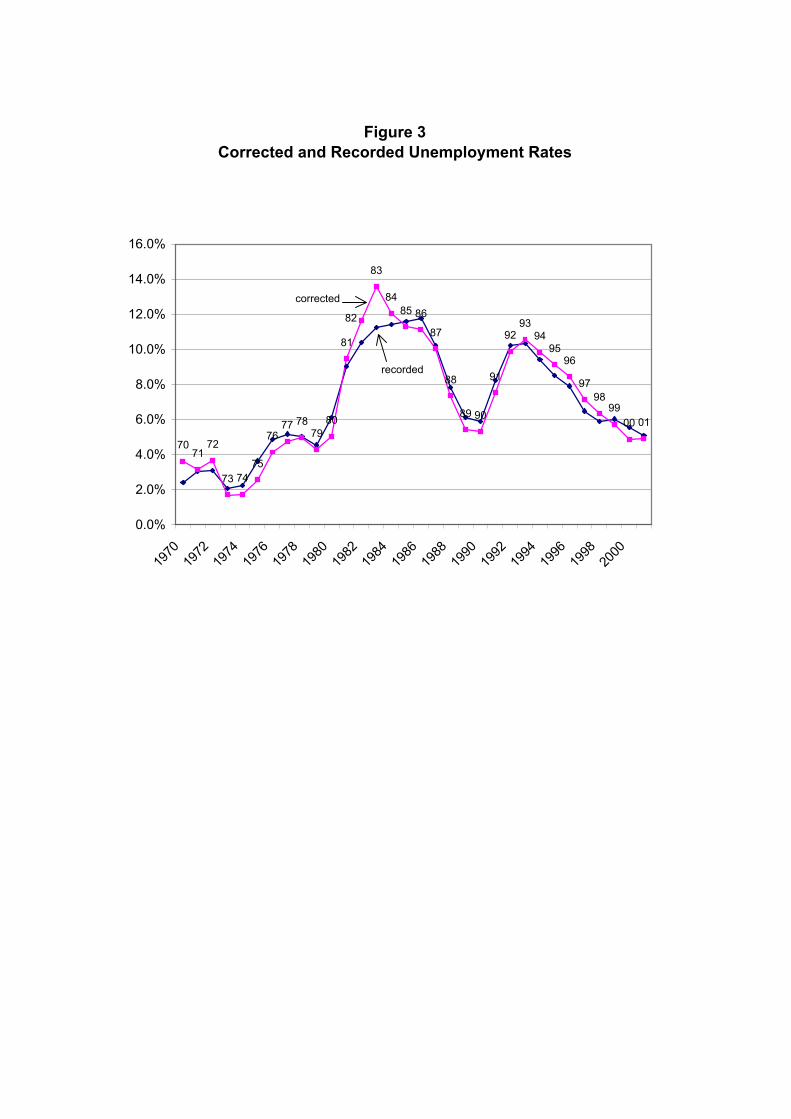
Figure 3Corrected and Recorded Unemployment Rates
010099
9897
9695
9493
92
91
9089
88
87
868584
83
82
81
8079
787776
757473
7271
70
0.0%
2.0%
4.0%
6.0%
8.0%
10.0%
12.0%
14.0%
16.0%
1970197219741976197819801982198419861988199019921994199619982000
corrected
recorded

Figure 4The Duration of Unemployment
(percentage distribution, claimant count, monthly)
0%
10%
20%
30%
40%
50%
60%
70%
80%
Feb-
94
Jun-
94
Oct
-94
Feb-
95
Jun-
95
Oct
-95
Feb-
96
Jun-
96
Oct
-96
Feb-
97
Jun-
97
Oct
-97
Feb-
98
Jun-
98
Oct
-98
Feb-
99
Jun-
99
Oct
-99
Feb-
00
Jun-
00
Oct
-00
Feb-
01
Jun-
01
Oct
-01
Feb-
02
Jun-
02
26 weeks and under
over 26 and under 52 weeks
over 52 weeks

Figure 5Part-time and Temporary Jobs: Men
(as a percentage of employment)
0.0%
1.0%
2.0%
3.0%
4.0%
5.0%
6.0%
7.0%
8.0%
9.0%
10.0%
1983
1984
1985
1986
1987
1988
1989
1990
1991
1992
1993
1994
1995
1996
1997
1998
1999
2000
2001
part-time jobs
temporary jobs

Figure 6Part-time and Temporary Jobs: Women
(as a percentage of employment)
0.0%
5.0%
10.0%
15.0%
20.0%
25.0%
30.0%
35.0%
40.0%
45.0%
50.0%
1983
1984
1985
1986
1987
1988
1989
1990
1991
1992
1993
1994
1995
1996
1997
1998
1999
2000
2001
part-time jobs
temporary

Figure 7The UK Beveridge Curve
00
99
9897 96
95
94
93
9291
90
89
88 87
86
8584
83
82
81
80
79
78
77
76
75
7473
72
71
70
0.5%
0.6%
0.7%
0.8%
0.9%
1.0%
1.1%
0.0% 2.0% 4.0% 6.0% 8.0% 10.0% 12.0% 14.0%
unemployment
vaca
ncie
s

Figure 8The UK Phillips Curve
01 00 99
9897 96 95
949392
9190 89
88 87
86
8584
83
82
81
80
79
78
7776
75
74
73 7271
70
696867
6665
0%
5%
10%
15%
20%
25%
30%
0.0% 2.0% 4.0% 6.0% 8.0% 10.0% 12.0% 14.0%
Unemployment
Pric
e In
flatio
n

Figure 9The Tax Wedge
0.00
0.10
0.20
0.30
0.40
0.50
0.60
1960
1962
1964
1966
1968
1970
1972
1974
1976
1978
1980
1982
1984
1986
1988
1990
1992
1994

Figure 10Replacement Ratio for Short-Term and Long-Term Unemployed
0
0.05
0.1
0.15
0.2
0.25
0.3
0.35
0.4
70 71 72 73 74 75 76 77 78 79 80 81 82 83 84 85 86 87 88 89 90 91 92 93 94 95
short-term
long-term

Figure 11Union Density
0%
10%
20%
30%
40%
50%
60%
1970
1971
1972
1973
1974
1975
1976
1977
1978
1979
1980
1981
1982
1983
1984
1985
1986
1987
1988
1989
1990
1991
1992
1993
1994
1995

Figure 12Growth Accounting: Difference between the Contribution of TFP and
Capital and the Contribution of Labour
101
100
99
98
97
96
95
9493
92
91
90
89
88
87
86
85
84
83
82
81
80
79
78
77
76
75
74
737271
70
69
68
67
6665
64
63
62
61
60
-0.03
-0.02
-0.01
0
0.01
0.02
0.03
0.04
0.05
0.06
60 62 64 66 68 70 72 74 76 78 80 82 84 86 88 90 92 94 96 98 100

CENTRE FOR ECONOMIC PERFORMANCE Recent Discussion Papers
599 Stephen Bond
Dietmar Harhoff John Van Reenen
Corporate R&D and Productivity in Germany and the United Kingdom
598 Michael Storper Anthony J. Venables
Buzz: Face-to-Face Contact and the Urban Economy
597 Stephen Gibbons Alan Manning
The Incidence of UK Housing Benefit: Evidence from the 1990s Reforms
596 Paul Gregg Maria Gutiérrez-Domènech Jane Waldfogel
The Employment of Married Mothers in Great Britain: 1974-2000
595 Stephen Bond Dietmar Harhoff John Van Reenen
Investment, R&D and Financial Constraints in Britain and Germany
594 Andrew B. Bernard Stephen Redding Peter K. Schott
Product Choice and Product Switching
593 Anthony J. Venables Spatial Disparities in Developing Countries: Cities, Regions and International Trade
592 Sylvie Charlot Gilles Duranton
Communication Externalities in Cities
591 Paul Willman Alex Bryson Rafael Gomez
Why Do Voice Regimes Differ?
590 Marco Manacorda Child Labor and the Labor Supply of Other Household Members: Evidence from 1920 America
589 Alex Bryson Rafael Gomez
Why Have Workers Stopped Joining Unions?
588 Henry G. Overman L. Alan Winters
Trade Shocks and Industrial Location: the Impact of EEC Accession on the UK
587 Pierre-Philippe Combes Henry G. Overman
The Spatial Distribution of Economic Activities in the European Union
586 Henry G. Overman Can We Learn Anything from Economic Geography Proper?
585 A. B. Bernard J. Bradford Jensen P. K. Schott
Falling Trade Costs, Heterogeneous Firms and Industry Dynamics
584 A. B. Bernard J. Bradford Jensen P. K. Schott
Survival of the Best Fit: Exposure to Low-Wage Countries and the (Uneven) Growth of U.S. Manufacturing Plants
583 S. Wood S. Moore
Reviewing the Statutory Union Recognition (ERA 1999)
582 T. Kirchmaier Corporate Restructuring and Firm Performance of British and German Non-Financial Firms
581 C. Dougherty Why Is the Rate of Return to Schooling Higher for Women than for Men?
580 S. Burgess D. Mawson
Aggregate Growth and the Efficiency of Labour Reallocation
579 S. Nickell Poverty and Worklessness in Britain
578 D. Marsden Renegotiating Performance: the Role of Performance Pay in Renegotiating the Effort Barga in
577 S. Nickell A Picture of European Unemployment: Success and Failure
576 A. de Coulon M. Piracha
Self-Selection and the Performance of Return Migrants: the Source Country Perspective
575 H. Steedman K. Wagner J. Foreman
The Impact on Firms of ICT Skill-Supply Strategies: An Anglo-German Comparison
To order a discussion paper, please contact the Publications Unit
Tel 020 7955 7673 Fax 020 7955 7595 Email [email protected] Web site http://cep.lse.ac.uk