ch13 economic challenges. unemployment frictional unemployment – looking for new work seasonal...
TRANSCRIPT
Ch13 Economic Challenges
Unemployment
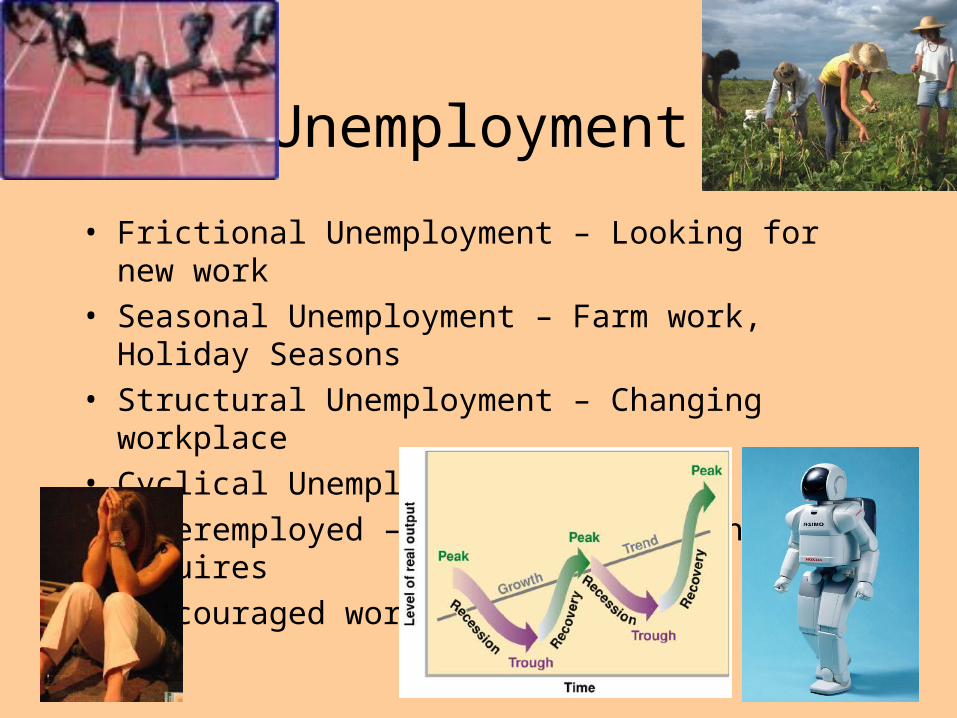
• Frictional Unemployment – Looking for new work
• Seasonal Unemployment – Farm work, Holiday Seasons
• Structural Unemployment – Changing workplace
• Cyclical Unemployment – Business Cycles
• Underemployed – More qualified than job requires
• Discouraged workers
Inflation
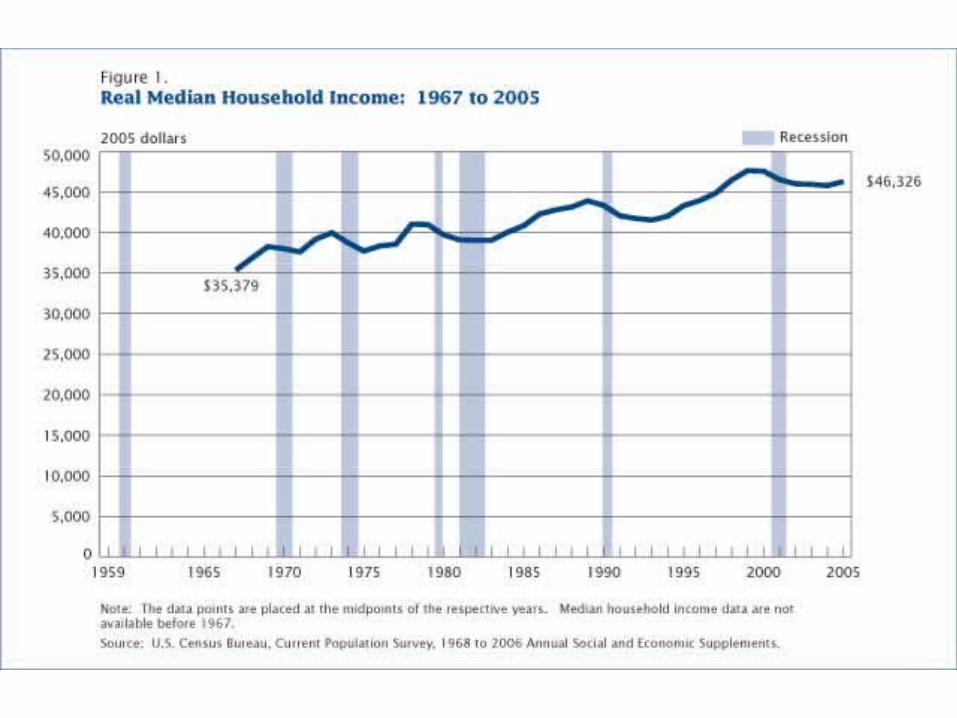
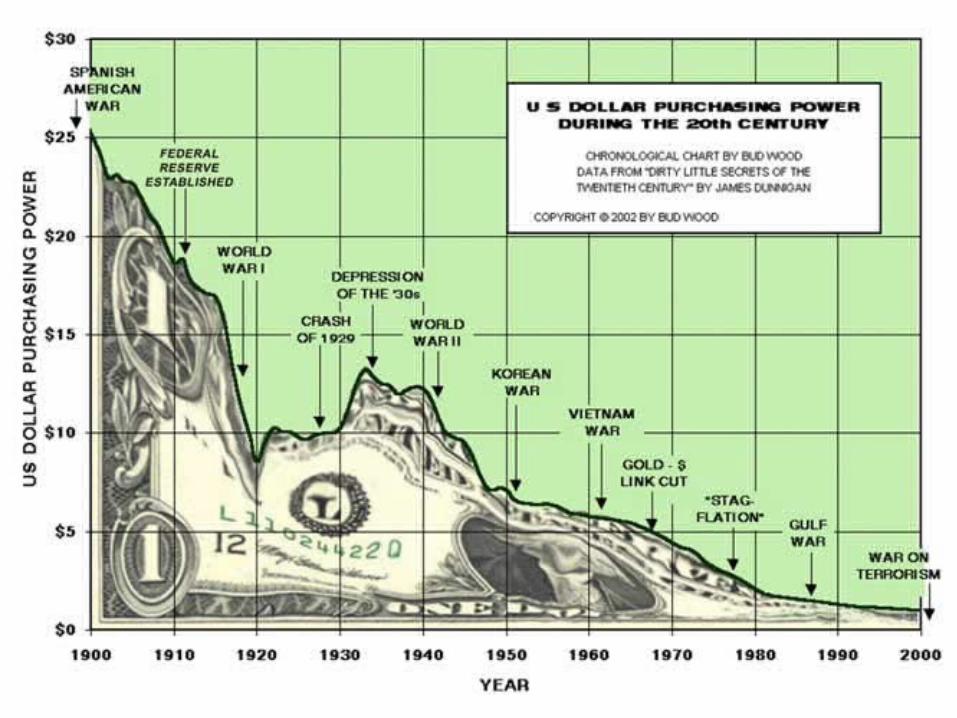
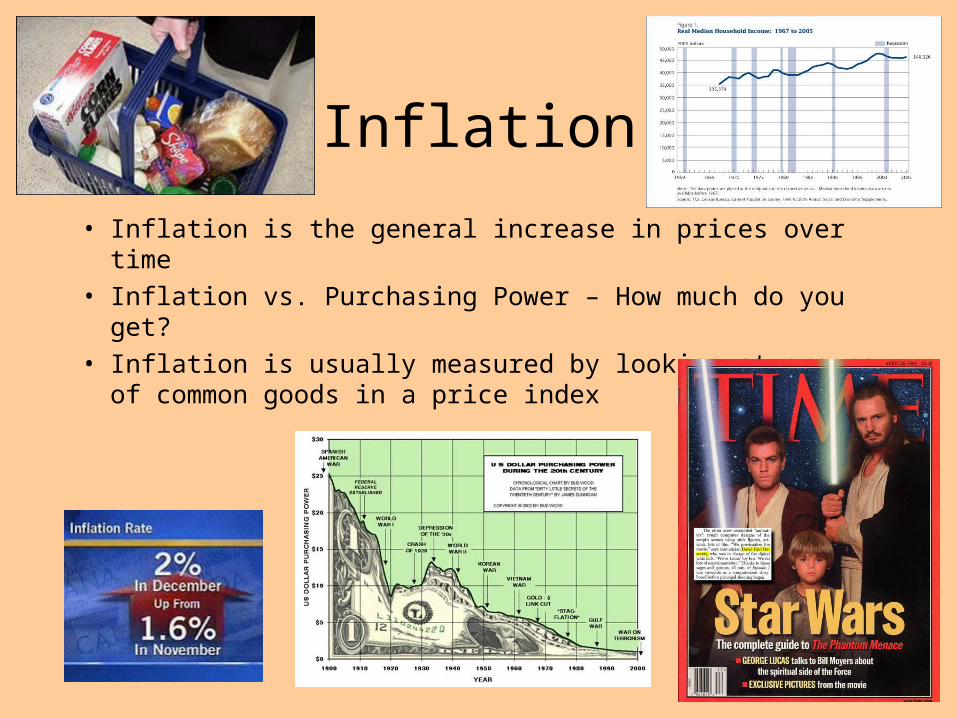
• Inflation is the general increase in prices over time
• Inflation vs. Purchasing Power – How much do you get?
• Inflation is usually measured by looking at groups of common goods in a price index

Causes of Inflation
• Quantity Theory – Too much money in the supply
• Demand-Pull Theory – Demand for goods exceeds supply
• Cost-Push Theory – Costs for making goods increases
Wage–Price Spiral – The wage price spiral is where wages increase, causing increased demand, causing prices to go up, leading to a need for higher wages, etc.
Short-Run Trade-Off between Inflation and Unemployment
• Unemployment and Inflation– Society faces a short-run tradeoff between unemployment
and inflation.
– If policymakers expand aggregate demand, they can lower unemployment, but only at the cost of higher inflation.
– If they contract aggregate demand, they can lower inflation, but at the cost of temporarily higher unemployment.
– The Phillips Curve shows the short-run trade off between inflation and unemployment.
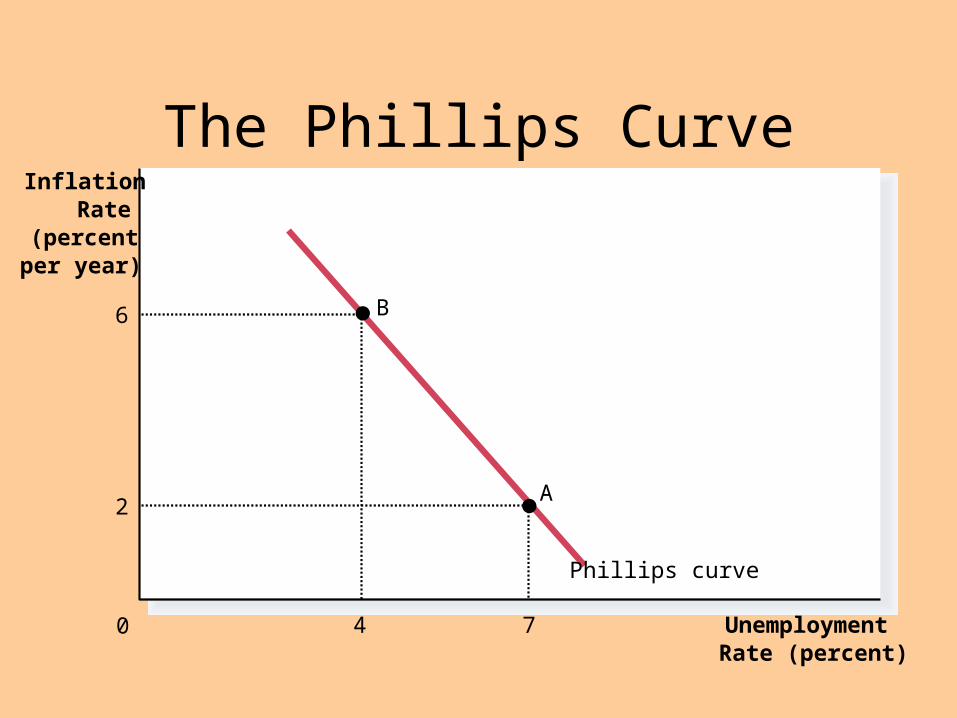
The Phillips Curve
UnemploymentRate (percent)
0
InflationRate
(percentper year)
Phillips curve
4
B6
7
A2
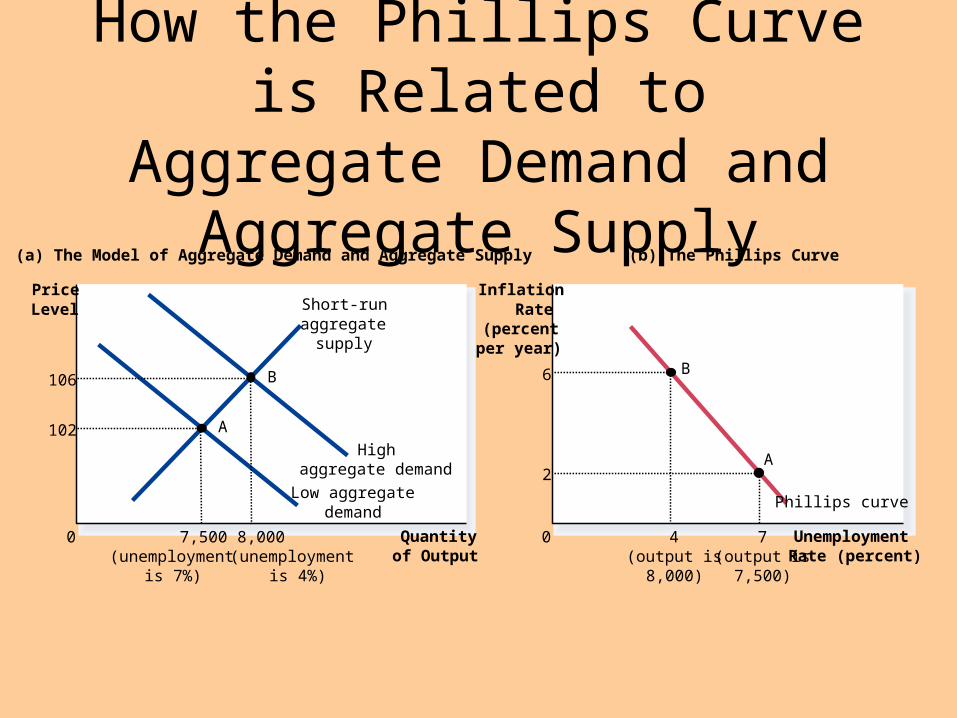
How the Phillips Curve is Related to Aggregate Demand
and Aggregate Supply
Quantityof Output
0
Short-runaggregate
supply
(a) The Model of Aggregate Demand and Aggregate Supply
UnemploymentRate (percent)
0
InflationRate
(percentper year)
PriceLevel
(b) The Phillips Curve
Phillips curveLow aggregate
demand
Highaggregate demand
(output is8,000)
B
4
6
(output is7,500)
A
7
2
8,000(unemployment
is 4%)
106 B
(unemploymentis 7%)
7,500
102 A
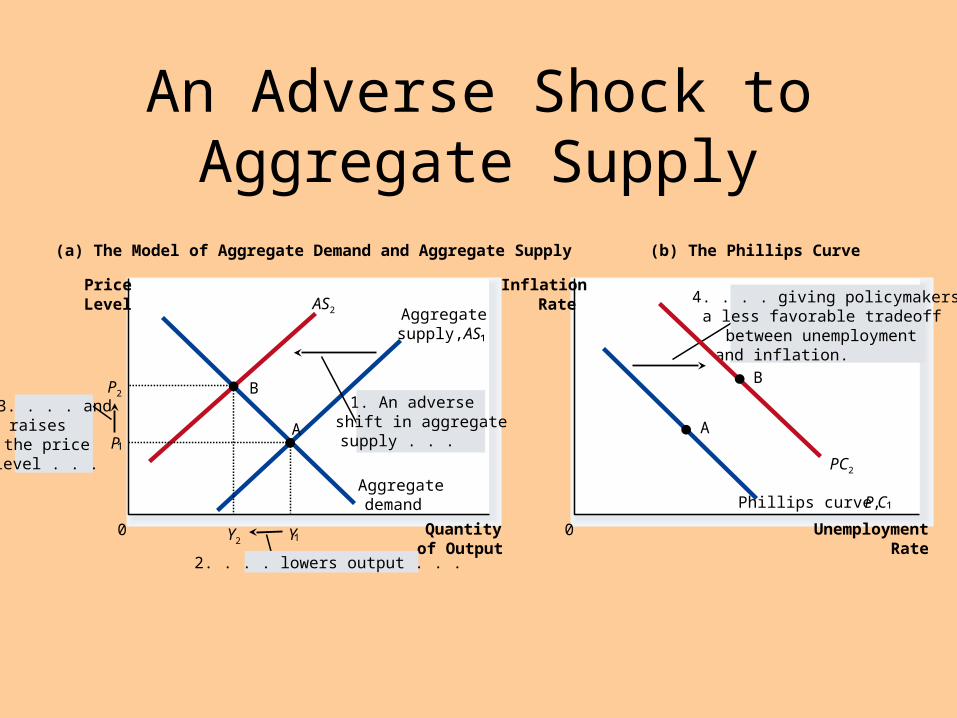
An Adverse Shock to Aggregate Supply
Quantityof Output
0
PriceLevel
Aggregatedemand
(a) The Model of Aggregate Demand and Aggregate Supply
UnemploymentRate
0
InflationRate
(b) The Phillips Curve
3. . . . andraises the price level . . .
AS2 Aggregatesupply, AS
A
1. An adverseshift in aggregate supply . . .
4. . . . giving policymakers a less favorable tradeoffbetween unemploymentand inflation.
BP2
Y2
PA
Y
Phillips curve, PC
2. . . . lowers output . . .
PC2
B

Disinflationary Monetary Policy in the Short Run and the Long
Run
UnemploymentRate
0 Natural rate ofunemployment
InflationRate
Long-runPhillips curve
Short-run Phillips curvewith high expected
inflation
Short-run Phillips curvewith low expected
inflation
1. Contractionary policy movesthe economy down along the short-run Phillips curve . . .
2. . . . but in the long run, expectedinflation falls, and the short-run Phillips curve shifts to the left.
BC
A
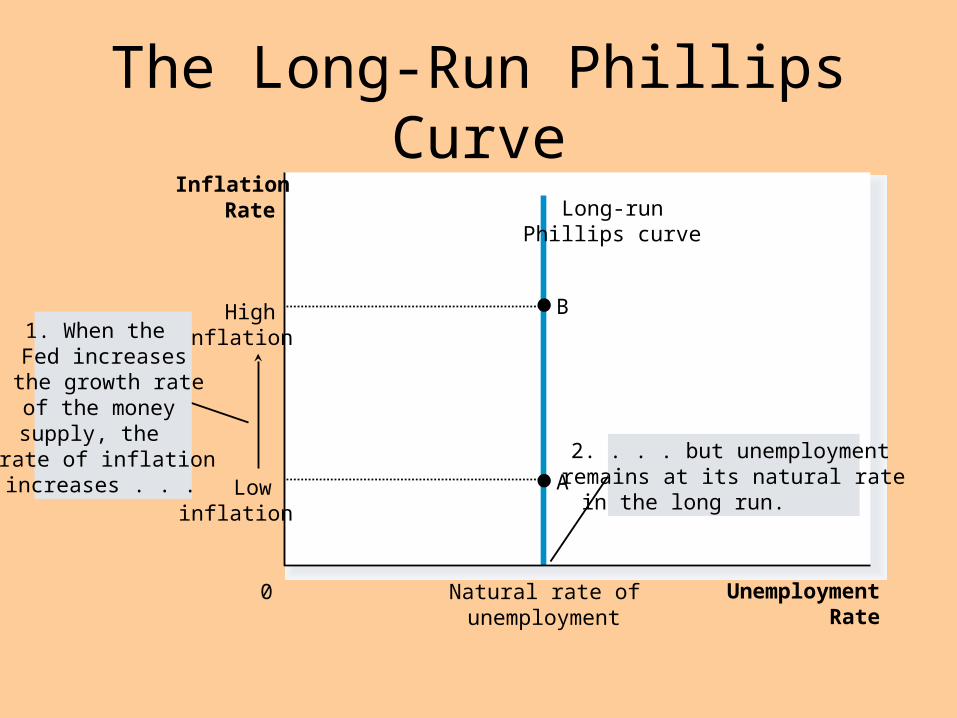
The Long-Run Phillips Curve
UnemploymentRate
0 Natural rate ofunemployment
InflationRate Long-run
Phillips curve
BHighinflation
Lowinflation
A
2. . . . but unemploymentremains at its natural ratein the long run.
1. When the Fed increases the growth rate of the money supply, the rate of inflation increases . . .
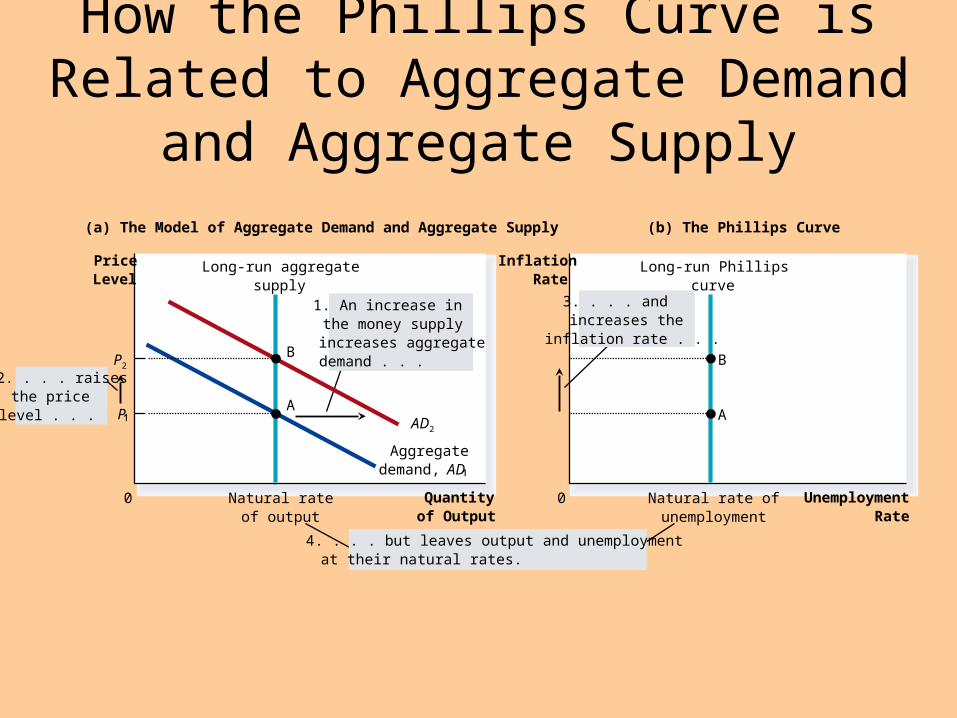
How the Phillips Curve is Related to Aggregate Demand and Aggregate Supply
Quantityof Output
Natural rateof output
Natural rate ofunemployment
0
PriceLevel
P
Aggregatedemand, AD
Long-run aggregatesupply
Long-run Phillipscurve
(a) The Model of Aggregate Demand and Aggregate Supply
UnemploymentRate
0
InflationRate
(b) The Phillips Curve
2. . . . raisesthe pricelevel . . .
1. An increase in the money supplyincreases aggregatedemand . . .
AAD2
B
A
4. . . . but leaves output and unemploymentat their natural rates.
3. . . . andincreases theinflation rate . . .
P2B
SHIFTS IN THE PHILLIPS CURVE: THE ROLE OF SUPPLY SHOCKS
• Historical events have shown that the short-run Phillips curve can shift due to changes in expectations.
• The short-run Phillips curve also shifts because of shocks to aggregate supply. – Major adverse changes in aggregate supply can worsen the
short-run trade-off between unemployment and inflation.
– An adverse supply shock gives policymakers a less favorable trade-off between inflation and unemployment.
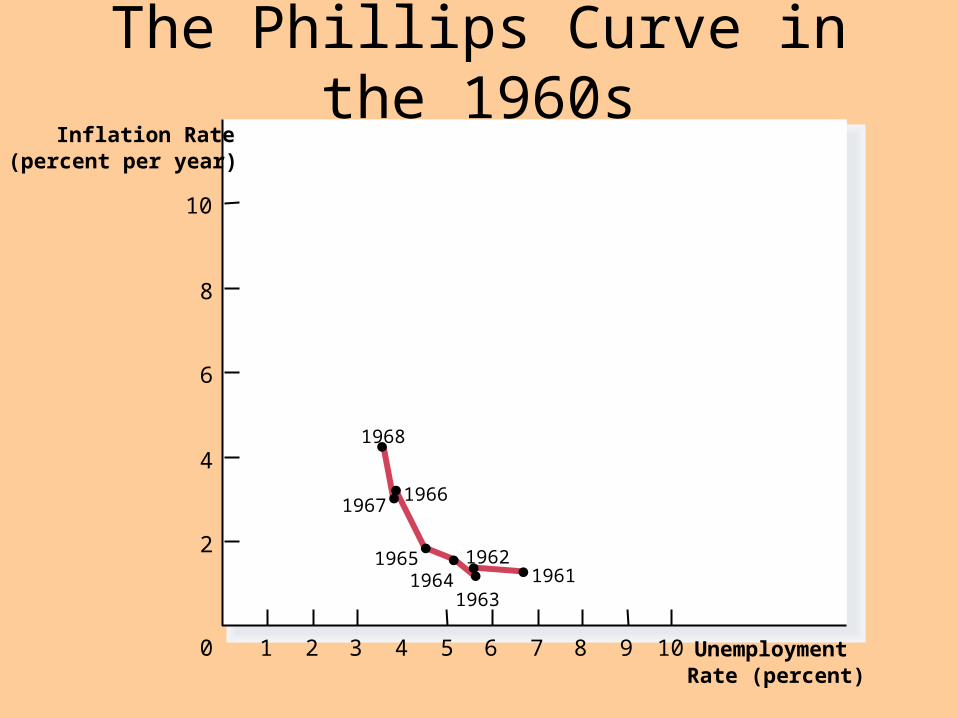
The Phillips Curve in the 1960s
1 2 3 4 5 6 7 8 9 100
2
4
6
8
10
UnemploymentRate (percent)
Inflation Rate(percent per year)
1968
1966
19611962
1963
1967
19651964
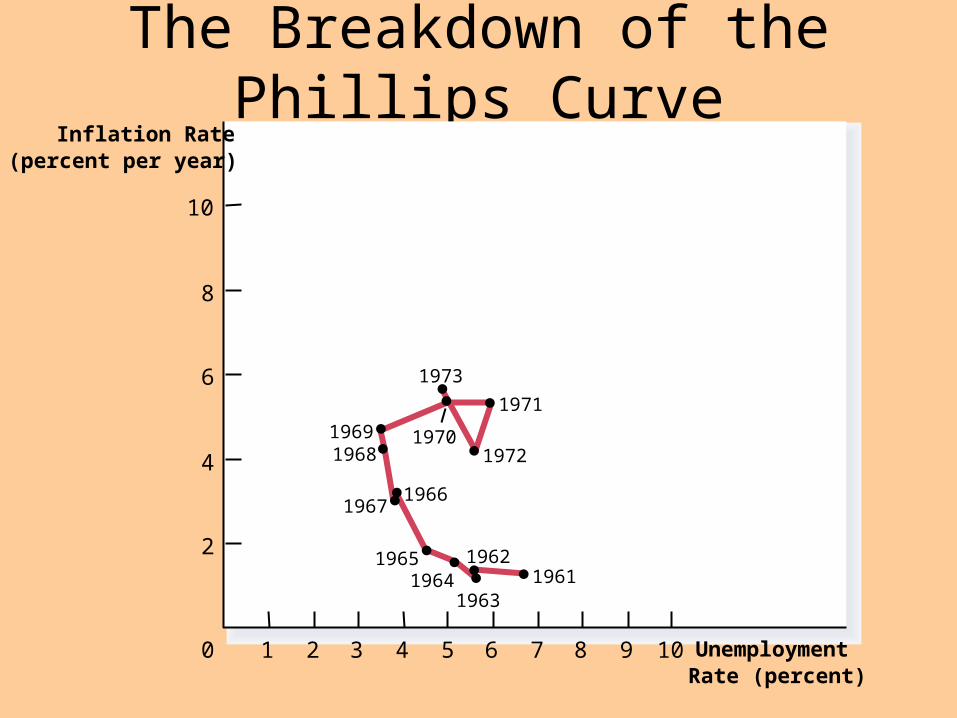
The Breakdown of the Phillips Curve
1 2 3 4 5 6 7 8 9 100
2
4
6
8
10
UnemploymentRate (percent)
Inflation Rate(percent per year)
1973
1966
1972
1971
19611962
1963
1967
19681969 1970
19651964
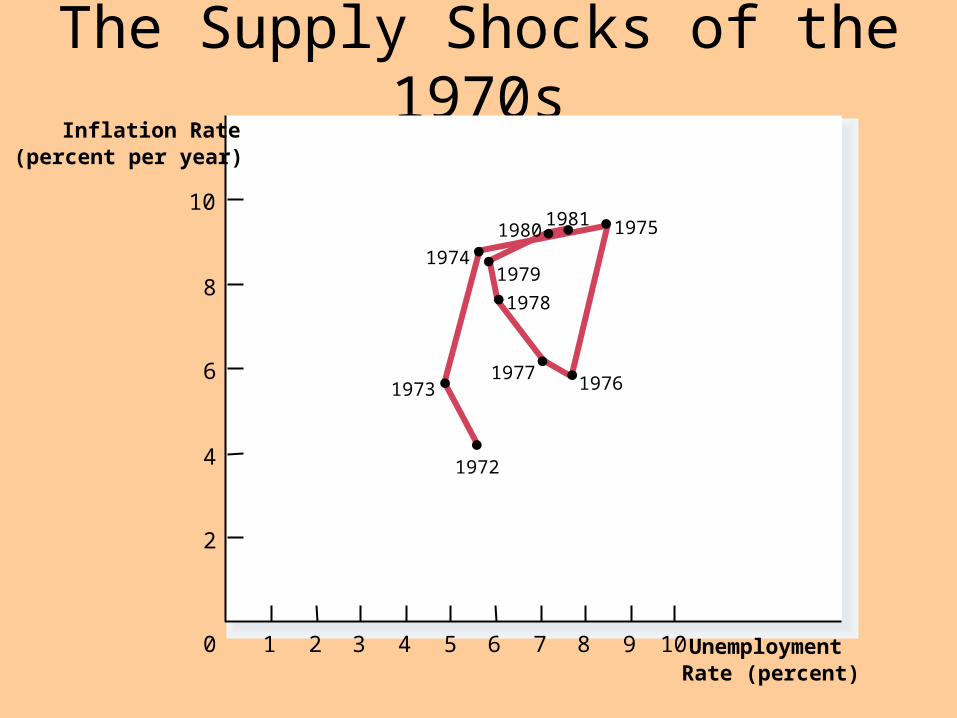
The Supply Shocks of the 1970s
1 2 3 4 5 6 7 8 9 100
2
4
6
8
10
UnemploymentRate (percent)
Inflation Rate(percent per year)
1972
19751981
1976
1978
1979
1980
1973
1974
1977
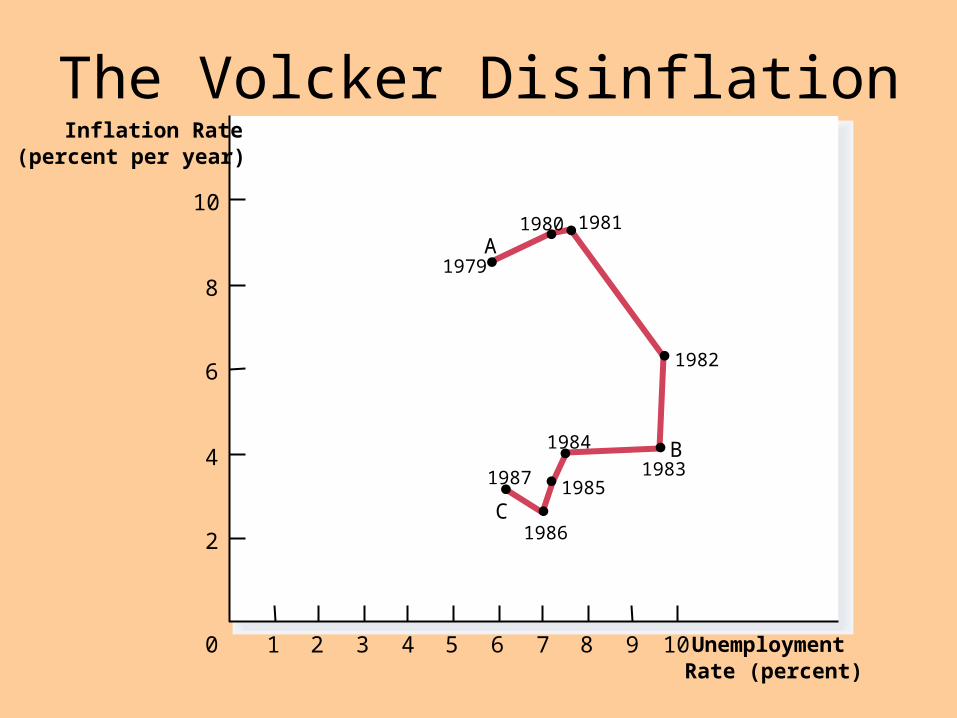
The Volcker Disinflation
1 2 3 4 5 6 7 8 9 100
2
4
6
8
10
UnemploymentRate (percent)
Inflation Rate(percent per year)
1980 1981
1982
1984
1986
1985
1979A
1983B
1987
C
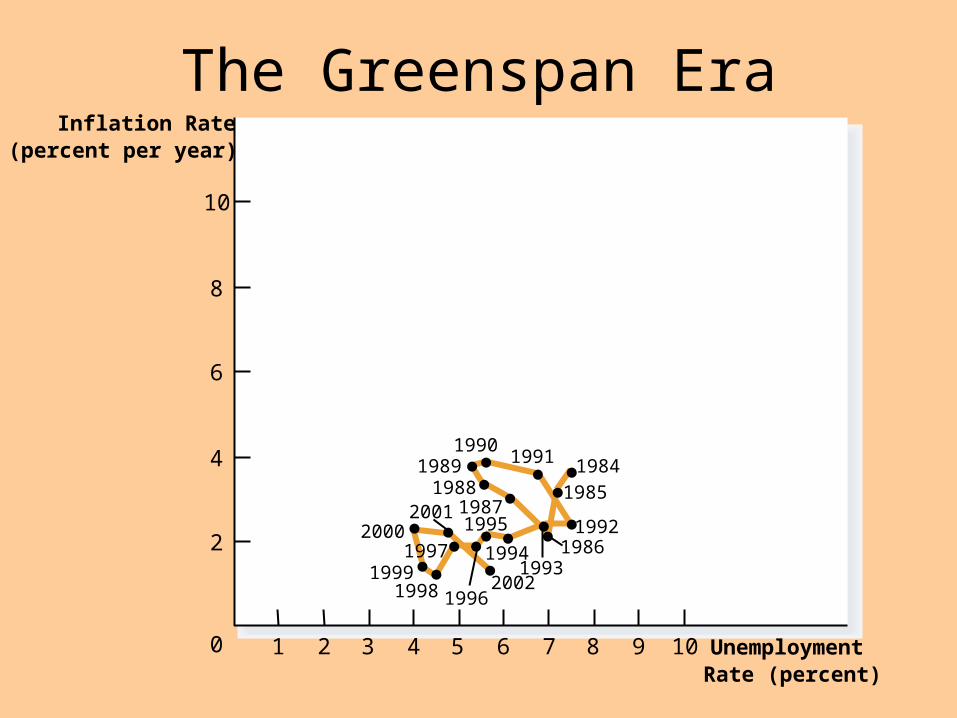
The Greenspan Era
1 2 3 4 5 6 7 8 9 100
2
4
6
8
10
UnemploymentRate (percent)
Inflation Rate(percent per year)
19841991
1985
19921986
19931994
198819871995
199620021998
1999
20002001
19891990
1997
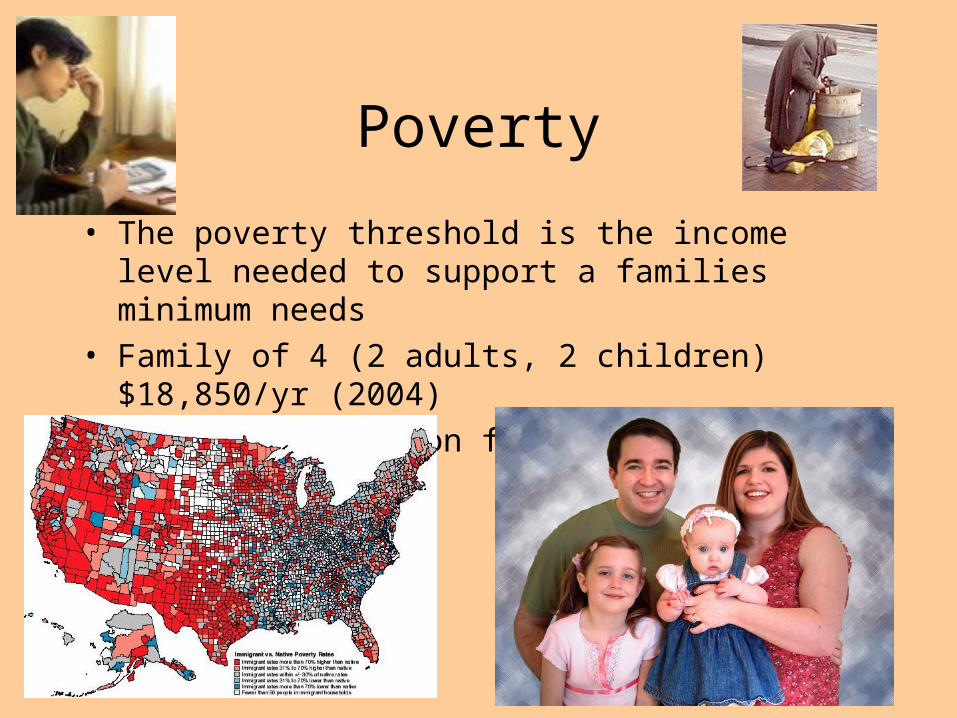
Poverty
• The poverty threshold is the income level needed to support a families minimum needs
• Family of 4 (2 adults, 2 children) $18,850/yr (2004)
• Poverty depends on family size and location
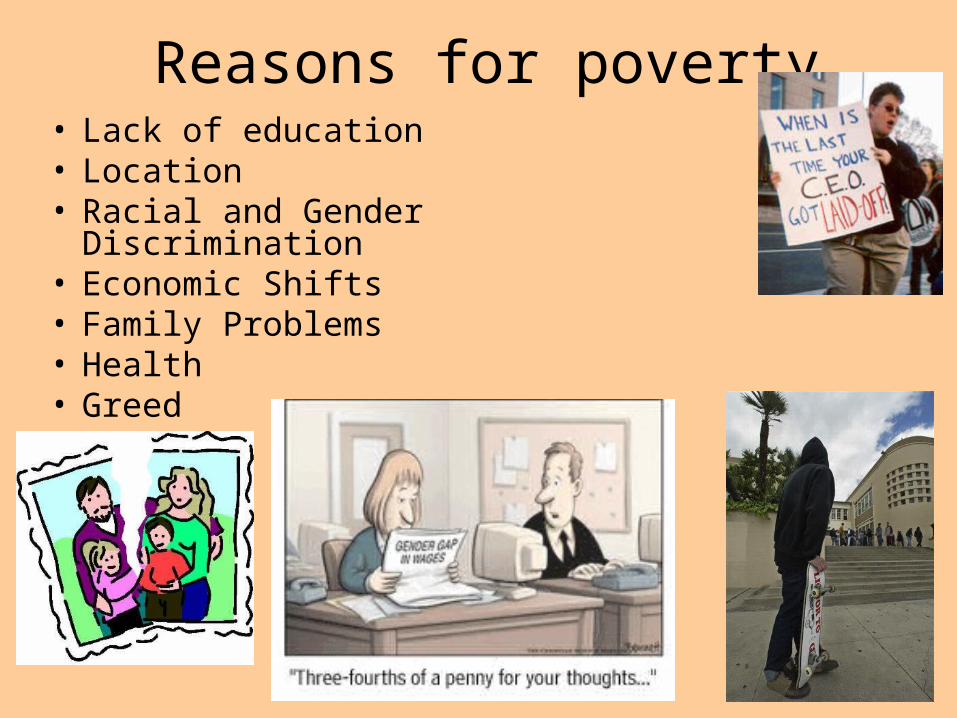
Reasons for poverty• Lack of education• Location• Racial and Gender Discrimination• Economic Shifts• Family Problems• Health• Greed
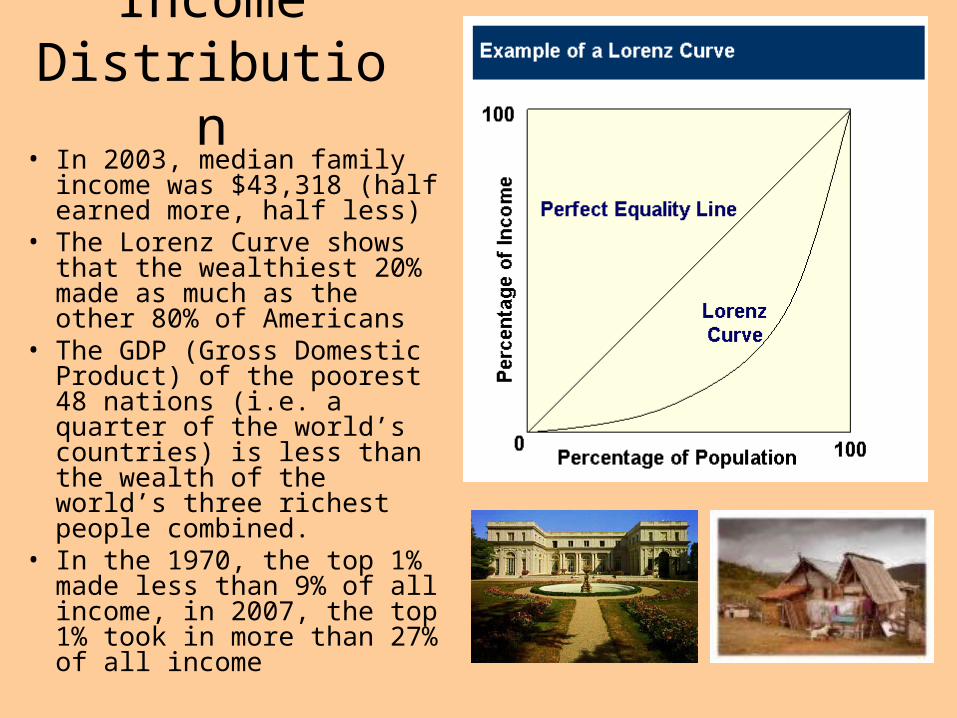
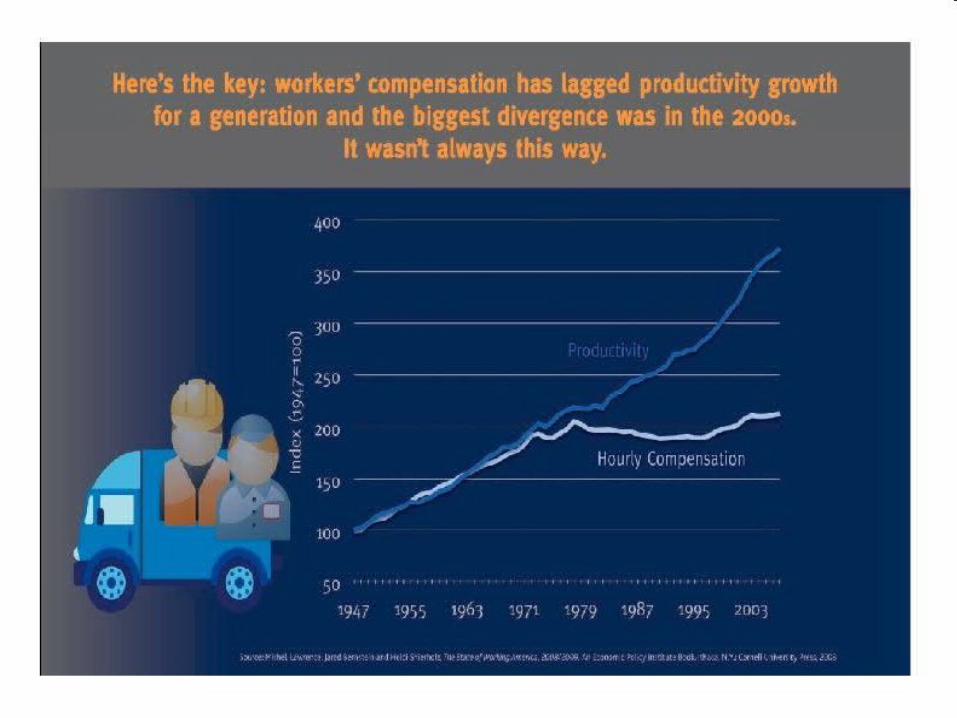
Income Distribution
• In 2003, median family income was $43,318 (half earned more, half less)
• The Lorenz Curve shows that the wealthiest 20% made as much as the other 80% of Americans
• The GDP (Gross Domestic Product) of the poorest 48 nations (i.e. a quarter of the world’s countries) is less than the wealth of the world’s three richest people combined.
• In the 1970, the top 1% made less than 9% of all income, in 2007, the top 1% took in more than 27% of all income
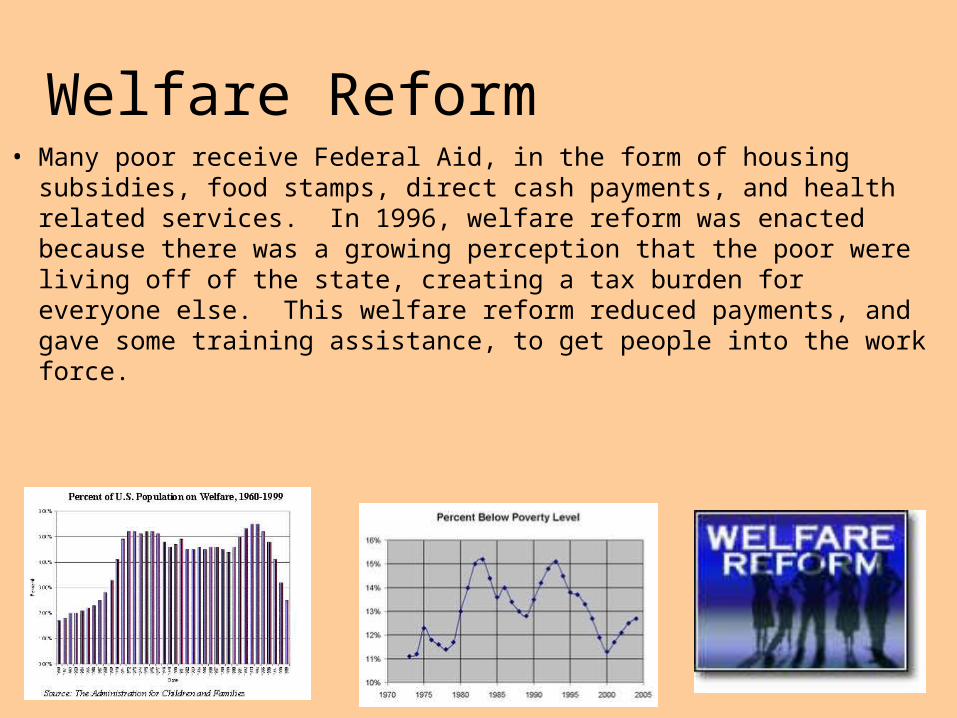
Welfare Reform• Many poor receive Federal Aid, in the form of housing subsidies,
food stamps, direct cash payments, and health related services. In 1996, welfare reform was enacted because there was a growing perception that the poor were living off of the state, creating a tax burden for everyone else. This welfare reform reduced payments, and gave some training assistance, to get people into the work force.
End