understanding the utilization of information … · by designers in decision making. in this paper,...
TRANSCRIPT

Proceedings of the ASME 2015 International Design Engineering Technical ConferencesComputers and Information in Engineering Conference (IDETC/CIE 2015)
August 2-5, 2015, Boston, Massachusetts, USA
DETC2015-46495
UNDERSTANDING THE UTILIZATION OF INFORMATION STIMULI IN DESIGNDECISION MAKING USING EYE GAZE DATA
Youyi Bi Murtuza Shergadwala Tahira Reid Jitesh H. PanchalSchool of Mechanical Engineering
Purdue UniversityWest Lafayette, Indiana 47907
ABSTRACTResearch on decision making in engineering design has
focused primarily on how to make decisions using normativemodels given certain information. However, there exists aresearch gap on how diverse information stimuli are combinedby designers in decision making. In this paper, we addressthe following question: how do designers weigh differentinformation stimuli to make decisions in engineering designcontexts? The answer to this question can provide insights ondiverse cognitive models for decision making used by differentindividuals. We investigate the information gathering behaviorof individuals using eye gaze data from a simulated engineeringdesign task. The task involves optimizing an unknown functionusing an interface which provides two types of informationstimuli, including a graph and a list area. These correspond tothe graphical stimulus and numerical stimulus, respectively. Thestudy was carried out using a set of student subjects. The resultssuggest that individuals weigh different forms of informationstimuli differently. It is observed that graphical informationstimulus assists the participants in optimizing the function with ahigher accuracy. This study contributes to our understanding ofhow diverse information stimuli are utilized by design engineersto make decisions. The improved understanding of cognitivedecision making models would also aid in improved design ofdecision support tools.
Keywords: Decision-making, eye tracking, informationstimuli, information gathering
1 INTRODUCTIONEngineering design is increasingly being analyzed from the
perspective of a decision making process [1, 2]. Understandingdecision making in engineering systems design can help design-ers make better decisions. This boosts the research on decisionmaking in engineering design focusing on various aspects, suchas preference mining, decision structuring and evaluation.
From the designer’s standpoint, information gathering andprocessing plays an important role in the process of decisionmaking. Various tools have been developed to aid designers in in-formation gathering, such as gathering information through var-ious types of surveys [3], utilizing context specific tools suchas the Delphi Method [4] and Bounded Information Gather-ing (BIG) [5]. Various comprehensive theories such as utilitytheory [6], game theory [7] and Discrete Choice Analysis [8] arealso widely utilized in design decision making.
Although various information gathering tools exist for de-signers’ aid, people perceive different kinds of information stim-uli in different ways [9]. This in turn affects the way they makedecisions. For example, some people prefer and perform beston decision tasks with verbal information, while others performbetter with concrete, descriptive and pictorial information [10].Thus to understand the way people weigh information stimuliwould shed light on which cognitive processes are used by dif-ferent people to make decisions in engineering design contexts.In this exploratory study, we addressed the following researchquestion: how do designers weigh different information stimulito make decisions in engineering design contexts?
To answer this question, we conducted an experiment inwhich participants were asked to complete a design task withvarious information sources on computer. We utilized a functionminimization game proposed by Sha et al. [11] as a simulated
1 Copyright c© 2015 by ASME

design task. This task involves optimizing an unknown functionusing a computer interface which provides two types of informa-tion stimuli, including a graph and a list area. These correspondto a graphical stimulus and numerical stimulus, respectively. Weinvestigated which kind of information stimuli was more oftenused by the players and how such weightage on different infor-mation stimulus affected players’ decisions.
Individuals’ information acquisition process can be moni-tored by many process tracing methods, such as computer-basedinformation board paradigms (e.g. Mouselab [12]) and think-aloud protocols [13]. However, these techniques sometimesinfluence decision behavior [14] and might hinder participantsfrom relying on automatic processing by constraining quick com-parisons and information search [15]. In contrast, eye-trackingtechnology allows for tracing information search without hinder-ing automatic processes and participants fixation durations canbe used to provide insights into cognitive processes [16]. In thecontext of our game where the eye-mind coordination is requiredto fulfill the task objectives, an eye-tracker was used to trace howplayers perceive different visual information from the user inter-face in the decision making process.
In the remainder of this paper, Section 2 provides back-ground on design decision-making, cognitive styles and eyetracking methods. The experimental methods and results are pre-sented in Sections 3 and 4, respectively. Section 5 provides con-clusions and future work.
2 RELATED LITERATUREIn this section, we review the existing literature on decision
making in design, the impact of individuals’ cognitive styles ondecision making and the application of eye-tracking in decisionmaking. We show the research gap between decision makingin design and understanding the cognitive styles of designers.Bridging this gap would help us understand how designers weighdifferent information stimuli to make decisions. We believe thateye-tracking is a promising tool to capture how individuals pro-cess visual information for decision making.
2.1 Decision Making in DesignExisting research on decision making in engineering sys-
tems design focuses on the type of the problem such as multi-attribute decision making [17], discrete choice analysis [18] etc.to elicit user preferences like preference based modeling [19],demand modeling [18], choice modeling [20]. However, thesestudies do not describe human information processing from ba-sic principles of cognition and have broadly stated descriptions oftheoretical assumptions. Behavioral experiments show that peo-ple tend to deviate from expected rational behavior [21] and peo-ple have bounded rationality [22]. These behavioral traits needto be incorporated within the decision making framework to un-derstand how the decisions are made. Therefore, an alternativebasis for mathematical modeling of decision making is needed.
Within the context of engineering design, designers need
various kinds of tools to analyze their decisions scientifically.Information gathering and information processing are impor-tant aspects while utilizing these tools. Tools such as BIG aid(Bounded Information Gathering) in this kind of informationgathering and information processing using various unstructuredand structured documents [5]. However these tools, modelsand frameworks do not incorporate how an individual designer’sinformation perception and feedback could affect the decisionmaking process. By using the principles of cognitive psychol-ogy through behavioral experiments such understanding of thedecision making process could be achieved within the context ofengineering design.
2.2 Cognitive Styles and Decision MakingDecision making consists of three interacting components,
namely, the decision maker, the task, and the decision contextor situation [23]. Researchers have noticed that decision mak-ers’ information processing styles or cognitive styles influencetheir decision making behavior [23]. According to Riding andCheema [10], cognitive style is described as a person’s typicalor habitual mode of problem solving, thinking, perceiving andremembering. These styles are viewed as relatively stable dis-positions which lead to differences in behavior in the decision-making process [24]. Henderson and Nutt found cognitive styleto be an important factor in decision making and the assessmentof risk [25].
Different researchers have used a variety of labels forthe cognitive styles they have investigated, such as fielddependence-independence [26], holist-serialist [27], diverging-converging [28] and verbalizer-visualizer [29]. Riding andCheema suggested that these labels may be grouped into twoprincipal cognitive styles (see Figure 1): (1) the holist-analyticstyle of whether an individual tends to process information inwholes or parts; and (2) the verbal-imagery style of whether anindividual is inclined to represent information during thinkingverbally or in images.
FIGURE 1. The two dimensions of cognitive style
2 Copyright c© 2015 by ASME
Researchers have found that imagers learn best from picto-rial presentation, while verbalizers learn best from text [30–32].For example, Riding and Douglas investigated the effect ofcognitive style and mode of presentation on learning perfor-mance [33]. In their study, secondary school students were pre-sented the learning material about the working of car brakingsystems in text-plus-picture condition or text-plus-text condition.They found that in the text-plus-picture condition imagers weresuperior to verbalizers, while the text-plus-text condition verbal-izers did better than imagers. It was also observed that imagersused more diagrams to illustrate their answers than verbalizers.Thus, players with different cognitive styles show behavioral dif-ferences in their decision making processes, including allocat-ing different weightage on different kinds of visual informationsources.
2.3 Research on Eye Tracking and Its Application inDecision Making
Eye-tracking research is based on Just and Carpenter’s eye-mind hypothesis [34] that people look at what they are thinkingabout. Accordingly, people fixate on a specific area of a problemdiagram longer when they encounter difficulties or are confused.Although there are studies showing inconsistent results, it iswidely agreed that during a complex information processing tasksuch as reading, eye movements and attention are linked [35].Recent advances in eye tracking, specifically the availability ofcheap, faster, more accurate and more user-friendly eye track-ers, enable researchers from areas besides psychology to applythis technology for the research on visual attention and thinkingprocess [36–40].
The main metrics used in eye-tracking include: (1) fixa-tions: eye movements that stabilize the retina over a stationaryobject of interest; (2) fixation time: a measure of the durationof the fixation; and (3) scan paths: connections between con-secutive fixations [41]. The location and duration of fixations isdirectly related to the locus and difficulty of cognitive process-ing [42]. Thus, eye movements may provide insight into whatvisual information is being processed currently and how difficultthis information is to process, which may serve as an additionalmeasure for learning, problem solving and decision making pro-cesses [43].
In problem-solving area, researchers found that high per-formers and low performers show different eye gaze patterns(fixations, fixation duration, saccade length, etc.) while solv-ing problems with visual elements [44]. For example, Madsenfound that while solving physics problems, correct solvers spentmore time attending to relevant areas, whereas incorrect solversspent more time looking at novice-like areas [45]. Consistent re-sults can also be found in Tsai et al.’s research on visual attentionfor solving multiple-choice science problem [46]. These resultssuggest that people’s problem-solving performances could be in-dicated by their eye gaze patterns to some extent.
Eye-tracking is increasingly used in decision making re-search. Kim et al. used an eye tracker to better understand
why participants with a variant of a tabular visualization called‘SimulSort’ outperformed ones with a conventional table andtypical one-column sorting feature [47]. Miller and Cassady dis-cussed how people of different ages and knowledge backgroundsmake choices when given relevant task information (decidingwhich of two nutrition facts panels, presented side-by-side, washealthier) using eye tracking [48]. In essence, studies on thetheme of patterns of decision making often took into considera-tion cognitive and developmental constraints. Thus in our study,we utilized eye-tracking to observe how players assigned theirvisual attention on different information stimulus when playingthe function optimization game on computer screen.
2.4 Research GapIn Section 2.1 we discussed that research on decision mak-
ing in engineering systems design has been mainly focused ontype of decision making or the rational decision methods givencertain information. However, there exists a research gap on howdiverse information stimuli are gathered by designers and howthey cognitively assess various information sources in decisionmaking. In Section 2.2 we showed that decisions can be con-sidered as a function of decision makers’ cognitive styles or in-formation processing styles, which are closely related to theirvisual attention patterns. Section 2.3 suggested eye tracking tobe a promising tool to understand individuals’ decision makingprocess involved with visual elements. Thus, in this behavioralstudy, we leveraged the insights provided by an eye tracking de-vice in understanding how designers weigh different informationstimuli to make decisions in engineering design contexts. Theseinsights helped us identify the cognitive decision rules used byplayers and can assist to further the understanding of the deci-sion making process. In the following section, the details of thedesign of experiment and the cognitive model are presented.
3 Design of Experiment and the Cognitive Model3.1 Description of the Game
We adapt the function minimization game presented by Shaet al. [11] to study the decision making process of the partici-pants. In [11], the game is used to study interactive decisionsmade by individuals in a multi-player setting. In this paper, thegame is played in a single-player mode. The user interface ofthis game is shown in Figure 2.
In this game, the participants were asked to sample x val-ues to find the minimum value of a randomly generated convexfunction. The participants were rewarded based on how closethey came to the actual minimum of the function. Their profit (indollars) was calculated as follows:
Profit = 5.5−|xbest − xopt | (1)
where the x value corresponding to the minimum of the functionis defined as xopt and the x value sampled by the user resulting inthe smallest distance to xopt is termed as xbest . The entire process
3 Copyright c© 2015 by ASME

FIGURE 2. The user interface of the function minimization game and three Areas of Interests (AOIs)
of searching for the minimum till the profit calculation is definedas a period. The participants were asked to play for a total of 10periods, and a different function f (x) was generated for each pe-riod. The players were paid for two randomly selected periods.Therefore, their maximum profit was limited to 5.5×2 = 11 dol-lars. We randomly picked 2 periods out of 10 to ensure that theparticipants play all the 10 periods indifferently.
In the experimental design, there are two important and re-curring decisions that a player makes to achieve his/her objec-tives. The player first decides the range in which he/she shouldfocus the search and then decides the value of x to be utilized.This process is called a ‘try’. The player is asked to sample 10times during each period. These decisions involve informationgathering from the interface. We therefore chose the mentionedexperimental design to study the impact of the information stim-uli on various decisions made and the different strategies fol-lowed by the participants.
We divided the game interface into three principal Areas ofInterests (AOIs), highlighted in Figure 2:
1. the function area where the user can input x values (AOI F),2. the graph area where the user can visualize the function
points searched (AOI G), and3. the area which gives a list of the function value and x values
searched (AOI L).
While a player is playing the game, the eye tracker is able
to record his/her eye gaze data within each AOI. The metricsmainly include the fixation time and fixation counts within eachAOI, and the percentage time spent on each AOI (fixation timewithin one AOI divided by the whole period time). Based onthe Eye-Mind assumption [34], these metrics correlate with play-ers’ visual attention within each AOI positively. In other words,higher fixation time, more fixation counts and larger percentagetime spent on one AOI indicate that a player paid more visualattention on this area.
3.2 The Cognitive ModelConsidering the function optimization game in our study,
players need to determine the best x values based on the providednumerical and graphical information regarding the x and f (x)values. Players with different cognitive styles (such as verbaliz-ers and imagers) would give different weightage to the numericaland graphical stimulus when playing this game [29]. Players’weightage of visual attention on different information sourcesis assumed to indicate their preferred approaches to the searchproblem. Specifically, if a player is gazing more on the graphthen the player is assumed to prefer a visual approach whereinhe/she is creating a mental model of the function to look for theminimum. If a player is focusing more on the list then he/she isassumed to prefer an analytical approach wherein he/she is tryingto utilize the exact values to improve the search range.
4 Copyright c© 2015 by ASME

Figure 3 presents the overall cognitive decision process ofthe players in this game. Players need to determine the next xvalue based on the previously entered x values (usually chosenrandomly for the initial two or three tries) and correspondingf (x) values. This information is gathered either from the nu-merical values shown in the list area or from the points displayedin the graph area, or both. Players’ differences in gathering in-formation lead to their using different approaches for decisionmaking [23]. We assume that the players either follow a curvefitting method or bisection method to make decisions about the xvalues.
FIGURE 3. The overall cognitive decision process of this game
Specifically, we assume that if a player is looking at thegraph, he/she is trying to visualize the curve to look for the min-imum. Similarly if a player is looking at the data then he/she istrying to look for next x value which he/she believes to be thecorresponding minimum. Players who weigh graphical informa-tion more are assumed to follow the curve fitting approach andare termed as graphical players. On the other hand, players whoweigh list information more follow the bisection approach, andare termed as numerical players. The different weights associat-ing the information source and the decision approaches are thustermed as ω1(t),ω2(t),ω3(t), and ω4(t). These weights are func-tions of time considering that the players’ information gatheringstrategies can change over time.
Previous studies on problem-solving have shown that suc-cessful performers usually pay more visual attention on the crit-ical areas of the visual stimuli than that of the unsuccessful per-formers [44]. Thus we expect well-performing players to focusmore on the important areas of the user interface while playingthis game. To test the significance of the information source inthe game, i.e. the list and graph areas, we propose the hypothesis:
H1: The players who spend more time looking at the list andgraph areas win greater profit.
The validity of this hypothesis would help confirm the im-portance of the list and graph areas as infomration sources in thecognitive decision process.
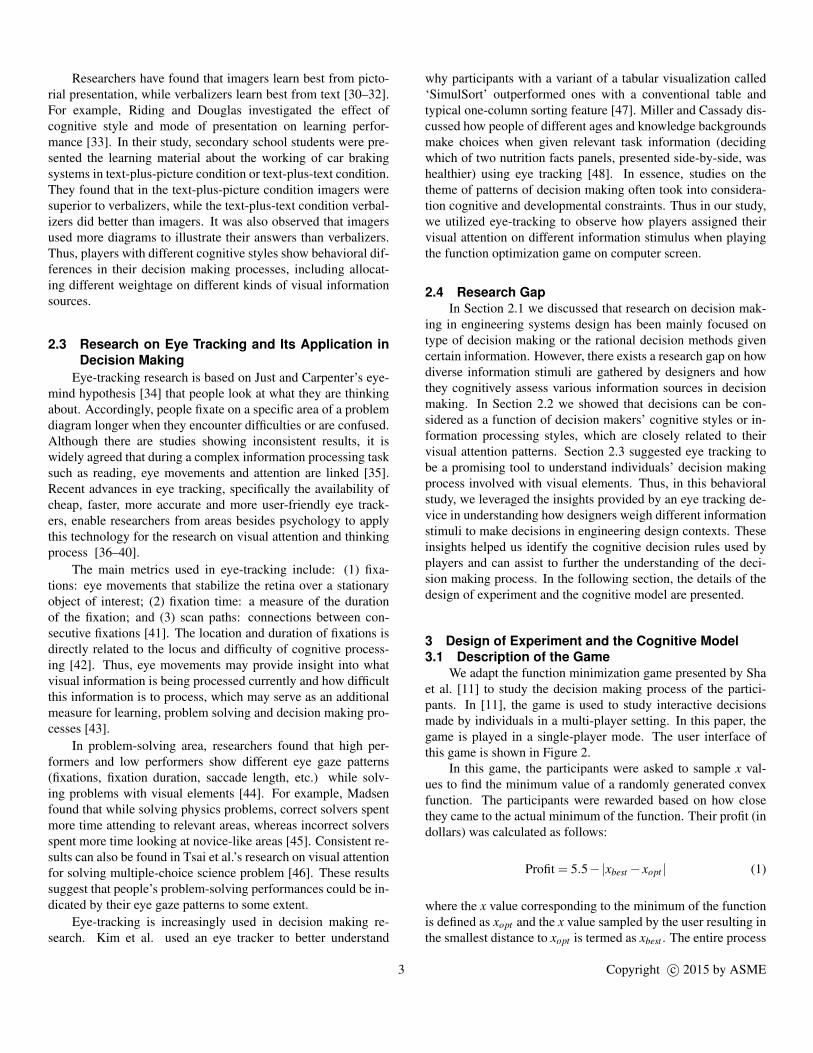
When using the bisection approach, players compare the rel-ative magnitudes of previously obtained f (x) values, and get thenext x value by calculating the midpoint of the previous two xvalues. On the other hand, when using the curve fitting approach,
players would visually fit a curve in their minds based on the ob-tained x and f (x) values, and get the best x value resulting in theminimum of the function. See Figure 4 for more explicit illustra-tion of these two approaches.
In this game, accuracy is considered to have an inverse re-lation to the absolute difference between the x value tried andthe xopt . The quality of the solution is thus indicated by the ac-curacy. Players who follow the curve fitting approach are ex-pected to have higher accuracy of the obtained x values. This isbecause curve fitting to a quadratic function mathematically re-quires three data points such that the minimum can be obtainedafter that. Therefore, ideally, four tries are required to find theminimum (including one try for submitting the final solution) ifthe participants perfectly follow a curve-fitting approach. How-ever, the bisection approach is dependent on the range providedand the location of the minimum. This might require more than4 tries to reach xopt . Thus, graphical players are expected to con-verge to the xopt values faster than the numerical players. Thisalso means that the profit expected for the graphical players ishigher given the way profit has been defined in Equation (1).To test whether the players who gave a higher weightage to thegraphical stimulus primarily follow the curve fitting approach,we propose the following hypotheses:
H2a: Graphical players have a better solution quality.H2b: Graphical players have a higher convergence rate.The cognitive demand to players who follow the bisection
approach is comparatively lower because of the more straight-forward and easier calculation. These players are expected todecide the next x faster given that the number of search iterationsis identical for all participants. Thus they would finish one periodof this game in shorter time. To test the assumption that playerswho gave a higher weightage to the numerical stimulus primarilyfollow the bisection approach, we proposed the hypothesis:
H3: Numerical players spent less time during a period.Testing hypotheses H2 and H3 would provide us insights
about how players’ weights on different information sourceswould impact their cognitive decision approaches and decisionoutcomes.
3.3 Experimental ProcedureParticipants: Twenty graduate students from engineering
schools at Purdue University were recruited to participate in theexperiment. None of the participants knew about this game be-fore and they were compensated 10 dollars on average for theparticipation. A quadratic function was used, but the participantswere only informed that the function is convex.
Procedure: A Tobii X-60 (Tobii Technology AB, Danderyd,Sweden) eye tracking device was utilized to study the eye gazepatterns of the participants on the game interface and the partici-pants were interviewed about their game-playing strategies afterplaying the whole game. The iMotions Attention Tool 5.3 soft-ware (iMotions Inc., Cambridge, MA) is used for analyzing eyegaze data.
Participants were briefed about the game, and then their eye
5 Copyright c© 2015 by ASME
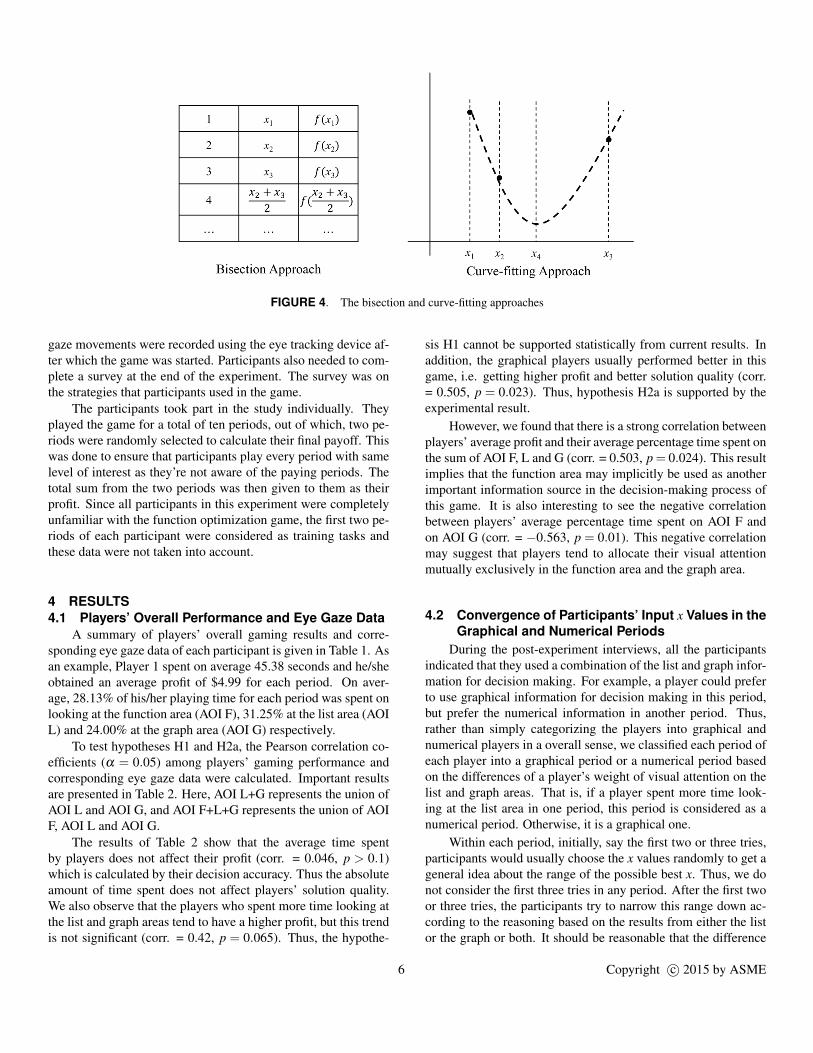
FIGURE 4. The bisection and curve-fitting approaches
gaze movements were recorded using the eye tracking device af-ter which the game was started. Participants also needed to com-plete a survey at the end of the experiment. The survey was onthe strategies that participants used in the game.
The participants took part in the study individually. Theyplayed the game for a total of ten periods, out of which, two pe-riods were randomly selected to calculate their final payoff. Thiswas done to ensure that participants play every period with samelevel of interest as they’re not aware of the paying periods. Thetotal sum from the two periods was then given to them as theirprofit. Since all participants in this experiment were completelyunfamiliar with the function optimization game, the first two pe-riods of each participant were considered as training tasks andthese data were not taken into account.
4 RESULTS4.1 Players’ Overall Performance and Eye Gaze Data
A summary of players’ overall gaming results and corre-sponding eye gaze data of each participant is given in Table 1. Asan example, Player 1 spent on average 45.38 seconds and he/sheobtained an average profit of $4.99 for each period. On aver-age, 28.13% of his/her playing time for each period was spent onlooking at the function area (AOI F), 31.25% at the list area (AOIL) and 24.00% at the graph area (AOI G) respectively.
To test hypotheses H1 and H2a, the Pearson correlation co-efficients (α = 0.05) among players’ gaming performance andcorresponding eye gaze data were calculated. Important resultsare presented in Table 2. Here, AOI L+G represents the union ofAOI L and AOI G, and AOI F+L+G represents the union of AOIF, AOI L and AOI G.
The results of Table 2 show that the average time spentby players does not affect their profit (corr. = 0.046, p > 0.1)which is calculated by their decision accuracy. Thus the absoluteamount of time spent does not affect players’ solution quality.We also observe that the players who spent more time looking atthe list and graph areas tend to have a higher profit, but this trendis not significant (corr. = 0.42, p = 0.065). Thus, the hypothe-
sis H1 cannot be supported statistically from current results. Inaddition, the graphical players usually performed better in thisgame, i.e. getting higher profit and better solution quality (corr.= 0.505, p = 0.023). Thus, hypothesis H2a is supported by theexperimental result.
However, we found that there is a strong correlation betweenplayers’ average profit and their average percentage time spent onthe sum of AOI F, L and G (corr. = 0.503, p = 0.024). This resultimplies that the function area may implicitly be used as anotherimportant information source in the decision-making process ofthis game. It is also interesting to see the negative correlationbetween players’ average percentage time spent on AOI F andon AOI G (corr. = −0.563, p = 0.01). This negative correlationmay suggest that players tend to allocate their visual attentionmutually exclusively in the function area and the graph area.
4.2 Convergence of Participants’ Input x Values in theGraphical and Numerical Periods
During the post-experiment interviews, all the participantsindicated that they used a combination of the list and graph infor-mation for decision making. For example, a player could preferto use graphical information for decision making in this period,but prefer the numerical information in another period. Thus,rather than simply categorizing the players into graphical andnumerical players in a overall sense, we classified each period ofeach player into a graphical period or a numerical period basedon the differences of a player’s weight of visual attention on thelist and graph areas. That is, if a player spent more time look-ing at the list area in one period, this period is considered as anumerical period. Otherwise, it is a graphical one.
Within each period, initially, say the first two or three tries,participants would usually choose the x values randomly to get ageneral idea about the range of the possible best x. Thus, we donot consider the first three tries in any period. After the first twoor three tries, the participants try to narrow this range down ac-cording to the reasoning based on the results from either the listor the graph or both. It should be reasonable that the difference
6 Copyright c© 2015 by ASME

TABLE 1. Players’ overall gaming performance and corresponding eye gaze data
PlayerAverage time for
each period
Average profit for
each period ($)
Average percentage time
spent on AOI F (%)
Average percentage time
spent on AOI L (%)
Average percentage time
spent on AOI G (%)
1 45.38 4.99 28.13 31.25 24.00
2 102.38 5.49 29.50 21.63 28.38
3 71.50 5.17 20.75 23.25 25.38
4 102.33 5.01 30.50 41.00 7.83
5 67.88 4.69 30.25 40.00 2.88
6 53.33 5.49 36.33 18.83 17.33
7 89.50 5.49 22.50 34.50 22.63
8 54.50 5.42 31.50 9.83 19.67
9 73.00 5.43 30.38 28.38 16.13
10 152.29 4.65 23.86 42.86 4.29
11 125.57 5.26 18.71 25.00 29.71
12 62.25 5.49 43.00 27.75 7.88
13 131.13 5.46 28.25 37.88 20.38
14 73.75 5.35 32.88 38.13 4.13
15 140.63 5.45 18.88 42.63 26.88
16 98.00 5.49 29.75 37.50 16.50
17 96.63 5.44 27.63 35.00 19.38
18 81.67 4.56 34.17 40.50 2.00
19 137.29 5.48 49.29 22.86 10.00
20 85.86 1.73 36.00 25.43 1.43
TABLE 2. Pearson correlation coefficients between player’s gaming performance and corresponding eye gaze data
Correlations Pearson corr. coefficient P-value
Aver. profit vs. aver. time 0.046 0.848
Aver. profit vs. Aver. percentage time spent on AOI G 0.505 0.023
Aver. profit vs. Aver. percentage time spent on AOI L+G 0.420 0.065
Aver. profit vs. Aver. percentage time spent on AOI F+L+G 0.503 0.024
Aver. percentage time spent on AOI F vs. AOI G -0.563 0.010
between each try and the xopt would converge to zero or a smallnumber gradually as the participants become aware of the func-tional form. We calculate the absolute difference of the x valuestried and the xopt . We then perform an exponential regression toplot this difference vs. the number of tries based on the previousstudy by Sha et al. [11], which showed that the solution quality
is an exponential function of the number of tries. As the qual-ity is expected to increase with each try, the absolute differencebetween the x values and the xopt will decrease. The functionalform is taken as y = aebx where b is the convergence rate. Thehigher the absolute value of b, better is the convergence rate. InFigure 5, we plot the absolute values of the difference of the x
7 Copyright c© 2015 by ASME

values tried and the xopt for player 1 as an illustrative example.The b value of the curve is obtained using least-square re-
gression. This is done for each participant in each period. To testthe hypothesis H2b, we perform a two-sample t-test to investigatethe differences of the b values in the numerical periods (mean =−0.606, SD = 0.493) and the graphical periods (mean =−0.658,SD = 0.637). This difference is insignificant (t = 0.5, p = 0.309),thus the hypothesis H2b cannot be verified by the experimentalresults. Graphical players did not seem to have a higher conver-gence rate when playing this game.
FIGURE 5. The plot |xopt − x| for each try by player 1 during period7
4.3 Time Spent and Profit Obtained in the Graphicaland Numerical Periods
To test hypothesis H3, we calculated the time spent and theprofit obtained in each period for each participant. A two-samplet-test (α = 0.05) was done to compare the time spent and profitobtained in the graphical periods and numerical periods, and theresults are provided in Table 3.
We found that, there are no significant differences in the timespent for each period, irrespective of the player having more vi-sual attention on the list areas or graph areas. Thus, the hypoth-esis H3 that the player observing the list area more spent lesstime during one period cannot be supported either. However, theprofit differences between graphical and numerical periods aresignificant, which is consistent to the validity of hypothesis H2a.
Participants in our study also needed to complete surveysabout their gaming strategies and preferences on informationsources. It is interesting to find that player 3, 6, 8, 11, 15 17,19 and 20 believed that graphical information was more helpfulfor them to determine the appropriate x values. Based on the eyegaze data shown in Table 1, only player 2, 4, 8 and 11 paid more
visual attention on the graph areas than on the list areas. This in-consistency may suggest that a person would not always be ableto articulate his/her inherent cognitive styles in certain decision-making tasks [49] or they may not know that they are lookingmore at the list or the graph. In addition, it is possible that peo-ple found graphs more helpful because it provided a means formore quickly responding to the task than the text-based infor-mation [50], thus leading to less fixation times on the graphs.Players also indicated that they usually use a combination of ap-proaches, i.e. the bisection method and curve-fitting method inplaying this game, which could also explain the inconsistency.
5 CLOSING COMMENTSInformation gathering and processing is a crucial step in de-
cision making process, thus it is necessary to understand the wayinformation is gathered and weighed by designers to make deci-sions and the impact of their cognitive styles on such decisions.Think Aloud is a commonly used technique to understand howpeople solve problems or make decisions, but its main drawbackis that it interferes with the thinking process of decision makersduring certain short-time and highly concentrated tasks, and maynot produce consistent results [49]. In this paper, we utilizedan eye tracking device as a more objective and a non-invasiveinformation gathering tool to capture players’ eye gaze data togain insights about their visual attention patterns and thinkingprocesses.
We found that players’ visual attention paid on the grapharea of the game user interface positively correlated with theirgaming performance, i.e., profit. This finding suggests that cer-tain types of information stimuli could assist people in makingbetter decisions. Also, players in graphical periods are found toearn more profit and have a better accuracy than in numericalperiods, indicating that players’ weights on different informationstimuli could influence their decision results. This result is alsoconsistent with Cleveland’s finding that the human brain is moreable to identify and comprehend relationships and patterns if datais encoded into visual forms [51]. Through this study, we showhow the decision making process of an individual can be capturedand understood using the eye tracking device as an effective tool.
On the other hand, the hypotheses regarding players’ cogni-tive style models have not been supported by in this experiment.We fail to see that graphical players spend more time and numer-ical players get a higher convergence rate for each period. Onepossible reason is that in this game, participants did not receivebalanced stimuli of numerical information and graphical infor-mation. Note in Table 3, the number of numerical periods (N =109) is much greater than the number of graphical periods (N =38). Some participants commented that they could not see thecross points shown in the graph area for the initial two or threetries, in which the f (x) values were beyond the fixed range of thegraph. Also, when they tried the eighth or ninth time, the crosspoints were too close to each other, so that the graphical informa-tion could not assist them in making decisions either. Accordingto the interviews with the players, most of them indeed used the
8 Copyright c© 2015 by ASME
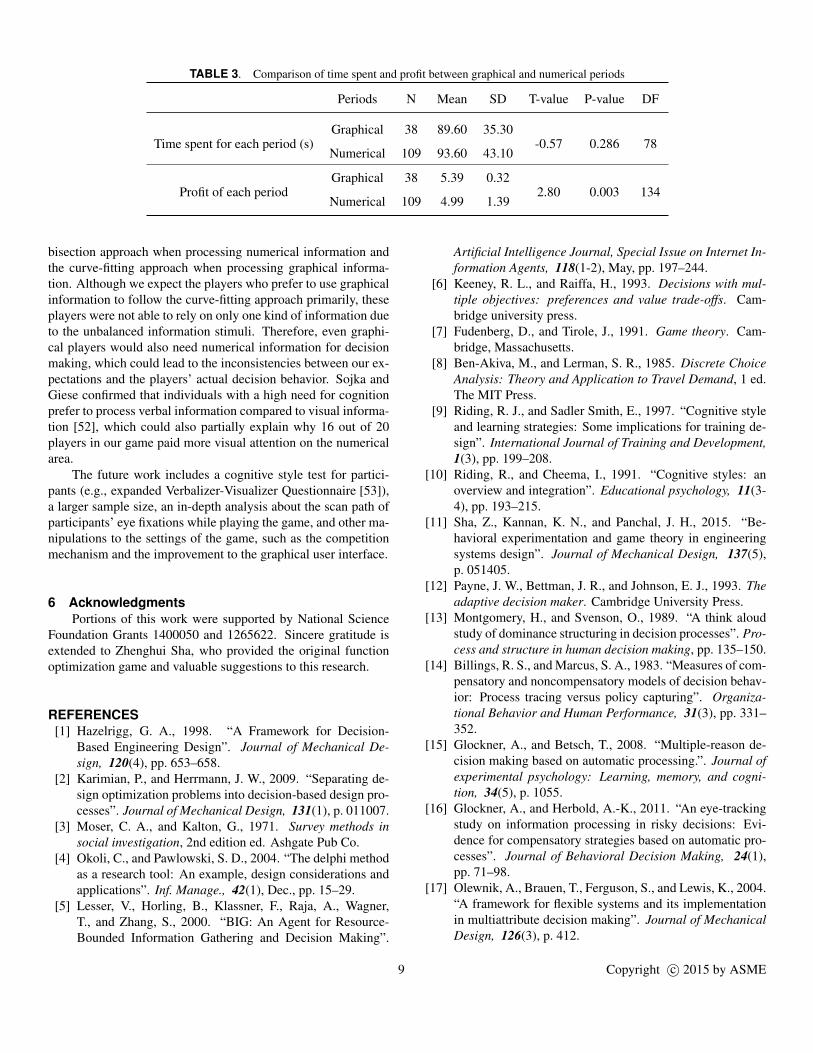
TABLE 3. Comparison of time spent and profit between graphical and numerical periods
Periods N Mean SD T-value P-value DF
Time spent for each period (s)Graphical 38 89.60 35.30
-0.57 0.286 78Numerical 109 93.60 43.10
Profit of each periodGraphical 38 5.39 0.32
2.80 0.003 134Numerical 109 4.99 1.39
bisection approach when processing numerical information andthe curve-fitting approach when processing graphical informa-tion. Although we expect the players who prefer to use graphicalinformation to follow the curve-fitting approach primarily, theseplayers were not able to rely on only one kind of information dueto the unbalanced information stimuli. Therefore, even graphi-cal players would also need numerical information for decisionmaking, which could lead to the inconsistencies between our ex-pectations and the players’ actual decision behavior. Sojka andGiese confirmed that individuals with a high need for cognitionprefer to process verbal information compared to visual informa-tion [52], which could also partially explain why 16 out of 20players in our game paid more visual attention on the numericalarea.
The future work includes a cognitive style test for partici-pants (e.g., expanded Verbalizer-Visualizer Questionnaire [53]),a larger sample size, an in-depth analysis about the scan path ofparticipants’ eye fixations while playing the game, and other ma-nipulations to the settings of the game, such as the competitionmechanism and the improvement to the graphical user interface.
6 AcknowledgmentsPortions of this work were supported by National Science
Foundation Grants 1400050 and 1265622. Sincere gratitude isextended to Zhenghui Sha, who provided the original functionoptimization game and valuable suggestions to this research.
REFERENCES[1] Hazelrigg, G. A., 1998. “A Framework for Decision-
Based Engineering Design”. Journal of Mechanical De-sign, 120(4), pp. 653–658.
[2] Karimian, P., and Herrmann, J. W., 2009. “Separating de-sign optimization problems into decision-based design pro-cesses”. Journal of Mechanical Design, 131(1), p. 011007.
[3] Moser, C. A., and Kalton, G., 1971. Survey methods insocial investigation, 2nd edition ed. Ashgate Pub Co.
[4] Okoli, C., and Pawlowski, S. D., 2004. “The delphi methodas a research tool: An example, design considerations andapplications”. Inf. Manage., 42(1), Dec., pp. 15–29.
[5] Lesser, V., Horling, B., Klassner, F., Raja, A., Wagner,T., and Zhang, S., 2000. “BIG: An Agent for Resource-Bounded Information Gathering and Decision Making”.
Artificial Intelligence Journal, Special Issue on Internet In-formation Agents, 118(1-2), May, pp. 197–244.
[6] Keeney, R. L., and Raiffa, H., 1993. Decisions with mul-tiple objectives: preferences and value trade-offs. Cam-bridge university press.
[7] Fudenberg, D., and Tirole, J., 1991. Game theory. Cam-bridge, Massachusetts.
[8] Ben-Akiva, M., and Lerman, S. R., 1985. Discrete ChoiceAnalysis: Theory and Application to Travel Demand, 1 ed.The MIT Press.
[9] Riding, R. J., and Sadler Smith, E., 1997. “Cognitive styleand learning strategies: Some implications for training de-sign”. International Journal of Training and Development,1(3), pp. 199–208.
[10] Riding, R., and Cheema, I., 1991. “Cognitive styles: anoverview and integration”. Educational psychology, 11(3-4), pp. 193–215.
[11] Sha, Z., Kannan, K. N., and Panchal, J. H., 2015. “Be-havioral experimentation and game theory in engineeringsystems design”. Journal of Mechanical Design, 137(5),p. 051405.
[12] Payne, J. W., Bettman, J. R., and Johnson, E. J., 1993. Theadaptive decision maker. Cambridge University Press.
[13] Montgomery, H., and Svenson, O., 1989. “A think aloudstudy of dominance structuring in decision processes”. Pro-cess and structure in human decision making, pp. 135–150.
[14] Billings, R. S., and Marcus, S. A., 1983. “Measures of com-pensatory and noncompensatory models of decision behav-ior: Process tracing versus policy capturing”. Organiza-tional Behavior and Human Performance, 31(3), pp. 331–352.
[15] Glockner, A., and Betsch, T., 2008. “Multiple-reason de-cision making based on automatic processing.”. Journal ofexperimental psychology: Learning, memory, and cogni-tion, 34(5), p. 1055.
[16] Glockner, A., and Herbold, A.-K., 2011. “An eye-trackingstudy on information processing in risky decisions: Evi-dence for compensatory strategies based on automatic pro-cesses”. Journal of Behavioral Decision Making, 24(1),pp. 71–98.
[17] Olewnik, A., Brauen, T., Ferguson, S., and Lewis, K., 2004.“A framework for flexible systems and its implementationin multiattribute decision making”. Journal of MechanicalDesign, 126(3), p. 412.
9 Copyright c© 2015 by ASME

[18] Wassenaar, H. J., Chen, W., Cheng, J., and Sudjianto, A.,2005. “Enhancing discrete choice demand modeling fordecision-based design”. Journal of Mechanical Design,127(4), p. 514.
[19] Wan, J., and Krishnamurty, S., 2001. “Learning-based pref-erence modeling in engineering design decision-making”.Journal of Mechanical Design, 123(2), p. 191.
[20] Hoyle, C., Chen, W., Wang, N., and Koppelman, F. S.,2010. “Integrated bayesian hierarchical choice modelingto capture heterogeneous consumer preferences in engi-neering design”. Journal of Mechanical Design, 132(12),p. pp.121010.
[21] Kahneman, D., and Tversky, A., 1979. “Prospect The-ory: An Analysis of Decision under Risk”. Econometrica,47(2), Mar., pp. 263–291.
[22] Simon, H. A., 1991. “Bounded Rationality and Organiza-tional Learning”. Organization Science, 2(1), pp. 125–134.
[23] Hunt, R. G., Krzystofiak, F. J., Meindl, J. R., and Yousry,A. M., 1989. “Cognitive style and decision making”.Organizational Behavior and Human Decision Processes,44(3), pp. 436–453.
[24] Riding, R., and Rayner, S., 2013. Cognitive Styles andLearning Strategies: Understanding Style Differences inLearning and Behavior. Routledge.
[25] Henderson, J. C., and Nutt, P. C., 1980. “The influence ofdecision style on decision making behavior”. ManagementScience, 26(4), pp. 371–386.
[26] Witkin, H. A., Dyk, R. B., Fattuson, H., Goodenough,D. R., and Karp, S. A., 1962. “Psychological differentia-tion: Studies of development.”. Oxford, England: Wiley,p. 418 pp.
[27] Pask, G., and Scott, B., 1972. “Learning strategies andindividual competence”. International Journal of Man-Machine Studies, 4(3), pp. 217–253.
[28] Hudson, L., 1966. Contrary Imagniations: A PsychologicalStudy of the Young Student. Schocken Books.
[29] Richardson, A., 1977. “Verbaliser-visualiser: A cognitivestyle dimension”. Journal of Mental Imagery, 1, pp. 109–126.
[30] Riding, R., and Ashmore, J., 1980. “Verbaliser-imagerlearning style and children’s recall of information presentedin pictorial versus written form”. Educational Studies,6(2), pp. 141–145.
[31] Riding, R. J., Buckle, C. F., Thompson, S., and Hagger,E., 1989. “The computer determination of learning stylesas an aid to individualized computer-based training”. Pro-grammed Learning and Educational Technology, 26(4),pp. 393–398.
[32] Riding, R., and Buckle, C., 1990. “Learning styles andtraining performance”. Sheffield: Training Agency.
[33] Riding, R., and Douglas, G., 1993. “The effect of cognitivestyle and mode of presentation on learning performance”.British Journal of Educational Psychology, 63(2), pp. 297–307.
[34] Just, M. A., and Carpenter, P. A., 1976. “The role of eye-
fixation research in cognitive psychology”. Behavior Re-search Methods & Instrumentation, 8(2), pp. 139–143+.
[35] Rayner, K., 1998. “Eye movements in reading and infor-mation processing: 20 years of research”. Psychologicalbulletin, 124(3), Nov., pp. 372–422.
[36] Duchowski, A. T., 2007. Eye Tracking Methodology: The-ory and Practice. Springer-Verlag New York, Inc., Secau-cus, NJ, USA.
[37] Duchowski, A. T., 2002. “A breadth-first survey of eye-tracking applications”. Behavior Research Methods, Instru-ments, and Computers, 34(4), Nov., pp. 455–470.
[38] Du, P., and MacDonald, E. F., 2014. “Eye-tracking datapredict importance of product features and saliency of sizechange”. Journal of Mechanical Design, 136(8).
[39] Reid, T., MacDonald, E., and Du, P., 2013. “Impactof product design representation on customer judgment”.Journal of Mechanical Design, 135(9), p. 091008.
[40] Smith, A. D., Mestre, J. P., and Ross, B. H., 2010. “Eye-gaze patterns as students study worked-out examples inmechanics”. Phys. Rev. ST Phys. Educ. Res., 6(2), Oct.,pp. 020118+.
[41] Goldberg, J. H., and Kotval, X. P., 1999. “Computer in-terface evaluation using eye movements: methods and con-structs”. International Journal of Industrial Ergonomics,24(6), Oct., pp. 631–645.
[42] Loftus, G. R., and Mackworth, N. H., 1978. “Cognitivedeterminants of fixation location during picture viewing”.Journal of Experimental Psychology: Human Perceptionand Performance, 4, pp. 565–572.
[43] Madsen, A., 2013. “Studies of visual attention in physicsproblem solving”. PhD thesis, Department of Physics,Kansas State University.
[44] Gegenfurtner, A., Lehtinen, E., and Slj, R., 2012. “Exper-tise differences in the comprehension of visualizations: Ameta-analysis of eye-tracking research in professional do-mains”. American Educational Research Association, April13-17, 2012, Vancouver, Canada.
[45] Madsen, A. M., Larson, A. M., Loschky, L. C., and Re-bello, N. S., 2012. “Differences in visual attention betweenthose who correctly and incorrectly answer physics prob-lems”. Physical Review Special Topics-Physics EducationResearch, 8(1), p. 010122.
[46] Tsai, M.-J., Hou, H.-T., Lai, M.-L., Liu, W.-Y., and Yang,F.-Y., 2012. “Visual attention for solving multiple-choicescience problem: An eye-tracking analysis”. Comput.Educ., 58(1), Jan., pp. 375–385.
[47] Kim, S.-H., Dong, Z., Xian, H., Upatising, B., and Yi, J. S.,2012. “Does an eye tracker tell the truth about visualiza-tions?: findings while investigating visualizations for deci-sion making”. Visualization and Computer Graphics, IEEETransactions on, 18(12), pp. 2421–2430.
[48] Miller, L. M., and Cassady, D. L., 2012. “Making healthyfood choices using nutrition facts panels: The roles ofknowledge, motivation, dietary modifications goals, andage”. Appetite, 59, p. 129139.
10 Copyright c© 2015 by ASME

[49] Nisbett, R. E., and Wilson, T. D., 1977. “Telling more thanwe can know: Verbal reports on mental processes”. Psy-chological Review, 84(3), pp. 231–259.
[50] Kelly, J. D., 1993. “The effects of display format and datadensity on time spent reading statistics in text, tables andgraphs”. Journalism & Mass Communication Quarterly,70(1), pp. 140–149.
[51] Cleveland, W. S., 1985. The Elements of Graphing Data.Wadsworth Publ. Co., Belmont, CA, USA.
[52] Sojka, J. Z., and Giese, J. L., 2001. “The influence of per-sonality traits on the processing of visual and verbal infor-mation”. Marketing Letters, 12(1), pp. 91–106.
[53] Kirby, J. R., Moore, P. J., and Schofield, N. J., 1988. “Ver-bal and visual learning styles”. Contemporary educationalpsychology, 13(2), pp. 169–184.
11 Copyright c© 2015 by ASME