understanding the life cycle ghg emissions for different
TRANSCRIPT

© Ricardo plc 2018
Final Report for LowCVP
Date Issued 1 August 2018
Report RD18-001581-2
Project Q014686
Confidential LowCVP and Project Steering Group
Report by Jane Patterson
Approved
Angela Johnson
Head of Knowledge & Technology Strategy
Understanding the life cycle GHG emissions
for different vehicle types and powertrain
technologies

21 August 2018Q014686 RD18-001581-2Client Confidential - LowCVP© Ricardo plc 2018
Version History & Disclaimer
This Report has been prepared solely for use by the party which commissioned it in connection with this project and should not be used for any other purpose. Ricardo accepts
no duty of care, responsibility or legal liability to any other recipient of this Report and no other person may rely on the contents. This Report is confidential and contains
proprietary intellectual property. Subject to applicable law, Ricardo disclaims all and any liability whether arising in tort or contract, statute, or under any duty of care, warranty or
undertaking, express or implied, to any person other than the Client in respect of this Report. In preparing this Report Ricardo may have relied on data, information or statements
(Data) supplied to us by the Client or third parties, in which case we have not independently verified this Data unless expressly stated in the Report. Data is assumed to be
accurate, complete, reliable and current as of the date of such information and no responsibility for any error or omission in the Report arising from errors or omissions in Data is
accepted. Any forecasts presented in this Report were prepared using Data and the Report is dependent on it. Some of the assumptions used to develop any forecasts may not
be realised and unanticipated events and circumstances may occur. Consequently Ricardo does not warrant the conclusions contained in this Report as there may be material
differences between forecasts and actual results. Parties must rely on their own skill and judgement when making use of this Report.
Reference Number Issued Date Revision
RD18-001581-1 31 May 2018 Draft Report – issues for discussion with LowCVP and Project Steering Group
RD18-001581-2 1 August 2018 Final Report

31 August 2018Q014686 RD18-001581-2Client Confidential - LowCVP© Ricardo plc 2018
• Introduction
• What is LCA?
• Study Methodology – Literature Review
• Framework – Guide to interpreting LCA Literature
• Literature Review Results – Vehicle Life Cycle GHG Emissions
• Conclusions
• Recommendations for Future Work
Contents

41 August 2018Q014686 RD18-001581-2Client Confidential - LowCVP© Ricardo plc 2018
• In 2011 LowCVP commissioned “Preparing for a life cycle CO2 measure”, a report from Ricardo. The purpose
was to inform the debate regarding future metrics for comparing low carbon vehicles by assessing a vehicle’s life
cycle CO2e footprint
• A follow-up project in 2013, completed by PE International for LowCVP, assessed the life cycle CO2e emissions
for a range of low carbon passenger cars in the time frame 2020 to 2030
• This report provides the next level of understanding by examining how life cycle CO2e emissions vary by vehicle
type, powertrain architecture and fuel
– Results are primarily based on a broad literature review and critique of existing automotive LCA material to
provide insight into current industry understanding of life cycle CO2e emissions for low carbon vehicles.
LowCVP members contributed to this literature review by providing recommended LCA papers and reports
– A “guidance framework” to interpreting LCA studies has also be developed, at the request of LowCVP, to help
the wider automotive community and policy makers understand the reasons for variations between published
LCA studies
Introduction
This report, commissioned by LowCVP, seeks to continue informing
the debate on future metrics for comparing low emission vehicles
Introduction

51 August 2018Q014686 RD18-001581-2Client Confidential - LowCVP© Ricardo plc 2018
• The purpose of this study was to provide LowCVP with a high-level understanding of how life cycle CO2e
emissions vary for different vehicle segments and technology architectures, based on public domain data
– The study focused on L-category vehicles, passenger cars, heavy duty trucks and buses
– Technology architectures of interest include conventional internal combustion engine, battery electric,
hybrid and plug-in hybrid vehicles
– Regarding fuels and energy vectors, this study primarily focused on gasoline, diesel and electricity
• The study endeavoured to answer these questions:
– What is the relative contribution of each life cycle stage (vehicle production, fuel production, vehicle use and
vehicle disposal) to life cycle CO2e emissions?
– How do the relative contributions of life cycle stages vary by vehicle type?
– Do the relative contributions change significantly for different powertrain types?
– What are sensible assumptions for key analysis inputs, such as life time mileage?
• The study also highlighted areas requiring future study, based on gaps in the available public domain literature
Introduction
This study focused on providing insight into how life cycle CO2e
emissions vary by vehicle segment and powertrain technology
Study Objectives
61 August 2018Q014686 RD18-001581-2Client Confidential - LowCVP© Ricardo plc 2018
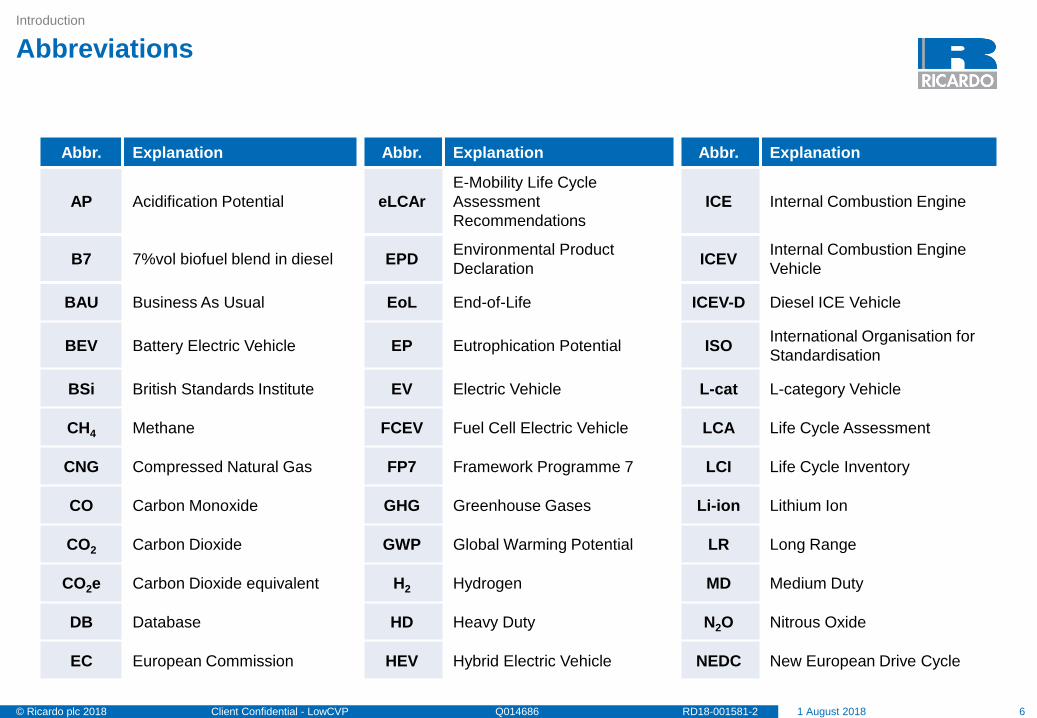
Introduction
Abbreviations
Abbr. Explanation Abbr. Explanation Abbr. Explanation
AP Acidification Potential eLCAr
E-Mobility Life Cycle
Assessment
Recommendations
ICE Internal Combustion Engine
B7 7%vol biofuel blend in diesel EPDEnvironmental Product
DeclarationICEV
Internal Combustion Engine
Vehicle
BAU Business As Usual EoL End-of-Life ICEV-D Diesel ICE Vehicle
BEV Battery Electric Vehicle EP Eutrophication Potential ISOInternational Organisation for
Standardisation
BSi British Standards Institute EV Electric Vehicle L-cat L-category Vehicle
CH4 Methane FCEV Fuel Cell Electric Vehicle LCA Life Cycle Assessment
CNG Compressed Natural Gas FP7 Framework Programme 7 LCI Life Cycle Inventory
CO Carbon Monoxide GHG Greenhouse Gases Li-ion Lithium Ion
CO2 Carbon Dioxide GWP Global Warming Potential LR Long Range
CO2e Carbon Dioxide equivalent H2 Hydrogen MD Medium Duty
DB Database HD Heavy Duty N2O Nitrous Oxide
EC European Commission HEV Hybrid Electric Vehicle NEDC New European Drive Cycle
71 August 2018Q014686 RD18-001581-2Client Confidential - LowCVP© Ricardo plc 2018
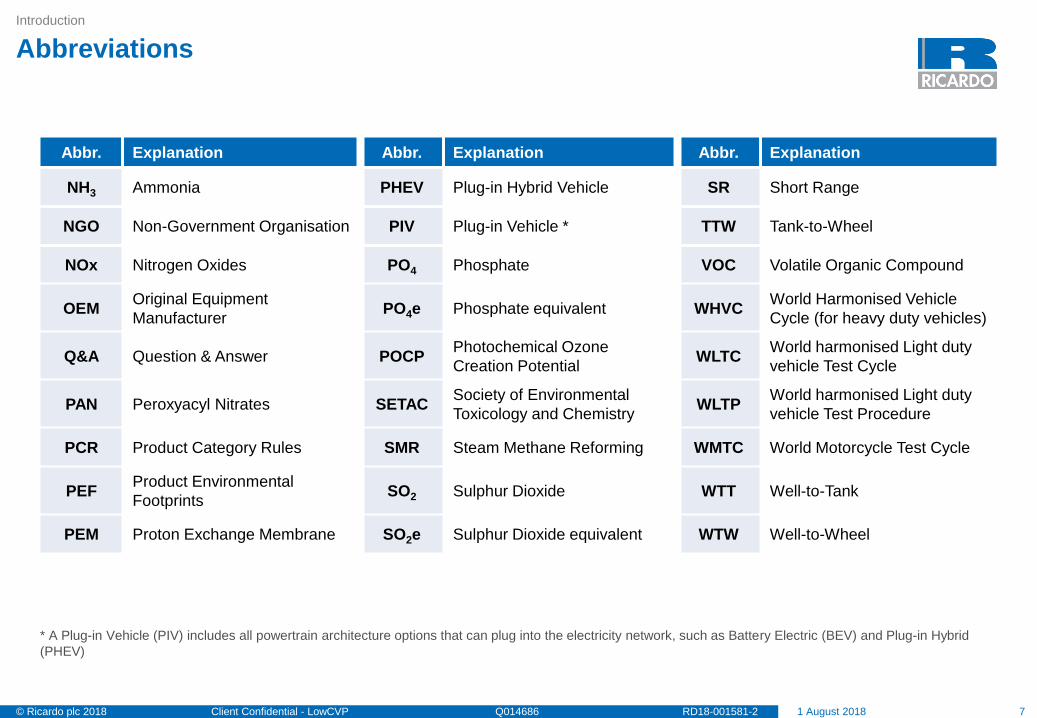
Introduction
Abbreviations
Abbr. Explanation Abbr. Explanation Abbr. Explanation
NH3 Ammonia PHEV Plug-in Hybrid Vehicle SR Short Range
NGO Non-Government Organisation PIV Plug-in Vehicle * TTW Tank-to-Wheel
NOx Nitrogen Oxides PO4 Phosphate VOC Volatile Organic Compound
OEMOriginal Equipment
ManufacturerPO4e Phosphate equivalent WHVC
World Harmonised Vehicle
Cycle (for heavy duty vehicles)
Q&A Question & Answer POCPPhotochemical Ozone
Creation PotentialWLTC
World harmonised Light duty
vehicle Test Cycle
PAN Peroxyacyl Nitrates SETACSociety of Environmental
Toxicology and ChemistryWLTP
World harmonised Light duty
vehicle Test Procedure
PCR Product Category Rules SMR Steam Methane Reforming WMTC World Motorcycle Test Cycle
PEFProduct Environmental
FootprintsSO2 Sulphur Dioxide WTT Well-to-Tank
PEM Proton Exchange Membrane SO2e Sulphur Dioxide equivalent WTW Well-to-Wheel
* A Plug-in Vehicle (PIV) includes all powertrain architecture options that can plug into the electricity network, such as Battery Electric (BEV) and Plug-in Hybrid
(PHEV)

81 August 2018Q014686 RD18-001581-2Client Confidential - LowCVP© Ricardo plc 2018
• Introduction
• What is LCA?
• Study Methodology – Literature Review
• Framework – Guide to interpreting LCA Literature
• Literature Review Results – Vehicle Life Cycle GHG Emissions
• Conclusions
• Recommendations for Future Work
Contents

91 August 2018Q014686 RD18-001581-2Client Confidential - LowCVP© Ricardo plc 2018
• All things have a life cycle of “birth”, “use/service”
and “death” in which they impact on their
environment
• Life Cycle Assessment (LCA) is a technique for
quantifying the environmental and human health
impacts of a product over its life cycle
– Other names include “life cycle analysis”, “life
cycle approach”, “cradle-to-grave analysis”,
“ecobalance” or “environmental footprinting”
• Life Cycle Thinking is a way of thinking that
includes the economic, environmental and social
consequences of a product or process over its
entire life cycle
What is LCA?
Life Cycle Assessment (LCA) is about taking a holistic approach to
the analysis of a product’s environmental impact
Formal Definition of Life Cycle Assessment
“It is a process to evaluate the environmental burdens associated with a product, process or activity by identifying and quantifying
energy and materials used and wastes released to the environment. The assessment includes the entire life cycle of product,
process or activity, encompassing extracting and processing raw materials, manufacturing, transport and distribution; use, re-use,
maintenance; recycling, and final disposal”
SETAC, 1991
What is Life Cycle Assessment?
Product Assembly
Logistics
Use
Recycling / Disposal
Material Extraction

101 August 2018Q014686 RD18-001581-2Client Confidential - LowCVP© Ricardo plc 2018
• A life cycle assessment may be used to support decision making, or used for
environmental accounting
– Micro-level decision support covers product-related questions, such as
design and development decisions (e.g. identification of key environmental
parameters and eco-design to reduce environmental impact), or consumer
choice (e.g. eco-labelling)
– Macro-level decision support covers informing and developing policy,
such as identifying technologies with the largest environmental
improvement potential, and understanding the wider implications of
changes to infrastructure
– Environmental accounting, such as company social responsibility
reporting, or monitoring the environmental impacts of a nation, industry
sector, product group, or specific product
• Stakeholders include OEMs, suppliers, marketing & branding teams, product
development teams, policy makers, and researchers
What is LCA?
LCA can be used to support decision making (micro and macro), or
to support environmental accounting and reporting
What is LCA used for?

111 August 2018Q014686 RD18-001581-2Client Confidential - LowCVP© Ricardo plc 2018
What is LCA?
As discussed in the 2011 report, a vehicle’s life cycle consists of
four stages – vehicle production, fuel production, use and end of life
End-of-Life
Assessment of environmental
impact of “end of life” scenario,
including re-using components,
recycling materials, energy
recovery, and disposal to landfill
Fuel ProductionAssessment of environmental
impact of producing the energy
vector(s) from primary energy
source to point of distribution (e.g.
refuelling station)
Vehicle Life Cycle
Vehicle Production
Assessment of environmental
impact of producing the vehicle
including extract of raw materials,
processing, component
manufacture, logistics, vehicle
assembly and painting
Use
• Environmental impact of driving
• Impact from maintenance and
servicing

121 August 2018Q014686 RD18-001581-2Client Confidential - LowCVP© Ricardo plc 2018
What is LCA?
A vehicle LCA study may consider the whole life of the vehicle, or
just part of it, such as Well-to-Wheel or “cradle-to-gate”
End-of-Life
Assessment of environmental
impact of “end of life” scenario,
including re-using components,
recycling materials, energy
recovery, and disposal to landfill
Fuel ProductionAssessment of environmental
impact of producing the energy
vector(s) from primary energy
source to point of distribution (e.g.
refuelling station)
Vehicle Life Cycle
Vehicle Production
Assessment of environmental
impact of producing the vehicle
including extract of raw materials,
processing, component
manufacture, logistics, vehicle
assembly and painting
Use
• Environmental impact of driving
• Impact from maintenance and
servicing
Well-to-Wheel (WTW) Analysis is
Life Cycle Assessment of the fuel
(energy) used to power the vehicle
“Embedded” emissions result from
from vehicle production; fluid, filter and
component replacement during life; and
end-of-life activities. A “cradle-to-
gate” LCA study may only consider
vehicle or component production
Analysis of the whole vehicle life
cycle will include embedded
emissions from vehicle production,
maintenance and servicing, and
end-of-life activities, and WTW
emissions from production and use
of the fuel / energy
131 August 2018Q014686 RD18-001581-2Client Confidential - LowCVP© Ricardo plc 2018
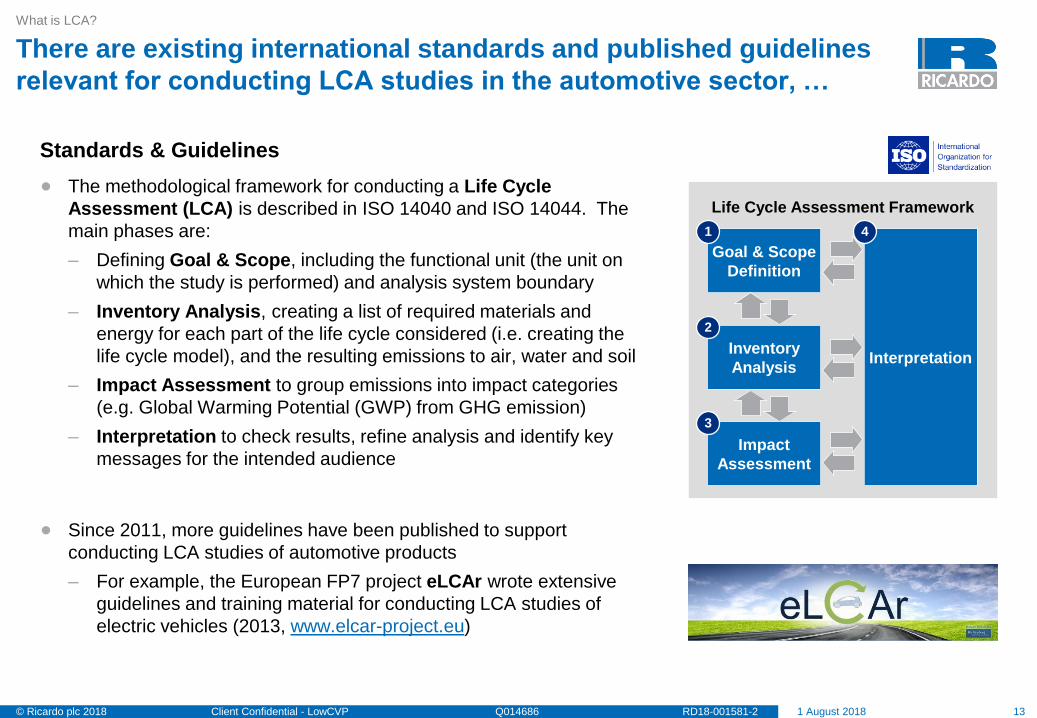
• The methodological framework for conducting a Life Cycle
Assessment (LCA) is described in ISO 14040 and ISO 14044. The
main phases are:
– Defining Goal & Scope, including the functional unit (the unit on
which the study is performed) and analysis system boundary
– Inventory Analysis, creating a list of required materials and
energy for each part of the life cycle considered (i.e. creating the
life cycle model), and the resulting emissions to air, water and soil
– Impact Assessment to group emissions into impact categories
(e.g. Global Warming Potential (GWP) from GHG emission)
– Interpretation to check results, refine analysis and identify key
messages for the intended audience
• Since 2011, more guidelines have been published to support
conducting LCA studies of automotive products
– For example, the European FP7 project eLCAr wrote extensive
guidelines and training material for conducting LCA studies of
electric vehicles (2013, www.elcar-project.eu)
What is LCA?
There are existing international standards and published guidelines
relevant for conducting LCA studies in the automotive sector, …
Standards & Guidelines
Life Cycle Assessment Framework
Goal & Scope
Definition
Inventory
Analysis
Impact
Assessment
Interpretation
1
2
3
4

141 August 2018Q014686 RD18-001581-2Client Confidential - LowCVP© Ricardo plc 2018
• Environmental Product Declarations (EPDs) are defined
by ISO 14025, building on ISO 14040 and ISO 14044. An
EPD must be based on a product LCA, use Product
Category Rules (PCR) for the relevant product type, and be
verified by a third party
• Other standards for environmental footprinting include:
– Carbon Footprint - ISO/TS 14067 or BSi PAS 2050
– Water Footprint - ISO 14046
– Footprint Reporting - ISO 14026
What is LCA?
… including standards for product environmental footprinting and
how results should be communicated the public
Product Environmental Footprints
Source: International Standards Organisation; https://www.environdec.com/What-is-an-EPD/; British Standards Institute
151 August 2018Q014686 RD18-001581-2Client Confidential - LowCVP© Ricardo plc 2018
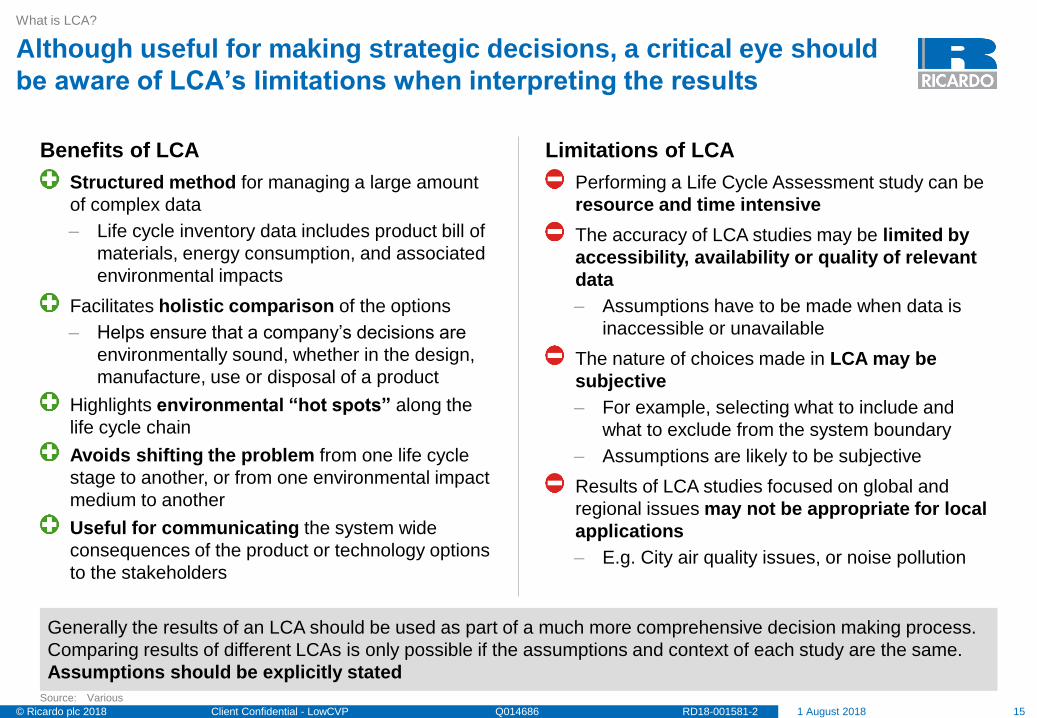
Structured method for managing a large amount
of complex data
– Life cycle inventory data includes product bill of
materials, energy consumption, and associated
environmental impacts
Facilitates holistic comparison of the options
– Helps ensure that a company’s decisions are
environmentally sound, whether in the design,
manufacture, use or disposal of a product
Highlights environmental “hot spots” along the
life cycle chain
Avoids shifting the problem from one life cycle
stage to another, or from one environmental impact
medium to another
Useful for communicating the system wide
consequences of the product or technology options
to the stakeholders
What is LCA?
Although useful for making strategic decisions, a critical eye should
be aware of LCA’s limitations when interpreting the results
Benefits of LCA
Performing a Life Cycle Assessment study can be
resource and time intensive
The accuracy of LCA studies may be limited by
accessibility, availability or quality of relevant
data
– Assumptions have to be made when data is
inaccessible or unavailable
The nature of choices made in LCA may be
subjective
– For example, selecting what to include and
what to exclude from the system boundary
– Assumptions are likely to be subjective
Results of LCA studies focused on global and
regional issues may not be appropriate for local
applications
– E.g. City air quality issues, or noise pollution
Limitations of LCA
Generally the results of an LCA should be used as part of a much more comprehensive decision making process.
Comparing results of different LCAs is only possible if the assumptions and context of each study are the same.
Assumptions should be explicitly stated
Source: Various

161 August 2018Q014686 RD18-001581-2Client Confidential - LowCVP© Ricardo plc 2018
• Introduction
• What is LCA?
• Study Methodology – Literature Review
• Framework – Guide to interpreting LCA Literature
• Literature Review Results – Vehicle Life Cycle GHG Emissions
• Conclusions
• Recommendations for Future Work
Contents

171 August 2018Q014686 RD18-001581-2Client Confidential - LowCVP© Ricardo plc 2018
Study Methodology – Literature Review
Ricardo employed a literature search, scan and prioritisation
approach to select the “Top 50” papers to review
Study Methodology – Literature Review
Literature Scan & Categorisation
Prioritisation
Identified documents entered into LCA Literature Database. Initial high-level review of all documents to
categorise by vehicle type, powertrain technology, fuel / energy vector, vehicle components, life cycle
stages, environmental impacts and LCA tools used
Literature Review of “Top 50”
Papers ranked according to relevance to this study (more recent papers and European
context considered most relevant), and usefulness of data recorded. Highly ranked papers
selected for next-level Literature Review
Review of papers by vehicle type (and batteries) to extract relevant information
such as application, key assumptions, life cycle impact results
Literature Searches
Discussion & Critique
Searches of relevant LCA and related literature using a range of tools such as Ricardo Powerlink, Science Direct and
Google. Also includes input from LowCVP members and Ricardo background information
L-Category Passenger Car Trucks Buses Batteries
Recording of Literature Review outputs to provide understanding of life cycle GHG emissions for different
vehicle types and powertrain technologies. Also, highlighting areas of commonality or convergence, and
reasons for variation

181 August 2018Q014686 RD18-001581-2Client Confidential - LowCVP© Ricardo plc 2018
Conventional ICE
Mild HEV
Full HEV
PHEV
BEV
FCEV
Other
Study Methodology – Literature Review
Ricardo, with input from LowCVP members, identified >150 relevant
documents, the top 50 were included in the Literature Review
Literature Review Dashboard – Status Update 23 May 2018 (1/2)
L-Cat
Small Passenger Car
Medium Passenger Car
Large Passenger Car
Small Truck / Van
Medium Truck
Large Truck
Bus
Other
Interest by Topic Area
Ve
hic
le T
yp
e
Geography
136papers & reports
identified
15+Literature Searches
completed
Including c.25 documents submitted by LowCVP
members
>100papers scan read or reviewed
In addition 30 News Articles and
c.20 OEM and Supplier Sustainability &
Environmental reports also considered
0 10 20 30 40 50 60 70
Gasoline
Diesel
Biofuel
Natural Gas
Bio-Methane
Electricity
Hydrogen
Other
Po
we
rtra
in
Te
ch
no
log
yF
uel
Source: Full list of literature provided to LowCVP in the LCA Literature Database (RD18-001155)
75
Rest of World – 15 papers
4311
There are many
more LCA studies
on passenger cars
than L-cat, trucks
and buses
BEV vs. conventional ICE
is a popular LCA topic
This study has
focused on
gasoline, diesel
and electricity
Some papers considered >1 geographical region

191 August 2018Q014686 RD18-001581-2Client Confidential - LowCVP© Ricardo plc 2018
Study Methodology – Literature Review
The collected literature covers all vehicle life cycle stages, with a
focus on more recent publications
Literature Review Dashboard – Status Update 23 May 2018 (2/2)
Interest by Study Geographical Location
0
5
10
15
20
25
30
35
Before2010
2010 2011 2012 2013 2014 2015 2016 2017 2018 Unknown
Publications by Organisation Type
Academic62%
Industry29%
Other9%
University44%
Research Centre19%
OEM18%
Supplier1%
Consultant7%
Association2% NGO
3%
Media1%
Academic Industry Other
Interest by Life Cycle Stage
0
10
20
30
40
50
60
Vehicle /ComponentProduction
FuelProduction
(WTT)
Vehicle Use(TTW)
Maintenance& Servicing
End-of-Life Infrastructure Other
Literature searches
prioritised more recent
publications
The chart above shows publications by organisation
type of the main author. It does not include analysis of
press releases or OEM Environmental and
Sustainability reports.
The LCA literature database is non-exhaustive and
does not contain a complete list of all automotive LCA
studiesSource: Full list of literature provided to LowCVP in the LCA Literature Database (RD18-001155)

201 August 2018Q014686 RD18-001581-2Client Confidential - LowCVP© Ricardo plc 2018
• Introduction
• What is LCA?
• Study Methodology – Literature Review
• Framework – Guide to interpreting LCA Literature
• Literature Review Results – Vehicle Life Cycle GHG Emissions
• Conclusions
• Recommendations for Future Work
Contents

211 August 2018Q014686 RD18-001581-2Client Confidential - LowCVP© Ricardo plc 2018
Framework – Guide to interpreting LCA Literature
LowCVP propose a “guidance framework” to help the wider
automotive community and policy makers understand LCA studies
Understanding LCA Studies – “Guidance Framework” Overview
Geography Input Data Key Assumptions LCI DatasetsEnvironmental
Impact FactorsTime Horizon
Primary vs.
Secondary data
• Vehicle duty cycle
• Lifetime Mileage [km]
• Electricity carbon intensity
[kgCO2e/kWh]
• Battery embedded carbon
factor [kgCO2e/kWh or
kgCO2e/kg] , etc.
E.g. EcoInvent
How old is this
data?
E.g.
• Global
Warming
Potential
(GWP) [tCO2e]
• Human
Toxicity, etc.
Model Year
(current / historic /
future)
Vehicle Lifetime
Allowance for
temporal effects,
etc.
Study Subject & Functional Unit
System Boundary
Subject
System
Boundary
Inputs,
Assumptions
& OutputsGeography
#3
#2
#1
Study Type
(e.g. Academic /
Policy / EPD)
1
3
2
4
56
What was included in the
analysis? And what was
excluded?
What product system was studied?
What was the functional unit?
Who provided the
input data? What
was provided?
What is the location of
use? What is the
location(s) of production?

221 August 2018Q014686 RD18-001581-2Client Confidential - LowCVP© Ricardo plc 2018
Framework – Guide to interpreting LCA Literature
The first step to understanding LCA studies is identifying the study
subject (application) and functional unit
LCA Study Subject and Functional Unit
Study Subject
• What product system was studied?
– The study subject could be a specific vehicle make and model, or a hypothetical situation (e.g.
generic mid-size European passenger car)
– The study may focus on a component or sub-system (e.g. battery pack), rather than the whole
vehicle. Or it could consider a whole vehicle fleet or vehicle parc, rather than a single vehicle
– It may focus on the energy vectors only (e.g. Well-to-Wheel analysis)
– Or, it may consider the transportation of X passengers / cargo over a specified distance
• If the study has considered more than one subject (e.g. comparison of different powertrain
technologies), the subjects should have a common purpose and function
Functional Unit
• The scope of an LCA study should clearly specify the functions (performance characteristics) of the
system studied (see ISO 14040 and ISO 14044)
• The functional unit provides the reference for normalising input and output data. It should be clearly
defined, measurable and technology-neutral
• The units of the results usually provides an indication of the study’s functional unit
– For example, are the results presented as total emissions (e.g. tCO2e), or per vehicle kilometre
travelled (e.g. gCO2e/km)?
1

231 August 2018Q014686 RD18-001581-2Client Confidential - LowCVP© Ricardo plc 2018
Framework – Guide to interpreting LCA Literature
The analysis may have considered the whole vehicle life cycle or
part of it – common system boundaries are listed below
LCA Study Categorisation – Life Cycle System Boundary2
Level A
Tailpipe only• Considers vehicle point-of-use only
Level B
Well-to-Wheel
(WTW)
• Considers the fuel or energy vector life cycle,
from primary energy (e.g. drilling for oil) through
to use in the vehicle
• Frequently split into “Well-to-Tank” (fuel
production and distribution) and “Tank-to-
Wheels” (vehicle consumption during use)
Level C
Vehicle Life
Cycle
• Considers the whole vehicle life cycle (cradle-to-
grave) from material extraction, through
production to use and end-of-life processes
Level D
Whole mobility
system life
cycle
• Considers impact of subject within the wider
techno-, socio- and eco-spheres, such as
including changes to infrastructure or analysing
externalities
Cradle-to-gate
• Considers production phase of the vehicle or
component, including material extraction
• Analysis stops at end of production. Use and
end-of-life phases not included in analysis
What has been
excluded?
• Take note of what
has not been
included in the
analysis system
boundary
• (This is not clear for
all studies)

241 August 2018Q014686 RD18-001581-2Client Confidential - LowCVP© Ricardo plc 2018
Framework – Guide to interpreting LCA Literature
Knowing who commissioned the study, who conducted it and the
intended audience helps to categorise the type of LCA study
Academic
• The LCA study may be commissioned by an OEM, supplier or a public research fund
• The study may be conducted by a researcher, consultant or manufacturer
• The intended audience is the wider academic and research community. The primary interest is the
creation of knowledge. Results may be published in technical journals
• Subject may be real (e.g. specified vehicle make and model) or hypothetical (e.g. generic European mid-
size passenger car)
Policy
• Commissioned by a government agency, NGO or research fund
• Conducted by a researcher or consultant
• The intended audience is policy makers and academics. The purpose is to provide understanding of
the potential implications of policy changes
• Usually considers the environmental impact of a product or service within a wider social system (e.g.
externalities)
Environmental
Reporting
• Commissioned by a manufacturer (e.g. OEM marketing department)
• Conducted by manufacturer or consultant
• The intended audience is customers and the general public
• The purpose is to quantify the life cycle environmental impacts of the manufacturer's products
• Studies usually conform to ISO 14025 or equivalent standard, with certification by an independent 3rd
party (e.g. national certification authority). Results may be published in Environmental Product
Declarations (EPDs) or Corporate Responsibility Reports
LCA Study Categorisation – Study Type3

251 August 2018Q014686 RD18-001581-2Client Confidential - LowCVP© Ricardo plc 2018
Framework – Guide to interpreting LCA Literature
LCA studies can also by categorised by approach – bottom-up or
top-down? Attributional or consequential? …
#1 Study Approach – Bottom-Up or Top-Down?
Bottom-Up • Starts with each production step, mapping input and output flows, to build up to the final product
Top-Down• Starts from known macro parameters describing the overall system
• Gradually unravels the macro information into data describing the sub-processes of the production
system
Combination • Uses a combination of bottom-up and top-down approaches to understand the life cycle system
LCA Study Categorisation – Study Approaches (1/2)
#2 Modelling Approach – Attributional or Consequential?
Attributional
• Answers the question “what are the environmental impacts resulting from activities that have
contributed to the production, use and disposal of the product?”
• Attributional modelling is accounting based. It depicts the potential environmental impacts that can be
attributed to a system along its supply chain, use and end-of-life. The system is modelled as it is, was
or is forecast to be. It makes use of historical, fact-based, measurable data. It includes the processes
that contributed to the system being studied. It uses cut-off rules and allocation to isolate the product
system
Consequential
• Answers the question “what are the environmental impacts resulting from activities that change due to
the production, use and disposal of the product?”
• Consequential modelling is science based. It focuses on the physical and social unit processes that
change as a consequence of a decision. Its purpose is decision support. Results do not represent the
environmental impacts of the functional unit in itself, but the environmental exchanges resulting from
adding or subtracting one functional unit compared to doing nothing
4
Source: ILCD Handbook: General guide for Life Cycle Assessment – Detailed guidance (2010); Meyer (2014) [#137]

261 August 2018Q014686 RD18-001581-2Client Confidential - LowCVP© Ricardo plc 2018
Framework – Guide to interpreting LCA Literature
… And, what accounting approach has been used for modelling
reuse, recycling and energy recovery of waste and end-of-life?
#3 Accounting Approach for modelling reuse, recycling and energy recovery
Processing waste and end-of-life products produces secondary (recycled) materials, energy resources (e.g. heat), and reconditioned
parts for re-use. These outputs are used in subsequent products, where they replace primary production of material and/or change
the energy mix. So, the process is multifunctional. The product being recycled has its primary function (what it was made for), and a
secondary function of providing resources for the subsequent life cycle of another product.
In closed-loop recycling, the life cycle model loops the secondary material or energy back to an earlier process where it replaces
primary input (e.g. using recycled rather than primary material). In open-loop recycling, all or part of the secondary material is used
in another product system. The recycled material may have the same inherent properties as the primary material (open-loop same
primary route). Or the material may undergo changes to its inherent properties during recycling (open-loop different primary route).
There are different methods that can be used to account for burdens and benefits of reuse, recycling and energy recovery
Simple Cut-Off
• All waste management burdens and benefits with value to a secondary product are assigned to the life
cycle of that secondary product. Therefore, end-of-life analysis generally stops after vehicle dismantling,
since the recycling of material will be counted in the new product that uses this recycled material
• No credits are applied for recycling
Environmental
Burden
• Recycling of a material avoids extraction and processing of primary materials (e.g. aluminium)
• All avoided expenses and emissions are completely attributed to the product that delivers the material
scrap after its service life (common practice)
• Therefore credits are applied for recycling
Shared Benefits &
Burden• Benefits and burden of recycling are shared between the product recycled, and the new product using
the recycled material
LCA Study Categorisation – Study Approaches (2/2)4
Source: ILCD Handbook: General guide for Life Cycle Assessment – Detailed guidance (2010);
Common Errors: Omission or double counting / modelling or recycling – Inconsistency in modelling and use of background
data can result in omitting or double counting the environmental impacts of recycling waste and end-of-life products

271 August 2018Q014686 RD18-001581-2Client Confidential - LowCVP© Ricardo plc 2018
• Geographical location of the product will define many of the key inputs and assumptions used in the life cycle
model, such as:
– Vehicle specification (affecting all life cycle stages)
– Vehicle in-use duty cycle, and associated vehicle fuel / energy consumption (e.g. L/100km)
– Expected lifetime (years) and lifetime mileage (km)
– Electricity mix and associated carbon intensity [gCO2e/kWh]
– Fuel specification and associated environmental impacts (e.g. Well-to-Tank factors for fossil and biofuel,
biofuel mix, and biofuel blend levels in conventional fuels)
• Note – The production locations of the vehicle and its many components may not be the same as its
geographical region of use. Therefore, the environmental impacts of the energy used during production and
assembly may be different to the energy used during vehicle use
– Also, many vehicle OEMs are exploring opportunities for reducing the environmental footprint of their
production facilities and supply chain, such as installing wind turbines or solar panels at factory sites. So the
energy mix used in the factory may be different to the national average of the factory location
Framework – Guide to interpreting LCA Literature
Geographical location of the study subject (application) will define
the subject specification and many key input assumptions
LCA Study Categorisation – Geography5

281 August 2018Q014686 RD18-001581-2Client Confidential - LowCVP© Ricardo plc 2018
Framework – Guide to interpreting LCA Literature
Finally, check what input data and assumptions have been applied,
and …
LCA Study Data, Assumptions, and Environmental Impacts (1/2)
Input Data(Primary vs.
secondary data)
• Does the study include new data collected from the manufacturer or through research in the field
(primary data)? (e.g. factory energy consumption, bill of materials, etc.)
• Or, does the study rely on previous publications? If so, how old is this secondary data?
Key Assumptions
What key assumptions have been made in the life cycle model?
For example:
• Vehicle lifetime mileage [km]
• Vehicle fuel consumption [L/100km or kWh/100km] – is this based on simulation, a laboratory test (e.g.
WLTP), or “real world” results? What duty cycle has been considered?
• Electricity carbon intensity [gCO2e/kWh]
• For hybrid and electric vehicles – battery capacity [kWh], EV range [km], and assumed “embedded GHG
emissions” factor for battery production (e.g. kgCO2e/kWh or kgCO2e/kg of battery pack), etc.
LCI Dataset
What generic life cycle inventory (LCI) data was used for materials, manufacturing processes and
other life cycle stages?
• Commonly used LCI datasets include EcoInvent, and thinkstep (GaBi)
6
291 August 2018Q014686 RD18-001581-2Client Confidential - LowCVP© Ricardo plc 2018
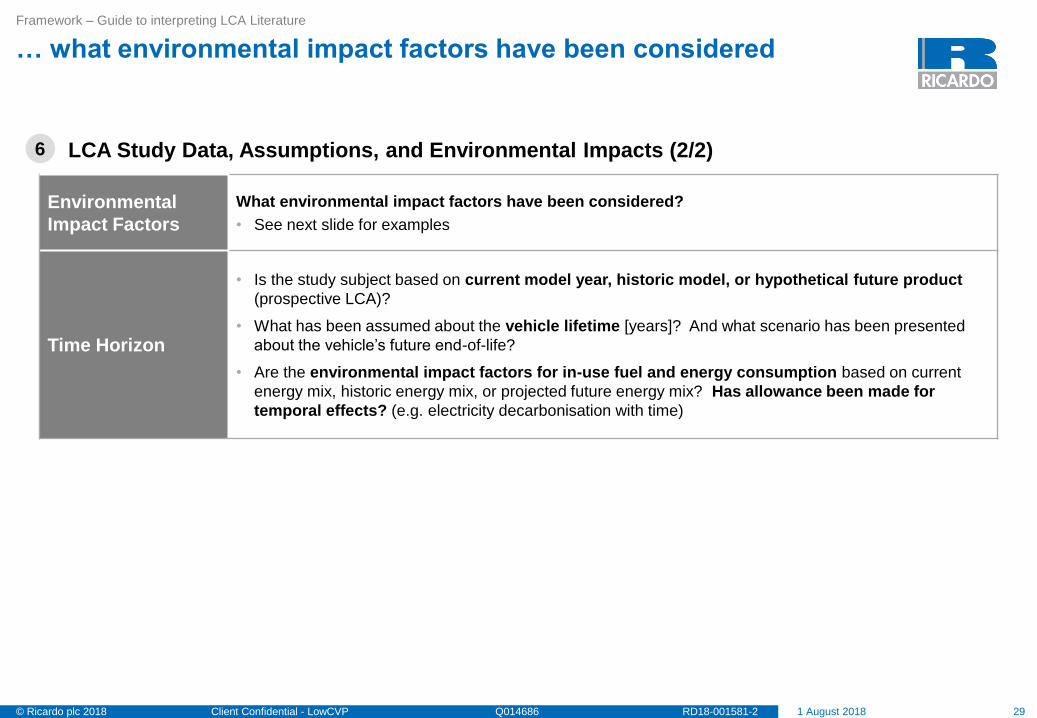
Framework – Guide to interpreting LCA Literature
… what environmental impact factors have been considered
LCA Study Data, Assumptions, and Environmental Impacts (2/2)
Environmental
Impact Factors
What environmental impact factors have been considered?
• See next slide for examples
Time Horizon
• Is the study subject based on current model year, historic model, or hypothetical future product
(prospective LCA)?
• What has been assumed about the vehicle lifetime [years]? And what scenario has been presented
about the vehicle’s future end-of-life?
• Are the environmental impact factors for in-use fuel and energy consumption based on current
energy mix, historic energy mix, or projected future energy mix? Has allowance been made for
temporal effects? (e.g. electricity decarbonisation with time)
6

301 August 2018Q014686 RD18-001581-2Client Confidential - LowCVP© Ricardo plc 2018
Framework – Guide to interpreting LCA Literature
There are many different types of environmental impact resulting
from emissions to water, air and soil, resource use and depletion
Typical Environmental Impact Categories
Global Warming Potential (GWP) describes GHG emissions that increase the absorption of heat from solar
radiation in the atmosphere and therefore increase the average global temperature. The reference substance is
CO2, and all other substances that impact on this process (e.g. CH4, N2O) are measured in CO2 equivalents (CO2e)
Source: VW (2010) The New Transporter Environmental Commendation Background Report
Acidification Potential (AP) describes the emissions of acidifying substances such as SO2 and NOx, which have
diverse impacts on soil, water, ecosystems, biological organisms and material (e.g. buildings). “Acid rain” and fish
mortality in lakes are examples of such negative effects. The reference substance is SO2, and all other
substances that impact on this process (e.g. NOx and NH3) are measured in SO2 equivalents (SO2e)
Eutrophication Potential (EP) describes excessive input of nutrients into water [or soil] that can lead to an
undesirable change in the composition of flora and fauna. A secondary effect of the over-fertilisation of water is
oxygen consumption and therefore oxygen deficiency. The reference substance is phosphate (PO4), and all other
substances that impact on this process (e.g. NOx, NH3) are measured in phosphate equivalents (PO4e)
Photochemical Ozone Creation Potential (POCP) describes the formation of photooxidants, such as ozone and
peroxyacetyl nitrate (PAN), which can be formed from hydrocarbons, carbon monoxide (CO) and nitrogen oxides
(NOx), in conjunction with sunlight. Photooxidants can impair human health and the functioning of ecosystems and
damage plants. The reference substance is ethene, and all other substances that impact on this process (e.g.
VOC, NOx and CO) are measured in ethene equivalents
SELECTED EXAMPLES

311 August 2018Q014686 RD18-001581-2Client Confidential - LowCVP© Ricardo plc 2018
• Introduction
• What is LCA?
• Study Methodology – Literature Review
• Framework – Guide to interpreting LCA Literature
• Literature Review Results – Vehicle Life Cycle GHG Emissions
• Conclusions
• Recommendations for Future Work
Contents

321 August 2018Q014686 RD18-001581-2Client Confidential - LowCVP© Ricardo plc 2018
Conventional ICE
Mild HEV
Full HEV
PHEV
BEV
FCEV
Other
Literature Review Results – Vehicle Life Cycle GHG Emissions
During the literature search, c.10 papers were identified that
assessed the life cycle, or part life cycle, emissions of L-cat vehicles
L-Category Vehicle – Literature Review Dashboard
Interest by Topic Area
Geography
12papers & reports
identified
5Papers reviewed
0 2 4 6 8 10 12
Gasoline
Diesel
Biofuel
Natural Gas
Bio-Methane
Electricity
Hydrogen
Other
Po
we
rtra
in
Te
ch
no
log
yF
uel
6
Rest of World – 5 papers
10
Most considered the environmental
impacts of motorcycles, scooters or
bicycles. A few considered L-category
4-wheel vehicles
Several studies
compared conventional
gasoline ICE with electric
motorcycles
Lif
e C
yc
le S
tag
e
0
2
4
6
8
10
Vehicle /ComponentProduction
FuelProduction
(WTT)
Vehicle Use(TTW)
Maintenance &Servicing
End-of-Life Infrastructure
Some studies considered the whole life cycle, while
others focused on production or end-of-life only
Source: Full list of literature provided to LowCVP in the LCA Literature Database (RD18-001155)

331 August 2018Q014686 RD18-001581-2Client Confidential - LowCVP© Ricardo plc 2018
Literature Review Results – Vehicle Life Cycle GHG Emissions
One LCA study on motorcycles suggested life cycle GHG emissions
vary from 1.4 – 26 tCO2e depending on size, technology and mileage
L-Category (Motorcycles) – Example Results (1/2)
0 5,000 10,000 15,000 20,000 25,000 30,000
BEV
ICEV
BEV
ICEV
BEV
ICEV
BEV
ICEV
4 k
W1
1 k
W2
5 k
W5
0 k
W
Life Cycle CO2e Emissions [kgCO2e]
Vehicle Glider Powertrain Energy Storage Energy Chain (Well-to-Tank) Direct Emissions (In-Use)
Assumed
Lifetime Mileage
27,840 km
over 11.6 years
66,240 km
over 14.4 years
114,000 km
over 20 years
145,000 km
over 25 years
Source: Adapted from [#036] Cox, B. L, and Mutel, C. L. (2018). The environmental and cost performance of current and future motorcycles. Applied Energy Volume 212, 15 February 2018, Pages
1013-1024Available at: https://www.sciencedirect.com/science/article/pii/S0306261917318238 [Accessed 26 March 2018]
Estimated Life Cycle CO2e Emissions for different motorcycle sizes and powertrains
SELECTED EXAMPLE
Assumptions on lifetime mileage have a strong
impact on calculated life cycle GHG emissions, and
the relative portion of each life cycle stage
As for other vehicle types, BEV powertrains tend to
have higher embedded GHG emissions from
production (due to the battery pack), and lower
GHG emissions for in-use (WTW)
Motorcycle assumed to operate in Europe, with average European electricity carbon intensity taken from EcoInvent 3.2 (other energy mixes also considered – see
paper and support information for further details). Lifetime mileage assumed to vary by motorcycle size. Selected lifetime mileages based on Swiss travel statistics
(1990 – 2014). In-use vehicle energy consumption based on WMTC. Vehicle end-of-life not included in analysis. The original analysis also included impact on
infrastructure (e.g. road wear), however results for infrastructure have not been included in the selected results shown above

341 August 2018Q014686 RD18-001581-2Client Confidential - LowCVP© Ricardo plc 2018
Literature Review Results – Vehicle Life Cycle GHG Emissions
Vehicle production could contribute c.10-75% of life cycle CO2e
emissions, again depending on technology and lifetime mileage
Motorcycle
Power [kW]Powertrain
Lifetime
Mileage
Relative Contribution of each Life Cycle Stage [%]
Climate Change
Impact [gCO2e/km]Vehicle Production Fuel
Production
(WTT)
Vehicle Use
(TTW)Glider PowertrainEnergy
Storage
4 kWBEV
27,840 km31.1% 6.4% 36.7% 25.8% 0.0% 49.4 gCO2e/km
ICEV 19.0% 10.9% 0.1% 11.5% 58.4% 80.8 gCO2e/km
11 kWBEV
66,240 km22.6% 2.6% 30.7% 44.2% 0.0% 56.2 gCO2e/km
ICEV 11.1% 4.6% 0.1% 15.1% 69.1% 113.9 gCO2e/km
25 kWBEV
114,000 km19.0% 1.4% 25.5% 54.1% 0.0% 69.7 gCO2e/km
ICEV 8.5% 2.6% 0.1% 16.3% 72.5% 155.4 gCO2e/km
50 kW BEV145,000 km
17.5% 1.1% 25.6% 55.8% 0.0% 80.1 gCO2e/km
ICEV 7.9% 2.3% 0.0% 16.6% 73.1% 177.1 gCO2e/km
L-Category (Motorcycles) – Example Results (2/2) SELECTED EXAMPLE
Source: Adapted from [#036] Cox, B. L, and Mutel, C. L. (2018). The environmental and cost performance of current and future motorcycles. Applied Energy Volume 212, 15 February 2018, Pages
1013-1024Available at: https://www.sciencedirect.com/science/article/pii/S0306261917318238 [Accessed 26 March 2018]
This study suggests Vehicle Production contributes
c.10-30% for ICEV and c.45-75% BEV depending on
size of motorcycle, lifetime mileage and battery
capacity
351 August 2018Q014686 RD18-001581-2Client Confidential - LowCVP© Ricardo plc 2018
Conventional ICE
Mild HEV
Full HEV
PHEV
BEV
FCEV
Other
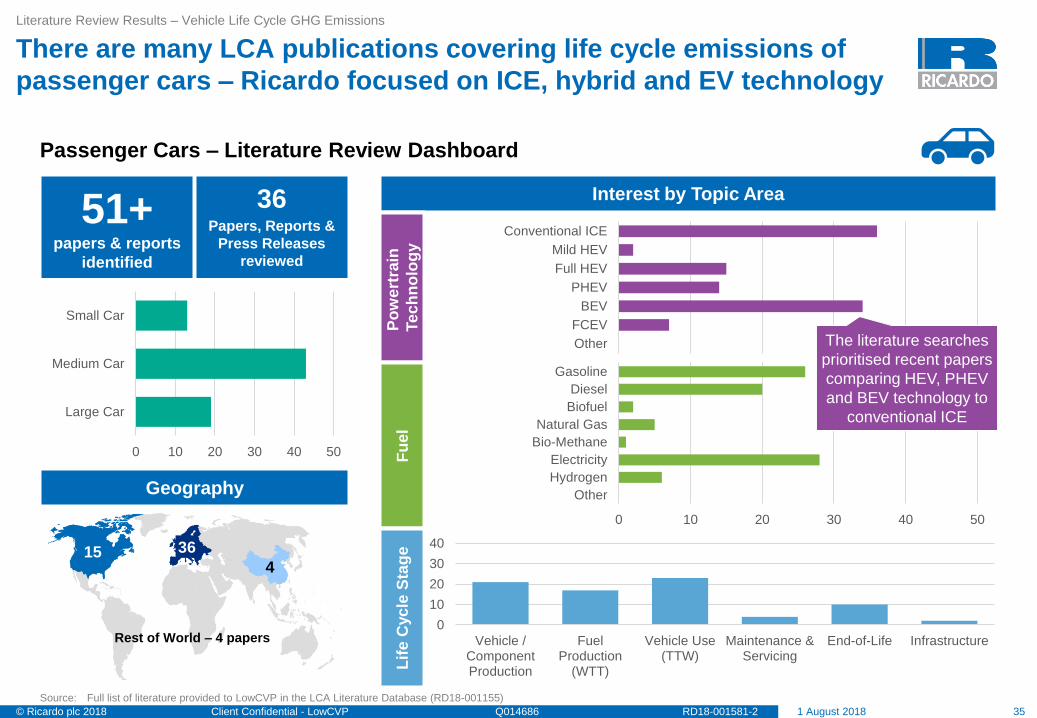
Literature Review Results – Vehicle Life Cycle GHG Emissions
There are many LCA publications covering life cycle emissions of
passenger cars – Ricardo focused on ICE, hybrid and EV technology
Passenger Cars – Literature Review Dashboard
Interest by Topic Area
Geography
51+papers & reports
identified
36Papers, Reports &
Press Releases
reviewed
0 10 20 30 40 50
Gasoline
Diesel
Biofuel
Natural Gas
Bio-Methane
Electricity
Hydrogen
Other
Po
we
rtra
in
Te
ch
no
log
yF
uel
36
Rest of World – 4 papers
154
The literature searches
prioritised recent papers
comparing HEV, PHEV
and BEV technology to
conventional ICEL
ife
Cyc
le S
tag
e
0
10
20
30
40
Vehicle /ComponentProduction
FuelProduction
(WTT)
Vehicle Use(TTW)
Maintenance &Servicing
End-of-Life Infrastructure
0 10 20 30 40 50
Small Car
Medium Car
Large Car
Source: Full list of literature provided to LowCVP in the LCA Literature Database (RD18-001155)

361 August 2018Q014686 RD18-001581-2Client Confidential - LowCVP© Ricardo plc 2018
Literature Review Results – Vehicle Life Cycle GHG Emissions
For Passenger Cars, OEM LCA studies suggest life cycle CO2e is
c.20-40 tonnes, depending on segment and lifetime mileage
Vehicle Description
Lifetime
Mileage
[km]
Total
Life Cycle
CO2e
[tCO2e]
Life Cycle [%]
SourceVehicle
Production
Fuel &
Electricity
Production
(WTT)
In-Use
(TTW)Disposal
BMW i3 BEV
(MY2014)
125 kW electric motor,
160 km EV range150,000 - 57% 40% 0% 3% #102
Renault Megane
(MY2016)
C-segment, 1.46L diesel
K9K engine, Euro 6150,000 20.5 26.3% 72% 1.7% #105
Mercedes-Benz
B180
1.6L I4 90 kW gasoline
engine, Euro 6160,000 29.8 18.5% 12.8% 67.1% 1.7% #093
Mercedes-Benz
B-Class EV
(MY2014)
132 kW electric
motor,28 kWh Li-ion
battery with 200 km EV
range
160,000 22.6 44.7% 52.7% 0% 2.7% #093
Mercedes-Benz
C180
(MY2015)
C-Class saloon with
1.6L I4 115 kW gasoline
engine, Euro 6
200,000 34.7 21.6% 10.7% 66.9% 0.9% #103
Mercedes-Benz
C-Class Plug-in
Hybrid
(MY2015)
C-Class saloon plug-in
hybrid with 2.0L I4
155 kW gasoline engine
and 60 kW electric
motor, Euro 6
200,000 27.4 36.9% 26.7% 35% 1.5% #103
Passenger Cars – Selected results from OEM literature
Sources: See LCA Literature Database - #102, #103, #093, #105
SELECTED EXAMPLES
Incre
asin
g v
eh
icle
siz
e
Lifetime mileage has a strong influence on total life cycle CO2e emissions

371 August 2018Q014686 RD18-001581-2Client Confidential - LowCVP© Ricardo plc 2018
• Further review of OEM and academic published
LCA studies on passenger cars shows a wide
range of values for total life cycle GHG emissions,
even if results are normalised to the same lifetime
mileage
– Reasons for variation include differences in
vehicle and powertrain specification, vehicle
energy consumption, electricity and fuel
carbon intensity, and study methodology
(e.g. credits for recycling)
• Generally, for most LCA studies and sensitivity
scenarios, passenger car BEV and hybrid life cycle
GHG emissions are lower than gasoline and diesel
ICE equivalent vehicles. However, there are a few
exceptions, usually related to sensitivity scenarios
with high electricity carbon intensity
– Since BEVs have higher embedded GHG
emissions, if the electricity carbon intensity is as
high as gasoline and diesel WTW emissions,
then the BEV will have higher life cycle GHG
emissions
Literature Review Results – Vehicle Life Cycle GHG Emissions
Recent academic LCA studies continue to show that overall life
cycle GHG emissions for BEVs are generally lower than for ICEs
Passenger Cars – Review of Total Life Cycle GHG Emissions
Source: Ricardo analysis of selected published LCA studies on passenger cars and light commercial vehicles (vans)
Outlier result from extreme scenario
with very high electricity carbon
intensity
Passenger Car life cycle GHG emissions results from c.20 published studies,
normalised to the same lifetime mileage (150,000 km)
SELECTED EXAMPLES
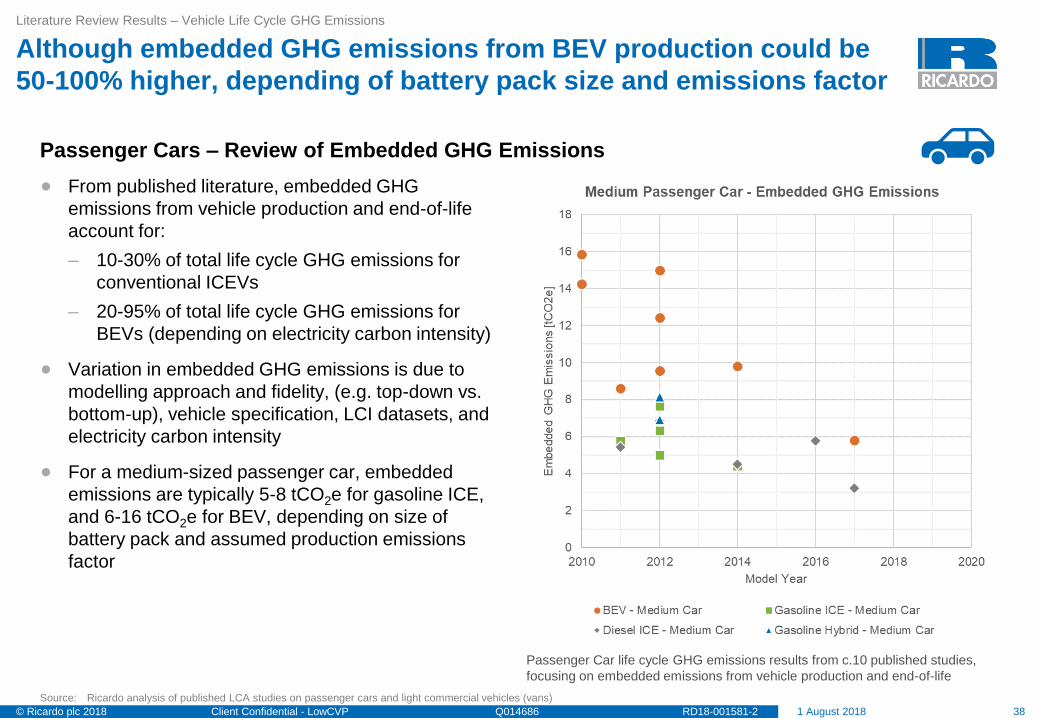
381 August 2018Q014686 RD18-001581-2Client Confidential - LowCVP© Ricardo plc 2018
• From published literature, embedded GHG
emissions from vehicle production and end-of-life
account for:
– 10-30% of total life cycle GHG emissions for
conventional ICEVs
– 20-95% of total life cycle GHG emissions for
BEVs (depending on electricity carbon intensity)
• Variation in embedded GHG emissions is due to
modelling approach and fidelity, (e.g. top-down vs.
bottom-up), vehicle specification, LCI datasets, and
electricity carbon intensity
• For a medium-sized passenger car, embedded
emissions are typically 5-8 tCO2e for gasoline ICE,
and 6-16 tCO2e for BEV, depending on size of
battery pack and assumed production emissions
factor
Literature Review Results – Vehicle Life Cycle GHG Emissions
Although embedded GHG emissions from BEV production could be
50-100% higher, depending of battery pack size and emissions factor
Passenger Cars – Review of Embedded GHG Emissions
Source: Ricardo analysis of published LCA studies on passenger cars and light commercial vehicles (vans)
Passenger Car life cycle GHG emissions results from c.10 published studies,
focusing on embedded emissions from vehicle production and end-of-life

391 August 2018Q014686 RD18-001581-2Client Confidential - LowCVP© Ricardo plc 2018
Conventional ICE
Mild HEV
Full HEV
PHEV
BEV
FCEV
Other
Literature Review Results – Vehicle Life Cycle GHG Emissions
Although >20 documents related to commercial trucks were
identified, only a few considered the whole vehicle life cycle
Commercial Trucks – Literature Review Dashboard
Interest by Topic Area
Geography
21+papers & reports
identified
8Papers, Reports &
Press Releases
reviewed
0 5 10 15 20
Gasoline
Diesel
Biofuel
Natural Gas
Bio-Methane
Electricity
Hydrogen
Other
Po
we
rtra
in
Te
ch
no
log
yF
uel
12
Rest of World – no papers
90
For trucks, most studies
considered conventional
diesel ICE, with some
comparing this to NG or
hybrid alternatives
Lif
e C
yc
le S
tag
e
0
5
10
15
20
Vehicle /ComponentProduction
FuelProduction
(WTT)
Vehicle Use(TTW)
Maintenance &Servicing
End-of-Life Infrastructure
0 10 20
Small Truck / Van
Medium Truck
Large Truck
Only a few studies considered
the whole life cycle
Source: Full list of literature provided to LowCVP in the LCA Literature Database (RD18-001155)
401 August 2018Q014686 RD18-001581-2Client Confidential - LowCVP© Ricardo plc 2018
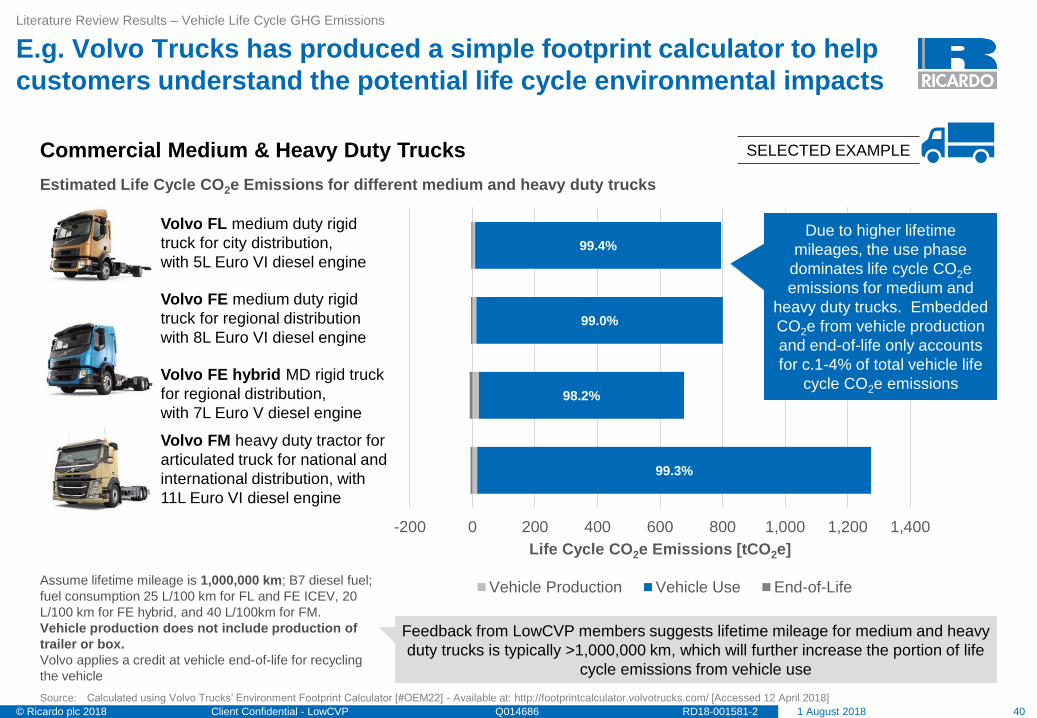
Literature Review Results – Vehicle Life Cycle GHG Emissions
E.g. Volvo Trucks has produced a simple footprint calculator to help
customers understand the potential life cycle environmental impacts
Volvo FM heavy duty tractor for
articulated truck for national and
international distribution, with
11L Euro VI diesel engine
Volvo FL medium duty rigid
truck for city distribution,
with 5L Euro VI diesel engine
Volvo FE medium duty rigid
truck for regional distribution
with 8L Euro VI diesel engine
Volvo FE hybrid MD rigid truck
for regional distribution,
with 7L Euro V diesel engine
Estimated Life Cycle CO2e Emissions for different medium and heavy duty trucks
Commercial Medium & Heavy Duty Trucks
Source: Calculated using Volvo Trucks’ Environment Footprint Calculator [#OEM22] - Available at: http://footprintcalculator.volvotrucks.com/ [Accessed 12 April 2018]
99.4%
99.0%
98.2%
99.3%
-200 0 200 400 600 800 1,000 1,200 1,400
Life Cycle CO2e Emissions [tCO2e]
Vehicle Production Vehicle Use End-of-LifeAssume lifetime mileage is 1,000,000 km; B7 diesel fuel;
fuel consumption 25 L/100 km for FL and FE ICEV, 20
L/100 km for FE hybrid, and 40 L/100km for FM.
Vehicle production does not include production of
trailer or box.
Volvo applies a credit at vehicle end-of-life for recycling
the vehicle
Due to higher lifetime
mileages, the use phase
dominates life cycle CO2e
emissions for medium and
heavy duty trucks. Embedded
CO2e from vehicle production
and end-of-life only accounts
for c.1-4% of total vehicle life
cycle CO2e emissions
SELECTED EXAMPLE
Feedback from LowCVP members suggests lifetime mileage for medium and heavy
duty trucks is typically >1,000,000 km, which will further increase the portion of life
cycle emissions from vehicle use

411 August 2018Q014686 RD18-001581-2Client Confidential - LowCVP© Ricardo plc 2018
Literature Review Results – Vehicle Life Cycle GHG Emissions
As for other vehicle types, hybridisation increases CO2e emissions
from truck production, with payback quickly achieved through use
Commercial Medium & Heavy Duty Trucks – Carbon Payback
Source: Ricardo analysis using data from Volvo Trucks’ Environment Footprint Calculator [#OEM22] - Available at: http://footprintcalculator.volvotrucks.com/ [Accessed 12 April 2018]
SELECTED EXAMPLE
0
20
40
60
80
100
120
-25,000 0 25,000 50,000 75,000 100,000
Cu
mu
lati
ve
CO
2e
[to
nn
es
]
Distance Travelled [km]
Volvo FE - Euro VI Volvo FE - Euro V Volvo FE Hybrid - Euro V
12,700 km
82,300 km
As for other vehicle types, the hybrid
powertrain has higher embedded CO2e
emissions than conventional technology.
“Payback” is achieved through reduced
in-use emissions due to fuel savings.
Ricardo analysis suggests c.12,700 km
payback for FE Hybrid compared to same
generation conventional FE (Euro V) and
c.62,100 km payback compared to
current generation FE (Euro VI)
The current generation FE (Euro VI) has significantly lower embedded CO2e emissions than the previous
generation (Euro V), suggesting Volvo has taken measures to reduce GHG emissions from vehicle production,
probably through design changes, material substitution, manufacturing improvements and decarbonising energy
Vehicle Production

421 August 2018Q014686 RD18-001581-2Client Confidential - LowCVP© Ricardo plc 2018
Conventional ICE
Mild HEV
Full HEV
PHEV
BEV
FCEV
Other
Literature Review Results – Vehicle Life Cycle GHG Emissions
For buses, 15 papers were identified during the literature search –
many comparing a range of technologies in a specific context
Urban Buses – Literature Review Dashboard
Interest by Topic Area
Geography
15papers & reports
identified
5Papers reviewed
0 2 4 6 8 10 12 14
Gasoline
Diesel
Biofuel
Natural Gas
Bio-Methane
Electricity
Hydrogen
Other
Po
we
rtra
in
Te
ch
no
log
yF
uel
6
Rest of World – no papers
63
For buses, LCA studies
considered a wider
range of technologies
and fuels, compared to
conventional diesel
Lif
e C
yc
le S
tag
e
0
5
10
15
Vehicle /ComponentProduction
FuelProduction
(WTT)
Vehicle Use(TTW)
Maintenance &Servicing
End-of-Life Infrastructure
As for trucks, only a few studies
considered the whole life cycle
Many of the studies considered buses
within a specific context, operating on
specific routes in cities or transport
corridors
Source: Full list of literature provided to LowCVP in the LCA Literature Database (RD18-001155)

431 August 2018Q014686 RD18-001581-2Client Confidential - LowCVP© Ricardo plc 2018
Literature Review Results – Vehicle Life Cycle GHG Emissions
For example, McCreadie (2016) considered the life cycle GHG
emissions from UK buses during his MSc Sustainability dissertation
13.7% 15.2% 29.0% 37.7%13.3% 29.5% 35.3% 32.8% 37.9%
1,650,708
1,303,132
810,048
806,080
1,473,090
707,427
455,574
612,025
736,153
-200000
0
200000
400000
600000
800000
1000000
1200000
1400000
1600000
1800000D
iese
l IC
E
Die
se
l H
ybrid
(4.8
kW
h)
Die
se
l P
HE
V(6
1 k
Wh)
BE
V (
345
kW
h)
Die
se
l IC
E
Die
se
l P
HE
V(3
8 k
Wh)
BE
V (
Op
tare
)(9
2 k
Wh)
BE
V (
Wrig
htb
us)
(15
0 k
Wh
)
BE
V (
BY
D)
(32
4 k
Wh)
Double Decker Bus Single Decker Bus
GH
G E
mis
sio
ns [kgC
O2
e]
Production WTW End-of-Life
Urban Buses – McCreadie (2016) SELECTED EXAMPLE
Source: Results from [#013] McCreadie, D. (2016). Life Cycle Analysis of Hybrid, Plug-in Hybrid, Full-Electric and Trolley Buses. University of Leeds, MSc Sustainability (Transport) Dissertation Thesis,
Project ID 187
Function unit based on hypothetical bus used
59,000 km/year over 15 years (the typical life
cycle for an urban bus in UK).
Production includes infrastructure changes (e.g.
recharging stations) as well as vehicle
production. Battery pack production assumed
to produce 172 kgCO2e/kWh, based on
Ellingsen (2013).
Electricity scenario starts at 2015 baseline, and
assumes 4% improvement each year
(218gCO2e/kWh by 2029).
See Dissertation Report for a full list of vehicle
specifications, assumptions and study
methodology
As for other commercial vehicles, life
cycle GHG emissions for buses are
dominated by the use (WTW) phase.
However, vehicle production for plug-in
vehicles is more significant due to
battery pack production, size of battery
pack, and assumed reductions in
electricity carbon intensity
Feedback from LowCVP members
confirmed that 50,000-80,000 km
annual mileage over 12-15 years is a
reasonable assumption for the
lifetime of UK buses

441 August 2018Q014686 RD18-001581-2Client Confidential - LowCVP© Ricardo plc 2018
Literature Review Results – Vehicle Life Cycle GHG Emissions
While Cox et al. (2017) considered current and future scenarios for
bus technologies in Europe
Source: Results from [#021] Brian Cox; Analy Castillo; Chris Mutel (2017). ENVIRONMENTAL ASSESSMENT OF CURRENT AND FUTURE URBAN BUSES WITH DIFFERENT ENERGY SOURCES.
(The 30th International Electric Vehicle Symposium & Exhibition (EVS 30), Stuttgart, Germany, Oct 2017, Paper - 8pp, Slides - 23pp.)
SELECTED EXAMPLEUrban Buses – Cox et al. (2017)
Function unit based on hypothetical 12m
bus used over 12 years, travelling
750,000 km during lifetime. All buses
meet Euro VI emission standards.
ICEV-D and CNG have 230 kW engines.
HEV has 185 kW diesel engine, with two
75 kW electric motors and 150 kW Li-ion
battery pack.
FCEV has 150 kW PEM fuel cell system,
8 kWh Li-ion battery, two 75 kW electric
motors and Type 3 H2 tanks.
BEV-SR has 12 km EV range, with
regular recharging at bus stops
BEV-LR has 200 km EV range, with
once-a-day recharging.
LCI data for battery pack taken from
EcoInvent. Two scenarios for reduced
embedded impact considered for 2035.
Duty cycle based on World Harmonised
Vehicle Cycle (WHVC) for heavy duty
vehicles.
Electricity carbon intensity taken from
EcoInvent, based on natural gas
combined cycle plants and onshore wind
from Germany.
Hydrogen produced from electricity via
electrolysis or steam reforming of
methane. Hydrogen WTT values taken
from Simons and Bauer (2011)
Most life cycle GHG
emissions result from
vehicle use and fuel
production
High WTT due to
assumed Steam
Methane Reforming
(SMR) pathway for
hydrogen
Prospective LCA shows potential to reduce life cycle GHG
emissions through predicted vehicle efficiency improvements,
and decarbonisation of fuel and energy pathways through
greater use of renewables

451 August 2018Q014686 RD18-001581-2Client Confidential - LowCVP© Ricardo plc 2018
Literature Review Results – Vehicle Life Cycle GHG Emissions
Battery production has a strong influence on PIV LCA results –
however values used in published studies show wide variation
Li-ion Battery Pack Cradle-to-Gate GHG Emissions
Source: Ricardo analysis of published LCA studies
Cradle-to-gate GHG emission from Li-ion battery production should
be compared on per kWh and per kg basis, since studies have
different assumptions regarding battery specific energy [kWh/kg]
The charts above display embedded carbon intensity factors for Li-ion battery
production (cradle-to-gate) from c.20 key papers published since 2010. The
grey shading between the grey dashed lines represents a range of values
used by Ricardo in a previous 2012 paper (Patterson et al, 2012 [#089])
Hao et al. (2017)
Ellingsen et al. (2014)
There is some evidence in
literature that the embedded CO2e
emissions factors for Li-ion battery
production are reducing as the
technology improves, and better
data becomes available. However,
further research, based on state-
of-the-art battery technology and
manufacturing processes, is still
required to deepen understanding,
given the sensitivity of battery
embedded factors of life cycle
GHG emissions results for plug-in
vehicles

461 August 2018Q014686 RD18-001581-2Client Confidential - LowCVP© Ricardo plc 2018
Literature Review Results – Vehicle Life Cycle GHG Emissions
Carbon intensity of electricity is another key factor – according to UK
government statistics, UK electricity is now ~300 gCO2e/kWh (WTT)
UK Electricity Carbon Intensity
0
100
200
300
400
500
600
2004 2006 2008 2010 2012 2014 2016 2018
Glo
ba
l W
arm
ing P
ote
ntia
l [g
CO
2e
/kW
h]
Year
Carbon Intensity of UK Electricity Consumed
The Global Warming Potential of UK
electricity has reduced significantly in the
last 5 years
Source: 2017 Government GHG Conversion Factors for Company Reporting, Appendix 2, Table 48; 2018 Government GHG Conversion Factors for Company Reporting, Appendix 2, Table 48
In the previous 2011 study, Ricardo
assumed UK electricity carbon
intensity was 500 gCO2/kWh
Reductions in electricity carbon
intensity benefits the fuel production
phase (WTT) for plug-in vehicles,
and vehicle production for all vehicle
and powertrain types

471 August 2018Q014686 RD18-001581-2Client Confidential - LowCVP© Ricardo plc 2018
• Introduction
• What is LCA?
• Study Methodology – Literature Review
• Framework – Guide to interpreting LCA Literature
• Literature Review Results – Vehicle Life Cycle GHG Emissions
• Conclusions
• Recommendations for Future Work
Contents

481 August 2018Q014686 RD18-001581-2Client Confidential - LowCVP© Ricardo plc 2018
Conclusions
To conclude, the relative contribution of each vehicle life cycle stage
is highly dependent on the vehicle type and powertrain technology
Results Summary – Relative Contributions of each Life Cycle Stage by Vehicle Type and
Powertrain Technology
Vehicle Type
Conventional ICE Powertrain Technology BEV Powertrain Technology
Vehicle
ProductionWTT TTW EoL
Vehicle
ProductionWTT TTW EoL
L-Category c.10-30% c.10-15% c.60-75% <5% c.45-75% c.25-55% - <5%
Passenger Car c.15-30% c.10-15% c.60-70% <3% c.20-60% c.40-60% - <3%
Heavy Duty
Truckc.1-3% >95% <1%
Bus c.15% >80% <5% c.30-40% c.60-70% - <5%
Source: Review of published LCA literature, provided to LowCVP in LCA Literature Database (RD18-001155)
Carbon intensity for electricity could be nearly
zero if renewable, sustainable electricity is
used in the vehicle. This should shift all life
cycle environmental burdens to vehicle
production and end-of-life
The relative contribution of embedded
emissions (from vehicle production and
EoL) to in-use (WTW) is highly
dependent on the vehicle type, lifetime
mileage and duty cycle
The contribution of End-of-Life
is difficult to quantify since most
studies assume high recycle
rates, and some apply “credits”
for producing recycled material.
However, the general
consensus is that the portion to
overall life cycle emissions is
relatively low (<5%)

491 August 2018Q014686 RD18-001581-2Client Confidential - LowCVP© Ricardo plc 2018
• Life Cycle Assessment (LCA) is about taking a holistic approach to the analysis of a product’s environmental
impact. LCA can be used to support decision making (micro and macro level), or to support environmental
accounting and reporting
• This study has focused on providing insight into how life cycle CO2e emissions vary by vehicle segment and
powertrain technology, considering L-category vehicles, passenger cars, heavy duty trucks and buses across
four life cycle stages – vehicle production, fuel production, vehicle use and vehicle end-of-life
– Insights have been drawn from published literature, prioritising recently published papers, with additional input
from LowCVP members
• As shown in the previous slide, the relative contribution of each vehicle life cycle stage is highly dependent on
the vehicle type, powertrain technology and key input parameters, such as assumptions regarding vehicle
lifetime mileage and duty cycle. Electricity carbon intensity is also a key factor
– For larger, heavy duty trucks, life cycle CO2e emissions are overwhelmingly from vehicle use (>95%), which
is unsurprising given the high utilisation and lifetime mileages of these types of vehicles
– For smaller vehicles, such as passenger cars and L-category vehicles, there is greater sensitivity in each life
cycle stage. Vehicle production does contribute to life cycle CO2e emissions, and may be the dominant life
cycle stage for BEV technology used with low carbon electricity
• LCA has an important role to play, along with other types of analysis, to inform discussions on the wider
implications of adopting low and zero emissions technologies in road transport. Although, as discussed in the
next section, on-going research is required to ensure up-to-date, quality LCA information is available on current
products suitable for the UK market
Conclusions
Therefore, LCA is particularly important for holistic understanding of
the environmental impact of L-category, passenger cars and buses
Conclusions

501 August 2018Q014686 RD18-001581-2Client Confidential - LowCVP© Ricardo plc 2018
• Introduction
• What is LCA?
• Study Methodology – Literature Review
• Framework – Guide to interpreting LCA Literature
• Literature Review Results – Vehicle Life Cycle GHG Emissions
• Conclusions
• Recommendations for Future Work
Contents

511 August 2018Q014686 RD18-001581-2Client Confidential - LowCVP© Ricardo plc 2018
Recommendations (1/4)
Recommendations for Future Work
UK strategic decision makers would benefit from future LCA studies
that focus on vehicles available and used in UK
UK Context
Although Life Cycle Assessment is unable to answer every question related
to the wider implications of adopting low emission vehicle technology, it
does have a critical role to play in strategic decision making by providing
holistic insight into life cycle environmental impacts
Given the pace of technology change in the automotive sector, UK strategic
decision makers would benefit from LCA studies that focus on current
European vehicle specifications, with appropriate duty cycles and model
inputs representing use in the UK
Alternative Fuels
The next LowCVP LCA study should consider the life cycle impacts
associated with using alternative fuels, such as natural gas, biofuels and
hydrogen
– This is likely to be particularly significant for medium and heavy duty
trucks, and buses
Also, alternative fuel Well-to-Tank pathways and associated emission
factors should be developed that are appropriate to the production and use
of alternative fuels in UK

521 August 2018Q014686 RD18-001581-2Client Confidential - LowCVP© Ricardo plc 2018
Recommendations (2/4)
Recommendations for Future Work
Better Life Cycle Inventory data is urgently needed for key
components and materials, such as Li-ion battery pack
Life Cycle
Inventories
Li-ion Battery
Packs
Given the sensitivity of plug-in vehicle LCA studies to embedded emissions
from battery production, and given that many academic studies are based
on old data (>5 years), a detailed cradle-to-gate LCA study of current state-
of-the-art Li-ion battery technology and manufacturing processes is urgently
required to improve the reliability of vehicle LCA studies and Life Cycle
Inventories
Cradle-to-gate emissions for other electric vehicle components, such as the
electric motor, power electronics, onboard charger, should also be
considered
All LCA studies make use of Life Cycle Inventory datasets on the
environmental impacts of common materials and processes
The selected LCI datasets strongly influence the LCA results
A future study reviewing available Life Cycle Inventories for automotive
materials and production processes would be useful for understanding the
current state-of-the-art of LCI data availability, and for highlighting areas
requiring improvement

531 August 2018Q014686 RD18-001581-2Client Confidential - LowCVP© Ricardo plc 2018
Recommendations (3/4)
Recommendations for Future Work
Continued research on LCA of L-category vehicles and passenger
cars is critical for informing the transition to zero emission transport
L-Category
Vehicles
L-category vehicles may offer an opportunity to reduce life cycle
environmental impact compared to passenger cars. However, to date,
relatively few LCA studies have been conducted on L-category vehicles
Further LCA studies on L-category vehicles, including Kei-size* / sub-A
segment cars, would help to quantify the environmental opportunity, and to
deepen understanding on the life cycle implications of switching to
alternative technologies such as BEV
Passenger Cars
Passenger cars represent a very important, high volume vehicle segment for
the transition to low / zero emission transport
LCA results for passenger cars are sensitive to multiple factors, such as
lifetime mileage, vehicle specification, fuel economy and energy vector for
in-use
Therefore, it is critical to maintain up-to-date LCA research based on current
products with a strong market context (e.g. UK specific)
* Kei-car is the Japanese vehicle category for smallest, most limited power, road-legal vehicle. Vehicle length
and width are below 3.4 m and 1.48 m. Engine capacity is <660 cc. Maximum power is 47 kW

541 August 2018Q014686 RD18-001581-2Client Confidential - LowCVP© Ricardo plc 2018
Recommendations (4/4)
Recommendations for Future Work
Although LCA is less important for HD trucks, it could influence
strategic decisions regarding choices for LD & MD trucks and buses
Heavy Duty
Commercial
Trucks
Since the vehicle use phase (WTW) contributes >95% of life cycle GHG
emissions for heavy duty commercial trucks, opportunities to decarbonise
fuel will have the greatest life cycle impact
Although the relative contribution of embedded CO2e emissions from vehicle
production is less significant, it would be worth investigating the “payback
period” for low emission technologies and fuels. This would inform strategic
decisions, and encourage OEMs to continue improving the eco-design and
manufacturing of their commercial vehicles
Light & Medium
Duty Commercial
Vans & Trucks
Life cycle environmental impacts may be more significant for light duty vans
and medium duty trucks used in urban and regional delivery
Therefore, life cycle impacts should not be excluded from strategic decision
making
Buses
Changing to plug-in vehicle technologies has the potential to significantly
reduce environmental impacts from buses. However, embedded emissions
from production and end-of-life are likely to be higher
LCA, along with other tools, should be used to inform decision making
– LCA models should be tailored to the specific context of bus operation to
ensure appropriate comparison