understanding the impact of mobile technologies
DESCRIPTION
Understanding the Impact of Mobile TechnologiesTRANSCRIPT

Nomads at Last? Understanding the Impact of Mobile Technologies
on Human Spatial Behavioron Human Spatial Behavior
Ecar Symposium 2010 Filippo Dal FioreCo Head Partners Relations and Technology Transfer MIT Senseable city lab: ::Co-Head, Partners Relations and Technology Transfer, MIT Senseable city lab:..::Director and Co-Founder, Currentcity Foundation

Structure of the presentation
• PART 1:WHO WE ARE AND WHERE WE COME FROM
• PART 2THE ISSUE: DIGITAL NOMADISM
• PART 3RESEARCH FINDINGS

WHO WE ARE:The Senseable City Lab at M.I.T.

a new type of planning? yp p gpeople + space + technology
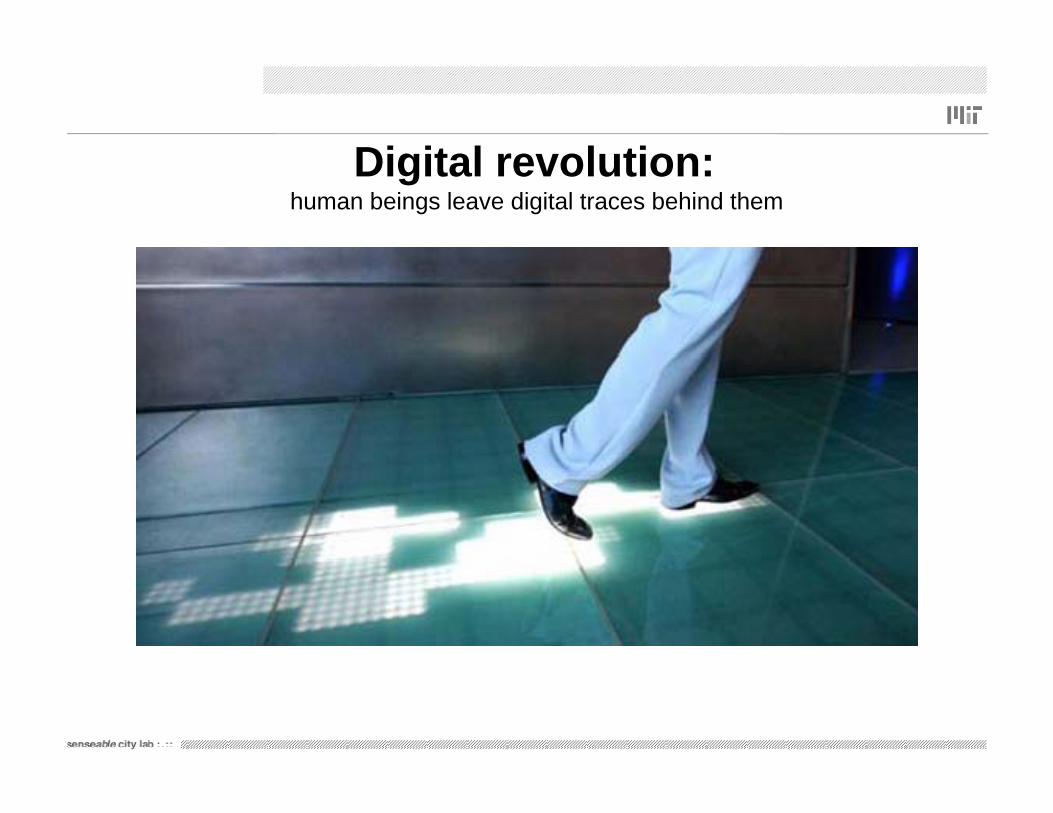
Di it l l tiDigital revolution: human beings leave digital traces behind them

New observational frontiers: on the communication behaviour of human beings (-- mobile phones --)

New observational frontiers on the communication behaviour of human beings (-- internet --)

New observational frontiers: on the photographic behaviour of human beings (-- Flickr --)

N b ti l f tiNew observational frontiers on the internet/work behaviour of human beings (-- WiFi --)

…more on Wi-Fi mapping

N b ti l f tiNew observational frontiers: on the mobility behaviour of human beings (-- GPS, cameras, sensors --)

Digital Technology and Social Science Research: a two-fold relationship
How can technology support usHow does technology make us changeour behavior?
How can technology support us in understanding how our behavior has changed?
NEW RESEARCH QUESTIONS NEW RESEARCH TECNIQUES

THE ISSUE:Digital Nomadism

Digital nomadism is driven by different rationales
doing businesscoordinatingplanning
working being more efficient experiencing

Digital nomadism is enabled by different technologies

Digital nomadism affects different types of workers in different ways
Source: IDC

Digital nomadism affects our university campuses

THE RESEARCH FINDINGS:THE RESEARCH FINDINGS:How does ubiquitous
connectivity affect our daily mobility?mobility?

The iterative process of empirical research
Ask a newCircumscribe Ask a new question
Circumscribe an issue
Collect and
interpret the data

WHY CARING?
REAL WORLD EVIDENCE
ACADEMIC VALUE
BUSINESS COMMUNITY

RESEARCH PROCESS - (1) Sampling subjects

RESEARCH PROCESS - (2) Assessing hi-tech solutions for data collection
Wi-Fi Location Tag
Wi-Fi Log-files
Wi-Fi Sniffing SW

RESEARCH PROCESS - (3) Customizing hi-tech solutions for dataRESEARCH PROCESS - (3) Customizing hi-tech solutions for data collection

RESEARCH PROCESS - (4) Collecting the data

RESEARCH PROCESS - (5) Generating hypotheses
Increasing efficiency inthe mobility behaviour:circular trips instead of
d ddependency on onecentral workplace
Increasing number of locations due to increased efficiency and information

Laptop Users
(N=38)
Occasional Users
(N=31)
Non-users
(N=29)
Male (%) 47 39 55
RESEARCH PROCESS - (6) Querying the data
Age (ave.) 26.2 (SD 3.32) 23.4 (SD 4.37) 23.2 (SD 4.17)
Years spent at MIT (ave.) 2.9 (SD 2.13) 2.8 (SD 1.49) 3.2 (SD 2.13)
Graduate (%) 82 53 57
PhDs (%) 45 25 37
S.Engineering (%) 45 40 54
Business School (%) 18 8 0Business School (%) 18 8 0
S.Humanities (%) 11 16 12
S.Architecture (%) 3 4 12
S.Science (%) 24 32 23
Living on campus (%) 47 55 48
Ave n° of trips per day Confidence interval, 95%
Laptop Users (188 data points) 6.23 +/-0.32
Occasional Users (155 dp) 5.75 +/-0.41
Non users (143 dp) 5 57 +/ 0 45
Differences between clusters and within cluster 2in terms of number of trips per day
Non-users (143 dp) 5.57 +/-0.45
Occasional Users when with Laptop (83 dp) 6.39 +/-0.43
Occasional Users when w/o laptop (72 dp) 5.03 +/-0.68
All With laptop (271 dp) 6.28 +/-0.26
All Without laptop (215 dp) 5.39 +/-0.38

Spatial behaviour of the 3 clusters (% f th ll ti t i diff t f ti l l ti )
RESEARCH FINDINGS - (1) Descriptive statistics
(% of the overall time spent in different functional locations)
44.4 45.1
40.0
45.0
50.0
27.5
34.3
17 520 0
25.0
30.0
35.0
of ti
me
spen
t
16.514.0
1.4
4.4
1 21 33.6
13.3
5.4
2.2 3.1
8.0
2.02.7 1.94.0
8.6
3.41 3
12.1
17.5
1 1
5.5
0 8
5.1
8.0
5.0
10.0
15.0
20.0
% o
1.21.31.3 1.1 0.80.0
Class
Librar
yCom
puter
Lab
Office/L
abStud
ent C
enter
Meetin
g Roo
m/Loun
geLu
nchro
om/C
afé
Home
Off-Cam
pus
Other
Laptop Users (188 dp)
Me
Functional locationOccasional Users (155 dp)Non users (143 dp)

SPATIAL BEHAVIOUR WITH AND WITHOUT LAPTOP (SG2 spread)
RESEARCH FINDINGS - (1) Descriptive statistics
40
45
50
Without LaptopWith Laptop
25
30
35
Allocation of time during the 5 workdays (%)
10
15
20
workdays (%)
0
5
10
CLA LIB COMP OFF STU MEET CAFE HOME OFF-C OTHERFunctional locationFunctional location

RESEARCH FINDINGS - (1) Descriptive statistics
Use of Wi-Fi, via the laptop, in different functional locations (sub-dataset: 271 data points). T f f ti l l ti Cl (1) Lib (2) C t R (3) Offi /L b (4) St d t C t (5)Types of functional locations: Classes (1), Library (2), Computer Room (3), Office/Lab (4), Student Centre (5),
Meeting Room (6), Café/Lunch Room (7), Home (8), Off-Campus (9), Other (10)

Age
Regression 1Regression 1Regression 2Regression 2
RESEARCH FINDINGS - (2) Inferential statistics
Male
Graduate
Engineering
LaptopToday
Age
LiveinCam
Motorized
Geographical Condition
Dependent Variable: Number of trips per day
Predictor Coefficient Significance (t value)
(Constant) 5.343 4.801
LapToday .217 4.647
RentN°Trips
YearsMIT
Motorized
EmailsRDigital
Activeness
CommOffice
Cellph
Age -.109 -1.659
Male -.094 -2.069
Graduate -.109 -1.364
YearMIT -.041 -.630
Rent -.054 -1.042
Office 085 1 253
Face2face
N°Classes
N°Projects
Equipm
Local activeness
Office .085 1.253
LiveonCampus -.161 -3.043
Car -.074 -1.460
EmailsRec -.038 -.757
EmailsSent .068 1.373
FrequentCellPhone .008 .165
S CEquipm
A few independent variables stand out as statistically significant predictors of a subject’s travel behaviour (t>|2|): most importantly laptop use (+), but also the
SenseComm .280 5.273
N°classes .186 2.327
N°projects .086 1.729
N°face2face -.070 -1.229
equip .079 1.403
Summary statistics
subject’s sense of belonging (+) to the MIT community, living on campus (-), number of classes (+) taken in the semester and sex (+).
Number 479
R Square .167
Adjusted R Square .137

Second Case Study: The Dutch Police


Rogers’ innovation diffusion theory (1995) according to which five major
This is how we interpreted findings (1)
Rogers’ innovation diffusion theory (1995), according to which five major characteristics of a technology determine its acceptance:
- relative advantage over available tools
- compatibility, i.e. consistency with existing social practices and norms among users
- complexity, i.e. its ease of use or learning
- trialability (i e the opportunity to try thetrialability (i.e. the opportunity to try the technology before committing to using it)
- observability, i.e. the extent to which the y,benefits of the technology are plain to see

G i t th l f i di id l f t i t h l t
This is how we interpreted findings (2)
Going on to the role of individual factors in technology acceptance, a few characteristics considered by Alavi and Joachimsthaler (1992)
may have played a crucial part in our case. In particular,
- cognitive styles (cognitive problems experienced while accessing information through the PDA)
- user-situational variablesThe elements of the environmental and social contexts of usage described by Lee et al (2005), i.e. location, distraction, crowding, interaction, privacy.
