understanding the factors that may produce a sustained
TRANSCRIPT
econstorMake Your Publications Visible.
A Service of
zbwLeibniz-InformationszentrumWirtschaftLeibniz Information Centrefor Economics
Sun, Xiuli; Li, Haizheng; Ghosal, Vivek
Working Paper
Firm-level Human Capital and Innovation: Evidencefrom China
CESifo Working Paper, No. 6370
Provided in Cooperation with:Ifo Institute – Leibniz Institute for Economic Research at the University of Munich
Suggested Citation: Sun, Xiuli; Li, Haizheng; Ghosal, Vivek (2017) : Firm-level Human Capitaland Innovation: Evidence from China, CESifo Working Paper, No. 6370, Center for EconomicStudies and ifo Institute (CESifo), Munich
This Version is available at:http://hdl.handle.net/10419/155612
Standard-Nutzungsbedingungen:
Die Dokumente auf EconStor dürfen zu eigenen wissenschaftlichenZwecken und zum Privatgebrauch gespeichert und kopiert werden.
Sie dürfen die Dokumente nicht für öffentliche oder kommerzielleZwecke vervielfältigen, öffentlich ausstellen, öffentlich zugänglichmachen, vertreiben oder anderweitig nutzen.
Sofern die Verfasser die Dokumente unter Open-Content-Lizenzen(insbesondere CC-Lizenzen) zur Verfügung gestellt haben sollten,gelten abweichend von diesen Nutzungsbedingungen die in der dortgenannten Lizenz gewährten Nutzungsrechte.
Terms of use:
Documents in EconStor may be saved and copied for yourpersonal and scholarly purposes.
You are not to copy documents for public or commercialpurposes, to exhibit the documents publicly, to make thempublicly available on the internet, or to distribute or otherwiseuse the documents in public.
If the documents have been made available under an OpenContent Licence (especially Creative Commons Licences), youmay exercise further usage rights as specified in the indicatedlicence.
www.econstor.eu

Firm-level Human Capital and Innovation: Evidence from China
Xiuli Sun Haizheng Li
Vivek Ghosal
CESIFO WORKING PAPER NO. 6370 CATEGORY 4: LABOUR MARKETS
FEBRUARY 2017
An electronic version of the paper may be downloaded • from the SSRN website: www.SSRN.com • from the RePEc website: www.RePEc.org
• from the CESifo website: Twww.CESifo-group.org/wp T
ISSN 2364-1428

CESifo Working Paper No. 6370
Firm-level Human Capital and Innovation: Evidence from China
Abstract
Understanding the factors that may produce a sustained rate of innovation is important for promoting economic development and growth. In this paper, we examine the role of human capital in firms’ innovation by using a large sample of manufacturing firms from China. We use two firm-level datasets from China: one from metropolitan cities, and one from provincial small and medium sized cities. Patent applications are used as the measure of innovation. Human capital indicators used include skilled human capital (number of highly educated workers), general manager’s education and tenure, and management team’s education and age. We find that skilled human capital has a significant positive effect on firms’ innovation, while the management team’s age has a significant negative effect on innovation. The General Manager’s tenure plays a significant positive role in firm innovation in metropolitan cities, while it is the General Manager’s education that has a positive and significant effect on firms’ innovation in small and middle cities. We also find that the effect of R&D on patents is insignificant for firms in large cities, but it is positive and significant in the smaller and medium sized cities. We conclude by noting some policy issues for promoting innovation in developing economies.
JEL-Codes: J240, I250, D210, D220, L130, O320, O330.
Keywords: human capital, education, innovation, patents, R&D, economic development, Asia, China.
Xiuli Sun School of Statistics, Southwestern
University of Finance and Economics 555 Liutai Avenue, Wenjiang District
P.R. China – Chengdu, Sichuan, 611130 [email protected]
Haizheng Li School of Economics
Georgia Institute of Technology USA – Atlanta, GA 30332
Vivek Ghosal*
Department of Economics Rensselaer Polytechnic Institute
USA – Troy NY 12309 [email protected]
*corresponding author February 2017 We thank Patrick S. McCarthy, Shatakshee Dhongde, Xiaoming Huo, Gene Chang and participants at various conferences for helpful comments. Partial financial support is from the National Natural Science Foundation of China (Grant #71273288) and the Fundamental Research Funds for the Central University (#JBK150501).
1
I. Introduction
Economists have long examined the determinants of firms’ innovation because characteristics
of innovative firms can have significant implications not only for firms’ success, but also for
the economic development and growth of a country. As greater innovation increases the
future scientific and technological resources of a country, and improves the standards of
living, identifying the key factors that foster innovation is important.
The literature on the Schumpeterian hypotheses (e.g., Audretsch and Acs, 1991)
argues that larger firms operating in concentrated markets are the main engine of
technological progress. This literature has offered numerous insights as to how firm size and
market structure affect firm innovation. Nonetheless, there is no consensus on the effects of
firm size and market structure on firm innovation (e.g., Symeonidis, 1996). In contrast to
much of the economics literature, the management literature has focused on internal factors
and examined firm innovation capability using the theory of knowledge (Tamer et al., 2003;
Lin, 2007). In those studies, one of the challenges is how to measure important variables
involved, such as the extent of tacit knowledge transfer. A common practice is to use
questionnaires and ask related employees in a firm to answer it. It is not hard to understand
that complex issues arise in the design of questionnaires and the subjectiveness of the
answers, not to mention that the conclusions from those studies can be very specific and hard
to generalize in other contexts.
Traditionally, the most important factor explaining innovation has been R&D
spending.5 More specifically, the focus has been on the productivity of R&D, and thus didn’t
take non-R&D innovation factors into account, which is often an important composition of
firm innovation, especially in developing countries. There are three types of creative
5 E.g., Hall, Griliches and Hausman (1986) and Hall and Ziedonis (2001).
2
activities that do not require R&D. First, Kim and Nelson (2000) found that imitative
activities, including reverse engineering, often require very little R&D, and the imitation is
mainly dependent on the firm’s technical personnel and engineers. Second, firms can make
incremental changes to products and processes, relying on engineering human capital.
Moreover, Hansen and Serin (1997) note that the innovation process in low-and medium-
technology sectors is more related to adaptation and learning-by-doing, based on design and
process optimization, rather than from R&D.6 Third, firms can combine existing knowledge
in new ways, for example in industrial design and engineering projects (Grimpe and Sofka,
2009). Due to the large share of firms that innovate without much R&D, one can conclude
that studies that only focus on R&D may not provide a full picture of differences in
innovation across firms.
Various studies have examined the effects of external factors on firm innovation. For
example, Audretsch and Feldman (2004) noted that location and geography are important in
explaining the determinants of innovation, and they identified knowledge spillovers as the
main mechanism. Besides, innovation behavior of other firms in the same area, qualified
local labor, R&D facilities, local market development, technological progress, and
technology and innovation policy can contribute to firms’ innovation.
In this paper we explore firm-level innovation from a human capital point of view
using a large sample of Chinese manufacturing firms. We consider two types of firm-level
human capital: skilled human capital, and managerial human capital. In the empirical study,
we use two firm-level datasets from China, one from metropolitan cities and one from
provincial middle cities. There are several reasons why examining this relationship for
Chinese manufacturing firms is important. First, according to OECD, China was the second
6 Also see Ghosal and Nair-Reichert (2009) and Ghosal (2015).
3
largest R&D spender in 2014 and is forecast to overtake the United States in R&D by 2019.
However, despite success in some areas, notably high-speed rail, solar energy,
supercomputing and space explorations, China is still far from an innovative country.
Second, manufacturing plays an important role in China’s rapid economic growth and it has
contributed more than 40 percent of China’s gross domestic product (GDP). Third, in a
developing country like China, most sectors are low-and medium-technology sectors and thus
innovation is more related to adaptation and learning-by-doing, based on design and process
optimization, rather than from R&D. Thus, China provides a good context to examine the
effect of human capital’s effect on innovation.
We use patent applications as our measure of innovation. We find that a firm’s skilled
human capital has a statistically significant positive effect on innovation while the
management team’s age has a significantly negative effect on innovation. General Manager’s
tenure plays a significantly positive role in firm innovation in metropolitan cities, while it is
the General Manager’s education that plays a positive and significant effect on firm
innovation in small and middle cities. The effect of R&D on patents is insignificant in large
metropolitan cities, while it is positive and significant in provincial middle cities.
This paper makes two main contributions. First, we study firm innovation from a
human capital view: not only skilled human capital but also managerial human capital and
R&D human capital. While at the macro level human capital has been recognized as an
important determinant of innovation in endogenous growth theory (e.g., Romer, 1990), there
is somewhat less analysis at the firm level even though human capital has been argued as a
critical resource in a firm (Pfeffer, 1995). The studies that have considered human capital as a
determinant of firm innovation mostly focus on managerial human capital without
considering skilled human capital as human capital base of a firm and external factors, e.g.,
firm size and market structure (e.g., McGuirk et al., 2015; Lin et al., 2011). Second, two
4
datasets from two different levels of cities, metropolitan cities and provincial middle cities,
enable us to examine the effect of external factors on firm innovation. We empirically show
that internal factors such as R&D, skilled human capital, managerial human capital, and other
firm characteristics, may have different effect on firm innovation if firms are located in
different market environments. Previous studies have typically not been able to examine the
moderating effect of external factors on the effects of those factors on firm innovation
possibly because of data limitations.
The paper is organized as follows. Section II presents empirical specification and
estimation. In Section III we introduce the data. Section IV presents basic results. Section V
presents further investigation. Section VI concludes.
II. Empirical Specification and Estimation
A. Specifications and variables
Among all the resources in a firm, human capital has long been viewed as critical
(Bates, 1990; Pfeffer, 1995; Hitt et al., 2001; Colombo and Grilli, 2005). In this study, we
consider two broad aspects of firm-level human capital: skilled human capital; and
managerial human capital.
The effect of firms’ skilled human capital on innovation can operate via two
channels. First, skilled human capital means greater ability of learning-by-doing and can
improve a firm's innovation ability. Second, skilled human capital and a firm's R&D together
affect the firm’s innovation, a complementary relationship modeled by Romer (1990).7
In contrast, managerial human capital is embodied in CEOs, top management team,
and managers in general. Upper echelon theory (e.g., Hambrick and Mason, 1984) argued
7 There’s also a probability of “knowledge spillover” channel: when there’s more skilled human capital in a firm, there will be more internalization of outside R&D spillover or knowledge spillover into the firm.
5
that organizations are just reflections of their top managers, because the top management
team has the task of formulating and implementing the firm’s strategy. Moreover, top
executives have the discretion to control, monitor and adjust R&D expenditure.
To arrive at an estimating equation, we model the role of human capital in firm
innovation by augmenting the patent production function, which is widely used in firm
innovation studies (e.g., Hall and Ziedonis, 2001; Hu and Jefferson, 2009). We specify the
augmented patent production function as:
𝐸(𝑌𝑖) = exp(𝑋𝑖′𝛽𝑋 + 𝐻𝑖
′𝛽𝐻) (1)
where 𝑌𝑖 is the count of patents of firm 𝑖, the vector 𝑋𝑖 stands for traditional explanatory
variables in patent production function, including R&D expenditures, firm size, market share,
firm characteristics that are related to knowledge production and propensity to patent, city
fixed effects and industry effects. 𝐻𝑖 is the human capital vector, including skilled human
capital measure, and managerial human capital characteristics (e.g., GM’s education, tenure,
management team’s average education, and age).
Compared to traditional patent production function, our human capital-augmented
patent product function has at least three advantages. First, it can take into account the non-
R&D or informal knowledge production, e.g., learning by doing, which is especially
important for firms in developing countries where small and medium enterprises (SMEs)
often dominate. Second, as studied in Sterlacchini (1999), R&D only accounted for a fraction
of total innovation costs and the activities of design, engineering and pre-production
developments were all important sources of innovation. Given the importance of human
capital in those activities, it is not hard to conclude the importance of human capital’s
complementary role in innovation. Thus, studies without consideration of human capital
might bias the knowledge production ability of R&D. Third, managers are one of the most

6
important sources of the firm heterogeneity. Some of these issues can be better addressed by
including human capital indicators in the specification.
For equation (1), we can take log for both sides and specify all factors as:
log (𝑝𝑎𝑡𝑖) = 𝛽0 + 𝛽1𝐻𝐶𝑖 + 𝛽2 log(𝑅𝐷𝑖) + 𝛽3𝑆𝑍𝑖 + 𝛽4𝑀𝐾𝑇𝑆𝐻𝑅𝑖 + 𝛽5𝑊𝑖 + 𝑢𝑖 , (2),
where 𝑝𝑎𝑡𝑖 is the number of patents applied, 𝐻𝐶𝑖 is human capital indicators, 𝑅𝐷𝑖 is R&D
expenditure, 𝑆𝑍𝑖 is firm size, 𝑀𝐾𝑇𝑆𝐻𝑅𝑖 is market share, 𝑊𝑖 stands for control variables, such
as industry and city fixed effect, and 𝑢𝑖 is a disturbance term for firm 𝑖 = 1,2, … , 𝑛.
We use the number of patent applications because it reflects more accurately the
timing of a firm’s R&D behavior.8 Skilled human capital, GM’s tenure and education, and
the average age and education of management team are used as the indicators of managerial
human capital. We use number of highly educated workers (by their education levels) to
measure a firm’s skilled human capital.
Regarding R&D spending by the firm, much of the early work used lag structure of
R&D affects patents (Pakes and Griliches, 1980). Some of the literature uses only
contemporaneous level of R&D (Hall and Ziedonis, 2001). R&D expenditure is a long-term
investment and takes time to have impact (Barker and Mueller, 2002).9 Moreover,
contemporaneous R&D is likely to be endogenous, due to the possible correlation between
unobserved innovation productivity shocks and R&D level. However, the lag structure is
generally difficult to identify because of the high within-firm correlation of R&D expenditure
over time. Therefore, we use the average R&D over past years, excluding current R&D.10
8 In the data, we have information on the number of patents granted. We used it to replace the patents applied to run our models. The results were generally consistent with those based on patents applied. 9 Specifically, if a firm decides to develop a new product, its R&D investment structure over time may be a combination of a large initial R&D spending in the first year and some additional R&D investment in the following years. In this case, one year’s R&D cannot represent the firm’s innovation endeavor. 10 For example, in our data, there’s a firm with R&D in 1998 of RMB 944.660 million and its R&D in year 1999 and year 2000 are RMB 249.075 million and RMB 191 million, respectively.

7
Firm size is measured by total assets. We include market share of each firm to
account for a firm’s market position. In addition, firm age, ownership, city fixed effect,
industry fixed effect are also included as control variables.
B. Estimation strategy
The number of patents applied for by a firm is a count variable. The OLS estimator
for count data allows for negative values in its conditional mean function. However, OLS
estimator does not need distribution assumption and is robust to heteroscedasticity. Given
this, we also report OLS results. In patent estimation, Poisson and NB maximum likelihood
estimators (MLE) are two usual candidates (e.g., Hu and Jefferson 2009, and Hall and
Ziedonis 2001). However, for Poisson, the variance is restricted to equal to its mean, the so-
called equi-dispersion. In our data, the variance of the dependent variable (the number of
patents applied) is much larger than its mean. Therefore, we estimate via NB estimation to
allow for overdispersion. Moreover, when the density is misspecified, the estimator is called
Quasi-maximum likelihood estimator (QMLE).11 Gourieroux, Montfort and Trognon (GMT,
1984) show that when the mean is correctly specified, but other features of the distribution
such as the variance and density are potentially misspecified, the MLE is still consistent.
Another concern is that there are many firms with zero patents in our dataset and
those zero observations are very likely from two quite different data generating processes:
firms that don’t innovate at all, and firms attempt to innovate but fail to generate patents.
Following Hu and Jefferson (2009), we use zero-inflated Poisson (ZIP) to model the two
processes explicitly. The zero-inflated model supplements Poisson density 𝑓𝑃(∙) with a binary
process with density 𝑓𝐵(∙). When firms do not innovate at all (i.e., the number of patents
11In application, because it is ordinary Poisson with robust error, we call it Poisson in our results analysis.
8
takes 0 with probability 1), the binary process takes value 0 with the probability 𝑓𝐵(0). When
firms do attempt to innovate, i.e., patent count takes value 0, 1, 2, …, from Poisson density
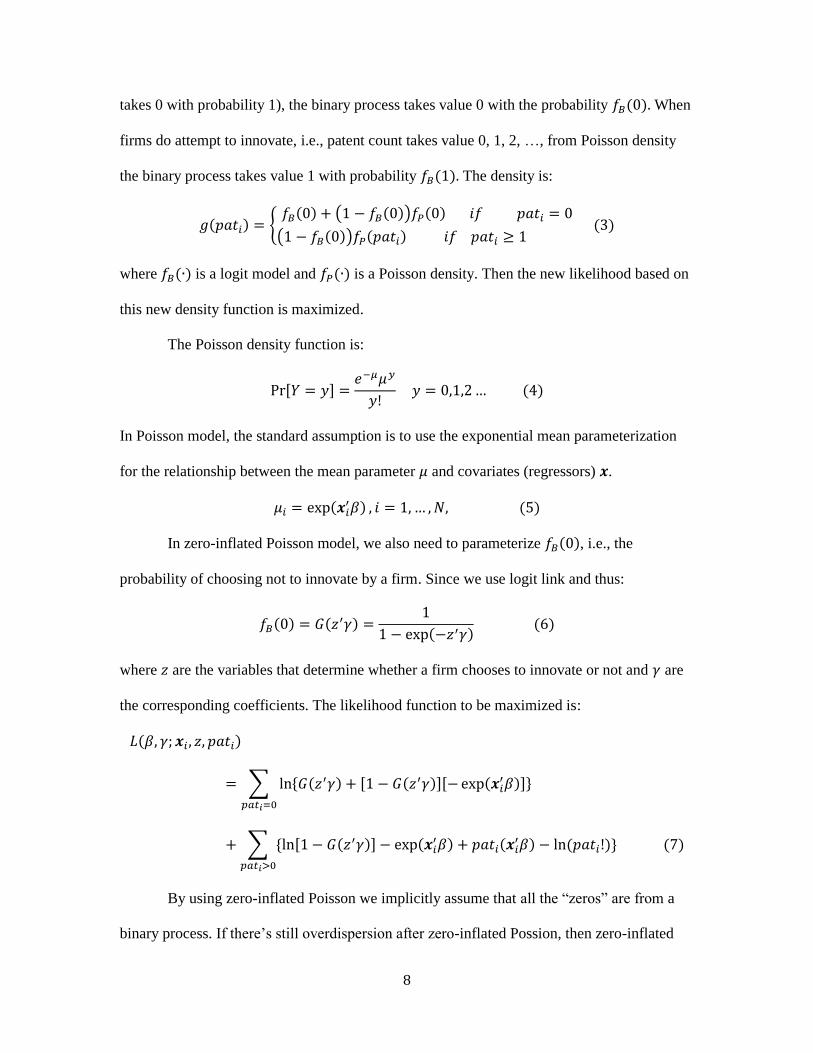
the binary process takes value 1 with probability 𝑓𝐵(1). The density is:
𝑔(𝑝𝑎𝑡𝑖) = {𝑓𝐵(0) + (1 − 𝑓𝐵(0))𝑓𝑃(0) 𝑖𝑓 𝑝𝑎𝑡𝑖 = 0
(1 − 𝑓𝐵(0))𝑓𝑃(𝑝𝑎𝑡𝑖) 𝑖𝑓 𝑝𝑎𝑡𝑖 ≥ 1 (3)
where 𝑓𝐵(∙) is a logit model and 𝑓𝑃(∙) is a Poisson density. Then the new likelihood based on
this new density function is maximized.
The Poisson density function is:
Pr[𝑌 = 𝑦] =𝑒−𝜇𝜇𝑦
𝑦! 𝑦 = 0,1,2 … (4)
In Poisson model, the standard assumption is to use the exponential mean parameterization
for the relationship between the mean parameter 𝜇 and covariates (regressors) 𝒙.
𝜇𝑖 = exp(𝒙𝑖′𝛽) , 𝑖 = 1, … , 𝑁, (5)
In zero-inflated Poisson model, we also need to parameterize 𝑓𝐵(0), i.e., the
probability of choosing not to innovate by a firm. Since we use logit link and thus:
𝑓𝐵(0) = 𝐺(𝑧′𝛾) =1
1 − exp(−𝑧′𝛾) (6)
where 𝑧 are the variables that determine whether a firm chooses to innovate or not and 𝛾 are
the corresponding coefficients. The likelihood function to be maximized is:
𝐿(𝛽, 𝛾; 𝒙𝑖 , 𝑧, 𝑝𝑎𝑡𝑖)
= ∑ ln{𝐺(𝑧′𝛾) + [1 − 𝐺(𝑧′𝛾)][− exp(𝒙𝑖′𝛽)]}
𝑝𝑎𝑡𝑖=0
+ ∑ {ln[1 − 𝐺(𝑧′𝛾)] − exp(𝒙𝑖′𝛽) + 𝑝𝑎𝑡𝑖(𝒙𝑖
′𝛽) − ln (𝑝𝑎𝑡𝑖!)}
𝑝𝑎𝑡𝑖>0
(7)
By using zero-inflated Poisson we implicitly assume that all the “zeros” are from a
binary process. If there’s still overdispersion after zero-inflated Possion, then zero-inflated
9
NB can be used. We also experimented with zero-inflated NB model, but we cannot reject
that overdispersion parameter is zero, indicating that zero-inflated Poisson model fits better.
III. Data
We use data from two surveys conducted by the World Bank.12 The first one is “The
Study of Competitiveness, Technology & Firm Linkage” conducted in 2002. The second one
is “Investment Climate Survey” conducted in 2003. Though with different names, they form
parts of a firm survey series conducted by the World Bank in order to know more about the
innovation and technology, firm productivity, finance, labor and the obstacles to do business
of Chinese firms.13 Both surveys are filled by the senior manager and the accountant and/or
personnel manager of the main production facility of the firm.
For both surveys, the most quantitative questions (e.g., total sales, R&D, etc.),
covered not only the survey year but also the previous two years in a retrospective way, and
thus there are three years of data available for those variables. However, for most qualitative
questions (e.g., education of GM, etc.), covered only the time of the survey, so there is only
one year available in the data. As a result, the data are a mix of panel data and cross-sectional
data from both surveys, depending on the specific variables.
The first survey was carried out in 2001-2002, covering firms in five large cities in
China, including Beijing, Chengdu, Guangzhou, Shanghai, and Tianjin.14 In the
questionnaire, some variables cover the years 1998, 1999, and 2000 and form a panel, but
12 The World Bank (2002). Study of Competiveness, Technology & Firm Linkages. http://microdata.worldbank.org/index.php/catalog/651. The World Bank (2003). Investment Climate Survey. http://microdata.worldbank.org/index.php/catalog/591 13 Until now, this series have been done for four years, year 2002, year 2003, year 2005 and year 2012. The surveys in 2002 and 2003 contains almost the same information and most of the information are quantitative, However, from year 2005, the questionnaire begin to change a lot and most of the information are qualitative and is less useful in our study. Thus, we only use the 2002 and 2003 survey. 14The sample includes 1548 observations and 1206 variables.
10
most questions only covered year 2000 as cross-sectional data (we call it Data 2000,
thereafter). In this data, there are 1548 firms surveyed and they belong to five manufacturing
industries and five services industries.15 The second survey was conducted in 2003 and
covered firms in 18 small and middle-sized cities.16 Similarly, some questions covered for
year 2000, 2001, and 2002 as panel data, but some only cover year 2002 (we call it Data
2002, thereafter). The second survey includes 2400 firms from 10 manufacturing and 4
services industries.17 For the purpose of this study, we exclude services industries as they
may have very different mechanism and patterns in innovation.
Whereas firms in developed countries operate in environment that are relatively
stable, regional differences play an important role in firm innovation in transitional and
developing economies like China. Regional innovation studies (e.g., Li, 2009), showed that
innovation activities are not evenly distributed spatially and the production of new
technological knowledge is more likely to localize spatially. The reasons why different
regions in China differ in terms of innovation have been studies a lot. Ning et al (2016)
showed that FDI and industry agglomeration together promotes regional innovation. To be
specific, FDI spatial spillovers are contingent upon the intensity of industry agglomeration.
Kafouros et al. (2015) concluded that sub-national institutional variations have a profound
impact on the relationship between academic collaborations and thus firms’ innovation
performance. An advantage of using both data sets is that it allows us to see different
relationships for innovation between firms in large cities, and in middle and small cities.
15 Manufacturing: apparel and leather goods, consumer products, electronic components, electronic equipment, and vehicles and vehicle parts. Services: accounting and related services, advertising and marketing, business logistics services, communication services, and information technology services. 16The 18 cities are: Benxi, Changchun, Changsha, Chongqing, Dalian, Guiyang, Haerbin, Hangzhou, Jiangmen, Kunming, Lanzhou, Nanchang, Nanning, Shenzhen, Wenzhou, Wuhan, Xi’an and Zhengzhou. This sample includes 2400 establishments and 1073 variables. 17 Manufacturing: apparel and leather goods, electronic equipment, electronic parts making, household electronics, auto & auto parts, food processing, chemical products & medicine, biotech products & Chinese medicine, metallurgical products, and transportation equipment. Services: information technology, accounting & non-banking financial services, advertisement & marketing, and business services.

11
Firms in the small and medium sized cities are mainly in the SME category; there are
more big firms in large cities. For example, the mean of the total sales of firms in big firms is
almost twice of that of firms in small and middle cities. The 75% percentile of total sales is
149 million in Data 2000 and only is 80 million RMB in Data 2002. In fact, according to the
official definition of small and big firms, there are 11.4% big firms in big cities and 9.0%
big firms in small and middle cities; there are 32.6% small firms in big cities and 43.0%
small firms in small and middle cities. Moreover, firms in big cities invest far more R&D
than in small and middle cities. The average R&D in firms of big cities is almost seven times
more than in small and middle cities. It is also noted that 50% firms in big cities are foreign
invested firms while there are only 29% in small and middle cities. Thus, by using two
similar datasets from two types of cities, large cities and small and middle cities, we provide
micro-based evidence and explanation of regional innovation differences.18
The firm size in both datasets varies dramatically. For example, the reported total
sales range from 2,000 RMB to 31.6 billion RMB in Data 2000, and from 1,500 RMB to 140
billion RMB in Data 2002.19 The total number of workers ranges from 3 to 83,542 in Data
2000 and from 1 to 70,169 in Data 2002. In selecting our sample for studying innovation, we
choose firms that are above a threshold in size. Specifically, we select our sample with firm
18 To better understand the differences between two sets of the cities included in the two datasets, Data 2000 and Data 2002, we also collect city information from the National Bureau of Statistics of China. The average GDP of metropolitan cities is 393 billion RMB (i.e., 47.5 billion US dollars) and it is only 118 billion RMB in middle and small cities. The average fixed investment, which can roughly be considered as a proxy for the size of manufacturing since most fixed investment occurs in manufacturing, is 152 billion RMB versus 48 billion RMB. The average retail sales of consumer goods which can be used as a measure of market demand is 147 billion RMB in metropolitan cities and 45 billion RMB in small and middle cities. As for government support, the financial expenditure on science and technology is 5.3 million RMB versus 0.4 million RMB and the expenditure on education is 66.7 million RMB and 15.2 billion RMB. The total investment in infrastructure in metropolitan cities is 82 million RMB while it is 19 million RMB in small and middle cities. In addition, FDI in the two types of cities are 25 million dollars versus 7 million dollars. Thus, we can conclude that firms in metropolitan cities face a larger and better developed market and manufacturing, more market demand, far more government support, and more FDI, which are all essential for firm innovation. Due to the data availability, all the data are from Year 2003. At that year, the exchange rate is 8.277 (1 US data to Chinese yuan, i.e., RMB) 19 In Year 2000, the exchange rate is 8.2784 (1 Dollar to Chinese yuan, i.e., RMB). Thus, 2,000 RMB is 241.59 dollars, and 31.6 billion RMB is 3.82 dollars. In Year 2002, the exchange rate is 8.2770.
12
sales no less than RMB 30 million in the non-service industry for both data sets. As a result,
there are 386 firms in Data 2000 and 445 firms in Data 2002. In order to test the sensitivity of
the results, we also select a larger sample with sales no less than RMB 3 million.
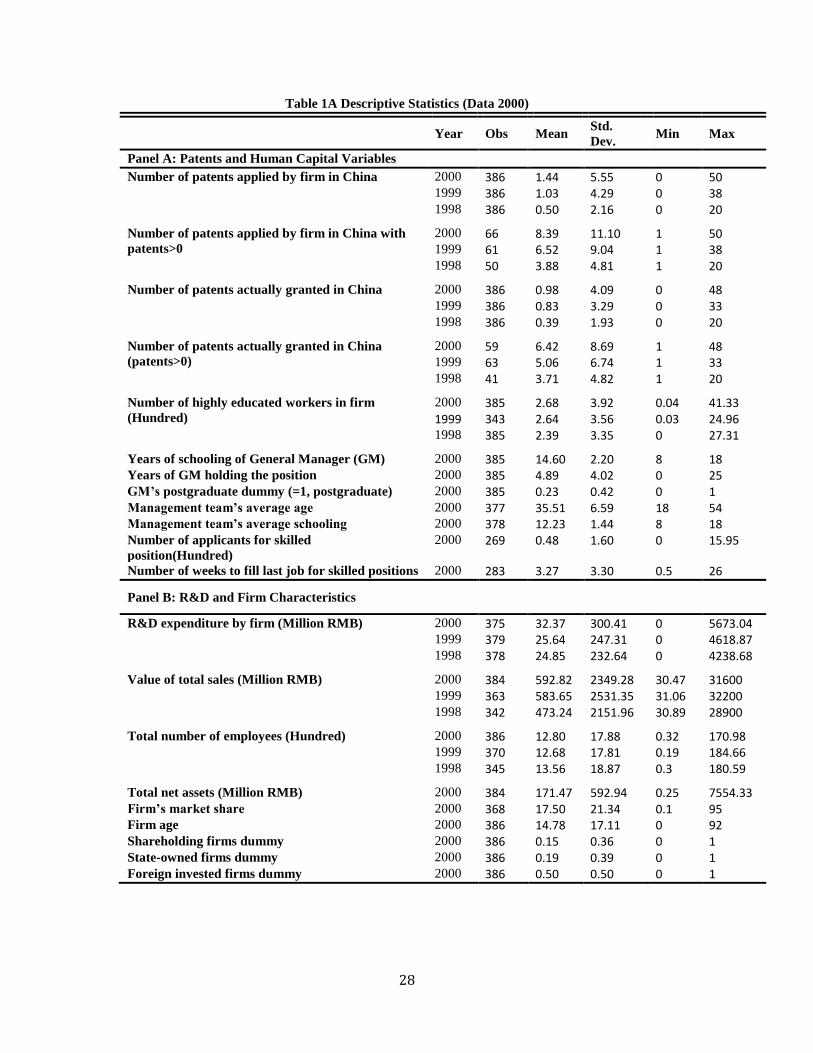
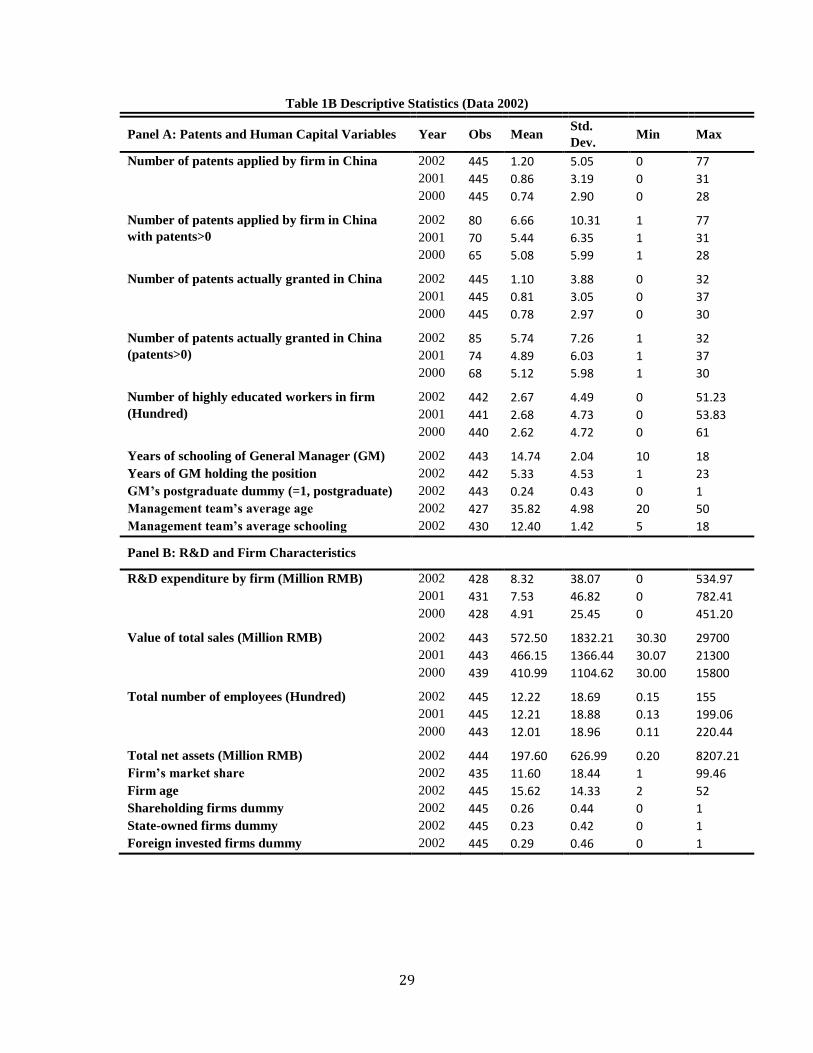
The summary statistics are presented in Table 1a (Data 2000) and Table 1b (Data
2002). In Data 2000, the average number of patents applied are 0.50, 1.03 and 1.44 per firm
for years 1998, 1999 and 2000, respectively. In Data 2002, the average patent applications
are 0.74, 0.86 and 1.20 for years 2000, 2001, and 2002, respectively. Similarly, the average
number of patent actually granted is approximately 0.39-0.98 in big cities while it is 0.78-
1.10 in small and middle cities. The top three cities with patent application in Data 2000 are
Shanghai, Beijing and Guangzhou, and in Data 2002 they are Chongqing, Wuhan and
Hangzhou. Patent application distributes very unevenly across industries. In both datasets,
vehicles and vehicle parts industry, electronic equipment industry, electronic components
industry and household electronics industry have the most patent applications. Average
patent applications are very similar across two datasets, and show an increasing trend in both.
Hu and Jefferson (2009) showed that the intensification of research and development, the
growth of foreign direct investment, and amendments to the patent law that favor patent
holders and ownership reform account for the increase of patent applications in China.
Moreover, firms have marginally more recorded patent applications in Data 2000 than in
Data 2002 (1.44 versus 1.20). In addition, in both datasets, there are approximately 20%
firms with nonzero patents.
For 80% firms with zero patents, two channels might contribute to it: (1) firms
chooses to not patent (or innovate); (2) firms choose to patent (innovate), but fails. Also, a
large percentage of the firms are in the SME category and this, couple with them being in a
developing economy explains why a number of firms have zero patents. For the firms with

13
positive patent applications, they applied for approximately 3-8 patents in Data 2000 and
approximately for 5-6 patents in Data 2002.20
To measure skilled labor we follow Fleisher et al. (2011) and classify the employees
into two categories: highly educated and less educated workers.21 By averaging the workers’
schooling years for each occupation category (i.e., basic production workers, auxiliary
production workers, engineering and technical personnel, managerial personnel, service
personnel, and other employees,) over the sample, we designate each occupation level as
either highly educated or less educated based on the average schooling of workers in the
occupation.22 We find that both “engineering and technical personnel” and “managerial
personnel (including sales)” have college degree on average (around 14 years of schooling),
but “basic production workers”, “auxiliary production workers”, “service personnel”, and
“other employees” have high school degree on average (around 10 years of schooling). Thus,
in our data, the highly educated group mainly consists of “engineering and technical
personnel” and “managerial personnel (including sales)” and other workers of occupations
are grouped as “less educated workers”. Note that the survey data only provide information
on number of employees for different occupation for the years 2000 and 1998. We impute
employment for different occupations for 1999 in Data 2000 and year 2000 in Data 2002.23
20 In China, there are three types of patents: invention, utility model and design. Utility model and design requires no substantive examination and is typically granted very quickly. This might be the reason why the probability of successful patenting is quite high. 21 In both surveys, workers are classified into: basic production workers, auxiliary production workers, engineering and technical personnel, managerial personnel, service personnel and other employees. Moreover, there is no explicit explanation for “other employees”. 22We average years of schooling both over the whole sample and over industries, and both indicate the same classification. 23 We use weighted average employment of 2000 and 1998, using ratio of total employment of 1999 to 2000 and 1999 to 1998 as weights to impute employment for 1999 in Data 2000. Similarly, for Data 2002, we impute the employment for different occupation for year 2000 using weighted average employment of 2002 and 2001 and use the ratio of total employment of 2000 to 2002 and 2001 to 2002 as weights.
14
GM’s tenure is the years he/she holds position.24 In the datasets, we have the
information on GM’s education degree level. Education of the management team is the
average years of schooling of all managers in the team. We use market share as a measure for
market structure.25
We can see that firms in Data 2000 are bigger in terms of total workers, with
approximately240-270 highly educated workers and 1300 total employment in Data 2000 and
approximately 260-270 highly educated workers and 670 total workers in Data 2002.
In both datasets, GMs have more than 14 years of schooling, i.e., undergraduate
degree level. In fact, in both datasets, more than 70% GMs have at least undergraduate
degree. GM’s education differs a little between two datasets, with a slightly more GMs with
postgraduate degree in Data 2000 than Data 2002, 23% versus 24%.26
On the other side, there’s very large difference in R&D between two datasets, with
approximately 25-32 Million RMB in Data 2000 and approximately 5-8 Million RMB in
Data 2002. Given the fact that the total sales in Data 2000 is only slightly less than in Data
2002, the large difference in R&D between those two datasets is notable. One reason might
be that big cities has more supportive policies. The other reason might be that the R&D
competition among firms. Another important difference between two datasets is that firms in
Data 2000 have a higher market share (17.50%) than in Data 2002 (11.60%). We can also see
that the ownership structure in the two datasets differ a lot. The reason why the first dataset
has more foreign firms might be that it is drawn from big cities which is the main destination
of foreign firms due to supportive policies, infrastructure and environment.
24 In fact, we don’t have gender information. 25 In the questionnaire, each firm is asked to report their market share, 26 Note that according to the survey material, a person with high school education level have approximately 10 years of schooling at the survey years; a person with undergraduate education level have approximately 14 years of schooling.
15
Table 2 presents the differences of human capital indicators between firms with
patents and without patents in both datasets. We can see that in both datasets, the firms with
patents have more highly educated workers, better educated GM and management team, and
younger management team, and all differences are statistically significant. However, for
GM’s tenure, the difference is mixed (positive for Data 2000 but negative for Data 2002) and
is statistically insignificant. We also examined correlation between important variables. We
find that in the two datasets the correlation between skilled workers and patents is 0.28 and
0.44 respectively. However, the correlation between R&D and skilled workers differ a lot,
with 0.041 in Data 2000 and 0.48 in Data 2002.
IV. Estimation Results
Table 3A and Table 3B report the regression results based on OLS and NB and zero-
inflated Poisson estimation. As we discussed in Section II, our analysis will rely on the
results of zero-inflated Poisson model. The OLS results are reported to provide a comparison.
We only use year 2000 for Data-2000 and year 2002 for Data-2002, because all human
capital indicators are only available for the survey year. In both Table 3A and Table 3B, the
Vuong test of zero-inflated NB versus standard NB is rejected, indicating that the zero-
inflated model is preferred.
The results in Table 3A show that the number of highly educated workers has a
positive and significant effect on patent applications in big cities (Data 2000). This is true for
both datasets regardless of estimation methods (i.e., OLS, NB, or zero-inflated Poisson).
From the estimated coefficients, it emerges that when the number of highly educated workers
increases by 100 people, the number of patents is expected to increase by 27.3% in the NB
model. Evaluating at the sample average of number of patents (1.44), the number of patents
are expected to increase by 0.393. The somewhat large effect indicates that NB model does
16
not fit well. When we consider zero inflated Poisson, we find that skilled human capital has
effect on both patent counts and probability of innovation. Compared to the NB, the effect of
skilled human capital on patent counts now decreases to 6.18%. That is, evaluating at the
sample average of number of patents, the number of patents are expected to increase only
0.0890. For the OLS estimation, the effect is 0.444; relatively larger in terms of number of
patent applied. Our overall results are similar in spirit to Audretsch and Acs (1991), who
found that skilled labor has a positive effect on innovation using “industry” level data.
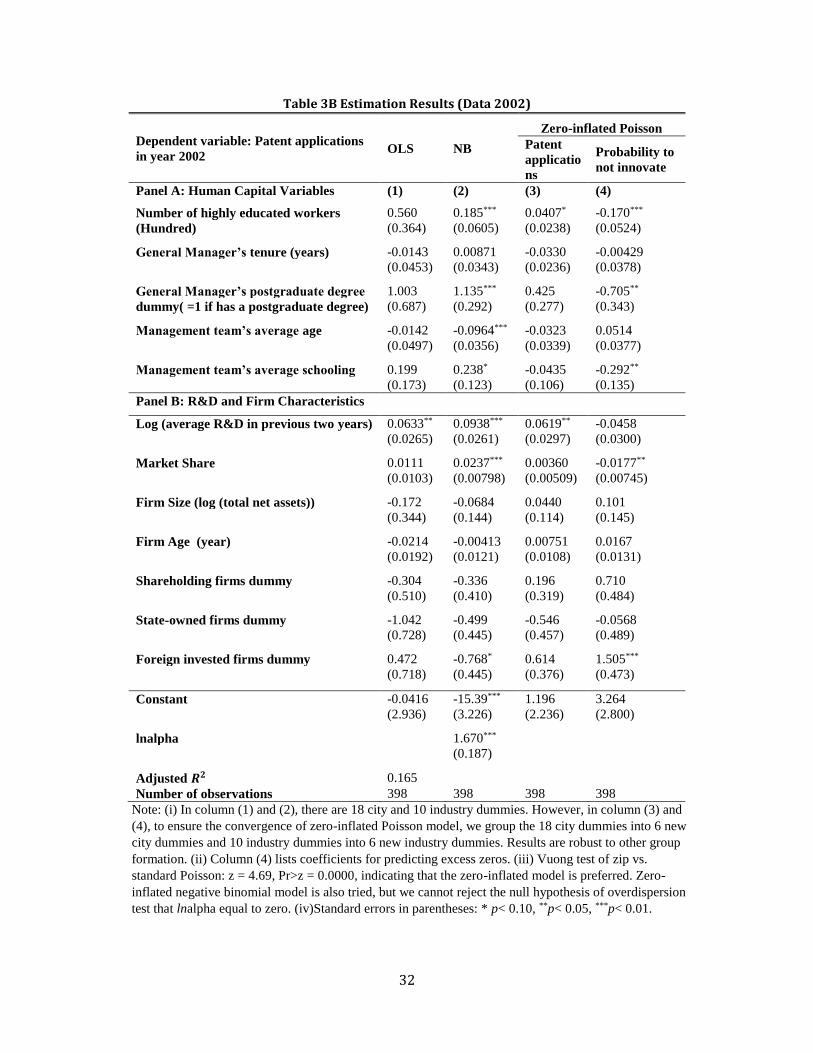
In Table 3B, we also find that skilled human capital also plays an important role in
small and middle cities (Data 2002). Across all different models, skilled human capital has a
positive effect on firm innovation. In the NB model, when the number of highly educated
workers increases by 100, the number of patent applications is expected to increase by
18.5%. That is, evaluating at the sample average patent counts (1.20), patent counts are
expected to increase by 0.222. In zero-inflated Poisson model, we also find that skilled
human capital can influence both patent counts but also the probability to innovate.
Skilled human capital is essential for firms in all cities. In NB model, skilled human
capital has a larger effect on firm innovation in big cities (0.273 versus 0.185). Moreover,
skilled human capital is more important and more significant in determining a firm’s patent
application intensity in big cities (0.0618 versus 0.0407). In contrast, skilled human capital
has a slight larger effect on determining probability to innovate. A possible explanation is
that in big cities engaging innovation is a common thing for firms and the question faced by
firms is how much to invest in innovation while in small and middle cities whether to invest
in innovation or not is still a question for at least some firms.
Turning to managerial effects, we find that the GM’s tenure is positive and significant
in big cities (Data 2000) across all models. In NB model, we find that when GM’s tenure
increases by one additional year, the number of patent applications is expected to increase by

17
17.8%, approximately 0.256 patents evaluated at the sample average of patents. It is slightly
smaller than the effect of the OLS estimate of 0.329. Similar as in Data 2000, this effect is
unusually large. In zero-inflated model, we find that GM’s tenure plays an important role
both in determining a firm’s innovation decision and patent counts. An increase in GM’s
tenure will increase a firm’s probability to innovate. When the GM’s tenure increases by one
additional year, the number of patent applications is expected to increase by 0.102 on
average. Due to the uncertainties of a firm’s innovation endeavor, the rich experience of the
GM may help him/her with better vision, strategies, and more effective implementation.
However, the evidence in the literature is mixed. For example, Lin et al. (2011) that showed
that GM’s tenure has a positive effect on R&D expenditure; while Hambrick and Fukutomi
(1991) found that a GM tends to make fewer changes in strategy as the tenure increases.27
The GM’s tenure appears to have different effect in the two datasets: positive and
significant in large cities, but no significant effect in middle cities. One possible explanation
is that competition in middle cities may not as high as in large cities and thus the GM’s
experience is not as important. Another explanation is that large cities have more developed
market and the market mechanism rewards more experienced manager for innovation.
The results show that the coefficient of GM graduate degree is insignificant in Data
2000, but significant in Data 2002. In NB model, when the GM has a postgraduate degree,
the firm’s patent counts are expected to increase by 113.5%, or approximately 1.36 more
patents. In zero-inflated model, we only find a significant effect on probability of innovation.
That is, a GM with postgraduate degree will promote a firm’s probability of innovation in
27 Moreover, there are some researchers who found that CEOs tend to make fewer changes in strategy as their tenure increases. One reason is that with each increasing year of tenure, CEOs have less interest in pursuing strategies of innovation through higher R&D expenditure, preferring instead to emphasize stability and efficiency (Barker and Mueller, 2002). The other reason is that longer-tenured CEOs may lose touch with their organization’s environments and therefore may not make the changes and investments desired to keep the firm evolving over time.

18
small and middle sized cities but have no significant effect on patent applications. More
educated executives may have more knowledge and higher ability to absorb new ideas and
therefore higher tendency toward accepting innovations (Hitt and Tyler 1991). Such
knowledge is likely to be more important in middle cities for the firms to adopt and adapted
to more advance technologies from large and relatively developed cities. It is also not hard to
understand that the graduate degree of GM is only important for a firm’s decision to innovate
or not since GM’s role in a firm is to make decision.
Combining the different effects of GM’s tenure between two datasets, we conclude
that in big cities a firm with a GM with longer tenure will innovate more while in small and
middle cities a firm with a GM with a postgraduate degree will innovate more. Thus, to
promote firm innovation, a GM with more experience is needed in big cities while a more
educated GM is vital in small and middle cities.
Management team’s average age has a negative and significant effect in both datasets
in NB model. When management team’s average age increases one year, the number of
patents is expected to decrease 9.54% firms in large cities and 9.23% middle cities, based on
NB estimation. This finding is similar in spirit with some earlier results in the literature (e.g.,
Hambrick and Mason,1984; and Barker and Mueller, 2002). However, we do not find a
significant effect in the zero-inflated Poisson.
Consistent with other studies (e.g., Schoenecker and Daellenbach, 1995), we find a
positive effect of management team’s education on firm innovation in Data 2002. We find
that management team’s average schooling plays an important role in a firm’s innovation
decision, but no significant effect in patent applications. However, we fail to find a
significant effect of management team’s education in Data 2000 in zero-inflated Poisson.
The effect of management team’s education differs between two datasets. In our
preferred model, zero-inflated Poisson, no significant effect was detected in Data 2002, but
19
our result indicates that management team’s education plays a positive and significant effect
in determining a firm to innovate or not. This is similar with the effect of GM’s education
that also plays an important role in Data 2002 but has no significant effect in Data 2002.
As shown in Table 3A and Table 3B, market share in both datasets has a positive
effect on patenting, as commonly found in literature (e.g., Blundell et al., 1999). While
market share has a positive effect, the patterns vary. In Data 2000, it has an important effect
of raising a firm’s patent counts but has no significant effect on increasing the probability of
innovation. When market share increases by 1%, patent applications are expected to increase
by 1.42%. In Data 2002, it has an important effect of raising a firm’s probability of
innovation rather than increasing patent counts. R&D spending has positive and significant
effect only in small and middle cities, consistent with some previous studies (e.g., Pakes and
Griliches, 1980; Brouwer and Kleinknecht, 1999). In particular, when R&D increases by 1%,
the number of patents is expected to increase by 0.0938% in Data 2002 in NB model.
Moreover, the zero-inflated Poisson results indicate that R&D only plays a role in increasing
patent counts rather than promoting a firm’s probability to innovate. OLS and NB results
confirm this finding though with a bigger estimated effect. We failed to find a significant
effect of R&D in Data 2000 for large cities. One explanation is that, with the control of
various human capital in the firm, R&D may be less critical.
Based on our estimation results, we can see that compared to many other firm
innovation studies, as opposed to R&D, firm size and market structure, factors related to
skilled human capital appear to be a more important influence in a firm to determine if it will
be more innovative or not. Once we control human capital factors, we find no significant
effect of firm size at all. We find positive effect of market share on innovation though with
differing patterns. In large cities, market share tends to increase patent counts but in small
and middle cities market share tends to increase its probability to innovation. Moreover, we
20
find that R&D has very different effect on innovation in different types of cities: it has a
significant effect both statistically and economically on firm innovation in small and middle
cities but no effect at all in big cities. Another important finding is that in large cities, GM
tenure or experience plays an important role in firm innovation but in small and middle cities
education (GM graduate degree and management team’s schooling) is more important. This
is consistent with intuition. In big cities, there’s an abundance of highly educated human
capital and in this situation experience becomes the critical factor. On the other hand, in
small and middle cities, highly educated human capital should be much less than in big cities.
V. Further Investigation
Next, we address an identification problem. A firm’s level of skilled human capital
may be endogenous, because factors affecting a firm’s workforce adjustment are very likely
to be related to firm’s innovation potential and path. For example, a firm that wants to be
active in innovation would tend to hire more highly educated workers. Thoenig and Verdier
(2003) mentioned that by employing a larger share of skilled labor, firms can reduce
informational leakages and spillovers, and thereby lessen the threat of imitation. Moreover,
successful innovation may also increase the proportion of skilled workers in the whole
workforce (Krueger, 1993) because more advanced technology needs to be complementary to
be productive. Therefore, skilled human capital and GM education can be correlated with,
unobservable firm-specific characteristics (Fleisher et al. 2011).
When endogenous variables exist, both OLS and NB estimator will be inconsistent.
We apply instrumental variable estimation and control function approach to estimate the
models. In particular, let 𝑦1 denote the dependent variable, 𝑦2 the endogenous explanatory
21
variables, and 𝒛the 1 × 𝐿 vector of exogenous variables and instruments (which includes
unity as its first element). Assume the mean function as:
𝐸(𝑦1|𝒛, 𝑦2, 휀1) = exp(𝒛1𝛿1 + 𝛼1𝑦2 + 휀1), (8)
where 𝒛1 is a 1 × 𝐿1 strict subvector of 𝑧and 휀1 is the error term. Suppose first that 𝑦2 has a
standard linear reduced form with an additive and independent error
𝑦2 = 𝒛𝝅2 + 𝑣2, (9)
and the joint distribution of 휀1 and 𝑣2 is independent of 𝒛,. Then we have
𝐸(𝑦1|𝒛, 𝑦2) = 𝐸(exp(𝒛1𝛿1 + 𝛼1𝑦2 + 휀1) |𝒛, 𝑦2)
= 𝐸(exp(휀1) |𝑣2) exp(𝒛1𝛿1 + 𝛼1𝑦2). (10)
Also, 𝐸(exp(휀1) |𝑣2) = 𝐸(exp(휀1|𝑣2)) = exp(𝐸(휀1|𝑣2)). According to one theorem of
bivariate normal distribution, if (휀1, 𝑣2) are jointly normal, then 𝐸(휀1|𝑣2) will be linear in 𝑣2.
Under the assumptionof zero mean of 휀1 and 𝑣2, we then get that𝐸(휀1|𝑣2) = 𝜃1𝑣2, where 𝜃1
is a constant.28 Finally, we get that 𝐸(exp(휀1) |𝑣2) = exp(𝜃1𝑣2).Then
𝐸(𝑦1|𝒛, 𝑦2) = 𝐸(𝑦1|𝒛, 𝑣2) = exp(𝒛1𝛿1 + 𝛼1𝑦2 + 𝜃1𝑣2). (11)
This suggests a two-step estimation procedure. The first step is to estimate the reduced form
for 𝑦2 and obtain the residuals. Second, include �̂�2, along with 𝒛1 and 𝑦2, in NB.
Therefore, in the first stage of control function method, we regress all endogenous
variables (i.e. number of skilled workers and CEO’s education) on all exogenous variables
including instrumental variables and get two residuals using OLS. In the second stage, we
regress the dependent variable (patent applications) on all the variables in the original model
and the two residuals using NB. Wooldridge (2015) pointed out that control function is likely
more efficient than a direct IV approach. We also include 2SLS to check the consistency.
28 See more in Pishro-Nik (2014).

22
Though in linear models, 2SLS estimates are identical to control function estimates. In non-
linear model such as exponential model, they are different as we’ll see in the following.
To find valid instruments for total number of skilled workers, we follow Fleisher et
al. (2011), and use the number of applicants for the positions and the average number of
weeks those positions are vacant as instruments. A firm with more skilled human capital is
more likely to attract more applicants and thus less vacant weeks for those positions.
Meanwhile, number of applicants and vacant weeks are largely influenced by the behavior of
job seekers and the labor supply side, and thus should be exogenous to unobserved firm
innovation heterogeneity.29 Additionally, we use average skilled human capital over cities
and average skilled human capital over industries (both excluding firm itself) as instruments.
Those averages are correlated with firm’s skilled human capital due to industry and city
norms and characteristics, but not correlated with firm’s unobserved heterogeneity.
GM’s education can also be endogenous. A firm that wants to be active in innovation
might employ GM with higher education level. We use industry average as well as city
average of GM’s education, excluding firm itself in calculating the average, as instruments.
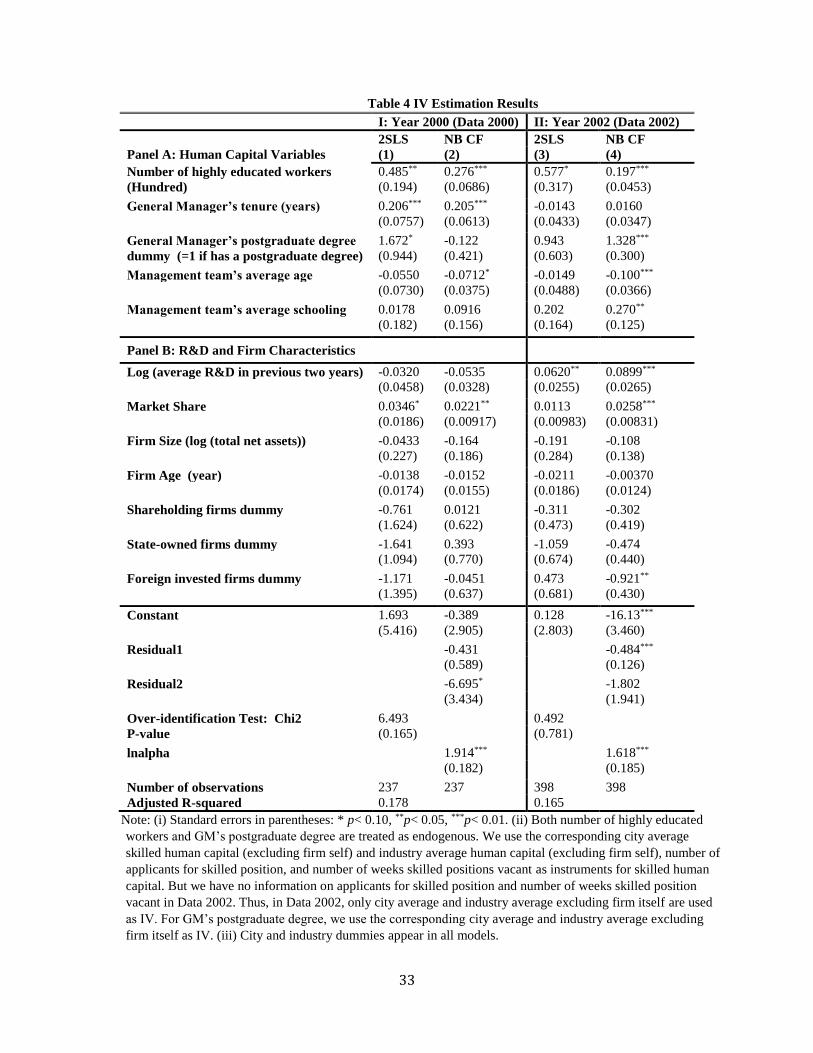
The results are reported in Table 4. As seen in the table, the over-identification test
does not reject the null that the over-identifying instruments are valid assuming a subset of
the instruments is valid and identified the model.30 For skilled human capital, after
considering endogeneity, we get that when the number of skilled workers increase by 100,
the number of patents is expected to increase by 27.6% in Data 2000, and 19.7% in NB Data
2002. Compared to the results reported earlier, there’s almost no change. For the effect of
postgraduate degree of GM, when the GM has a postgraduate degree, the patent counts are
29 In Data 2002, we have no information on the number of applicants and vacant weeks. 30 We use Wooldridge's score test of overidentifying restrictions, which is robust to heteroskedasticity.
23
expected to increase by 132.8%, or approximately 1.59 more patents. Similarly, we observed
that there’s almost no change in the effect of GM’s tenure.
In Data 2000, we notice that now the coefficient of management team’s age remains
significant and similar magnitude in both models. In Data 2002, we get that when
management team’s average age increases by 1 year, patent counts are expected to decrease
by 7.12%, a little larger than in basic results; while for Data 2000, the effect is similar and it
is 10%. The management team’s education becomes insignificant in Data 2000 while it
remains similar significant effect in Data 2002. When management team’s schooling
increases one year, the firm’s patent counts are expected to increase by 27%. We notice that
the effect of management team’s schooling changes a lot, from significant become
insignificant in large cities while it becomes more significant and have a little larger effect in
middle cities. This might indicate that the endogeneity of human capital indicators is different
between two datasets. This is also confirmed by the results of Hausman test. In Data 2000,
we reject that the human capital indictors are endogenous with p-value equal to 0.0655 at
10%, while in Data 2002 we accept that the human capital indicators are exogenous with p-
value equal to 0.873.
We know that in control function method, the including of residuals not only control
endogeneity but also enables us to test the endogeneity. A significant error term indicates the
endogeneity of suspected variable; vice versa. To ensure the validity of the test, we also
bootstrap the standard errors. In Table 4, the residual from first stage is insignificant in Data
2000 but significant in Data 2002, indicating that the suspect variables are exogenous in Data
2000 and endogenous in Data 2002. From the above analysis, we can see that even in Data
2000, the results haven’t changed a lot after considering endogeneity. Thus, we can conclude
that the results we reported earlier still hold.

24
Finally, we wanted to check whether our results are sensitive to sample selection. We
relaxed the firm size threshold to firms with no less than 3 million RMB total sales. These
results are presented in Table A1. A and Table A1.B. Compared to results in Table 3, there’s
little change in Table A1. A and Table A1.B. Skilled human capital still plays an important
role in firm innovation and its effect varies: in big cities it is important to both innovation
probability and innovation intensity but it is only vital in determining a firm’s innovation
probability in small and middle cities. Moreover, GM’s experience is still more important in
big cities while GM’s education is still more important in small and middle cities for firm
innovation. In addition, R&D still only plays a vital role in firm innovation in small and
middle cities while has no significant effect on firm innovation in big cities.
VI. Concluding Remarks
As human capital is one of firms’ critical resources, we examined its impact on firms’
innovation. In our analysis, we emphasized the human capital characteristics of a firm’s
workforce as well as the decision makers, the General Manager and the management team.
Skilled human capital can affect a firm’s probability of success. And managerial capital could
affect a firm’s project and R&D choice.
The human capital indicators we used are skilled human capital (number of highly
educated workers), General Manager’s education and tenure, and the management team’s
education and age. Our overall results show that skilled human capital plays an important
role in firms’ innovation, but its effect varies somewhat: in big cities it is important to both
innovation probability and innovation intensity, but it is only vital in determining a firm’s
innovation probability in small and medium cities. The General Manager’s experience is
more important in big cities, while the General Manager’s education is more important in

25
small and medium cities. The management team’s schooling in firms from small and medium
cities plays a more important role in firm innovation than of big cities. The management
team’s age has a similar significant and negative effect on firm innovation in both datasets. In
addition, R&D appears to play an important role in firm innovation in small and medium
cities, and has no significant effect in big cities. The effect of R&D on patents is insignificant
in large metropolitan cities while it is positive and significant in smaller and medium cities.
In future extensions of our work, we are pursuing one additional aspect that could
shed light on firms’ innovation paths and outcomes: examining the differences between small
versus large firms in the link between human capital and innovation.
Our study highlights two key results. First, based on the broad spectrum of our results
on human capital, it appears that policies to promote innovation, especially in developing
economies, need to incentivize steps to improve human capital formation and accumulation
in all firms. As lack of scientific and technological resources of a country, as manifested in
the human-capital component, can diminish the standards of living, policies to promote
scientific and managerial education and training can have far ranging benefits for economic
development. Second, we find that R&D expenditures appear to have a more potent effect on
innovation in the less developed areas within the country. This suggest that policies and
resources to promote R&D should focus on the less developed regions for greater nation-
wide effectiveness and increase innovation.
26
References
1. Audretsch, D. B., &Acs, Z. J. (1991). Innovation and size at the firm level. Southern
Economic Journal, 739-744.
2. Audretsch, D. B., & Feldman, M. P. (2004). Knowledge spillovers and the geography
of innovation. Handbook of regional and urban economics, 4, 2713-2739.
3. Barker III, V. L., & Mueller, G. C. (2002). CEO characteristics and firm R&D
spending. Management Science, 48(6), 782-801.
4. Bates, T. (1990). Entrepreneur human capital inputs and small business longevity.
The review of Economics and Statistics, 551-559.
5. Blundell, R., Griffith, R., & Van Reenen, J. (1999). Market share, market value and
innovation in a panel of British manufacturing firms. The Review of Economic
Studies, 66(3), 529-554.
6. Brouwer, E., & Kleinknecht, A. (1999). Innovative output, and a firm's propensity to
patent.: An exploration of CIS micro data. Research Policy, 28(6), 615-624.
7. Colombo, M. G., & Grilli, L. (2005). Founders’ human capital and the growth of new
technology-based firms: A competence-based view. Research policy, 34(6), 795-816.
8. Fleisher, B. M., Hu, Y., Li, H., & Kim, S. (2011). Economic transition, higher
education and worker productivity in China. Journal of Development Economics,
94(1), 86-94.
9. Ghosal, V. (2015). Business strategy and firm reorganization: role of changing
environmental standards, sustainable business initiatives and global market
conditions. Business Strategy and the Environment, 24(2), 123-144.
10. Ghosal, V., & Nair-Reichert, U. (2009). Investments in modernization, innovation
and gains in productivity: Evidence from firms in the global paper industry. Research
Policy, 38(3), 536-547.
11. Gourieroux, C., Monfort, A., &Trognon, A. (1984). Pseudo maximum likelihood
methods: Applications to Poisson models. Econometrica: Journal of the Econometric
Society, 701-720.
12. Grimpe, C., &Sofka, W. (2009). Search patterns and absorptive capacity: Low and
High-technology sectors in European countries. Research Policy, 38(3), 495-506.
13. Hall, B. H., &Ziedonis, R. H. (2001). The patent paradox revisited: an empirical
study of patenting in the US semiconductor industry, 1979-1995. RAND Journal of
Economics, 101-128.
14. Hall, B. H., Griliches, Z., &Hausman, J. A. (1986). Patents and R&D: Is there a lag?
NBER working paper.
15. Hambrick, D. C., &Fukutomi, G. D. (1991). The seasons of a CEO's tenure. Academy
of Management Review, 16(4), 719-742.
16. Hambrick, D. C., & Mason, P. A. (1984). Upper echelons: The organization as a
reflection of its top managers. Academy of Management Review, 9(2), 193-206.
17. Hansen, P. A., &Serin, G. (1997). Will low technology products disappear?: The
hidden innovation processes in low technology industries. Technological Forecasting
and Social Change, 55(2), 179-191.
18. Hitt, M. A., & Tyler, B. B. (1991). Strategic decision models: Integrating different
perspectives. Strategic Management Journal, 12(5), 327-351.
19. Hitt, M. A., Biermant, L., Shimizu, K., &Kochhar, R. (2001). Direct and moderating
effects of human capital on strategy and performance in professional service firms: A
resource-based perspective. Academy of Management journal, 44(1), 13-28.
27
20. Hu, A. G., & Jefferson, G. H. (2009). A great wall of patents: What is behind China's
recent patent explosion?. Journal of Development Economics, 90(1), 57-68.
21. Kafouros, M., Wang, C., Piperopoulos, P., & Zhang, M. (2015). Academic
collaborations and firm innovation performance in China: The role of region-specific
institutions. Research Policy, 44(3), 803-817.
22. Kim, L., & Nelson, R. R. (Eds.). (2000). Technology, learning, and innovation:
Experiences of newly industrializing economies. Cambridge University Press.
23. Krueger, A. B. (1993). How Computers Have Changed the Wage Structure: Evidence
from Microdata, 1984-1989. The Quarterly Journal of Economics, 108(1), 33-60.
24. Li, X. (2009). China's regional innovation capacity in transition: An empirical
approach. Research Policy, 38(2), 338-357.
25. Lin, H. F. (2007). Knowledge sharing and firm innovation capability: an empirical
study. International Journal of manpower, 28(3/4), 315-332. 26. Lin, C., Lin, P., Song, F. M., & Li, C. (2011). Managerial incentives, CEO
characteristics and corporate innovation in China’s private sector. Journal of
Comparative Economics, 39(2), 176-190.
27. McGuirk, H., Lenihan, H., & Hart, M. (2015). Measuring the impact of innovative
human capital on small firms’ propensity to innovate. Research Policy, 44(4), 965-
976.
28. Ning, L., Wang, F., & Li, J. (2016). Urban innovation, regional externalities of
foreign direct investment and industrial agglomeration: Evidence from Chinese
cities. Research Policy, 45(4), 830-843.
29. Pakes, A., &Griliches, Z. (1980). Patents and R&D at the firm level: A first report.
Economics Letters, 5(4), 377-381.
30. Pfeffer, J. (1995). Competitive Advantage Through People: Unleashing the Power of
the Work force. Harvard Business Press.
31. Pishro-Nik, H. (2014). Introduction to Probability, Statistics, and Random Processes.
Kappa Research, LLC.
32. Romer, P. M. (1990). Endogenous technological change. Journal of Political
Economy, S71-S102.
33. Schoenecker, T. S., Daellenbach, U. S., & McCarthy, A. M. (1995, August). Factors
affecting a firm’s commitment to innovation.. In Academy of Management
Proceedings (Vol. 1995, No. 1, pp. 52-56). Academy of Management.
34. Sterlacchini, A. (1999). Do innovative activities matter to small firms in non-R&D-
intensive industries? An application to export performance. Research Policy, 28(8),
819-832.
35. Symeonidis, G. (1996). Innovation, firm size and market structure: Schumpeterian
hypotheses and some new themes, P.42 OECD (No. 161). Economic Department,
Working Papers.
36. Tamer Cavusgil, S., Calantone, R. J., & Zhao, Y. (2003). Tacit knowledge transfer
and firm innovation capability. Journal of business & industrial marketing, 18(1), 6-
21.
37. Thoenig, M., &Verdier, T. (2003). A theory of defensive skill-biased innovation and
globalization. American Economic Review, 709-728.
38. Wooldridge, J.M. (2015). Control function method in applied econometrics. Journal
of Human Resources, 50(2), 420-445.
28
Table 1A Descriptive Statistics (Data 2000)
Year Obs Mean Std.
Dev. Min Max
Panel A: Patents and Human Capital Variables
Number of patents applied by firm in China 2000 386 1.44 5.55 0 50
1999 386 1.03 4.29 0 38
1998 386 0.50 2.16 0 20
Number of patents applied by firm in China with
patents>0
2000 66 8.39 11.10 1 50
1999 61 6.52 9.04 1 38
1998 50 3.88 4.81 1 20
Number of patents actually granted in China 2000 386 0.98 4.09 0 48
1999 386 0.83 3.29 0 33
1998 386 0.39 1.93 0 20
Number of patents actually granted in China
(patents>0)
2000 59 6.42 8.69 1 48
1999 63 5.06 6.74 1 33
1998 41 3.71 4.82 1 20
Number of highly educated workers in firm
(Hundred)
2000 385 2.68 3.92 0.04 41.33
1999 343 2.64 3.56 0.03 24.96
1998 385 2.39 3.35 0 27.31
Years of schooling of General Manager (GM) 2000 385 14.60 2.20 8 18
Years of GM holding the position 2000 385 4.89 4.02 0 25
GM’s postgraduate dummy (=1, postgraduate) 2000 385 0.23 0.42 0 1
Management team’s average age 2000 377 35.51 6.59 18 54
Management team’s average schooling 2000 378 12.23 1.44 8 18
Number of applicants for skilled
position(Hundred)
2000 269 0.48 1.60 0 15.95
Number of weeks to fill last job for skilled positions 2000 283 3.27 3.30 0.5 26
Panel B: R&D and Firm Characteristics
R&D expenditure by firm (Million RMB) 2000 375 32.37 300.41 0 5673.04
1999 379 25.64 247.31 0 4618.87
1998 378 24.85 232.64 0 4238.68
Value of total sales (Million RMB) 2000 384 592.82 2349.28 30.47 31600
1999 363 583.65 2531.35 31.06 32200
1998 342 473.24 2151.96 30.89 28900
Total number of employees (Hundred) 2000 386 12.80 17.88 0.32 170.98
1999 370 12.68 17.81 0.19 184.66
1998 345 13.56 18.87 0.3 180.59
Total net assets (Million RMB) 2000 384 171.47 592.94 0.25 7554.33
Firm’s market share 2000 368 17.50 21.34 0.1 95
Firm age 2000 386 14.78 17.11 0 92
Shareholding firms dummy 2000 386 0.15 0.36 0 1
State-owned firms dummy 2000 386 0.19 0.39 0 1
Foreign invested firms dummy 2000 386 0.50 0.50 0 1
29
Table 1B Descriptive Statistics (Data 2002)
Panel A: Patents and Human Capital Variables Year Obs Mean Std.
Dev. Min Max
Number of patents applied by firm in China 2002 445 1.20 5.05 0 77
2001 445 0.86 3.19 0 31
2000 445 0.74 2.90 0 28
Number of patents applied by firm in China
with patents>0
2002 80 6.66 10.31 1 77
2001 70 5.44 6.35 1 31
2000 65 5.08 5.99 1 28
Number of patents actually granted in China 2002 445 1.10 3.88 0 32
2001 445 0.81 3.05 0 37
2000 445 0.78 2.97 0 30
Number of patents actually granted in China
(patents>0)
2002 85 5.74 7.26 1 32
2001 74 4.89 6.03 1 37
2000 68 5.12 5.98 1 30
Number of highly educated workers in firm
(Hundred)
2002 442 2.67 4.49 0 51.23
2001 441 2.68 4.73 0 53.83
2000 440 2.62 4.72 0 61
Years of schooling of General Manager (GM) 2002 443 14.74 2.04 10 18
Years of GM holding the position 2002 442 5.33 4.53 1 23
GM’s postgraduate dummy (=1, postgraduate) 2002 443 0.24 0.43 0 1
Management team’s average age 2002 427 35.82 4.98 20 50
Management team’s average schooling 2002 430 12.40 1.42 5 18
Panel B: R&D and Firm Characteristics
R&D expenditure by firm (Million RMB) 2002 428 8.32 38.07 0 534.97
2001 431 7.53 46.82 0 782.41
2000 428 4.91 25.45 0 451.20
Value of total sales (Million RMB) 2002 443 572.50 1832.21 30.30 29700
2001 443 466.15 1366.44 30.07 21300
2000 439 410.99 1104.62 30.00 15800
Total number of employees (Hundred) 2002 445 12.22 18.69 0.15 155
2001 445 12.21 18.88 0.13 199.06
2000 443 12.01 18.96 0.11 220.44
Total net assets (Million RMB) 2002 444 197.60 626.99 0.20 8207.21
Firm’s market share 2002 435 11.60 18.44 1 99.46
Firm age 2002 445 15.62 14.33 2 52
Shareholding firms dummy 2002 445 0.26 0.44 0 1
State-owned firms dummy 2002 445 0.23 0.42 0 1
Foreign invested firms dummy 2002 445 0.29 0.46 0 1

30
Table 2 Human Capital Indicators Comparison between Firms with Patents and Without Patents
Data 2000 Data 2002
Firms with
patents
Firms without
patents
Difference Firms with
patents
Firms without
patents
Difference
Number of highly educated workers in firm (Hundred) 5.26 2.14 3.11*** (0.51) 5.22 2.11 3.11*** (0.54)
Years of GM holding the position 5.89 4.68 1.21*** (0.54) 5.28 5.34 -0.058 (0.56)
GM’s postgraduate dummy (=1, postgraduate) 0.26 0.23 0.029 (0.057) 0.38 0.21 0.17*** (0.052)
Management team’s average age 34.95 35.63 -0.67 (0.90) 35.07 35.99 -0.92 (0.62)
Management team’s average schooling 12.62 12.15 0.46*** (0.20) 12.68 12.33 0.34* (0.18)
Standard errors in parentheses: * p< 0.10, **p< 0.05, ***p< 0.01. Two-sided t-test is used to compare the difference.

31
Table 3A Estimation Results (Data 2000)
Dependent variable: Patent applications
in year 2000 OLS NB
Zero-inflated Poisson
Patent
applications
Probability to
not innovate
Panel A: Human Capital Variables (1) (2) (3) (4)
Number of highly educated workers 0.444*** 0.273*** 0.0618*** -0.163***
(Hundred) (0.170) (0.0672) (0.0177) (0.0533)
General Manager’s tenure (years) 0.329** 0.178*** 0.0707*** -0.132***
(0.151) (0.0404) (0.0241) (0.0447)
General Manager’s postgraduate degree 0.893 -0.476 0.215 0.0771
dummy( =1 if has a postgraduate degree) (0.761) (0.366) (0.309) (0.382)
Management team’s average age -0.106 -0.0954*** -0.0383 0.0340
(0.0682) (0.0318) (0.0316) (0.0297)
Management team’s average schooling -0.0563 0.275* 0.0693 -0.0594
(0.158) (0.144) (0.104) (0.128)
Panel B: R&D and Firm Characteristics
Log (average R&D in previous two years) -0.0309 -0.0342 -0.0224 -0.00583
(0.0493) (0.0278) (0.0182) (0.0287)
Market Share 0.0279* 0.0215** 0.0142*** -0.00152
(0.0166) (0.00857) (0.00538) (0.00777)
Firm Size (log (total net assets)) 0.124 -0.130 0.0433 -0.0384
(0.271) (0.160) (0.146) (0.120)
Firm Age (year) 0.00521 0.0106 -0.0100 -0.0100
(0.0134) (0.0142) (0.0128) (0.0125)
Shareholding firms dummy -0.616 -0.180 -0.875* -0.810
(1.228) (0.553) (0.511) (0.556)
State-owned firms dummy -0.567 -0.0505 -0.610 0.0765
(1.004) (0.588) (0.461) (0.578)
Foreign invested firms dummy -0.985 -0.582 -0.289 0.462
(1.089) (0.532) (0.463) (0.526)
Constant 1.629 -2.761 1.863 4.672**
(4.916) (2.524) (2.081) (2.323)
lnalpha 2.216***
(0.159)
Adjusted 𝑹𝟐 0.142
Number of observations 351 351 351 351
Note: (i) Column (4) lists coefficients for predicting excess zeros. (ii) Vuong test of ZIP vs. standard
Poisson: z = 5.03 Pr>z = 0.0000, indicating that the zero-inflated model is preferred. We also tried zero-
inflated negative binomial model, but we cannot reject the null hypothesis of overdispersion test that lnalpha
equal to zero. (iii) City dummies and industry dummies are controlled in all models. (iv) Standard errors in
parentheses: * p< 0.10, **p< 0.05, ***p< 0.01.
32
Table 3B Estimation Results (Data 2002)
Dependent variable: Patent applications
in year 2002 OLS NB
Zero-inflated Poisson
Patent
applicatio
ns
Probability to
not innovate
Panel A: Human Capital Variables (1) (2) (3) (4)
Number of highly educated workers 0.560 0.185*** 0.0407* -0.170***
(Hundred) (0.364) (0.0605) (0.0238) (0.0524)
General Manager’s tenure (years) -0.0143 0.00871 -0.0330 -0.00429
(0.0453) (0.0343) (0.0236) (0.0378)
General Manager’s postgraduate degree 1.003 1.135*** 0.425 -0.705**
dummy( =1 if has a postgraduate degree) (0.687) (0.292) (0.277) (0.343)
Management team’s average age -0.0142 -0.0964*** -0.0323 0.0514
(0.0497) (0.0356) (0.0339) (0.0377)
Management team’s average schooling 0.199 0.238* -0.0435 -0.292**
(0.173) (0.123) (0.106) (0.135)
Panel B: R&D and Firm Characteristics
Log (average R&D in previous two years) 0.0633** 0.0938*** 0.0619** -0.0458
(0.0265) (0.0261) (0.0297) (0.0300)
Market Share 0.0111 0.0237*** 0.00360 -0.0177**
(0.0103) (0.00798) (0.00509) (0.00745)
Firm Size (log (total net assets)) -0.172 -0.0684 0.0440 0.101
(0.344) (0.144) (0.114) (0.145)
Firm Age (year) -0.0214 -0.00413 0.00751 0.0167
(0.0192) (0.0121) (0.0108) (0.0131)
Shareholding firms dummy -0.304 -0.336 0.196 0.710
(0.510) (0.410) (0.319) (0.484)
State-owned firms dummy -1.042 -0.499 -0.546 -0.0568
(0.728) (0.445) (0.457) (0.489)
Foreign invested firms dummy 0.472 -0.768* 0.614 1.505***
(0.718) (0.445) (0.376) (0.473)
Constant -0.0416 -15.39*** 1.196 3.264
(2.936) (3.226) (2.236) (2.800)
lnalpha 1.670***
(0.187)
Adjusted 𝑹𝟐 0.165
Number of observations 398 398 398 398
Note: (i) In column (1) and (2), there are 18 city and 10 industry dummies. However, in column (3) and
(4), to ensure the convergence of zero-inflated Poisson model, we group the 18 city dummies into 6 new
city dummies and 10 industry dummies into 6 new industry dummies. Results are robust to other group
formation. (ii) Column (4) lists coefficients for predicting excess zeros. (iii) Vuong test of zip vs.
standard Poisson: z = 4.69, Pr>z = 0.0000, indicating that the zero-inflated model is preferred. Zero-
inflated negative binomial model is also tried, but we cannot reject the null hypothesis of overdispersion
test that lnalpha equal to zero. (iv)Standard errors in parentheses: * p< 0.10, **p< 0.05, ***p< 0.01.
33
Table 4 IV Estimation Results
I: Year 2000 (Data 2000) II: Year 2002 (Data 2002)
2SLS NB CF 2SLS NB CF
Panel A: Human Capital Variables (1) (2) (3) (4)
Number of highly educated workers 0.485** 0.276*** 0.577* 0.197***
(Hundred) (0.194) (0.0686) (0.317) (0.0453)
General Manager’s tenure (years) 0.206*** 0.205*** -0.0143 0.0160
(0.0757) (0.0613) (0.0433) (0.0347)
General Manager’s postgraduate degree 1.672* -0.122 0.943 1.328***
dummy (=1 if has a postgraduate degree) (0.944) (0.421) (0.603) (0.300)
Management team’s average age -0.0550 -0.0712* -0.0149 -0.100***
(0.0730) (0.0375) (0.0488) (0.0366)
Management team’s average schooling 0.0178 0.0916 0.202 0.270**
(0.182) (0.156) (0.164) (0.125)
Panel B: R&D and Firm Characteristics
Log (average R&D in previous two years) -0.0320 -0.0535 0.0620** 0.0899***
(0.0458) (0.0328) (0.0255) (0.0265)
Market Share 0.0346* 0.0221** 0.0113 0.0258***
(0.0186) (0.00917) (0.00983) (0.00831)
Firm Size (log (total net assets)) -0.0433 -0.164 -0.191 -0.108
(0.227) (0.186) (0.284) (0.138)
Firm Age (year) -0.0138 -0.0152 -0.0211 -0.00370
(0.0174) (0.0155) (0.0186) (0.0124)
Shareholding firms dummy -0.761 0.0121 -0.311 -0.302
(1.624) (0.622) (0.473) (0.419)
State-owned firms dummy -1.641 0.393 -1.059 -0.474
(1.094) (0.770) (0.674) (0.440)
Foreign invested firms dummy -1.171 -0.0451 0.473 -0.921**
(1.395) (0.637) (0.681) (0.430)
Constant 1.693 -0.389 0.128 -16.13***
(5.416) (2.905) (2.803) (3.460)
Residual1 -0.431 -0.484***
(0.589) (0.126)
Residual2 -6.695* -1.802
(3.434) (1.941)
Over-identification Test: Chi2 6.493 0.492
P-value (0.165) (0.781)
lnalpha 1.914*** 1.618***
(0.182) (0.185)
Number of observations 237 237 398 398
Adjusted R-squared 0.178 0.165
Note: (i) Standard errors in parentheses: * p< 0.10, **p< 0.05, ***p< 0.01. (ii) Both number of highly educated
workers and GM’s postgraduate degree are treated as endogenous. We use the corresponding city average
skilled human capital (excluding firm self) and industry average human capital (excluding firm self), number of
applicants for skilled position, and number of weeks skilled positions vacant as instruments for skilled human
capital. But we have no information on applicants for skilled position and number of weeks skilled position
vacant in Data 2002. Thus, in Data 2002, only city average and industry average excluding firm itself are used
as IV. For GM’s postgraduate degree, we use the corresponding city average and industry average excluding
firm itself as IV. (iii) City and industry dummies appear in all models.
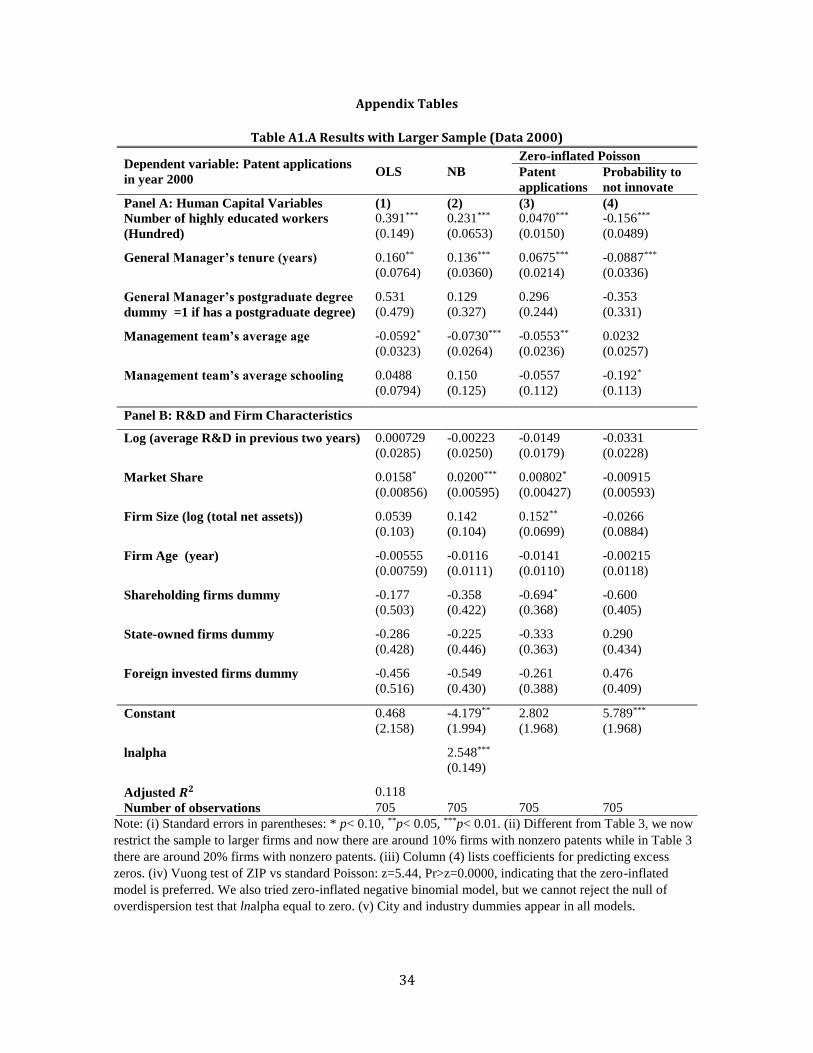
34
Appendix Tables
Table A1.A Results with Larger Sample (Data 2000)
Dependent variable: Patent applications
in year 2000 OLS NB
Zero-inflated Poisson
Patent
applications
Probability to
not innovate
Panel A: Human Capital Variables (1) (2) (3) (4)
Number of highly educated workers 0.391*** 0.231*** 0.0470*** -0.156***
(Hundred) (0.149) (0.0653) (0.0150) (0.0489)
General Manager’s tenure (years) 0.160** 0.136*** 0.0675*** -0.0887***
(0.0764) (0.0360) (0.0214) (0.0336)
General Manager’s postgraduate degree 0.531 0.129 0.296 -0.353
dummy =1 if has a postgraduate degree) (0.479) (0.327) (0.244) (0.331)
Management team’s average age -0.0592* -0.0730*** -0.0553** 0.0232
(0.0323) (0.0264) (0.0236) (0.0257)
Management team’s average schooling 0.0488 0.150 -0.0557 -0.192*
(0.0794) (0.125) (0.112) (0.113)
Panel B: R&D and Firm Characteristics
Log (average R&D in previous two years) 0.000729 -0.00223 -0.0149 -0.0331
(0.0285) (0.0250) (0.0179) (0.0228)
Market Share 0.0158* 0.0200*** 0.00802* -0.00915
(0.00856) (0.00595) (0.00427) (0.00593)
Firm Size (log (total net assets)) 0.0539 0.142 0.152** -0.0266
(0.103) (0.104) (0.0699) (0.0884)
Firm Age (year) -0.00555 -0.0116 -0.0141 -0.00215
(0.00759) (0.0111) (0.0110) (0.0118)
Shareholding firms dummy -0.177 -0.358 -0.694* -0.600
(0.503) (0.422) (0.368) (0.405)
State-owned firms dummy -0.286 -0.225 -0.333 0.290
(0.428) (0.446) (0.363) (0.434)
Foreign invested firms dummy -0.456 -0.549 -0.261 0.476
(0.516) (0.430) (0.388) (0.409)
Constant 0.468 -4.179** 2.802 5.789***
(2.158) (1.994) (1.968) (1.968)
lnalpha 2.548***
(0.149)
Adjusted 𝑹𝟐 0.118
Number of observations 705 705 705 705
Note: (i) Standard errors in parentheses: * p< 0.10, **p< 0.05, ***p< 0.01. (ii) Different from Table 3, we now
restrict the sample to larger firms and now there are around 10% firms with nonzero patents while in Table 3
there are around 20% firms with nonzero patents. (iii) Column (4) lists coefficients for predicting excess
zeros. (iv) Vuong test of ZIP vs standard Poisson: z=5.44, Pr>z=0.0000, indicating that the zero-inflated
model is preferred. We also tried zero-inflated negative binomial model, but we cannot reject the null of
overdispersion test that lnalpha equal to zero. (v) City and industry dummies appear in all models.
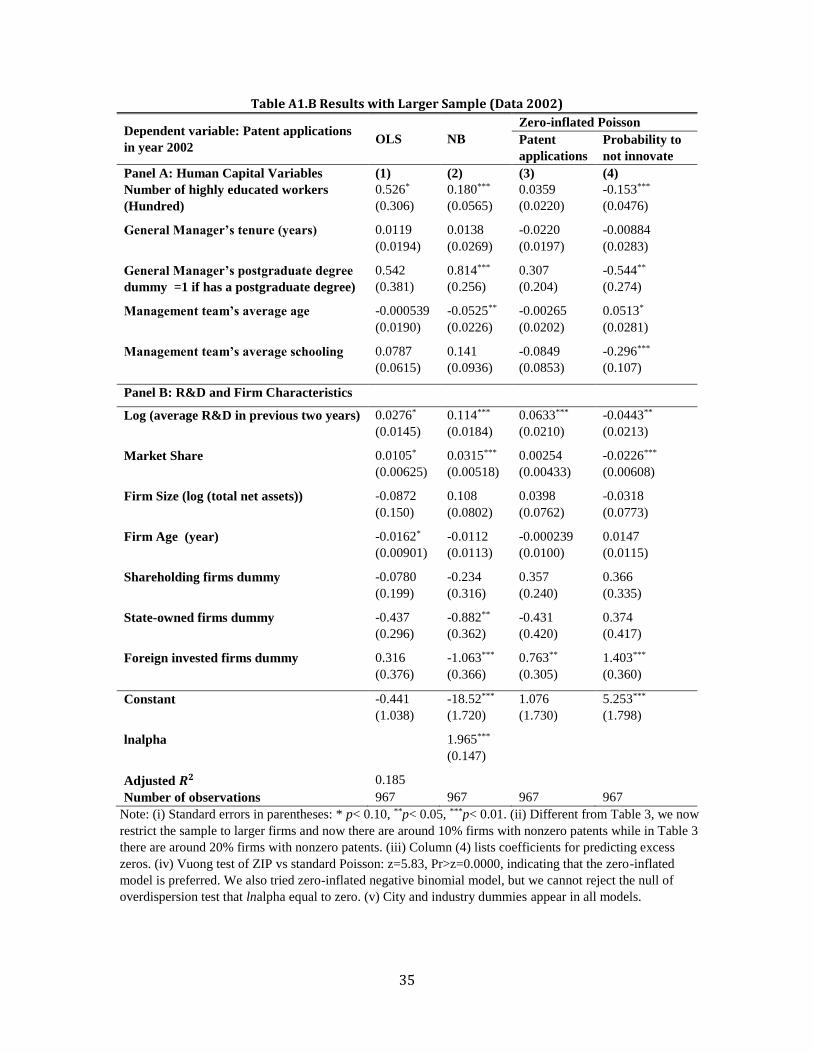
35
Table A1.B Results with Larger Sample (Data 2002)
Dependent variable: Patent applications
in year 2002 OLS NB
Zero-inflated Poisson
Patent
applications
Probability to
not innovate
Panel A: Human Capital Variables (1) (2) (3) (4)
Number of highly educated workers 0.526* 0.180*** 0.0359 -0.153***
(Hundred) (0.306) (0.0565) (0.0220) (0.0476)
General Manager’s tenure (years) 0.0119 0.0138 -0.0220 -0.00884
(0.0194) (0.0269) (0.0197) (0.0283)
General Manager’s postgraduate degree 0.542 0.814*** 0.307 -0.544**
dummy =1 if has a postgraduate degree) (0.381) (0.256) (0.204) (0.274)
Management team’s average age -0.000539 -0.0525** -0.00265 0.0513*
(0.0190) (0.0226) (0.0202) (0.0281)
Management team’s average schooling 0.0787 0.141 -0.0849 -0.296***
(0.0615) (0.0936) (0.0853) (0.107)
Panel B: R&D and Firm Characteristics
Log (average R&D in previous two years) 0.0276* 0.114*** 0.0633*** -0.0443**
(0.0145) (0.0184) (0.0210) (0.0213)
Market Share 0.0105* 0.0315*** 0.00254 -0.0226***
(0.00625) (0.00518) (0.00433) (0.00608)
Firm Size (log (total net assets)) -0.0872 0.108 0.0398 -0.0318
(0.150) (0.0802) (0.0762) (0.0773)
Firm Age (year) -0.0162* -0.0112 -0.000239 0.0147
(0.00901) (0.0113) (0.0100) (0.0115)
Shareholding firms dummy -0.0780 -0.234 0.357 0.366
(0.199) (0.316) (0.240) (0.335)
State-owned firms dummy -0.437 -0.882** -0.431 0.374
(0.296) (0.362) (0.420) (0.417)
Foreign invested firms dummy 0.316 -1.063*** 0.763** 1.403***
(0.376) (0.366) (0.305) (0.360)
Constant -0.441 -18.52*** 1.076 5.253***
(1.038) (1.720) (1.730) (1.798)
lnalpha 1.965***
(0.147)
Adjusted 𝑹𝟐 0.185
Number of observations 967 967 967 967
Note: (i) Standard errors in parentheses: * p< 0.10, **p< 0.05, ***p< 0.01. (ii) Different from Table 3, we now
restrict the sample to larger firms and now there are around 10% firms with nonzero patents while in Table 3
there are around 20% firms with nonzero patents. (iii) Column (4) lists coefficients for predicting excess
zeros. (iv) Vuong test of ZIP vs standard Poisson: z=5.83, Pr>z=0.0000, indicating that the zero-inflated
model is preferred. We also tried zero-inflated negative binomial model, but we cannot reject the null of
overdispersion test that lnalpha equal to zero. (v) City and industry dummies appear in all models.
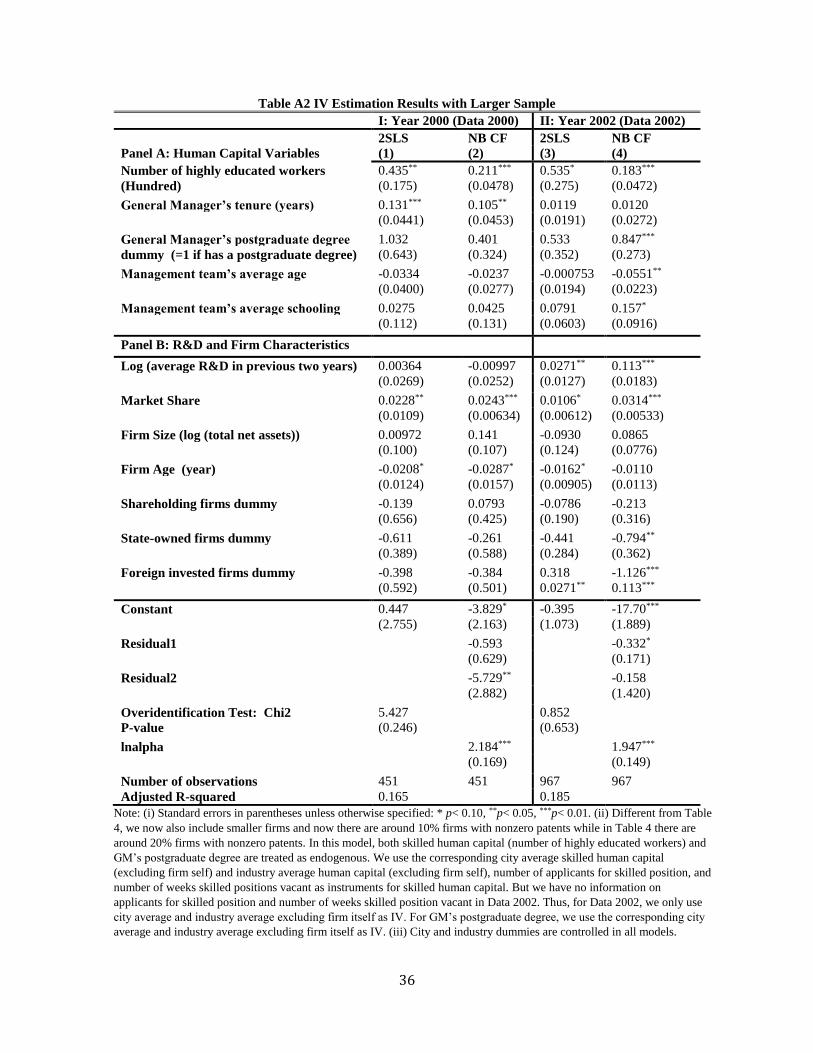
36
Table A2 IV Estimation Results with Larger Sample
I: Year 2000 (Data 2000) II: Year 2002 (Data 2002)
2SLS NB CF 2SLS NB CF
Panel A: Human Capital Variables (1) (2) (3) (4)
Number of highly educated workers 0.435** 0.211*** 0.535* 0.183***
(Hundred) (0.175) (0.0478) (0.275) (0.0472)
General Manager’s tenure (years) 0.131*** 0.105** 0.0119 0.0120
(0.0441) (0.0453) (0.0191) (0.0272)
General Manager’s postgraduate degree 1.032 0.401 0.533 0.847***
dummy (=1 if has a postgraduate degree) (0.643) (0.324) (0.352) (0.273)
Management team’s average age -0.0334 -0.0237 -0.000753 -0.0551**
(0.0400) (0.0277) (0.0194) (0.0223)
Management team’s average schooling 0.0275 0.0425 0.0791 0.157*
(0.112) (0.131) (0.0603) (0.0916)
Panel B: R&D and Firm Characteristics
Log (average R&D in previous two years) 0.00364 -0.00997 0.0271** 0.113***
(0.0269) (0.0252) (0.0127) (0.0183)
Market Share 0.0228** 0.0243*** 0.0106* 0.0314***
(0.0109) (0.00634) (0.00612) (0.00533)
Firm Size (log (total net assets)) 0.00972 0.141 -0.0930 0.0865
(0.100) (0.107) (0.124) (0.0776)
Firm Age (year) -0.0208* -0.0287* -0.0162* -0.0110
(0.0124) (0.0157) (0.00905) (0.0113)
Shareholding firms dummy -0.139 0.0793 -0.0786 -0.213
(0.656) (0.425) (0.190) (0.316)
State-owned firms dummy -0.611 -0.261 -0.441 -0.794**
(0.389) (0.588) (0.284) (0.362)
Foreign invested firms dummy -0.398 -0.384 0.318 -1.126***
(0.592) (0.501) 0.0271** 0.113***
Constant 0.447 -3.829* -0.395 -17.70***
(2.755) (2.163) (1.073) (1.889)
Residual1 -0.593 -0.332*
(0.629) (0.171)
Residual2 -5.729** -0.158
(2.882) (1.420)
Overidentification Test: Chi2 5.427 0.852
P-value (0.246) (0.653)
lnalpha 2.184*** 1.947***
(0.169) (0.149)
Number of observations 451 451 967 967
Adjusted R-squared 0.165 0.185
Note: (i) Standard errors in parentheses unless otherwise specified: * p< 0.10, **p< 0.05, ***p< 0.01. (ii) Different from Table
4, we now also include smaller firms and now there are around 10% firms with nonzero patents while in Table 4 there are
around 20% firms with nonzero patents. In this model, both skilled human capital (number of highly educated workers) and
GM’s postgraduate degree are treated as endogenous. We use the corresponding city average skilled human capital
(excluding firm self) and industry average human capital (excluding firm self), number of applicants for skilled position, and
number of weeks skilled positions vacant as instruments for skilled human capital. But we have no information on
applicants for skilled position and number of weeks skilled position vacant in Data 2002. Thus, for Data 2002, we only use
city average and industry average excluding firm itself as IV. For GM’s postgraduate degree, we use the corresponding city
average and industry average excluding firm itself as IV. (iii) City and industry dummies are controlled in all models.