understanding the determinants of corporate social
TRANSCRIPT

Kennesaw State UniversityDigitalCommons@Kennesaw State University
Dissertations, Theses and Capstone Projects
10-1-2013
Understanding the Determinants of CorporateSocial Disclosure Strategies: An Examination ofFirms' Use of GRI GuidelinesJames Michael Simmons Jr.Kennesaw State University
Follow this and additional works at: http://digitalcommons.kennesaw.edu/etdPart of the Marketing Commons
This Dissertation is brought to you for free and open access by DigitalCommons@Kennesaw State University. It has been accepted for inclusion inDissertations, Theses and Capstone Projects by an authorized administrator of DigitalCommons@Kennesaw State University.
Recommended CitationSimmons, James Michael Jr., "Understanding the Determinants of Corporate Social Disclosure Strategies: An Examination of Firms'Use of GRI Guidelines" (2013). Dissertations, Theses and Capstone Projects. Paper 600.

UNDERSTANDING THE DETERMINANTS OF CORPORATE SOCIAL DISCLOSURE STRATEGIES: AN EXAMINATION OF FIRMS’ USE OF GRI
GUIDELINES by
James Michael Simmons, Jr.
A Dissertation
Presented in Partial Fulfillment of Requirements for the Degree of
Doctor or Business Administration in the
Coles College of Business Kennesaw State University
Kennesaw, GA 2013

ii
Copyright by James Michael Simmons, Jr.
2013


v
ACKNOWLEDGEMENTS
I would like to take this opportunity to acknowledge people who have helped
make this educational journey possible. My path has been strongly influenced by family,
teachers, co-workers and friends.
I would first like to thank my parents. From early childhood, they instilled an
intellectual curiosity that propels me still today. Without that curiosity, this research
would not have been possible. They also shared the importance of perseverance and hard
work. My mom, who has been deceased for over 20 years, exemplified perseverance
and an unwillingness to give up even in difficult circumstances. My dad demonstrated
the importance of hard work and commitment. His influence not only helped shaped me
as a person, but his ongoing encouragement has been invaluable through this journey. He
has not only served as chief encourager, but he has also helped serve as my copy editor.
Outside of my committee, he knows more about my research than anyone else and this
has been something special to share. My step-mother, sister, brother-in-law and nephew
have also provided strong encouragement.
I would also like to thank my dissertation committee and others at Kennesaw
State that have helped in this journey. Vicky and Bodo have provided insight that helped
guide this research and challenged me to always ask the right questions. They have also
provided significant encouragement that has kept me focused. Brian also has helped
make this document better with his feedback on both the proposal and the final

vi
dissertation. Others at KSU who have been important include Joe Hair and the other
members of Cohort 2.
There are several others I would also like to acknowledge. Bob Mackoy and
Chuck Williams from Butler University helped guide me in my choice of doctoral
programs. They have also served as an important sounding board through this process.
My longtime friend, Sandy Clark, has helped keep me organized and functioning while
trying to work full-time. She has also helped encourage me and let me never lose my
focus. Finally, I must recognize my all of my friends and colleagues I work with that
have also provided support along the way.

vii
ABSTRACT
Understanding the Determinants of Corporate Social Disclosure Strategies: An Examination of Firms’ Use of GRI Guidelines
by James Michael Simmons Jr.
With the evolution of CSR reporting practices and the introduction and
widespread adoption of the GRI Guidelines, this research sought to understand the factors
that determine a company’s CSR disclosure strategy. It examined the relationship
between a four-dimensional model of reporting determinants and a firm’s CSR disclosure
strategy. The proposed model drew from legitimacy, institutional and stakeholder
theories and included the following constructs: non-financial corporate characteristics,
the firm’s financial performance, the involvement of the firm’s stakeholders and
environmental turbulence. The firm’s CSR disclosure strategy was represented by the
GRI application level chosen by the firm and the presence or absence of third party
assurance. The study found environmental turbulence to be the only strongly predictive
construct. However, this construct and other predictive variables that were shown to be
related help strengthen understanding of disclosure strategy. Given these findings, four
key concepts emerge that firms must consider in developing their CSR disclosure
strategy. These include stakeholder salience, environmental turbulence, mimetic
behavior, and institutional norms.

viii
Table of Contents
Title Page………………………………………………………………………………..…i
Copyright Page……………………………………………………………………………ii
Signature Page……………………………………………………………………………iii
Acknowledgement………………………………………………………...........................v
Abstract……………………………………………………………..................................vii
Table of Contents………………………………………………………………………..viii
List of Tables……………………………………………………………………………..xi
Chapter 1 – Introduction…………………………………………………………………..1
Conceptual Model………………………………………………………………..10
Chapter 2 - Literature Review……………………………………………………………12
Theoretical Overview…………………………………….....................................12
Legitimacy Theory……………………………….........................13
Stakeholder Theory………………………………………………15
Institutional Theory………………………………………………16
CSR Reporting: A Changing Landscape………………………………………...18
CSR Disclosure Research……………………...………………………...19
Quantity of CSR Disclosure Research…………………………………...21
Time Lag………………………………………………...……………….24
ix
A Narrow Band of Research……………………………………………..25
The Relevance of CSR Disclosure to Marketing………………………...26
Types of Research...………………………………………..….............................28
GRI Guidelines…………………………………………………………………..41
Hypothesis Development………………………………………...........................44
Conceptual Model and Hypotheses……………………………………...44
Non-Financial Characteristics of the Firm…………….............................45
Financial Performance of the Firm………………………………………50
Stakeholder Involvement………………………………...........................52
Environmental Turbulence…………………………….............................56
Chapter 3 – Methodology………………………………………………..........................60
Executive Interviews……………………………………..........................60
Quantitative Study……………………………………….........................61
Sample……………………………………………………………………62
Analytical Approach……………………………………..........................64
Variable Delineation……………………………………..........................64
Chapter 4 – Data Analysis and Findings...……………………………………………….75
Descriptive Statistics……………………………………..........................79
Dependent Variables……………………………………..........................79
Explanatory Variables…………………………………............................80
Analytical Approach……………………………………..........................93
Logistic Regression Analysis…………………………………………….93
Goodness of Fit Statistics………………………………..........................94

x
Tests of Hypotheses……………………………………………………...95
Summary………………………………………………………………..100
Chapter 5 - Conclusions, Limitations and Future Research……………………………102
Non-Financial Characteristics of the Firm……………………………...103
Financial Performance of the Firm……………………..........................106
Stakeholder Involvement……………………………………………….107
Environmental Turbulence……………………………...........................111
Limitations……………………………………………………...........................115
Future Research………………………………………………...........................116
Implications…….……………………………………………………………….118
References……………………………………………………………............................123
Appendices……………………………………………………………………………...140

xi
LIST OF TABLES
.
1 CSR Disclosure Research………………………………………………………..21
2 Performance Research Overview………………………………………………...23
3 Total Disclosure and Performance Research…………………….........................25
4 Top 10 Journals for CSR Disclosure Research…………………..........................26
5 Countries in the N100……………………………………………………………43
6 Number of Records with Application Levels in the GRI Registry………………63
7 Total Population Distribution of 2011 GRI Reports Across Application
Levels……………………………………….............................................63
8 High Profile Industry Sectors…………………………………………....……….73
9 Application Level Distribution…………………………………..........................79
10 Assurance Determination Distribution……………...…………………………...80
11 Descriptive Statistics for Non-Financial Corporate Characteristics…………….81
12 Descriptive Statistics for Financial Performance of the Firm…………………...82
13 Descriptive Statistics for Stakeholder Involvement……………………………..83
14 Descriptive Statistics for Environmental Turbulence……………………………85
15 Descriptive Statistics for Control Variables…………….…………………….....86 16 Correlation Matrix…………………………………………………….………....87 17 Goodness of Fit Scores – Overall Model………………………...........................94 .

xii
18 Application Level Model Parameter Estimates…………………………..……...96 19 Assurance Model Parameter Estimates……...…………………………..….…...96 20 Descriptive Statistics………………………………………………….…………98 21 Goodness of Fit Scores…………………………………………………………99

1
CHAPTER 1
Introduction An increasing number of companies are voluntarily disclosing their social,
environmental and economic impact (Chen and Bouvain, 2009). With corporate social
responsibility (CSR) reporting, companies can demonstrate their attempts to meet
society’s expectations (Gray, Owen & Maunders, 1988; Neu, Warsame & Pedwell, 1998;
Yongvanich & Guthrie, 2006). They are also able to show stakeholders that their firms
are committed to social responsibility (Gamerschlag, Moller & Verbeeten, 2011;
Hubbard, 2011; Nikolaeva & Bicho, 2011).
CSR disclosures provide the firm with a powerful marketing tool that can be used
to engage with stakeholders and enhance both the firm’s reputation and its brand
(Bebbington, Larrinaga-Gonzalez & Moneva-Abadıa, 2008; Luo & Bhattacharya 2006;
Nikolaeva & Bicho, 2011; Sweeney & Coughlan, 2008). The issue firms face, however,
is that stakeholders are often unaware of the CSR initiatives companies undertake (Sen,
Bhattacharya & Korschun, 2006). When CSR initiatives are reported, they have been
shown to have a favorable effect on how stakeholders think, feel and act toward a
company and its brand (Hoeffler & Keller, 2002; Sen et al., 2006). Consumer awareness
of a company’s approach to CSR not only helps the firm be viewed as socially
responsible, it also makes consumers more likely to purchase from the company (Sen et
al., 2006).

2
CSR reporting can also help the firm shape its reputation in the market place (Sen
et al., 2006). It can provide an opportunity for companies to engage stakeholders in an
ongoing dialogue (GRI, 2012; Nikolaeva & Bicho, 2011). By sharing the firm’s CSR
initiatives and disclosing its social, environmental and economic impact, marketers are
able to engage with multiple stakeholder groups, build lasting relationships and thus
create value for the firm (Bhattacharya & Korschun 2008; Ferrell, Gonzalez-Padron,
Hult, & Maignan. 2010; Hult, Mena, Ferrell & Ferrell 2011).
While CSR reporting is relevant to marketers and has gained popularity within the
business community, scholars have shown far less interest in the topic (Chen & Bouvain,
2009; Ziek, 2009). In an order to gain a clear understanding of CSR disclosure/reporting,
ABI/Inform was used to examine the literature associated with a robust list of key terms
(Cronin et al., 2011). This review of the literature showed that CSR disclosure research
started later and increased at a slower pace than that which focused on CSR performance.
Additionally, this research has been carried out primarily by non-marketing scholars and
limited to a narrow range of topics (Nikolaeva & Bicho, 2011; Reverte, 2009). For
example, descriptive research was initially conducted in order to understand corporate
reporting practices (Gray, Kouhy & Lavers, 1995; Wiseman, 1982). The findings from
that research led scholars to examine the relationship between a firm’s social and
financial performance and its CSR disclosures (Ingram & Frazier, 1980; Reverte, 2009;
Roman, Hayibor & Able; 1999). Ultimately, CSR disclosure research focused on
identifying the determinants of CSR reporting (Boesso & Kumar, 2007; Cormier &
Magnan, 1999; Roberts, 1992; Reverte, 2009). Generally, research has produced
inconsistent results across studies or results with limited generalizability (Adams &

3
Whelan, 2009; Parker, 2005). However, two competing theoretical models emerged from
the literature to help explain the determinants of CSR reporting (Ullmann, 1985; Adams,
2002).
The first model that was proposed by Ullmann (1985) relied on stakeholder theory
to help explain the relationship between a firm’s social and financial performance and the
quantity and quality of its social disclosure. Determinants were clustered into one of
three factors that included the firm’s strategic posture, its financial performance and
stakeholder power. This model not only suggested a potential explanation for the
relationship between performance and disclosure, it also encouraged further research into
other possible determinants (Ullmann 1985).
The second model, proposed by Adams (2002), focused on different types of
contextual factors that included corporate characteristics, general contextual factors and
internal factors. Corporate characteristics included variables such as size and industry
membership. General factors included variables that reflect the influence of culture,
media, government and other stakeholders. Internal factors focused on the firm’s
structure and decision-making processes (Adams, 2002).
While these models have been useful, both the environment in which disclosures
are made and the process for reporting has changed dramatically since they were
introduced. In more recent research, scholars have also pointed out potential issues with
the theoretical framework and the methods that have been used. When taken together,
these factors raise questions about whether the models proposed by Ullmann (1985) and
Adams (2002) are sufficient to explain the determinants of CSR reporting.
4
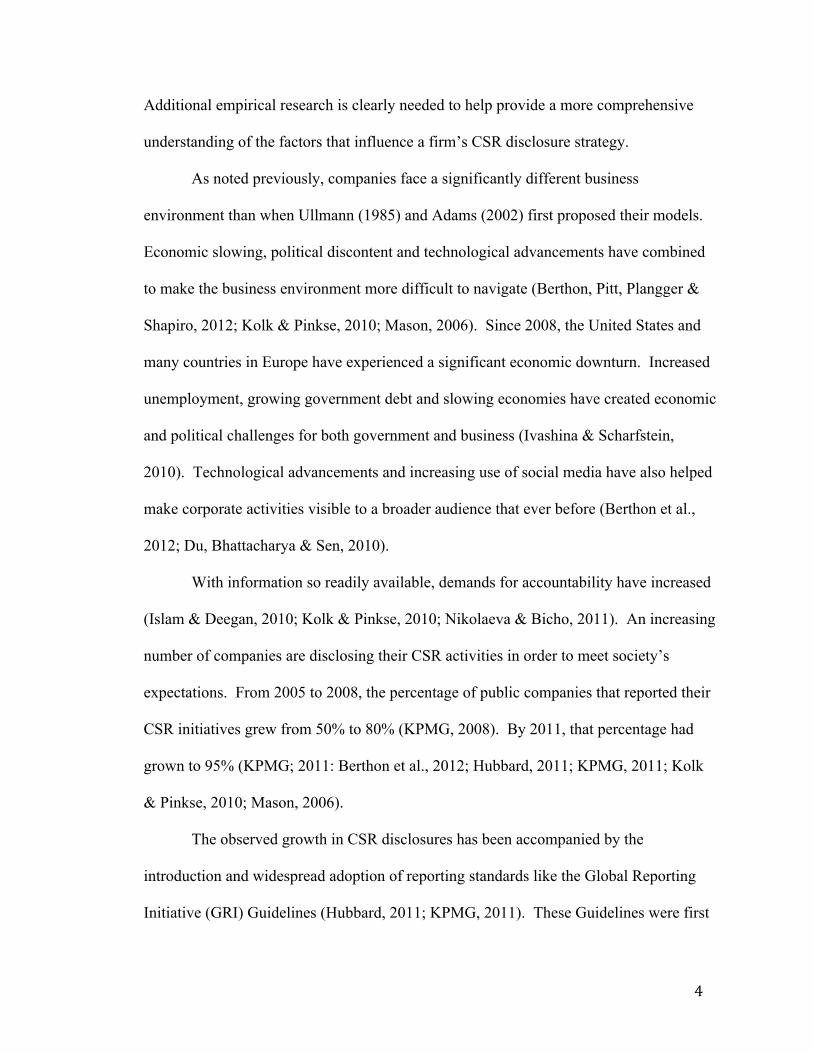
Additional empirical research is clearly needed to help provide a more comprehensive
understanding of the factors that influence a firm’s CSR disclosure strategy.
As noted previously, companies face a significantly different business
environment than when Ullmann (1985) and Adams (2002) first proposed their models.
Economic slowing, political discontent and technological advancements have combined
to make the business environment more difficult to navigate (Berthon, Pitt, Plangger &
Shapiro, 2012; Kolk & Pinkse, 2010; Mason, 2006). Since 2008, the United States and
many countries in Europe have experienced a significant economic downturn. Increased
unemployment, growing government debt and slowing economies have created economic
and political challenges for both government and business (Ivashina & Scharfstein,
2010). Technological advancements and increasing use of social media have also helped
make corporate activities visible to a broader audience that ever before (Berthon et al.,
2012; Du, Bhattacharya & Sen, 2010).
With information so readily available, demands for accountability have increased
(Islam & Deegan, 2010; Kolk & Pinkse, 2010; Nikolaeva & Bicho, 2011). An increasing
number of companies are disclosing their CSR activities in order to meet society’s
expectations. From 2005 to 2008, the percentage of public companies that reported their
CSR initiatives grew from 50% to 80% (KPMG, 2008). By 2011, that percentage had
grown to 95% (KPMG; 2011: Berthon et al., 2012; Hubbard, 2011; KPMG, 2011; Kolk
& Pinkse, 2010; Mason, 2006).
The observed growth in CSR disclosures has been accompanied by the
introduction and widespread adoption of reporting standards like the Global Reporting
Initiative (GRI) Guidelines (Hubbard, 2011; KPMG, 2011). These Guidelines were first

5
introduced in 1999 and have been revised three times with the current version, the GRI’s
G3 Guidelines, released in 2006. The G3 Guidelines provide companies with a way to
communicate to stakeholders that certain requirements have been met (Gamerschlag et
al., 2011; GRI, 2012; Moneva, Archel & Correa, 2006).
Before these standards were developed, there was a lack of uniformity and
disclosures often failed to report information that stakeholders found useful. The
developers of the GRI sought to change this by introducing standards that would help
guide firms in knowing what to report. The guidelines’ creators also sought to make
reporting easier to review and compare (Nikolaeva & Bicho, 2011; Willis 2003). To
achieve this, they relied on broad stakeholder input to develop key performance
indicators. These indicators focus on economic, environmental and social factors, which
are commonly referred to as the Triple-Bottom Line (Elkington, 1994, 1998; GRI, 2012;
Nikolaeva & Bicho, 2011).
The GRI performance indicators provide more extensive coverage than any of the
other reporting standards (Perrini, 2005). The framework includes 50 core performance
indicators that describe the firm’s economic, environmental and social impact and 28
additional indicators that focus on areas like human rights, labor economic development,
community, investment, product responsibility, air and water quality, energy, waste and
corruption (Hubbard, 2011; Perrini 2005). Given their breadth, the guidelines not only
help improve the usefulness of reporting, they also provide greater transparency about the
firm’s operation. They help assure stakeholders that both the firm and its disclosures can
be viewed as legitimate (Arviddson, 2010; GRI, 2012). As a result, the GRI Guidelines
have become the most widely adopted reporting standard by firms globally with

6
approximately 80% of the Global 250 currently using them (Chen & Bouvain, 2009;
KPMG, 2011; Nikolaeva & Bicho, 2011; Waddock & Googins, 2011). They have also
been endorsed by a broad range of stakeholders such as the World Economic Forum, the
Organization for Economic Cooperation and Development and the European Union (Ho
& Taylor, 2007).
While GRI provides guidance, firms must still make several strategic decisions in
determining their CSR disclosure strategy. First, they must determine how transparent
they wish to be in their reporting (GRI, 2012). The G3 Guidelines include three
application levels – A, B and C - that communicate to stakeholders that a certain level of
reporting has been undertaken. These application levels are self-declared and differ in
their reporting requirements. For instance, organizations that declare a C application
level report on a minimum of 10 core performance indicators including at least one from
each category: social, economic and environment. Those who declare a B application
level must report a minimum of 20 core performance indicators and must report on at
least one from the economic, environment, labor practices & decent work, human rights,
society, product responsibility categories. Those declaring an A application level must
report on all 50 core performance indicators.
In addition to choosing an application level, the firm must also determine whether
or not to pursue third party assurance (GRI, 2012; Moneva et al., 2006). The process
helps verify that both the report and the method used to create it are well documented,
evidence-based, balanced and consistent with the GRI Reporting Framework (GRI, 2012;
O’Dwyer, 2001). It also helps reinforce the credibility and the legitimacy of both the
firm and its reporting (Dhaliwal, Radhakrishnan, Tsang & Yang, 2012). Those firms that

7
utilize third party assurance may add a plus sign to their application level to acknowledge
having gone through the process. The combination of the firm’s chosen GRI application
level and its level of assurance signal the firm’s legitimacy to stakeholders, which is
consistent with both stakeholder and legitimacy theories.
Besides the issues noted thus far, scholars have also suggested several items that
should be examined. First, a larger number of stakeholders are known to influence
society’s expectations and encourage greater corporate accountability (Fiss & Zajac,
2006; Islam & Deegan, 2010; Nikolaeva & Bicho, 2011). This would suggest that there
is value in examining multiple stakeholders. Ullmann (1985) focused on the shareholder
while Adams (2002) referenced a broader set of stakeholders. These included
shareholders, employees, media and non-governmental organizations. This broader
perspective is evident in studies by Chen and Bouvain (2009), Belal and Roberts (2010),
Shinkle and Spencer (2012) and Adams and Whelan (2009). Other studies have shown
that government and academia have begun to play a more significant institutional role
(Adams & Whelan, 2009; Cormier, Gordon & Magnan, 2004). Given the literature, a
multi-stakeholder perspective is required.
Second, past research has suggested the need for a broader theoretical framework
to explain CSR reporting strategies. While legitimacy theory, stakeholder theory and
institutional theory have all been mentioned frequently in the literature (Gray et al., 1995;
Milne & Patten, 2002; O’Dwyer, 2003; Oliver, 1991), no singular theory has been used
effectively to explain the determinants of CSR disclosure (Cormier et al., 2005). Several
scholars, however, have suggested that stakeholder theory and legitimacy theory can
work together to provide a more comprehensive explanation of a firm’s CSR disclosure

8
strategy (Adams & Whelan, 2009; Deegan & Blomquist, 2006; Gray et al., 1995). Others
have suggested that legitimacy theory must be used with stakeholder and institutional
theories to provide a comprehensive explanation (Adams & Whelan, 2009; Deegan &
Blomquist, 2006; Gray et al., 1995).
Finally, researchers have used content analysis to evaluate the quantity and
quality of CSR disclosure, but it has some noteworthy limitations (Deegan & Gordon,
1996; Gray et al., 1995; Guthrie et al., 2004; Guthrie & Farneti, 2008; Guthrie & Parker,
1989). This method allows researchers to quantify the amount of key information
included in CSR disclosures (Gamerschlag et al., 2011; Guthrie et al., 2004). However,
the reliability of the analysis is dependent on the ability of raters to consistently apply a
set of rules (Ingram & Frazier, 1980). The number of firms that may be examined may
also be limited because of the amount of time it takes to carry out the analysis
(Gamerschlag et al., 2011).
When Ullmann (1985) and Adams (2002) first introduced their models, they may
have been sufficient to explain the determinants of CSR disclosure strategy. However,
multiple factors have been discussed that would suggest this may no longer be true. As
noted here, scholars have pointed out potential issues with the theoretical framework and
methods that have been used in past CSR disclosure research. When combined with the
introduction of reporting standards and a turbulent business environment, it is clear that
additional empirical research is needed. The purpose of this study is to address the issues
that have been raised here and help provide a more comprehensive understanding of the
factors that influence a firm’s CSR disclosure strategy.
Unlike other studies, this research will rely on a broad theoretical framework that

9
includes stakeholder theory, legitimacy theory and institutional theory. When used
together, these theories have a complementary effect. This is exemplified in a new
conceptual model that can be used to explain the determinants of CSR disclosure. The
four-dimensional model, shown in Figure 1 builds upon previous research by Ullmann
(1985) and Adams (2002). This model adapts the dimensions from the original models
based on research findings and environmental changes that have taken place since their
introduction. In doing so, it highlights the role that both the stakeholder and the
institutional environment have in shaping the firm’s CSR disclosure strategy. This
represents a broader role for both the stakeholder and for economic and political factors
that result in environmental turbulence. The model includes 4 constructs –non-financial
corporate characteristics, the firm’s financial performance, the involvement of the firm’s
stakeholders and environmental turbulence.
This research also adds to our knowledge of CSR reporting in several additional
ways. First, it redefines the concept of CSR disclosure strategy to include the choices
firms face given the growing use of the GRI guidelines. In doing so, it examines the
firm’s chosen GRI application level and its level of assurance as unique dependent
variables. Second, rather than relying on the commonly used method of content analysis;
this research utilizes a registry of global publicly traded firms that have reported using the
G3 Guidelines. Third, it increases the awareness of CSR reporting amongst marketers.
This is critical because marketers are charged with responsibility for monitoring the
external environments, managing the firm’s reputation, protecting critical brand assets
and engaging with stakeholders who are critical to the firm (Nikolaeva & Bicho, 2011).

10
Figure 1 Conceptual Model
Figure 1 Conceptual Model
!!!!!!
!!
!!!!!
!
Non"Financial!Corporate(
Characteristics!
Stakeholder+!Involvement!
Environmental!Turbulence!
GRI$Disclosure$Strategy!
Firm!Performance!
!

11
While marketing scholars have examined the theoretical and managerial implications of
CSR, the role of CSR disclosures is a new area worthy of exploration (Nikolaeva &
Bicho, 2011).
The literature review that follows provides a clear picture of prior research and
uses theory to help put past results into context. It also illuminates gaps in knowledge
and shows areas related to CSR disclosure strategies that require further study. Finally, it
helps demonstrate the theoretical rationale for the model and its related constructs that are
proposed here. Ultimately, the literature review provides a strong foundation for this
study and future research.

12
CHAPTER 2
Literature Review
Theoretical Overview
Researchers have used a broad theoretical framework to explain CSR reporting
strategies. While legitimacy theory, stakeholder theory and institutional theory have all
been mentioned frequently in the literature (Gray et al., 1995; Milne & Patten, 2002;
O’Dwyer, 2003; Oliver, 1991), no one theory, when used alone, effectively explains a
firm’s CSR disclosure strategy (Cormier et al., 2005). Several scholars, however, have
suggested that stakeholder theory and legitimacy theory can work in tandem to provide a
more comprehensive explanation (Adams & Whelan, 2009; Deegan & Blomquist, 2006;
Gray et al., 1995).
Others have suggested that institutional theory can also be useful in explaining the
adoption and use of frameworks for reporting CSR initiatives (Chen & Bouvain, 2009;
Nikolaeva & Bicho, 2011) since the theory focuses on the way in which choices are
shaped, mediated and channeled by an organization’s rules, norms and beliefs (Hoffman,
1999). CSR reporting and other actions of the firm are guided by a common institutional
understanding that drives strategic choices. Like stakeholder and legitimacy theories,
institutional theory can be used to describe corporate strategies and practices across a
series of industries and countries. As a result, all three theories will be drawn upon to aid
in explaining the determinants of CSR disclosure strategy. The following sections

13
highlight the gaps in each theory when used singularly to explain CSR disclosure
strategies. They also show the synergy that is created when multiple theories are used
together.
Legitimacy Theory
Legitimacy theory asserts that a social contract exists between business and
society that forces a firm to behave in a socially desirable manner (Gray et al., 1988). By
operating within society’s norms and expectations, the firm receives either passive or
active support for its operations (Guthrie & Parker, 1989; O’Dwyer, 2003; Suchman,
1995). However, those norms and expectations may change over time and create
incongruity between a firm’s values and those of society. For the firm to maintain
legitimacy, it must be cognizant of changes to the environment and be ready to engage in
a legitimization process (Ashforth & Gibbs, 1990; Islam & Deegan, 2010).
In order to maintain organizational legitimacy with society, an organization must
engage in communication with its various stakeholders (Gray et al., 1996; Suchman,
1995). CSR reporting is an important example of this type of communication
(Arvidsson, 2010; Deegan, 2002; O’Donovan, 2002). Ultimately, disclosing CSR-related
activities and engaging in the assurance process serves to signal legitimacy and helps a
company manage its corporate reputation (Bebbington, Larrinaga-Gonzalez & Moneva-
Abadıa, 2008; Fombrun & Gardberg, 2000; Gray et al., 1995).
The voluntary disclosure of a firm’s CSR activities to both internal and external
stakeholders can generate dialogue and result in acknowledgement and/or approval of the
organization’s objectives and strategies. Voluntary CSR reporting can help repair, attain
or maintain both organizational and system wide legitimacy (Ader, 1995; Neu, Warsame

14
& Pedwell, 1998). As a result of such disclosures, a firm is perceived as socially
responsible (Maignan, Ferrell, & Hult, 1999). Large companies are typically more
visible as a result of their size and impact, which leads to increased public attention and
concerns about the firm’s legitimacy (Dowling & Pfeffer, 1975). These concerns often
lead society to have increased expectations of responsible behavior and expectations that
the firm disclose CSR activities also tend to increase (Arvidsson, 2010). Yet, the
disclosure of too much CSR information, commonly referred to as the “self-promoters
paradox,” can harm an organization’s credibility (Ashforth & Gibbs, 1990; Morsing &
Schultz, 2006).
In one study that used legitimacy theory as its underlying framework, O’Dwyer
(2002) examined the motives for CSR reporting among 29 senior executives in Irish
companies. The perspectives of these senior executives suggested that companies,
particularly those in environmentally sensitive sectors, initially engaged in some form of
CSR as a form of reaction to localized external pressures that threatened the firm’s
legitimacy. While the actions of the executives and their firms were motivated initially
by legitimacy concerns, disclosure reporting was ultimately deemed unlikely to lead to
the successful attainment of a legitimacy state. Hence, many of the reporting companies
in the study neglected to engage consistently in CSR disclosure due to a perceived
negative and suspicious reaction among various report stakeholders.
Legitimacy theory alone cannot explain the motives for reporting. While the
theory describes the pursuit of legitimacy as the major aim of CSR reporting, it fails to
fully explain the role of stakeholders or to distinguish the stakeholders, which may have
more influence. The theory also does not explain the role that institutional norms, values

15
and beliefs may have (Hoffman, 1999; Jackson & Apostolakou, 2010; Nikolaeva &
Bicho, 2011). As a result, legitimacy theory must be used with stakeholder and
institutional theories to provide a comprehensive explanation (Adams & Whelan, 2009;
Deegan & Blomquist, 2006; Gray et al., 1995).
Stakeholder Theory
Stakeholder theory not only influences a firm’s approach to social responsibility,
it also guides the way a firm reports its activities (Gray et al., 1995). The theory’s
influence is evident in the way its foundational pillars can be extended to CSR reporting.
In the course of operating, firms interact with multiple stakeholders (Clarkson, 1995;
Freeman, 1984; Fiss & Zajac, 2006; Hult et al., 2011). This stakeholder interaction
creates greater risk for the firm, which requires managers to be more comprehensive in
reporting. The content of the reports then reflects the stakeholder’s influence on the
firm’s strategy and its allocation of resources (Jones, 1995; Hill & Jones, 1992). Because
there is often incongruity among stakeholders, the firm focuses on those who are believed
to have the greatest salience (Freeman, 1984; Fiss & Zajac, 2006; Frooman, 1999; Hult et
al., 2011; Jones, 1995; Mitchell, Agle & Wood, 1997).
Stakeholder salience is determined by the attributes of stakeholder power to
influence the firm, the legitimacy of the stakeholder relationship with the firm and the
urgency of the stakeholder’s claim. Managers use some combination of these attributes
to prioritize stakeholders of interest. Disclosure reporting efforts often focus on the
expectations of stakeholders, with the disclosure report serving as the avenue for a formal
dialogue between the stakeholder and the firm. Reporting efforts are often made more
complicated because of the dynamic and subjective nature of these attributes (Milne &

16
Patten, 2002). Ultimately, stakeholder theory can be useful in guiding a firm’s CSR
reporting efforts as managers seek to meet the expectations of a variety of stakeholders
(Donaldson & Preston, 1995; Mitchell et al., 1997).
While stakeholder theory helps identify and prioritize stakeholders for CSR
reporting, it does not provide a robust explanation as to why CSR reporting is necessary.
The theory focuses on the expectations of stakeholders as the primary motivation for
reporting. It could be argued that these expectations are synonymous with legitimacy
theory. However, these are the expectations of only a select group of stakeholders who
are selected based on their influence, legitimacy and the urgency of their claim.
Legitimacy, on the other hand, involves a broader group and relies on society’s norms,
values and beliefs (Hoffman, 1999; Jackson & Apostolakou, 2010; Nikolaeva & Bicho,
2011). Therefore, stakeholder theory cannot be used alone to explain the determinants of
CSR disclosure strategy.
Institutional Theory
Institutional theory suggests that firms operate in environments that are shaped by
a system of norms, values and beliefs (Hoffman, 1999; Jackson & Apostolakou, 2010;
Nikolaeva & Bicho, 2011). This context may also be influenced by disruptive events like
economic or political turbulence (Hoffman, 1999). For companies who seek legitimacy,
these factors can create institutional pressure to adapt policies and practices. As a result,
companies often exhibit mimetic behaviors (Milne & Patten, 2002). They are also more
likely to justify their decisions based on the actions other companies have taken
(Nikolaeva & Bicho, 2011).
Prior research has examined the effect of institutional factors on the CSR

17
practices of companies across industries and countries. An analysis of firms in Western
Europe showed national institutions to be a strong predictor of firm level CSR practices.
Industrial sectors were also shown to be a strong predictor. These findings support the
idea that CSR practices are more likely to be adopted when they are recognized as
institutionalized norms (Jackson & Apostolakou, 2010).
Empirical evidence has also suggested that the institutional environment plays a
pivotal role in influencing companies reporting practices. CSR disclosures provide an
important vehicle for companies to communicate legitimacy. The disclosures also
provide a means by which to signal to stakeholders that the companies have sound CSR
activities. As a result, CSR reporting is a valuable tool to express concern for society and
demonstrate legitimacy (Othman, Darus & Arshad, 2011).
Not only have institutional pressures been shown to be strong determinants of
CSR disclosures, they have also been able to play a role in firms’ adoption of the GRI
standards. Research has shown that firms that are more attuned to the environment are
more sensitive to institutional pressures and are more likely to respond through increased
disclosure. Firms that are aware of institutional influences are also better able to
strategically manage the resulting opportunities and threats (Nikolaeva & Bicho, 2011).
While institutional theory can contribute to our understanding of CSR reporting, it
is insufficient when used by itself to explain disclosure practices. Because the theory
primarily relies on institutional pressure to explain the actions of companies, it
underestimates the influence of stakeholders and the need to pursue legitimacy.
Therefore, institutional theory must be used with both stakeholder and legitimacy theories
to more fully explain CSR disclosure.

18
CSR Reporting: A Changing Landscape
Corporate scandals and the global economic downturn have forced companies to
be more socially responsible. They must meet their economic, legal, ethical and
philanthropic obligations and be attentive to a broad group of stakeholders (Arvidsson,
2010; Carroll, 1999; Fiss & Zajac, 2006; Ivashina & Scharfstein, 2010; Kennedy &
Neuger, 2012). However, it is not enough for corporations to merely engage in socially
responsible activities, companies must also make their activities known. With increasing
demands for transparency, companies feel compelled to demonstrate social responsibility
and report the impact of their social, economic and environmental activities to both
internal and external stakeholders (Arvidsson, 2010; Fiss & Zajac, 2006; Hackston &
Milne, 1996; Maignan et al., 1999).
The firm’s social, economic and environmental impact is considered significant.
However, as Kolk and Pinkse (p. 12) suggest, “materiality [significance] does not
guarantee adequate disclosure.” That is, consistent with legitimacy theory, firms must
provide sufficient CSR disclosure1 to demonstrate that they are making an honest effort
to meet society’s expectations (Neu et al., 1998; Yongvanich & Guthrie, 2006).
Voluntary CSR reporting can help repair, attain or maintain organizational legitimacy
(Ader, 1995).
Voluntary CSR reporting provides companies with an opportunity to demonstrate
transparency and accountability to society. This can help provide stakeholders with
insights about a company’s activities (Chen & Bouvain, 2009; Dando & Swift, 2003; 1 The terms CSR disclosure and CSR reporting are used interchangeably in the literature and both terms will be used in the current document.

19
Dubbink, Graafland & van Liedekerke, 2008; Reynolds & Yuthas, 2007; Shinkle &
Spencer, 2012). Some companies rely on the firm’s traditional annual report to disclose
CSR efforts while other companies have chosen to use stand-alone reports (Chatterji &
Levine, 2006; Haddock-Fraser & Fraser, 2008; Hooghiemstra, 2000). The volume and
type of information that is reported vary across companies and some studies suggest that
there are country and industry differences in the reports (Chen & Bouvain, 2009).
Corporate social disclosures have evolved over time with society’s expectations.
Prior to and during the 1970s, corporate reporting was used to help establish, support or
restore perceptions of legitimacy (Deegan, 2002). These disclosures were oriented
toward describing either the effectiveness or the efficiency of CSR initiatives and were
aimed largely at influencing public relations (Herzig & Schaltegger, 2006). Beginning in
the 1980s, society became more interested in the role of companies in environmental
issues and public corporations began to focus on risk management and reputation
enhancement (Bebbington et al., 2008). For example, the number of environmental
reports grew as the focus on ecological effectiveness increased. From the mid-1990s to
the end of the decade, the emphasis shifted to sustainability reports that included
environmental, social and economic perspectives. These reports adopted more of a
global context and each of the CSR-related issues was dealt with in a more
comprehensive manner (Herzig & Schaltegger, 2006).
CSR Disclosure Research
While firms have engaged in CSR disclosure since the beginning of the twentieth
century, there appears to have been minimal research interest in the topic (Hogner, 1982;
Guthrie & Parker, 1989; Neu, Warsame & Pedwell, 1998). According to Adams (2002),

20
researchers were hesitant to invest time and effort in an area perceived to be difficult to
measure or which had limited perceived usefulness and/or relevance to stakeholders. A
review of the literature suggests that scholars have engaged actively in attempting to
assess CSR performance (which is measurable) but that the actual disclosure of the
activities leading to performance was lacking in the literature.
In order to gain a clearer understanding of CSR disclosure/reporting and to
ascertain the quantity and type of related research, the ABI/INFORM (2012) database
was used to produce an overview of past peer-reviewed research. This approach is
consistent with the method used by Cronin et al. (2011) in their examination of green
marketing strategies. The content that is included is drawn from leading business
journals through a structured keyword search of the literature (Cronin et al., 2011;
Webster & Watson, 2002). The method of data capture used by ABI/INFORM (2012)
helps ensure that the results are focused and relevant. Although the literature review
suggested a paucity of CSR research with respect to CSR discloser/reporting, it also
revealed a variety of terms that have been used to describe the practice. Thus, the initial
stage of the literature review involved an examination of peer-reviewed articles that made
reference in both the abstract and the text to any of the following key words:
• Environmental Disclosure(s),
• Social Disclosure(s),
• Economic Disclosure(s),
• Social, Economic and Environmental Disclosure(s),
• Voluntary Disclosure(s),
• Sustainability Reporting,

21
• CSR Reporting and
• Corporate Social Responsibility Reporting
A comparison of the quantity of research for each type of disclosure is depicted in
Table 1.
Table 1
CSR Disclosure Research
Years
Key Words
1940-1949
1950-1959
1960-1969
1970-1979
1980-1989
1990-1999
2000-2009
2010-2012 Total
Social Disclosure 0 0 0 0 3 123 443 246 815
Environ Disclosure 0 0 0 1 6 111 623 393 1,134
Economic Disclosure 0 0 0 0 0 7 5 1 13
Social & Environ
Disclosure 0 0 0 0 0 8 241 124 373
Environ & Social
Disclosure 0 0 0 0 0 0 20 15 35
Voluntary Disclosure 0 2 0 13 69 345 1,315 633 2,377
CSR Disclosure 0 0 0 0 0 3 57 82 142
CSR Reporting 0 0 0 0 0 1 186 205 392
Sustain Reporting 0 0 0 0 0 7 458 293 758
Total 0 2 0 14 78 605 3,348 1,992 6,039
Note: Environ Disclosure=Environmental Disclosure, Sustain Reporting=Sustainability Reporting Quantity of CSR Disclosure Research
Of these search criteria, the term that was first to appear in the literature was

22
voluntary disclosures. This term has been used to describe information that is voluntarily
provided to financial markets and investors to meet their information needs (Boesso &
Kumar, 2007). These voluntary disclosures differ from the financial information that
companies are mandated to provide. Instead, voluntary disclosures include social,
environmental and economic information, which often varies across companies (Chen &
Bouvain, 2009).
The term voluntary disclosures first appeared in the literature in the 1950’s.
While there was no reference to the phrase during the 1960’s, articles on the topic once
again emerged in the 1970’s and the number began to grow. Of all of the terms used to
describe non-financial reporting, voluntary disclosures have appeared in the literature the
most often with a total of 2,377 articles. While this term has often been used, it is less
specific than other terms that have been examined.
Within ABI/INFORM (2012), environmental disclosure(s) were found to be the
focus of 1,134 peer-reviewed articles. Slightly less interest was shown for social
disclosure(s) and economic disclosure(s) with 815 and 13 peer-reviewed articles
respectively. Substantially fewer peer-reviewed studies have focused on more than one
type of disclosure. For instance, only 408 studies have been published to date that
examine some combination of social, environmental and economic reporting.
Additionally, only 534 peer-reviewed articles have been focused on CSR
disclosure(s), CSR reporting and Corporate Social Responsibility Reporting.
Sustainability reporting has been the emphasis of 758 articles. Interestingly, all but 11 of
the studies focused on CSR and sustainability reporting research have appeared since the

23
year 2000. The increasing quantity of disclosure research is a signal of increased interest
in this area.
ABI/INFORM (2012) was once again utilized to gauge the quantity of CSR
performance research. A closer look reveals several interesting trends. As shown in
Table 2, performance research more than tripled from the 1960s to the 1970’s and then
Table 2
Performance Research Overview
Years
Key Words
1940-1949
1950-1959
1960-1969
1970-1979
1980-1989
1990-1999
2000-2009
2010-2012 Total
Social Perform 1 3 6 57 81 623 2,216 994 3,981
Environ 0 0 0 1 8 543 2,579 1,196 4,327
Perform Two
Combo 0 0 0 0 0 12 155 155 322
Econ Perform 1 14 63 202 898 5,008 11,214 3,609 21,009
Three Combo 0 0 0 0 0 0 24 9 33
Total 2 17 69 260 987 6,186 16,188 5,808 29,517 Note: Social Perform=Social Performance, Environ Perform=Environmental Performance and Econ Perform=Economic Performance grew exponentially after that point. Amongst the three primary types, economic
performance has received the most attention with 21,009 peer-reviewed articles. This is
more than two and half times the number of articles focused on environmental
performance and social performance combined. Environmental performance and social
performance have been the focus of 4,327 and 3,981 peer-reviewed articles respectively.
In comparing CSR performance research and CSR disclosure research, it is clear

24
that CSR disclosure has received less attention from researchers. Interestingly, social
activities, which have received the least attention in CSR performance research, have
received greater attention in disclosure research. It is also important to note that there
was a lag in time between performance research becoming of interest to scholars and the
appearance of disclosure research in business journals.
Time Lag
As shown in Table 1, little disclosure research took place prior to 1990 and that
which did appear focused primarily focused on voluntary disclosure. From 1990-1999,
the number of publications that focused on either social or environmental disclosures
grew steadily and was nearly uniformly split between the two. There were relatively few
studies that combined both social and environmental disclosures between 1990 and 1999,
but that number grew significantly between 2000 and 2009. While the percentage of
articles that focused on voluntary disclosure remained large, the majority focused on
some component of CSR disclosures/reporting.
Performance research, depicted in Table 3, took time to gain momentum but did
so much more quickly than disclosure research. From 1980 to 1989, there were nearly
13 times more peer-reviewed articles focused on types of performance than on disclosure.
While the magnitude of difference slipped between 1990 and 1999, there were still more
than 10 times more articles focused on performance. The performance articles were
nearly five times greater than the number of disclosure articles between 2000 and 2009.
Since 2010, the magnitude of difference has continued to decrease. However, there is
still nearly three times more CSR performance research published than CSR disclosure
research. The increased number of CSR disclosure studies and the decreasing magnitude

25
Table 3
Total Disclosure and Performance Research
Year Total
Disclosure Research
Total Performance
Research
Magnitude Difference
1970-79 14 260 18.57 1980-89 78 987 12.65 1990-99 605 6186 10.22 2000-09 3,348 16188 4.84 2010-12 1,992 5808 2.92 TOTAL 6037 29,429 4.87
difference could be a sign of greater recognition within the academic community that
CSR disclosure strategies are an important area of study. A review of the CSR disclosure
research, however, portrays a narrow band of academic scholarship.
A Narrow Band of Research
A review of all CSR disclosure research shows that the majority of research has
been published in accounting journals. This is illustrated further in Table 4, which shows
the top 10 journals for CSR disclosure research based on the quantity of research
published to date. Considering the common bond with financial disclosures, it is not
surprising that accounting scholars have focused on CSR disclosures. However, the
accounting discipline’s dominance has led to a narrow range of research. This has
focused on three areas: (1) descriptive analysis of disclosures across countries and time
periods, (2) examination of the impact of disclosures on corporate social and financial
performance and (3) empirical research examining the determinants of reporting

26
(Reverte, 2009), with much of the research examining volume related to CSR disclosure.
Disclosure volume has been assessed in a variety of ways:
• Page count (Gray, Kouhy & Lavers, 1995),
Table 4
Top 10 Journals for CSR Disclosure Research
Journal Number of CSR
Disclosure Articles Published to Date
Accounting, Auditing & Accountability Journal 594
Journal of Business Ethics 510 Social Responsibility Journal 204 Managerial Auditing Journal 189 Journal of Intellectual Capital 158 Corporate Governance 110 Journal of HRCA: Human Resource Costing & Accounting 95
Journal of Accounting Research 90 Accounting Horizons 87 Business Strategy and the Environment 70
• Word count (Deegan & Gordon, 1996),
• Sentence count (Hackston & Milne, 1996) and
• Information bursts (Holder-Webb, Cohen, Nath & Wood, 2009).
The Relevance of CSR Disclosures to Marketing
While CSR reporting research has been dominated by other disciplines, the topic
is relevant to marketing scholars (Nikolaeva & Bicho, 2011). Companies have
increasingly focused on corporate social responsibility and for those whose stakeholders

27
are aware, there is significant benefit. Even knowledge of a single activity or initiative
may affect the consumers’ beliefs, attributions, attitudes and identification (Sen et al.,
2006). When consumers are aware of the firm’s approach to CSR, a company is not only
viewed as socially responsible, but consumers are more likely to purchase from them
(Sen et al., 2006). The benefits to the company, however, are not restricted to
consumption. Employment seeking behaviors may also be impacted positively (Turban
& Greening, 1997). CSR initiatives, when reported, have been shown to have a favorable
effect on how stakeholders think, feel and act toward a company and its brand (Hoeffler
& Keller, 2002; Sen et al. 2006).
The firm’s approach to CSR reflects it perspective on societal obligation and can
also have significant impact on its corporate reputation (Ellen, Webb & Mohr, 2006).
Given the level of competition in most industries today, corporate reputation is critical
(Aaker, 2005) and CSR provides a means by which to repair and/or refine it. Multiple
studies have suggested that reputation management is a major reason for companies to
engage in CSR activities and then to disclose them (Bebbington et al., 2008; Brown et al.,
2009; Luo & Bhattacharya, 2006; Nikolaeva & Bicho, 2011).
Reputation has been defined as the “set of corporate associations that individuals
outside an organization believe are central, enduring and distinctive to the organization”
(Brown et al., 2006, 104). The issue companies face, however, is that despite their
investment, stakeholders are often unaware of the CSR initiatives companies undertake.
In fact, awareness of CSR initiatives is fairly low (Sen et al., 2006). This presents a
significant obstacle for those firms that recognize the impact that CSR can have in
helping them shape their reputation in the market place (Sen et al., 2006).

28
CSR reporting can help a company overcome this obstacle because it provides an
opportunity to engage stakeholders in an ongoing dialogue (GRI, 2012; Nikolaeva &
Bicho, 2011). In their stakeholder-oriented definition of marketing management,
Gundlach and Wilkie (2010) suggest that the role of marketing management is to
determine and implement those activities that involve “creating, communicating,
delivering and exchanging offerings that have value for customers and other stakeholders,
as well as society at large” (p. 91). Public relations and advertising have long been seen
as activities that can help the firm communicate the impact of its CSR activities to
stakeholders (Carter, 2006). CSR reporting has also been shown to be an effective
communications tool because it can be used to engage stakeholders and address their
concerns (Fombrun & Shanley, 1990; GRI, 2012; Orlitzky, Schmidt, & Rynes, 2003;
Sweeney & Coughlan, 2008).
The firm’s success is dependent on meaningful relationships with its stakeholders
and a focus on shared values. By sharing the firm’s CSR initiatives and disclosing its
social, environmental and economic impact, marketers are able to engage with multiple
stakeholder groups, build lasting relationships and thus create value for the firm
(Bhattacharya & Korschun 2008; Ferrell et al. 2010; Hult et al., 2011). It is for these
reasons that Nikolaeva & Bicho (2011, 152) conclude “the magnitude and the scope of
CSR reporting should be studied more extensively by marketing scholars.”
Types of Research
Descriptive Analysis
A number of researchers have used descriptive analysis to review CSR disclosure
practices. The studies they have conducted have examined single companies over an

29
extended period (Deegan et al., 2002; Guthrie & Parker, 1989), multiple companies in a
single country (e.g. Brammer & Pavelin, 2008; Campbell, Craven & Shrives, 2003;
Deegan & Gordon, 1996; Ho & Taylor, 2007; Patten, 1991; Roberts & Koeplin, 2007)
and multiple companies across multiple countries (Adams & Kuasirikun, 2000; Chen &
Bouvain, 2009). Unfortunately, differences in sample selection and the method of
measurement have often made the comparison of studies difficult.
Single company longitudinal studies have examined the CSR reporting practices
of companies in Australia and the United States. Guthrie and Parker (1989) reviewed the
reporting practices of an Australian company, BHP Ltd. from 1885-1985. A separate
study examined the period from 1983-1997 (Deegan, Rankin & Tobin, 2002). Both
studies showed CSR reporting practices to be extremely variable. Rather than a
consistent pattern of growth, disclosures fluctuated over time between growth and
decline. The intervals between peaks in disclosure volume also varied widely. In fact,
researchers found little relationship between timing of observed peaks and key economic
events affecting BHP (Deegan et al., 2002; Guthrie & Parker, 1989). Hogner’s (1982)
study of US Steel produced similar results.
An examination of single country studies has shown that, over time, both the type
and volume of CSR disclosures vary substantially between companies (Brammer &
Pavelin, 2008; Campbell, Craven & Shrives, 2003; Deegan & Gordon, 1996; Ho &
Taylor, 2007; Patten, 1991; Roberts & Koeplin, 2007). The variance in volume and type
of disclosure observed across studies is believed to be associated with firm size (Cormier
& Gordon, 2001; Cormier, Gordon & Magnan, 2004), the industry (Patten, 1991) and the
ownership of the firm (Cormier & Gordon, 2001).

30
Results from a comparative analysis of firms across two or more countries also
showed problems with generalizability (Adams & Kuasirikun, 2000). For example, CSR
reporting by British and German companies in the chemical and pharmaceutical
industries revealed differences in both the amount and type of disclosures across
countries. The magnitude of difference between countries, however, was difficult to
interpret due to incongruity between the samples with regard to industry size and
composition (Adams & Kuasirikun, 2000).
Chen and Bouvain (2009) compared CSR reporting across firms in the United
States, the United Kingdom, Australia and Germany. The authors found significant
differences between countries in how frequently the terms society, community and
customer were mentioned in reports. There were also significant differences between
industries in the frequency of environmental issues. The use of third party assurance was
also examined and significant differences were observed (Chen & Bouvain, 2009). In
cross-country comparisons, the influence of culture, political pressure and other
contextual factors was evident (Adams, 2002).
Descriptive studies have played an important role in shaping the overall body of
CSR disclosure research. Variances in the volume, quality and type of disclosures have
led researchers to try and better understand the factors that contribute to the observed
differences. Across studies, firm size and industry classification have been highly
correlated with the firm’s CSR disclosure volume. As a result, both of these have been
used as control variables in other studies. Contextual factors have also been revealed that
deserve greater attention (Adams, 2002).

31
Impact of Corporate Social and Financial Performance on Disclosure
As described earlier, scholarly interest in CSR performance preceded disclosure
research. Given that fact, it is not surprising that researchers would be interested in
understanding whether a relationship exists between performance and the volume and
quality of CSR disclosures. Thus far, studies that focused on the association between
social disclosures and social performance have produced inconsistent results. For
example, Ingram & Frazier (1980) suggested a weak association between social
performance and the level of CSR disclosure while Wiseman (1982) suggested no
relationship at all. In reviewing the body of past research, Roman, Hayibor and Able
(1999) proposed that the number of studies that suggest a negative relationship is
overstated and that the relationship is actually positive to neutral.
Little interest was shown in the determinants of CSR reporting before Ullmann’s
(1985) conceptual framework was proposed. That framework provided a more robust
explanation for the relationship between performance and disclosure. It placed a heavy
emphasis on stakeholder theory and helped scholars begin to understand the theoretical
underpinnings of CSR disclosure. As a result, more researchers became interested in the
topic and began to examine the determinants of CSR disclosure. Today, Ullmann’s
influence continues to be seen with frequent citations of his work.
Determinants of Reporting
Following Ullmann (1985), disclosure research focused on the determinants of
CSR disclosure volume and quality. While a broad array of independent variables has
been examined, researchers have tended to focus on only a small number of variables in a
given study rather than look at larger constructs. For example, Cowen, Ferreri & Parker

32
(1987) sought to understand the relationship between individual corporate characteristics
and the types of CSR disclosure made by a company. Consistent with previous studies,
both size and industry category appeared to have some influence. Additionally, the
presence of a CSR committee was shown to also to have an effect.
Another study examined a series of financial determinants and environmental
disclosure volume (Cormier & Magnan, 1999). The results revealed a positive
relationship between a firm’s risk, its reliance on capital markets and its trading volume
and the dependent variable of disclosure volume. Concentrated ownership was
negatively related to disclosure volume.
While financial determinants continue to be included in many studies, some
scholars have examined unique variables. In a study focused on Spanish companies,
Reverte (2009) included industry environmental sensitivity, international listing, media
exposure and leverage as independent variables. Each was positively related to
disclosure volume. In another study, Gamerschlag et al. (2011) included company
visibility, profitability, share ownership structure and a company's relationship with its
stakeholders in the United States as independent variables in their study. All, except for
profitability, were related positively to the volume and quality of CSR disclosures.
Two Competing Theoretical Models
Ullmann (1985) was the first to propose a theoretical model to explain the broader
determinants of CSR disclosures. Given the model’s origins, it is not surprising that it
relied heavily on performance. The model consisted of three high level constructs:
stakeholder power, strategic posture and past and present economic performance.
The first construct, stakeholder power, was based on earlier work by Keim (1978)

33
who suggested that investors, acting out of self-interest, would encourage social action
from which they would derive benefit. This construct describes the power of
stakeholders to control resources critical to the organization and suggests the firm is
forced to respond in a way that satisfies stakeholders’ demands. While Ullmann (1985)
focused on the power of stakeholders, he was primarily interested in stockholders.
This was because of their ability to control critical resources.
Strategic posture, the second construct, described the approach managers take in
responding to stakeholder’s demands. Ullmann (1985) suggests that this can either be
passive or active. This is consistent with Sethi’s (1974) model of corporate social
performance that includes social obligation, social responsibility and social
responsiveness. A passive posture would reflect social obligation and an active posture
would reflect social responsiveness (Carroll, 1999). Ultimately, Ullmann was interested
in how a firm chooses to strategically influence its key stakeholders in its efforts to
achieve interdependence.
The final construct, past and present financial performance, dictates how much
attention social issues get from the firm’s leadership. Financial performance also helps
determine the firm’s ability to meet stakeholder demands. Ullmann (1985) suggests that
the interactions among the three constructs will determine if CSR performance or CSR
disclosure is used to manage relationships with stakeholders.
Roberts (1992) applied Ullmann’s (1985) theoretical model as a means to
understand the determinants of CSR disclosure. The dependent variable chosen by
Roberts as a proxy for CSR disclosure was the rating each of the 130 participating
companies received in a 1986 study conducted by the Council on Economic Priorities.

34
Three independent variables were selected to represent and assess stakeholder power.
Previous research suggested that dispersed ownership heightened pressure for
management to disclose CSR activities (Ulmann, 1985). As a result, one independent
variable chosen for inclusion was the percentage of shareholders and owners who held
more than 5% of common stock in the period prior to disclosure. The amount of funding
contributed to a corporate political action committee (PAC) in the period prior to the CSR
disclosure was included as a second variable. It was chosen because it was considered to
be representative of stakeholder power resulting from regulatory and political pressure.
The third variable chosen was the debt to equity ratio in the period prior to the CSR
disclosure. This variable was included because it was believed that the more dependent
the firm was on debt financing, the greater the firm’s response to creditors’ expectations.
Of these variables, only PAC contributions (p < .05) and debt-equity ratio (p < .10) were
shown to be significant in predicting CSR disclosure.
Roberts (1992) then used two variables to represent Ullmann’s (1985) strategic
posture construct. It had been assumed that companies that take an active posture toward
CSR require a large public affairs staff (Marcus & Kaufman, 1988). Given this
assumption, the average size of the public affairs staff from 1983-1984 was included as
one variable representing strategic posture. Since the existence of a corporate-funded
philanthropic foundation demonstrated an active posture toward CSR, a dichotomous
variable was used to denote the existence of such a foundation from 1983-1984. Both
variables were found be significant; the existence of a philanthropic foundation was
highly significant at .001.

35
Ullmann’s (1985) third construct was past and present financial performance.
Roberts (1992) proposed using both an accounting measure (return on equity) and a stock
market based measure (systemic risk) to test the relationship between economic
performance and the level of disclosure. Return on equity was significantly related at
p <0.05 and systemic risk was significantly related at p < 0.10. There were also three
other measures: age of the corporation, industry classification and company size.
Only age (p < .01) and industry (p < .05) had the expected positive relationship.
Adams (2002) offered an alternative theoretical model to explain the factors that
determine a firm’s CSR disclosure strategy. This new model also organized the variables
into three high-level constructs: (1) corporate characteristics, (2) general contextual
factors and (3) internal contextual factors. Adams (2002) model was influenced by
research that preceded her model. Since it was proposed, it has served to influence the
individual variables researchers have examined.
Of Adam’s (2002) three constructs, the corporate characteristics construct has
been studied frequently. Company size (e.g. Adams et al., 1998; Boesso and Kumar,
2007; Brammer & Pavelin, 2008; Cormier, Gordon & Magnan, 2004; Cowen et al., 1987;
Hackston & Milne, 1996; Ho & Taylor, 2007; Reverte, 2009) and industry group or
classification (e.g. Adams, Hill, & Roberts 1998; Cowen et al., 1987; Deegan & Gordon,
1996; Hackston & Milne, 1996; Islam & Deegan, 2010; Nikolaeva & Bicho, 2011;
Patten, 1991; Roberts, 1992) have produced consistent results and have been shown to be
positively related to the volume and quality of CSR disclosures. Results have suggested
corporate age, systemic risk and lagged profit are also related positively (Roberts, 1992).

36
Profit in the same period, however, has failed to produce consistent results across studies
(e. g. Belkaoui & Karpik, 1989; Brammer & Pavelin, 2008; Choi, Kwak & Choe, 2010;
Cowen et al., 1987; Ismail & Chandler, 2005; Neu et al., 1998; Reverte, 2009; Patten,
1991).
The construct that Adams (2002) described as general contextual factors includes
the combined effect of social, political, economic and cultural factors, as well as the
influence of time, world events, stakeholder power and media. Adams (2002), however,
noted that these factors can be difficult to measure and their effects difficult to isolate. It
can also be difficult to understand what if any relationships exist between the factors.
Variables that might also apply within this construct are political and economic
turbulence (Berthon et al., 2008; Haleblian & Finkelstein, 1993; Hristache & Iacob,
2012), disclosures on the Web (Joshi & Gao, 2009) and media pressure (Islam & Deegan,
2010, Zyglidopoulos et al., 2012).
Internal contextual factors include attitudes that influence the firm’s reporting
strategy or internal processes that influence the preparation of the CSR report (Adams,
2002). Only two studies that focused on CSR disclosures have explored corporate
leadership as a variable. Campbell (2000) looked at changes in the company chairperson
while Cowen et al. (1987) focused on a defined committee that focused on CSR reporting
within the Board of Directors. Adams (2002) went on to suggest additional variables that
might adequately represent internal contextual factors. Corporate structure and
governance procedures, involvement of accountants and involvement of stakeholders
were identified as additional process factors while views on reporting practices, perceived
costs and benefits of reporting and corporate culture were identified as possible

37
attitudinal factors. While the constructs and resulting variables are grounded in theory, it
is important to keep in mind that this model has not been examined empirically in the
literature.
A Shifting Environment
There have been numerous environmental changes since Ullmann (1985) and
Adams (2002) proposed their theoretical models. It is unclear what impact this
environmental turbulence might have on the determinants of CSR reporting and the
quantity and quality of CSR disclosures. It is also not known how the firm’s disclosure
strategy may be affected.
Corporate scandals and perceived greed associated with Enron, AIG, BP,
Goldman Sachs and WorldCom have fostered a growing skepticism about corporate
motives and actions (Arvidsson, 2010). Over the past decade, trust in corporate America
has fallen to an all-time low (Edelman, 2009; Waddock & Googins, 2011). As a result,
stakeholders desire for authenticity, accountability and transparency have increased
(Becchetti, Ciciretti, Hasan & Kobeissi, 2012; Holder-Webb et al., 2009; Waddock &
Googins, 2011; Wagner, Lutz & Weitz, 2009). These growing expectations may reflect
an increase in the strength of stakeholders and their role in helping change how society
defines legitimacy.
With increased awareness about climate change and increased attention to
corporate business practices, society’s concern about the environmental, social and
ethical commitment of business has also increased (Arvidsson, 2010). Actions have been
taken at both national and international levels to help ensure that better corporate
governance leads to an improved relationship between business and society (Arvidsson,

38
2010). This suggests that institutions may play an increasing role and reflects the need to
more fully examine the role of both stakeholders and institutions in influencing CSR
disclosure strategy.
The environment that business operates in has also become more turbulent.
Beginning in 2008, the world’s economies began to experience a significant economic
downturn with threats of default by debt-ridden nations like Greece, Ireland and Portugal
(Ivashina & Scharfstein, 2010; Kennedy & Neuger, 2012). Political discontent has led to
protests and changes in governments and there have been increased calls for greater
accountability among businesses (Kolk & Perego, 2010). Interest in sustainability has
also grown (Dilling, 2010) and social media has taken a dominant role in the way we
communicate (Berthon et al., 2012). While Adams (2002) suggested that social, political,
cultural and economic context could play a role in influencing a firm’s CSR reporting,
these factors were not empirically tested. This suggests a knowledge gap regarding the
role of these contextual factors in influencing a firm’s disclosure strategy. This gap could
be addressed by examining the role of certain institutional measures of environmental
turbulence as determinants.
In addition to changes in the external environment, there has also been a major
shift in the way data can be collected and analyzed. In past studies, content analysis has
often been used to assess the quantity and quality of the reporting. This is often done by
counting the words, sentences, paragraphs or pages devoted to CSR disclosures in the
firm’s annual report or on the company’s website. This method is time consuming.

39
As a result, it has resulted in the examination of only a small number of disclosures (e.g.
Brammer & Pavelin, 2008; Cowen et al., 1987; Deegan & Gordon, 1996; Roberts, 1992;
Patten, 2002).
The limitations of content analysis have often led scholars to reduce the scope of
their research to a single type of disclosure (Brammer & Pavelin, 2008; Cowen et al.,
1987; Deegan & Gordon, 1996; Patten, 2002; Roberts, 1992). For example, some
research has focused on social disclosures (e.g. Abbott & Monsen, 1979; Bebbington et
al., 2008; Campbell et al., 2003: O’Dwyer, 2002; Patten, 1991; Ullmann, 1985) while
other research has focused almost exclusively on environmental reporting (e.g. Brammer
& Pavelin, 2008; Cormier et al., 2005: Wiseman, 1982). Past research has also been
limited geographically to countries like Japan, Germany, Italy, Portugal, Spain, the
United Kingdom and the United States (e.g. Adams & Kuasirikun, 2000; Boesso &
Kumar, 2007; Gray et al., 1995; Ho & Taylor, 2007; Gamerschlag et al., 2011; Patten,
2002; Reverte, 2009; Roberts & Koeplin, 2007). Researchers have tended to examine
CSR disclosures in a single country or across a small group of countries rather than
across a large multi-country sample (e.g. Adams & Kuasirikun, 2000; Boesso & Kumar,
2007; Chapple & Moon, 2005; Cormier, Gordon & Magnan, 2004; Gray et al., 1995; Ho
& Taylor, 2007; Gamerschlag et al., 2011; Patten, 2002; Reverte, 2009; Roberts &
Koeplin, 2007.) Finally, the limitations of content analysis have made it difficult to
examine more than a single year of reporting across a series of firms (Cormier, Magnan
& Van Velthoven, 2005; Gamerschlag et al., 2011).
Improved technology has helped eliminate some of the issues associated with
early content analysis and has made disclosures more accessible to researchers who want

40
to analyze both quantity and quality. Electronic tools that help eliminate issues of inter-
rater reliability can now be used to carry out content analysis (Chen & Bouvain, 2009).
At the same time, normative standards for CSR and guidelines for CSR disclosures have
also begun to shape corporate practices as the environment in which companies find
themselves continues to evolve (KPMG, 2011). The use of reporting standards has also
helped create more uniform disclosures across geographic boundaries by creating a
benchmark for reporting (KPMG, 2011; Sherman, 2009). Limited attention has been
paid to the impact that these normative standards may have on CSR disclosures.
There are multiple frameworks for voluntary CSR communication and disclosure,
which provide companies with latitude in choosing issues on which to report (Chen &
Bouvain, 2009). Of these frameworks, the GRI’s G3 Guidelines, which were released in
late 2006, are used most often (Chen & Bouvain, 2009; Waddock & Googins, 2011).
Today, more than 1000 firms globally report their social, environmental and economic
impact according to GRI (Arvidsson, 2010).
The G3 Guidelines include reporting indicators that provide a platform for
reporting a firm’s economic, environmental and social impact. The Guidelines rely on a
series of application levels which allow companies to communicate to stakeholders the
specific elements of the GRI Reporting Framework that have been applied in their
disclosures. Organizations have flexibility to decide which principles and indicators to
use and to what extent they wish to apply the Guidelines. Additionally, the standards
provide firms with the ability through assurance to communicate to stakeholders that
certain requirements have been met (Gamerschlag et al., 2011; GRI, 2012; Moneva et al.,
2006).

41
GRI Guidelines
Firms that rely on the GRI Guidelines to guide their disclosure strategy are faced
with three strategic three decisions. First, the firm must choose whether to declare a
specific application level in reporting its CSR activities or merely reference the principles
from the GRI framework. Second, the firm that chooses to declare an application level
must determine how much it wishes to disclose and which level it wishes to declare.
Finally, a firm must decide whether it will have the disclosure reporting assured by a
third-party.
The GRI Guidelines contain three different types of disclosures: a profile and
strategy overview, a summary of the firm’s management approach and performance
indicators. Together, these help set the context for understanding the firm’s strategy and
its approach to CSR. Performance indicators help describe the firm’s economic,
environmental and social performance. Labor, human rights, society and product
responsibility also offer greater insight into the firm’s social performance. (GRI, 2011;
Sherman, 2009)
Each category has a corresponding set of core and additional performance
indicators that are described in more detail in Appendix B. Core Indicators are generally
applicable across region and sector and have been developed through GRI’s multi-
stakeholder processes (GRI, 2011; Nikolaeva & Bicho, 2011). Topics that may be
material for some organizations, but not for others or those that would be considered
emerging are labeled as additional indicators (GRI, 2011).
The three G3 application levels are labeled A, B or C. Application level C is

42
intended for organizations at the entry level of reporting. These organizations meet the
minimum reporting criteria of 10 core performance indicators and have included
economic, environmental and social indicators in the firm’s CSR report. Organizations at
application level B have not only demonstrated an increasing application of the reporting
framework, these organizations have policies in place to guide sustainability
performance. Application level B requires an organization to report on 20 core
performance indicators. In addition to the economic, environmental and social indicators,
the organizations have also included labor practices and decent work, human rights and
product responsibility indicators in the CSR report. Those organizations with an
application level A reflect the broadest application of the GRI Guidelines. As such, at
this level, all 50 GRI core performance indicators must be represented, either with data or
a valid explanation for why the indicator is not reported (GRI, 2011; Sherman, 2009).
Additionally, any firm that has utilized external assurance may self-declare a “plus” (+)
with any one of the three application levels (GRI, 2011). This multi-dimensional
framework provides stakeholders with an easy way to understand which elements of the
GRI reporting framework a company has applied. It also includes affirmation of
assurance that a firm is operating within society’s expectations.
Every three years, KPMG conducts an international survey that examines CSR-
related information from hundreds of companies. Since 1993, the survey has tracked
both historic trends and emerging issues in CSR reporting. The survey provides data
from the top 250 companies listed on the Fortune Global 500 (G250). It also includes the
100 largest companies by revenue (N100) from 22 countries. A listing of those countries
is provided in Table 5.

43
Table 5
Countries in the N100
Australia Italy South Korea Brazil Japan Spain Canada Mexico Sweden Czech Republic Netherlands Switzerland Denmark Norway United Kingdom Finland Portugal United States France Romania Hungary South Africa
In 2005, only 50% of the G250 companies reported on CSR initiatives. Both the
2008 and 2011 KPMG surveys showed significant increases to 81% and 95%
respectively. The number of reporting companies that followed the GRI Guidelines from
both the G250 and the N100 grew as well. In 2008, 77% of the G250 followed the GRI
Guidelines and this number increased to 80% by 2011. Of the N100 companies, 69%
followed the GRI Guidelines in both 2008 and 2011 (KPMG, 2011, 20).
It has been suggested that slow adoption rates for the GRI and lower-than-desired
compliance levels imply that the business case for reporting is elusive (Gray, 2006). The
introduction of the GRI G3 Guidelines seemed to challenge that assumption and adoption
of the reporting standards began to increase. Use is also more widespread geographically
and now includes both the developed and developing world (KPMG, 2011). These
results, however, did not come without a significant investment of time and money to
promote the guidelines around the globe.

44
Hypothesis Development
Reporting practices have evolved since Ullmann (1985) and Adams (2002)
proposed their models. Normative standards like the GRI Guidelines have helped create
more uniform CSR disclosures across geographic boundaries, but the firm is still left to
make key strategic choices about its disclosure strategy. The GRI G3 provides the firm
with guidance as to what should be reported and how it should be reported. Ultimately,
the firm must determine the application level and whether or not to have third-party
assurance to communicate to stakeholders that certain requirements have been met
(Gamerschlag et al., 2011; GRI, 2012; Moneva et al., 2006).
It is unclear how all of these factors influence a firm’s disclosure strategy and
ultimately, the quantity and quality of CSR reporting. Holder-Webb, Cohen, Nath and
Wood (2009) call for future research that explores the determinants of CSR reporting.
There is also a need to assess a broader and more representative sample of firms across
industries (Sweeney & Coughlan, 2011). This current research responds to these calls for
additional investigation in today’s dynamic marketplace with the primary objective of
answering the following major research question.
RQ: What factors are determinants of a company’s CSR disclosure strategy?
Conceptual Model and Hypotheses
A new model is proposed here that could be useful to both scholars and
practitioners. It utilizes constructs from Ullmann (1985) and Adams (2002) along with
two new constructs. Corporate characteristics were included as a key construct by
Adams (2002) and the firm’s financial profile was included as a key construct by
Ullmann (1985). These two constructs will be used to replicate past research, while two

45
other constructs will serve to extend it.
Instead of merely focusing on the stakeholders’ power to control resources, this
research will build upon Ullmann’s (1985) model by examining the involvement of the
firm’s stakeholders. It will also build upon Adams (2002) model by examining both
national and industry focused measures that exemplify environmental turbulence. This
research provides more specificity than Adams (2002) model, which focused broadly on
general contextual factors. It also extends the literature because it draws upon a
theoretical framework that includes legitimacy, institutional and stakeholder theories.
The firm’s CSR disclosure strategy is comprised of the GRI G3 levels and the
firm’s decision to seek third-party assurance. While GRI application levels have not been
examined in past research, they do represent a fundamental choice that firms must make
in executing their disclosure strategy. The second construct is the presence or absence of
third party assurance. This is considered a key strategic decision because CSR
disclosures may have more legitimacy if reviewed and assured by an independent third
party. This is similar to financial data that are viewed as reliable because of the auditing
process (Holder-Webb et al., 2009). The presence or absence of third party assurance is
also included in the data reported to GRI. Determining whether or not to pursue third
party assurance is an important decision the firm must make in determining its disclosure
strategy. Taken together, these provide a simple and uniform method by which to reflect
the quality of a firm’s CSR disclosure strategy. (See Figure 1 in Chapter 1.)
Non-financial corporate characteristics. The determinants of reporting are
explained by four constructs. The first of these, non-financial corporate characteristics,
includes items described by Adams (2002) including corporate structure and governance

46
procedures, involvement of accountants and involvement of stakeholders as additional
process factors. Views on reporting practices, perceived costs and benefits of reporting
and corporate culture were identified as possible attitudinal factors. Legitimacy,
stakeholder and institutional theories all support this construct.
Past research has examined industry membership (Cowen et al., 1987; Hackston
& Milne, 1996; Patten, 1991; Roberts, 1992), corporate age (Roberts, 1992), corporate
size (Adams et al., 1998; Cowen et al., 1987; Hackston & Milne, 1996; Patten, 1991),
business complexity (Boesso & Kumar, 2007), country of origin (Cowen et al., 1987,
Guthrie & Parker, 1990) and percentage of ownership held by management and
shareholders holding more than 5% (Brammer & Pavelin, 2008; Cormier, Magnan & Van
Velthoven, 2005; Roberts, 1992). Each of these could serve as possible variables to
assess the relationship between this construct and the firm’s CSR disclosure strategy.
Other potential variables include the presence of a CSR reporting committee within the
board of directors, corporate governance structure as defined by the ratio of independent
board members and the total number of board members (Boesso & Kumar, 2007; Cowen
et al., 1987).
Consistent with prior research, four variables have been chosen to represent these
non-financial corporate characteristics. They include the firm size (Cormier & Magnan,
2003; Cormier, Magnan &Van Velthoven, 2005), firm age (Roberts, 1992), the presence
of a board level CSR committee (Cowen et al., 1987) and the corporate governance
structure (Boesso & Kumar, 2007). Legitimacy, stakeholder and institutional theories all
support this construct.

47
Firm Size. Given the increased scrutiny larger firms receive from stakeholders;
the size of a company is believed to be related to CSR activities. Larger companies are
also believed to have more resources that can be directed to the disclosure of CSR
activities. As a result, firm size has been examined in past research and been shown to be
positively related to the quantity and quality of CSR disclosures (Adams et al., 1998;
Cowen et al., 1987; Hackston & Milne, 1996; Patten, 1991). Company size has been
measured in a variety of different ways; including number of employees (Boesso &
Kumar (2007), total asset value (Gamerschlag et al. (2011), sales volume (Fortanier, Kolk
& Pinkse, 2011) and Fortune 500 rank (Cowen et al., 1987).
Hypothesis 1a: There is a positive relationship between the firm’s size and the
GRI application level it chooses to declare.
Hypothesis 1b: There is a positive relationship between the firm’s size and the
firm’s choice of third party assurance.
Firm age. Older firms are believed to have a more established reputation, which
would in turn make them more likely to report their CSR activities than newer firms. The
majority of studies that have examined the relationship between firm age and CSR
disclosures have found a positive relationship (Bayoud, Kavanagh & Slaughter, 2012;
Dhaliwal et al., 2012; Roberts, 1992). One study, which examined the relationship
between the firm’s age and environmental disclosure, produced an opposite effect and the
relationship was shown to be negative (Liu & Anbumozhi, 2009). It is important to note
that firm age in that study was defined as the length of time that the company had been
listed on the Chinese stock exchange. Given these conflicting results and our intention to
examine CSR disclosure strategies rather than the level of environmental disclosure, it is

48
necessary to examine this relationship. Based on the majority of findings, age is expected
to be directly related to firm’s CSR disclosure strategy.
Hypothesis 2a: There is a positive relationship between the firm’s age and the
GRI application level it chooses to declare.
Hypothesis 2b: There is a positive relationship between the firm’s age and the
firm’s choice of third party assurance.
Business complexity. Some scholars have suggested that the complexity that
results from geographic or business unit diversification leads many firms to be less
transparent (Bushman, Chen, Engel, & Smith 2004; Ge & McVay, 2010). Others have
suggested that increased levels of business complexity lead to increases in the flow of
information (Boesso & Kumar, 2007; Dilling, 2010; Healy & Palepu, 2001). Despite
these opposing viewpoints, the relationship between business complexity and the volume
and quality of CSR disclosures were examined and found to be significant (Boesso &
Kumar, 2007; Dilling, 2010). Given the increased complexity of business and the
expectations of stakeholders, the relationship between business complexity and CSR
disclosure strategy will be examined. Both the number of operating segments and
geographic segments within a firm has been used previously to measure business
complexity (Ge & McVay, 2010).
Hypothesis 3a: There is a positive relationship between the firm’s business
complexity and the GRI application level it chooses to declare.
Hypothesis 3b: There is a positive relationship between the firm’s business
complexity and the firm’s choice of third party assurance.
Board level CSR committee. The presence of a board level committee focused on

49
CSR has been examined previously in relation to social disclosure. It was believed that
the influence of this committee could lead to increased volume of reporting. However,
the only effect that was shown was with the volume of human resource related
disclosures (Cowen et al., 1987). Given the role of the board and its interest in the firm’s
strategy, it is hypothesized here that such a committee would likely have a greater effect
on the firm’s CSR disclosure strategy.
Hypothesis 4a: There is a positive relationship between the presence of a board
level CSR committee with the firm and the GRI application level
it chooses to declare.
Hypothesis 4b: There is a positive relationship between the presence of a board
level CSR committee with the firm and the firm’s choice of third
party assurance.
Corporate governance structure. Corporate governance structures have shifted
beyond their traditional focus. Boards of directors are increasingly expected to address
the needs of both shareholders and other stakeholders who may be impacted by the firm
(Boesso & Kumar, 2007; Eng & Mak, 2003; Prado-Lorenzo et al., 2009; Zahra &
Stanton, 1988). In corporate governance structures, independent directors are uniquely
qualified to monitor the actions of the firm’s corporate managers and help ensure all
stakeholders are represented (Boesso & Kumar, 2007; Eng & Mak, 2003; Fama &
Jensen, 1983; Kaplan & Minton, 1994; Prado-Lorenzo, et al., 2009). Because of this,
scholars have suggested that firms with a higher ratio of independent board members to
the total number of board members may be more likely to provide a higher quantity and

50
quality of disclosures for stakeholders (Eccles et al., 2001).
Hypothesis 5a: There is a positive relationship between the firm’s corporate
governance structure and the GRI application level it chooses
to declare.
Hypothesis 5b: There is a positive relationship between the firm’s corporate
governance structure and the firm’s choice of third party
assurance.
Financial performance of the firm. Firm financial performance, the model’s
second construct, is included to varying degrees in the models proposed by both Ullmann
(1985) and Adams (2002). In Ullmann’s model, the firm’s financial performance serves
as a distinct construct. With Adams, financial performance falls under corporate
characteristics. This construct finds its theoretical support in both legitimacy and
institutional theories
Prior research has examined the impact of return on assets (Patten, 1991,
Hackston & Milne, 1996), one year lagged return on assets (Patten, 1991), change in net
income from the previous period (Patten, 1991), systematic risk – Beta (Roberts, 1992)
and the firm's annual stock market return (Cormier, Magnan & Van Velthoven, 2005) on
the volume and quality of CSR disclosures. This relationship has been previously
examined using several different variables. However, results have been mixed. The
variables that have been used include return on equity (Roberts, 1992), current return on
assets (Hackston & Milne, 1996; Patten, 1991), one year lagged return on assets (Gray, et
al, 1995; Hackston & Milne, 1996; Patten, 1991; Roberts, 1992) and systemic risk
(Roberts, 1992).

51
Lagged return on equity. Current return on equity (ROE) seemingly has no
relationship to the volume or quality of CSR disclosures (Cowen et al., 1987; Hackston &
Milne, 1996; Patten, 1991). One year lagged return on equity based on the prior year has
not been shown to be related (Patten, 1991). Results with other measures of lagged
profits have varied, but most have shown no relationship (Cowen et al., 1987; Hackston
& Milne, 1996; Patten, 1991; Roberts, 1992). However, there are two notable
exceptions. Of those studies, one has shown a negative relationship (Patten, 1991). The
other study (Roberts, 1992) showed a positive relationship between profitability and CSR
disclosures using the average growth in return on equity over four years.
Prior results suggest that there would be no relationship between either current or
one year lagged ROE and the firm’s CSR disclosure strategy. A longer lag time of 4
years, however, has been shown to be positive (Roberts, 1992). While past results have
been mixed, there may be some relationship between financial performance over several
periods and the timing of strategy development (Cormier et al., 2004).
Hypothesis 6a: There is a positive relationship between the firm’s average growth
in return on equity, over the 4-year period prior to reporting and
the GRI application level it chooses to declare.
Hypothesis 6b: There is a positive relationship between the firm’s average
growth in return on equity, over the 4-year period prior to
reporting and the firm’s choice of third party assurance.
Systematic risk – Beta. Research suggests a negative relationship exists between
systematic risk and the level of social disclosure (Roberts, 1992). This is consistent with
prior findings that showed evidence of a relationship between the firm’s CSR activities

52
and its improved access to capital (McGuire, Sundgren & Schneeweis 1988; Moskowitz,
1972). With reduced systematic risk, capital markets may view firms that have a
strategy to report CSR disclosures at the highest level as more legitimate and less risky.
Hypothesis 7a: There is a negative relationship between the firm’s systematic
risk and the GRI application level it chooses to declare.
Hypothesis 7b: There is a negative relationship between the firm’s systematic
risk and the firm’s choice of third party assurance.
Stakeholder involvement. In Ullmann’s (1985) model, the concept of
stakeholder power is focused on the ability to control resources. However, the variables
that were later tested by Roberts (1992) seem to speak less to the power of the
stakeholder and more to the firm’s involvement with stakeholders. These variables
included the number of public affairs staff members (Roberts, 1992), the level of
corporate philanthropy and corporate sponsorship of a philanthropic foundation (Roberts,
1992), government fines (Huang & Kung, 2010; Neu et al., 1998), print and online media
exposure (Cormier et al., 2005; Neu et al., 1998) and corporate reputation (Bebbington et
al., 2008; Othman et al., 2011).
The global marketplace is increasingly complex. Companies face an increasing
number of obstacles that have the potential to influence both their reputation and their
financial success (Crittenden, Crittenden, Ferrell, Ferrell & Pinney, 2011). Given these
challenges and the increased need for firms to gain support from stakeholders, a more
representative set of variables are required to measure stakeholder involvement
(Donaldson & Preston, 1995). This construct builds upon Ullmann’s (1985) theoretical
model and the original research of Roberts (1992) and is supported by stakeholder theory.
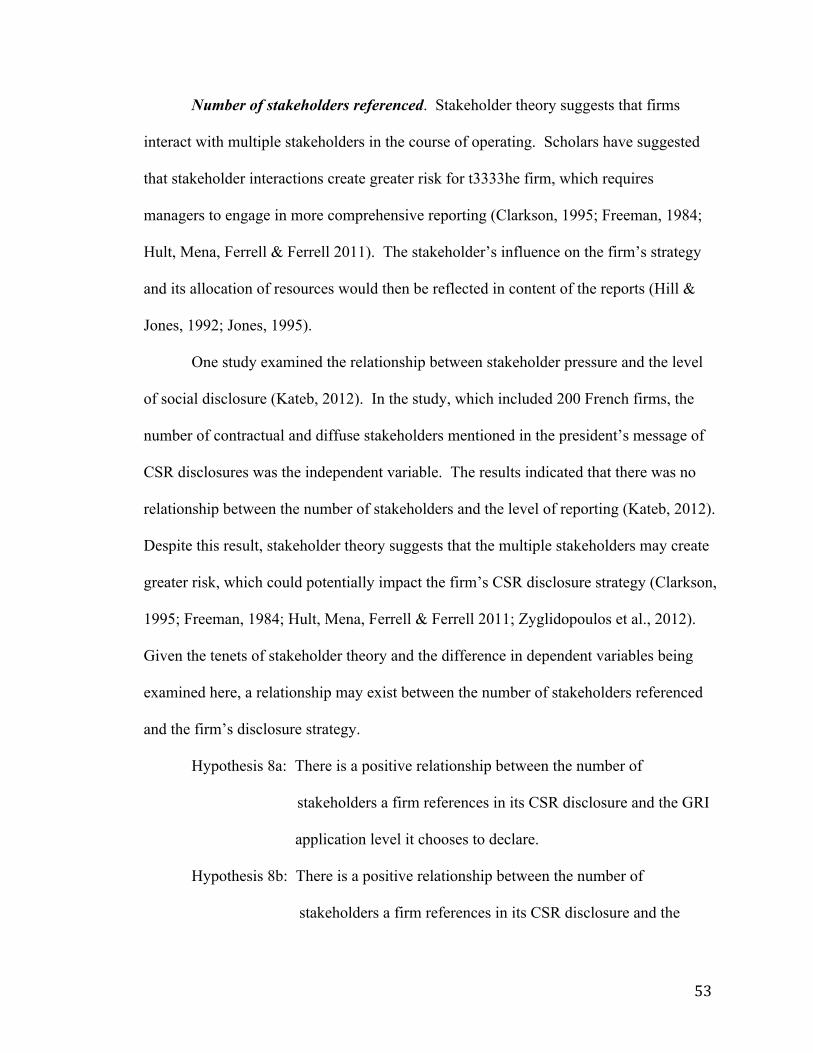
53
Number of stakeholders referenced. Stakeholder theory suggests that firms
interact with multiple stakeholders in the course of operating. Scholars have suggested
that stakeholder interactions create greater risk for t3333he firm, which requires
managers to engage in more comprehensive reporting (Clarkson, 1995; Freeman, 1984;
Hult, Mena, Ferrell & Ferrell 2011). The stakeholder’s influence on the firm’s strategy
and its allocation of resources would then be reflected in content of the reports (Hill &
Jones, 1992; Jones, 1995).
One study examined the relationship between stakeholder pressure and the level
of social disclosure (Kateb, 2012). In the study, which included 200 French firms, the
number of contractual and diffuse stakeholders mentioned in the president’s message of
CSR disclosures was the independent variable. The results indicated that there was no
relationship between the number of stakeholders and the level of reporting (Kateb, 2012).
Despite this result, stakeholder theory suggests that the multiple stakeholders may create
greater risk, which could potentially impact the firm’s CSR disclosure strategy (Clarkson,
1995; Freeman, 1984; Hult, Mena, Ferrell & Ferrell 2011; Zyglidopoulos et al., 2012).
Given the tenets of stakeholder theory and the difference in dependent variables being
examined here, a relationship may exist between the number of stakeholders referenced
and the firm’s disclosure strategy.
Hypothesis 8a: There is a positive relationship between the number of
stakeholders a firm references in its CSR disclosure and the GRI
application level it chooses to declare.
Hypothesis 8b: There is a positive relationship between the number of
stakeholders a firm references in its CSR disclosure and the

54
firm’s choice of third party assurance.
Corporate sponsorship of a philanthropic foundation. Corporate philanthropy is
one of the four primary CSR dimensions described by Carroll (1991). Some have argued
that corporate philanthropy has been used as a way to secure legitimization (Ashforth &
Gibbs, 1990; Chen, Patten & Roberts, 2008). A corporate philanthropic foundation
provides the firm with a means to make strategic contributions (Rosebush, 1987). The
relationship between corporate sponsorship of a philanthropic foundation and the firm’s
level of social disclosure has also been examined in previous research and found to be
highly significant (Roberts, 1992). Since Roberts examined this relationship, others have
examined the relationship between charitable giving and social performance. However,
those studies have looked at the actual contribution level rather than whether a firm had a
corporate charitable foundation (Chen, Patten & Roberts, 2008).
Hypothesis 9a: There is a positive relationship between the firm’s corporate
sponsorship of a philanthropic foundation and the GRI
application level it chooses to declare.
Hypothesis 9b: There is a positive relationship between the firm’s corporate
sponsorship of a philanthropic foundation and the firm’s
choice of third party assurance.
Media exposure. Media exposure has been previously examined as a measure of
society’s interest in a company’s CSR activities, specifically those focused on the
environment (Aerts, Cormier & Magnan, 2006; Brammer & Pavelin, 2006; Cormier &
Magnan, 2003; Cormier, Magnan & Van Velthoven, 2005; Kennedy, 2008; Neu et al.,
1998, Zyglidopoulos et al., 2012). This variable is represented by the number of news

55
items produced about the firm in a given year. Data in past studies have been drawn from
the Factiva (Brammer & Pavelin 2008), ABI/Inform (Cormier & Magnan, 2003; Cormier,
Magnan & Van Velthoven, 2005) and Lexis/Nexis databases (Nikolaeva & Bicho, 2011).
One limitation of these databases is that they do not include forms of social media
like Twitter and blogs. Social media analysis tools like Edelman’s TweetLevel and
BlogLevel do exist to analyze these mediums, however, they have only been used in
academic research on a limited basis and have multiple limitations (Solis & Webber,
2012: Tinati, Carr, Hall & Bentwood, 2012).
Hypothesis 10a: There is a positive relationship between the firm’s media
exposure and the GRI application level it chooses to declare.
Hypothesis 10b: There is a positive relationship between the firm’s media
exposure and the firm’s choice of third party assurance.
Corporate reputation. Reputational risk and reputational benefit are mentioned
twenty-six times in the GRI G3 Guidelines (GRI, 2012). Each reference is made to
convey the importance of CSR activities and suggest the benefit of disclosing those
activities. Scholars have also suggested there is a need for strategically focused CSR
disclosures. These allow the firm to communicate with stakeholders about what is being
done to manage a wide range of environmental, social and economic risks. This,
however, has only been minimally examined (Bebbington et al., 2008; Friedman &
Miles, 2001; Unerman, 2008). Examining this variable would also build upon the models
proposed by Ullmann (1985) and Adams (2002).
Hypothesis 11a: There is a positive relationship between the firm’s corporate
reputation and the GRI application level it chooses to declare.

56
Hypothesis 11b: There is a positive relationship between the firm’s corporate
reputation and the firm’s choice of third party assurance.
Environmental turbulence. The fourth dimension of the model is environmental
turbulence which is commonly defined as the loss of stability created by difficult to
predict environmental changes (Berthon et al., 2008; Haleblian & Finkelstein, 1993;
Hristache & Iacob, 2012). This is an example of institutional pressures described in the
literature (Jackson & Apostolakou 2010) and consists of both economic and political
turbulence. Both forms of turbulence have been measured using a variety of variables.
While these factors can be difficult to measure, a variety of variables have been described
in the literature by management, economics and political science scholars that would be
appropriate.
While this dimension represents a subset of the general contextual factors
described by Adams (2002), it goes well beyond what had been previously described in
the literature. This research provides more specificity in terms of the variables. It also
includes both national and industry focused measures, which builds upon previous
research.
Economic turbulence. Economic turbulence has often been described in the
literature as rapid, unpredictable changes to the environment that affect corporate
performance (Hristache & Iacob, 2012). More specifically, the term has been used to
refer to both national level changes and to industry level changes (Akhter & Daly, 2009;
Deephouse & Wiseman, 2000; Ljungqvist & Sargent, 1998, 2004; Rissman, 1997).
Because of its unpredictability, economic turbulence presents significant challenges to

57
the firm, but it may be beneficial. That is, more mature organizations may emerge from
economic turbulence better prepared to build or strengthen an existing competitive
advantage (Hristache & Iacob, 2012).
Some scholars have examined economic turbulence in terms of national level
changes to gross domestic product, unemployment, inflation and/or interest rates (Akhter
& Daly, 2009; Deephouse & Wiseman, 2000; Ljungqvist & Sargent, 1998, 2004;
Rissman, 1997). Others have focused on industry level changes as a means to
demonstrate instability in the environment and a variety of measures have been
suggested. These include industry concentration, product dynamism, industry
vulnerability, demand instability and market share instability (Haleblian & Finkelstein,
1993, Hambrick, 1983, Hambrick & Abrahamson, 1995). Given that both economic
measures and industry focused measures have been used, both types are reflected in the
hypotheses.
Hypothesis 12a: There is a positive relationship between standard deviation of
per capita GDP growth and the GRI application level it chooses
to declare.
Hypothesis 12b: There is a positive relationship between standard deviation of
per capita GDP growth and the firm’s choice of third party
assurance.
Hypothesis 13a: There is a positive relationship between performance
risk and the GRI application level it chooses to declare.
Hypothesis 13b: There is a positive relationship between performance
risk and the firm’s choice of third party assurance.

58
Hypothesis 14a: There is a positive relationship between demand
instability and the GRI application level it chooses to declare.
Hypothesis 14b: There is a positive relationship between demand
instability and the firm’s choice of third party assurance.
Political turbulence. Political turbulence has been examined using components
from the International Country Risk Guide (ICRG) to assess political risks for a firm’s
country of origin (Adsera et al., 2003). The ICRG is based on the observations of
country level experts who assess each country based on twelve components of political
risk (International Country Risk Guide, 2012). Since its introduction, researchers have
commonly chosen specific components based on the research focus (Williams &
Siddique, 2008).
The components, which will be used for this research, have been used in prior
research (Adsera et al., 2003, Ackerman & Tobin, 2005). The first component,
government stability, assesses the government’s ability to carry out its priorities. It
specifically examines government unity, legislative strength and popular support in a
given country. The second component, law and order, assesses the strength and
impartiality of a country’s legal system and the citizen’s willingness to observe the law.
The final component, bureaucratic quality, assesses the expertise, quality and stability of
elected officials and their administrative counterparts (ICRG, 2012).
Hypothesis 15a: There is a positive relationship between the Government
Stability Index for the firm’s country of origin and the
GRI application level it chooses to declare.
Hypothesis 15b: There is a positive relationship between the Government

59
Stability Index for the firm’s country of origin and the
firm’s choice of third party assurance.
Hypothesis 16a: There is a positive relationship between the Law and Order
Index for the firm’s country of origin and the GRI application
level it chooses to declare.
Hypothesis 16b: There is a positive relationship between the Law and Order
Index for the firm’s country of origin and the firm’s choice of
third party assurance.
Hypothesis 17a: There is a positive relationship between the Bureaucracy Quality
Index for the firm’s country of origin and the GRI application
level it chooses to declare.
Hypothesis 17b: There is a positive relationship between the Bureaucracy Quality
Index for the firm’s country of origin and the firm’s choice of
third party assurance.
The intent of this research is to understand the factors that influence a firm’s
disclosure strategy. Theory and prior research suggest that there are four major
constructs that ultimately lead to disclosure strategy. The next chapter describes the
proposed methodology to test the four dimensional model described above.

60
CHAPTER 3
Methodology
This research examined the relationship between a four-dimensional model of
reporting determinants and a firm’s CSR disclosure strategy. The proposed model which
built on legitimacy, institutional and stakeholder theories includes the following
constructs: corporate characteristics, the firm’s financial performance, the involvement of
the firm’s stakeholders and environmental turbulence. The firm’s CSR disclosure
strategy is reflected in the combination of the GRI application level chosen by the firm
and the presence or absence of third party assurance.
Executive Interviews
Executive interviews are a common means used by researchers to explore CSR
reporting (Adams, 2002; Arviddson, 2010; Islam & Deegan, 2010). In addition to the
quantitative study outlined below, this research included interviews with five executives
responsible for determining their firm’s CSR disclosure strategy. The purpose of these
semi-structured, in-depth interviews (Fontana & Frey, 1994) was to gain additional
insights into the suitability of the proposed constructs and a greater understanding of the
managerial implications of this research. The constructs and expected relationships
derived from the literature and from theory serve as the framework for the interviews.

61
The executives participating in this phase of the research were drawn from firms
included in the GRI registry used subsequently in the quantitative research. A total of
five executives were interviewed with no two executives from the same company,
country or sector. The inclusion of different industries helped provide a reasonable cross-
section of different views of CSR reporting. The interview procedure was identical for
all participants (Arviddson, 2010). Each was contacted prior to the interview. At that
time, the purpose of the interviews was described and the executive was invited to
participate. All interviews were conducted by phone unless proximity allowed for an in-
person interview (Arviddson, 2010; Owen, Swift & Hunt, 2001). A list of the questions
that were used to guide the semi-structured interview process is included in Appendix B.
Quantitative Study
The quantitative portion of this study relied on data derived from the GRI registry,
Capital IQ and public databases. This research was the first to use either the GRI registry
or Capital IQ in CSR disclosure research. Of the secondary sources, only public
databases have been used previously in CSR disclosure research. Past studies focused on
the content and quality of disclosures have relied upon either primary data developed
through the use of content analysis or data derived from annual reports. However, the
generalizability of studies that have used content analysis has been limited because
content analysis limits the number of firms that can be examined (Gamerschlag et al.,
2011).
While GRI guidelines have been previously examined (Nikolaeva & Bicho,
2011), the research did not examine the GRI disclosure registry. The registry lists all
CSR disclosures that have employed the GRI guidelines between 1999 and 2012. While

62
the types of data that have been collected have varied over the life of the registry, all
entries between 2007 and 2012 have included the organizations name, its size, its sector,
country, region, the type of report, the application level and manner in which the
application level was determined. Listings for 2011 and 2012 also include the
organizational type (state, public or private) and whether or not the firm is listed.
Sample
A sample of global publicly traded firms was drawn from a reporting registry
maintained by the Global Reporting Initiative. The registry lists firms that have utilized
the reporting framework since it was first introduced. However, only those firms that
have used the G3 Guidelines in their reporting are focused on here. Before the G3
Guidelines were adopted in 2006, GRI had fewer requirements and required the firm to
make fewer choices regarding their disclosure strategy. Table 6 shows the number of
reports with an application level of A, B or C that have been entered into the registry
since the G3 Guidelines were introduced.
The data set was derived from the 2011 GRI Registry. It included 1,909 public
and private firms as well as cooperatives, non-profit organizations, partnerships, state
owned companies and subsidiaries with an application level of A+, A, B+, B, C+ or C.
Table 7 shows the distribution of all of the 2011 GRI reports across application levels.
In order to arrive at a final data set, several steps were taken. First, because this
study focused on publicly traded firms, organizations that are not listed on a stock
exchange were eliminated. Second, firms with duplicate listings were removed. Finally,
an additional group of companies was eliminated because of limited available data in

63
Capital IQ and public databases. This resulted in a sample of 535 global publicly traded
firms. This sample represents 28% of the total reports.
Table 6
Number of Records with Application Levels in the GRI Registry
Year Number of Records
2007 430
2008 770
2009 1,154
2010 1,561
2011 1,909
2012 764
Table 7
Total Population Distribution of 2011 GRI Reports Across Application Levels
Application
Level Number of
Reports A+ 471 A 200
B+ 272 B 417
C+ 112 C 437
Total 1909
64
With logistic regression, Hair, et al. (2010) recommend that there be both an
analysis sample and a holdout sample. While the data set used in this study exceeds the
400 recommended for the analysis sample, it is not large enough to provide for a similar
sized holdout sample. This eliminates the possibility of a holdout sample that would
allow for validation of the logistic model (Hair et al., 2010; Hosmer & Lemeshow,
2000). Hair, et al. (2010) also suggest a minimum of 10 observations per independent
variable. With 17 hypotheses, this would suggest a minimum of sample of 170 and this
sample meets that requirement.
Analytical Approach
In past CSR disclosure research, logistic regression has been commonly used by
scholars (e.g. Dhaliwal, Li, Tsang & Yang, 2011; Kolk & Perego, 2010; Kolk & Pinkse,
2010; Perez-Batres, Miller & Pisani, 2010; Roberts, 1992). In this research, the
dependent variables that were analyzed were categorical rather than metric. Given the
nature of these variables, logistic regression was also considered the most appropriate
analytical approach for this study. Using this method provides researchers with the
ability to analyze categorical dependent variables and metric and non-metric independent
variables. It also provides robust statistical tests and a wide range of diagnostic tools to
ensure goodness of fit (Hair et al., 2010; Hosmer & Stanley, 2000).
Variable Delineation
Dependent Variable
The combination of the firm’s chosen GRI application level and the presence or
absence of assurance reflects the firm’s CSR disclosure strategy. This serves to signal its

65
legitimacy and is consistent with both stakeholder and legitimacy theories. In this
research, the firm’s CSR disclosure strategy was represented by two variables:
application level and third-party assurance. With the GRI G3 Guidelines, there are three
application levels from which the firm may choose. That which is chosen is dependent
on the firm’s level of reporting and its adherence to the corresponding standards outlined
by GRI. The application levels, A, B, C are variables and were coded in this study as 3, 2
or 1 respectively. While this dependent variable has not been examined in past research,
it does represent a fundamental choice that firms must make in executing their disclosure
strategy.
The presence or absence of third party assurance was the second dependent
variable. This is considered a key strategic decision because CSR disclosures may have
more legitimacy if reviewed and assured by an independent third party. This is similar to
financial data that are viewed as reliable because the have been subjected to an audit
(Holder-Webb, et al 2009). The presence or absence of third party assurance is also
included in the data reported to GRI. Determining whether or not to pursue third party
assurance is an important decision the firm must make in determining its disclosure
strategy. The presence or absence of third party assurance was coded as 1 or 0.
Exploratory variables used in the study are described below and are organized by
construct consistent with the model proposed for this research.
Explanatory Variables
The explanatory variables in this study reflect constructs in the proposed four-
dimensional model of reporting determinants as shown in Figure 1 (see Chapter 1).

66
The proposed model builds upon the previous work of Ullmann (1985) and Adams
(2002). It includes the following constructs: non-financial corporate characteristics, the
firm’s financial performance, the involvement of the firm’s stakeholders and
environmental turbulence.
Non-financial corporate characteristics. Consistent with prior research, four
variables have been chosen to represent non-financial corporate characteristics. They
include the firm size (Cormier & Magnan, 2003; Cormier, Magnan &Van Velthoven,
2005), firm age (Roberts, 1992), the presence of a board level CSR committee (Cowen et
al., 1987) and the corporate governance structure (Boesso & Kumar, 2007).
Firm size. Company size has been measured in a variety of different ways,
including number of employees, total asset value, sales volume and Fortune 500 rank.
Consistent with Boesso & Kumar (2007) and Prado-Lorenzo, Gallego-Alvarez and
Garcia-Sanchez (2009), company size will be measured as the number of employees.
The firm’s number of employees will be drawn from the Capital IQ database.
Firm age. Older firms are believed to have a more established reputation, which
would in turn make them more likely to report their CSR activities than newer firms. The
majority of studies that have examined the relationship between firm age and CSR
disclosures have reported a positive linear relationship (Bayoud et al., 2012; Dhaliwal et
al., 2012; Roberts, 1992). This variable is defined as the age of the corporation from
inception to 2011 and will be derived from the Capital IQ database.
Board level CSR committee. The presence of a board level committee focused on
CSR has been examined previously in relation to social disclosure. It was believed that
the influence of this committee could lead to increased volume of reporting. However,

67
the only effect that was shown was with the volume of human resource related
disclosures (Cowen et al., 1987). Given the role of the board and its interest in the firm’s
strategy, it is hypothesized here that such a committee would likely have a greater effect
to the firm’s CSR disclosure strategy. The presence or absence of a board level CSR
committee is coded as 1 or 0 respectively. This data will be drawn from the Capital IQ
database.
Business complexity. Given the increased complexity of business and the
expectations of stakeholders, business complexity is included as a variable. Both the
number of operating segments and geographic segments within a firm have been used
previously to measure business complexity (Boesso & Kumar, 2007; Ge & McVay, 2010;
Hossain & Hammami, 2009). As such, both will be collected for 2011. This data will be
drawn primarily from the Capital IQ database. When data is not available in the Capital
IQ database, it will be drawn from the firm’s annual report or its 10-K filings.
Corporate governance structure. Scholars have suggested that firms with a
higher ratio of independent board members to the total number of board members may be
more likely to provide stakeholders with a higher quantity and quality of CSR disclosures
(Boesso & Kumar, 2007: Eccles et al., 2001). This ratio will be calculated using the
number of independent directors and total directors for each firm as found in the Capital
IQ database.
Financial performance of the firm. Firm financial performance is included in
the models proposed by both Ullmann (1985) and Adams (2002). The variables that have
been used include: return on equity (Roberts, 1992), current return on assets (Hackston &
Milne, 1996; Patten, 1991), one year lagged return on assets (Gray, et al, 1995; Hackston
68
& Milne, 1996; Patten, 1991; Roberts, 1992) and systemic risk (Roberts, 1992).
Lagged return on equity. Based on prior results, neither current nor one year
lagged ROE were found to have a relationship with the quantity and quality of CSR
reporting (Cowen et al., 1987; Hackston & Milne, 1996; Patten, 1991). Given those
findings, this study will examine the average ROE over the four-year period preceding
the disclosure (Roberts, 1992). This data will be drawn from the Capital IQ database.
Systematic risk – Beta. With reduced systematic risk, capital markets may view
firms that have a strategy to report CSR disclosures at the highest level as more
legitimate and less risky (Roberts, 1992). Systematic risk will be measured using the
firm’s Beta for 2011, which will be drawn from the Capital IQ database.
Stakeholder involvement. The involvement of the firm with its stakeholders will
be represented by four specific variables. These include: (1) the number of stakeholders
referenced (Kateb, 2012), (2) the sponsorship of a philanthropic foundation (Roberts,
1992), (3) media exposure (Hyman & Mathur 2005; Nikolaeva & Bicho, 2011) and (4)
corporate reputation (Othman et al., 2011).
Number of stakeholders referenced. The recognition of stakeholders and the
firm’s involvement with them can be noted in the firm’s reference to stakeholders in the
company’s disclosures. This information will be drawn from the firm’s CSR disclosure
and will measure the number of stakeholders a firm references in its 2011 CSR disclosure
(Hill & Jones, 1992; Jones, 1995; Kateb, 2012).
Corporate sponsorship of a philanthropic foundation. In this research, the
sponsorship of a philanthropic foundation is coded as 1 and the absence of sponsorship of
a philanthropic foundation is coded as 0. The source is consistent with past research.

69
This information will be derived from the Europa International Foundation Directory
(Roberts, 1992).
Media exposure. Consistent with past research, media exposure will be defined
as the number of news items produced about the firm in a given year (Fiss & Zajac,
2006). Companies included in the sample will be reviewed for the number of stories
published which focus on the firm’s CSR and CSR disclosures in 2011 (Zyglidopoulos et
al, 2012). This information will be drawn from the Lexis/Nexis database includes news
from selected major US and international publications, news wire services and transcripts
of radio and television broadcast (Hyman & Mathur 2005; Nikolaeva & Bicho, 2011).
Corporate reputation. Several measures have been used to assess reputation,
including the Fortune Most Admired Companies and Financial Times Most Respected
Companies. These measures and others like them are limited in that they only assess a
small subset of companies. They also tend to have a financial bias (Othman et al., 2011).
In order to address these issues, some scholars have used the Reputation Institute’s
RepTrak as a measure of corporate reputation (Fombrun & Pan, 2006; Vidaver-Cohen
2007). This index has been tested with over 2,000 companies globally and measures the
perceptions across countries, industries and stakeholder segments based on seven
dimensions. These include product and services, performance, citizenship, workplace,
governance, leadership and innovation (Reputation Institute, 2012). Specific dimensions
can be isolated. This was done in recent research where citizenship, workplace and
governance were isolated to create a measure of CSR reputation (Othman et al., 2011).
For this research, the Reputation Institute’s RepTrak will be used.

70
Environmental turbulence. The fourth dimension of the model is environmental
turbulence. This dimension represents a subset of the general contextual factors
described by Adams (2002). The factors include social, political and economic factors.
Environmental turbulence is commonly defined as the loss of stability created by difficult
to predict environmental changes (Berthon et al., 2008; Haleblian & Finkelstein, 1993).
This consists of both economic and political turbulence, which have been measured using
a variety of variables. While these factors can be difficult to measure, a variety of
variables have been described in the literature by management, economics and political
science scholars that would be appropriate.
Economic turbulence. Economic turbulence has often been described in the
literature in terms of both national and industry level changes (Akhter & Daly, 2009;
Deephouse & Wiseman, 2000; Ljungqvist & Sargent, 1998, 2004; Rissman, 1997).
Previous research has examined economic turbulence is terms of changes to gross
domestic product, unemployment, inflation and/or interest rates (Akhter & Daly, 2009;
Deephouse & Wiseman, 2000; Ljungqvist & Sargent, 1998, 2004; Rissman, 1997).
Other scholars have focused on industry concentration, product dynamism, industry
vulnerability, demand instability and market share instability (Haleblian & Finkelstein,
1993, Hambrick, 1983, Hambrick & Abrahamson, 1995). Given that both economic
measures and industry focused measures have been used, both types are reflected in the
hypotheses. GDP will be calculated as standard deviation of per capita GDP growth from
2008-2011 for the firm’s country origin. Performance risk will be calculated as the
average coefficient of variation of firm’s return on assets within a given industry. The
firm’s return on assets will be derived from the Capital IQ database. Demand instability
71
will be calculated as the average coefficient of variation of firm’s sales within a given
industry. The firm’s return on sales will be derived from the Capital IQ database.
Political turbulence. Political turbulence has been examined using components
from the International Country Risk Guide (ICRG) to assess political risks for the firm’s
country of origin (Adsera et al., 2003). The components, which will be used for this
research, include: government stability, law and order and bureaucratic quality. Each
one has been used in prior research and will focus on the firm’s country of origin (Adsera
et al., 2003, Ackerman & Tobin, 2005).
The Government Stability Index consists of three subcomponents - government
unity, legislative strength and popular support. These are rated on a five-point scale
where a score of 4 represents a very low risk and score of 0 signals a very high risk
(ICRG, 2012). The Law and Order Index is comprised of two subcomponents that are
assessed separately using a four-point scale. A score of 3 is considered high and signals
very low risk. Conversely, a score of 0 signals very high risk (ICRG, 2012). The
Bureaucracy Quality Index is used to measure the expertise, quality and stability of
elected officials and their administrative counterparts. The index components are rated
on a five-point scale. A score high of 4 points equates to high quality and low risk.
Conversely, a score of 0 signals poor quality and high risk (ICRG, 2012).
Control Variables
Industry. The firm’s industry membership has also been controlled for in a
number of studies (Adams et al., 1998; Cowen et al., 1987; Hackston & Milne, 1996;
Holder-Webb et al., 2009; Patten, 1991; Roberts, 1992). This has been done because
certain industries are known to have more intense competition, more scrutiny from

72
regulators and/or be more visible by consumers. These factors could impact both the
firm’s level of CSR activity and the disclosure practices.
In early disclosure research, dummy variables were used to distinguish between
those industries considered high and low profile. However, the industries that met this
definition varied. Roberts (1992) considered the automobile, aviation and oil industries
to be high profile while Patten (1991) focused on petroleum, chemical and forest/paper
industries. Later research by Gamerschlag et al. (2011) and Hackston & Milne (2006)
included 18 and 21 industries respectively. The number of industries was based on the
stock exchange of the country where the research was conducted - New Zealand Stock
Exchange and the Deutsche Boerse. However, just as with the early research, there was a
wide variation in the types of industries that met this definition.
The Global Reporting Initiative database categorizes companies into 38 different
industries. While there is some variance between GRI’s categories and those used
previously, there is also substantial overlap. For the purpose of this research, 20
industries, consistent with those used in prior research, will be considered high profile.
Rather than referring to a specific industry, GRI instead uses the term sector. For this
research, however, the terms will be considered interchangeable.
In the GRI database, companies within the computer industry have two different
sector categories from which to choose. One of these is referred to as the computer
sector while the other is referred to as the technology hardware sector. Because of the
similarity between them, the two categories have been collapsed to one in this research.
GRI also reports energy and water utilities as separate sectors, which differs from past
research. In order to remain consistent, energy and water utilities have been combined

73
(Gamerschlag et al., 2011; Hackston & Milne, 2006). A total listing of industries can be
found in. Firms, which are considered high profile, are coded as 1 while firms in other
sectors will be coded as 0. Consistent with Gamerschlag et al. (2011), dummy variables
will also be used to distinguish among industries.
Table 8
High Profile Industry Sectors
High Profile Sectors Low Profile Sectors
Automotive Agriculture Aviation Commercial Services Chemicals Conglomerates Computers/Technology Hardware* Construction Materials Construction Equipment Consumer Durables Healthcare Services Energy Household and Personal Products Utilities (Energy &Water)* Metal Products Financial Services Non-Profit/Services Food and Beverage Other Forest and Paper Public Agency Health Care Products Railroad Logistics/Transportation Tourism/Leisure Media Toys Mining Universities Real Estate Waste Management Retail Telecommunications Textiles and Apparel Tobacco
* denotes industry sectors that have been combined into a single sector based on past research
Number of countries. Given the use of country level variables, an additional
control variable will be the number of countries in which the company operates. The
number of geographic segments within a firm has been used previously to measure

74
business complexity (Ge & McVay, 2010). This information will be collected for
2011and will be drawn from the Capital IQ database (Boesso & Kumar, 2007; Hossain &
Hammami, 2009).
Number of years reporting. Because of the potential impact of past reporting,
the number of years a firm has reported using the GRI will be used as a control. This
number will be drawn from the GRI registry and will examine the period from 1999 to
2011.
CSR reporting practices have evolved with increased societal expectations and the
introduction and widespread adoption of reporting standards like the GRI Guidelines
(Gamerschlag et al., 2011 Gray et al., 1988; Hubbard, 2011; KPMG, 2011; Neu et al.,
1998; Nikolaeva & Bicho, 2011; Yongvanich & Guthrie, 2006). Given this evolution,
theoretical models proposed by Ullmann (1985) and Adams (2002) may no longer be
sufficient to explain the factors that influence a firm’s CSR disclosure strategy. This
study examines a four-dimensional model that builds upon those theoretical models and
incorporates research findings and environmental changes that have taken place since
their introduction. By testing the variables that have been outlined here, both scholars
and practitioners will be provided with a more comprehensive understanding of the
factors that influence a firm’s CSR disclosure strategy.

75
CHAPTER 4
Data Analysis and Findings
The semi-structured, in-depth interviews were designed to gain additional
insights into the suitability of the proposed constructs and to provide insight into each
firm’s approach to reporting. The executives who participated are responsible for
determining their firm’s CSR disclosure strategy. Care was taken to ensure that firms
who employ these individuals were drawn from the GRI Registry. Each company that
participated represented different industries and displayed different approaches to
reporting.
Two interviews were initially undertaken with firms based in the United States.
The first was conducted with Company A, an automobile manufacturer that has shown a
long-standing commitment to CSR reporting. The second was conducted with Company
B, a multi-national pharmaceutical company, that is committed to CSR reporting but
whose reporting history has been somewhat inconsistent. Often the periods where the
firm has reported have then been followed by periods of silence.
While the companies’ reporting patterns were different, the interviews revealed
similar strategies. Both companies had chosen to remain consistent in their choice of
application level and neither had chosen to pursue third party assurance. The executives
also revealed that the focus of their firm’s CSR reports and the chosen application level
are generally determined by a small group of employees who are knowledgeable about

76
the composite parts of the report. These interviews did not suggest anything that would
raise concern about the suitability of the proposed constructs.
During the period that the data set was being assembled, two additional executive
interviews were conducted with multi-national companies that are headquartered in
Europe. Each of the companies also has a long history of CSR reporting. The first of
these interviews was with Company C, which provides staffing, placement, career and
outsourcing services as well as human resources consulting. The company was included
in this research because of its reporting history and its focus on services rather than
tangible products. The second interview was conducted with Company D, which
develops, produces, and sells products in the healthcare, material science and crop
science markets. This company was included in this portion of the research because of its
broad business mix and its long-standing use of the GRI framework including third part
assurance.
Both companies expressed a strong interest in being more strategic in their
reporting. However, each is at a different stage. Company C indicated that its past
efforts had often lacked uniformity. In an effort to change this, representatives in each
country where they have operations were given a questionnaire and asked to collect the
required data from different parts of the organization. Another important step was the
review and approval of the company’s CSR report by the board of directors reviewed and
approved. This took place for the first time in 2013.
Company D looks at CSR more holistically. There are people throughout the
organization who are responsible for sustainability and this includes a member of the
Board of Directors as well as representatives from each division – healthcare, material

77
science, and crop science. Decisions about the firm’s sustainability strategy are made by
a committee, which meets three to four times per year to talk about activities and
strategies related to sustainability. These activities are then reported on an annual basis.
Company D’s efforts have become even more imbedded in the organization. In the
future, the company’s CSR reporting will be incorporated into the annual report.
Companies C and D, just like Companies A and B, have chosen to remain
consistent in their choice of application level. One major difference amongst the
companies is that Company D’s CSR report is assured by a third party. It was important
that at least one of the companies interviewed includes third party assurance as part of its
reporting strategy. It is of note that while these additional interviews helped provide
context, there continued to be nothing reported that would create concern about the
suitability of the proposed constructs.
After the data set was assembled and analyzed, a final interview was conducted
with Company E. The company is a multi-national company that develops, produces,
and markets consumer packaged goods that are distributed in the United States and select
international markets. The timing of this interview was chosen to help provide further
context to the findings as well as to suggest potential future research questions. In order
to provide the broadest perspective, it was important to ensure all of the application levels
were represented in this phase of the research.
Company E reports at the C application level and does not include third party
assurance. The firm’s disclosure strategy is to be actively prepared for issues that can be
predicted rather than to be a leader in CSR reporting. For those that cannot be predicted,
the company responds reactively on a case-by-case basis. In an effort to achieve this,

78
they monitor indicators and key forces within the industry as well as topics of interest to
customers, shareholders, non-governmental organizations and government. The risk
level associated with each is determined and this helps to inform what will be reported.
This determination rests with the Executive-VP level staff that is responsible for research
and development, human resources, operations, legal and marketing.
The interview revealed that Company E places their stakeholders in high regard.
If government proposes rules, information is shared with management and a plan of action
is suggested. If a non-governmental organization makes a request, the company weighs
the public relations risks. Shareholders also receive rapid attention. Of all their
stakeholders, however, alignment with customers and consumers is considered most
critical. Given their business model, they defined customers as those to whom they sell
direct. Consumers, on the other hand, are those who buy the firm’s products from their
customers.
The company believes that their CSR program is young. They recognize that they
have to consider the type of company they are and who their stakeholders are. They have
not felt the need to move quickly, but rather to be consistent in their reporting. They do
not have their reports assured; however, many of the inputs are assured through other
processes and organizations. As a result, third party assurance of the report was thought
to be redundant.
An additional topic that came up during the interview was impact of the UN
Global Compact and other similar efforts. The UN Global Compact is a global initiative
that is intended to align the strategies and operations of companies with certain principles
that are focused on the environment human rights, labor, and anti-corruption (UN Global

79
Compact, 2013). The company has a long heritage of environmental concern, but has
chosen to not sign on to the UN Global Compact or the Carbon Disclosure Project. It is
believed that signing on to either of these puts too much pressure on the company to drive
faster or to a place that it does not wish to go. Signing can also cause redundancy. For
example, they already report greenhouse gases. Ultimately, the company wants to
manage their own programs rather than ceding strategic choices to someone else.
Descriptive Statistics
Dependent Variables
The choice of application level communicates the firm’s level of reporting that
has been undertaken and its adherence to the corresponding standards outlined by GRI.
As shown in Table 9, firms in the data set are normally distributed across application
levels with 38.7% of firms choosing level A, 42.4% of firms choosing level B and 19.9%
choosing level C respectively. This is not dissimilar from the 2011 GRI registry in which
35% of firms chose level A, 36% of firms chose level B and 29% of firms chose level C.
Table 9
Application Level Distribution
Application Level GRI Registry Data Set
Frequency Percentage Frequency Percentage A 671 35.1 207 38.7 B 689 36.1 227 42.4 C 549 28.8 101 19.9
Total 1909 100 535 100
The second dependent variable is the presence or absence of third party assurance.
Determining whether or not to pursue third party assurance is an important decision the

80
firm must make in choosing its disclosure strategy. As shown in Table 10, firms are
nearly equally divided in their choice with 51.2% choosing to pursue third party
assurance and 48.8% choosing not to pursue third party assurance. This differs from the
2011 GRI registry. There firms were not divided as equally, with 44.8% choosing to
pursue third party assurance and 55.2% choosing not to pursue third party assurance.
Table 10
Assurance Determination Distribution
Assurance GRI Registry Data Set
Absence/Presence Frequency Percentage Frequency Percentage Presence 855 44.8 274 51.2 Absence 1054 55.2 261 48.8
Total 1909 100 535 100
The difference between the data set and the broader GRI may be explained by the
types of organizations that are included in each. The registry includes both public and
private firms as well as cooperatives, non-profit organizations, partnerships, state owned
companies and subsidiaries. The data set is focused only on public firms which are
required to provide an annual report to shareholders. This requirement exposes firms to
the value of third party assurance and may lead them to consider consistent approaches to
reporting.
Explanatory Variables
The explanatory variables in this study reflect constructs in the proposed four-
dimensional model of reporting determinants shown in Figure 1 (see Chapter 1).

81
It includes the following constructs: non-financial corporate characteristics, the firm’s
financial performance, the involvement of the firm’s stakeholders and environmental
turbulence.
Non-financial corporate characteristics. Firm size (Cormier & Magnan, 2003;
Cormier, Magnan & Van Velthoven, 2005), firm age (Roberts, 1992), the presence of a
board level CSR committee (Cowen et al., 1987) and the corporate governance structure
(Boesso & Kumar, 2007) are variables used to represent non-financial corporate
characteristics. As shown in, firm size ranged from 10 to 552,445 employees, with a
mean of 41,840.66 and a standard deviation of 69,251.81. Firms ranged in age from 3 to
421 years, with a mean of 79.30 and a standard deviation of 58.71. The number of
business segments ranged from 0 to 25 with a mean of 4.31 and a standard deviation of
2.91. The Corporate Governance ratio that is calculated using the number of independent
directors and total directors for each firm ranged from 0 to .77 with a mean of .18 and a
standard deviation of .15. Finally, of the firms in the data set, 39.3% have a board level
CSR committee while the remaining 60.7% of firms do not.
Table 11
Descriptive Statistics for Non-Financial Corporate Characteristics
N Range Min Max Mean Std. Deviation
Firm Size 535 552415 10 552425 41840.66 69251.8 Firm Age 535 418 3 421 79.3 58.7 CSR Committee 535 1 0 1
Segments -Business 535 25 0 25 4.31 2.91
Corp Gov Ratio 535 0.77 0 0.77 0.18 0.15

82
Financial performance of the firm. Firm financial performance was represented
by four year lagged return on equity (Roberts, 1992) and Beta (Roberts, 1992).
Descriptive statistics for each of these variables can be found in Table 12. Four year
lagged return on equity ranged from -2.08 to 12.09 with a mean of .18 and a standard
deviation of .61. Given this range, the mean suggests that there may be a small number
of companies who report scores near the maximum. A review of the raw data showed 5
firms of 535 have lagged ROE above 1. Beta ranges from -.27 to 3.35 with mean of .89
and a standard deviation of .53.
Table 12
Descriptive Statistics for Financial Performance of the Firm
N Range Min Max Mean Std. Dev
Lagged ROE 535 14.17 -2.08 12.08 0.18 0.61 Beta 535 3.62 -0.27 3.35 0.89 0.53
Stakeholder involvement. The involvement of the firm with its stakeholders is
represented by four specific variables. These include: (1) the number of stakeholders
referenced (Kateb, 2012), (2) the sponsorship of a philanthropic foundation (Roberts,
1992), (3) media exposure (Hyman & Mathur 2005; Nikolaeva & Bicho, 2011) and (4)
corporate reputation (Othman et al., 2011). Descriptive statistics for each of these
variables can be found in Table 13.
The recognition of stakeholders and the firm’s involvement with them can be
noted in the firm’s reference to stakeholders in the company’s disclosures. The number
of stakeholders referenced ranges from 1 to 22 with a mean of 7.36 and a standard

83
deviation of 2.32. One company was a significant outlier with 22 stakeholders
referenced. The next largest was 14.
Table 13
Descriptive Statistics for Stakeholder Involvement
N Range Min Max Mean Std. Dev
Stakeholders 535 21 1 22 7.36 2.32 Corp Foundation 535 1 0 1 Media Exposure 535 442 0 442 18.11 42.78 Corp Reputation 103 81 0 81 67.26 9.75
A corporate philanthropic foundation provides the firm with a means to make
strategic contributions (Rosebush, 1987). Of the firms studied here, 44.3% directed their
philanthropic efforts through their corporate foundation. The remaining 55.7% of firms
did not have a corporate foundation.
Consistent with past research, media exposure was defined as the number of news
items produced about the firm in a given year (Fiss & Zajac, 2006). Companies included
in the sample were reviewed for the number of stories published which focus on the
firm’s CSR and CSR disclosures in 2011 (Zyglidopoulos et al, 2012). For the data set,
the number of news stories focused on CSR ranged from 0 to 442 with a mean of 18.11
and a standard deviation of 42.78
One of the issues noted in the original proposal is that with studies used to
evaluate reputation, there are often limited numbers of companies that are assessed. In
order to overcome this issue, some scholars have used the Reputation Institute’s RepTrak
as a measure of corporate reputation (Fombrun & Pan, 2006; Othman et al., 2011;

84
Vidaver-Cohen 2007). However, an examination of companies included in this data set
revealed that only 103 of the 535 companies who report an application level have a
publicly available RepTrak score. This represented less than twenty percent. For these
companies, reputation scores ranged from 42.79 to 81.00 with a mean of 67.26 and a
standard deviation of 9.75.
Environmental turbulence. Environmental turbulence consists of both
economic and political turbulence. Economic turbulence has often been described in the
literature in terms of both national and industry level changes (Akhter & Daly, 2009;
Deephouse & Wiseman, 2000; Ljungqvist & Sargent, 1998, 2004; Rissman, 1997). It is
measured by standard deviation of per capita GDP growth, performance risk and demand
instability. GDP was calculated as standard deviation of per capita GDP growth from
2008-2011 for the firm’s country of origin. Political turbulence was measured by the
Government Stability Index, the Law and Order Index and the Bureaucracy Quality
Index.
As shown in Table 14, performance risk ranged from 0 to 6.50 with mean of .38
and a standard deviation of .45. Demand instability ranged from 0 to 8.55 with a mean of
.38 and a standard deviation of .97. The Government Stability Index scores ranged from
5.00 to 10.63 with a mean of 7.21 and a standard deviation of 1.16. The Law and Order
Index scores ranged from 2.00 to 6.00 with a mean of 4.78 and a standard deviation of
1.06. The Bureaucracy Quality Index scores ranged from 1.00 to 4.00 with a mean of
3.43 and a standard deviation of .79.
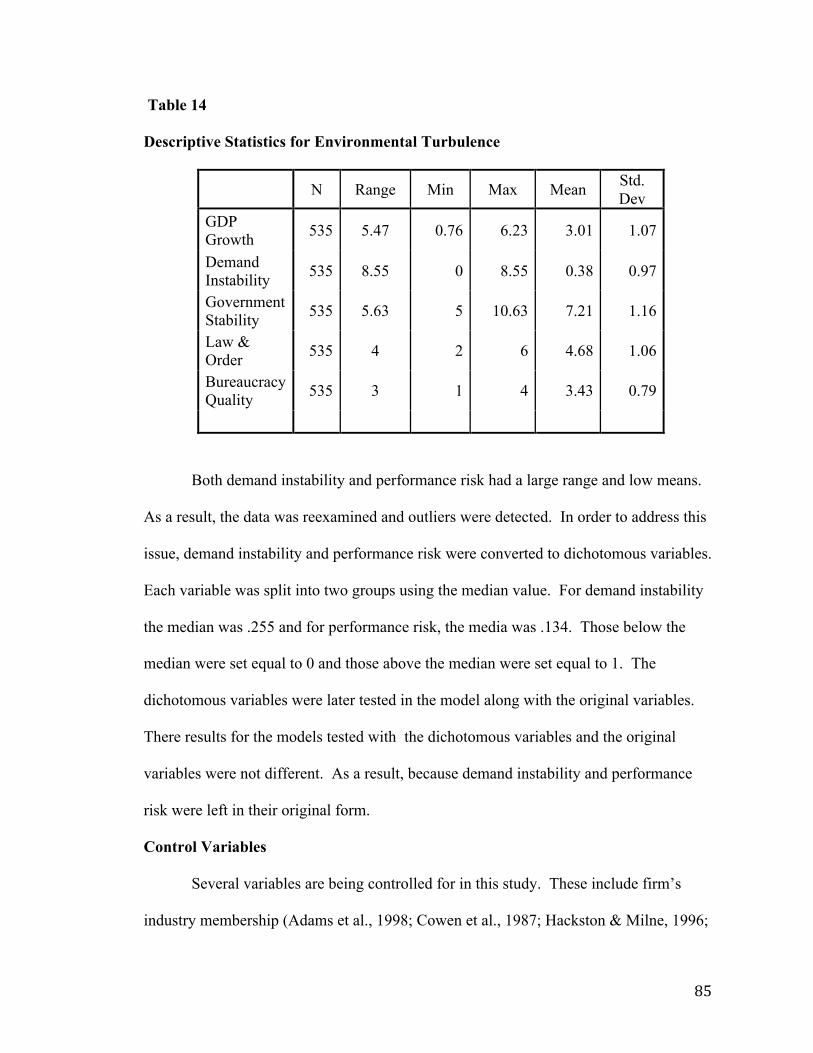
85
Table 14
Descriptive Statistics for Environmental Turbulence
N Range Min Max Mean Std. Dev
GDP Growth 535 5.47 0.76 6.23 3.01 1.07
Demand Instability 535 8.55 0 8.55 0.38 0.97
Government Stability 535 5.63 5 10.63 7.21 1.16
Law & Order 535 4 2 6 4.68 1.06
Bureaucracy Quality 535 3 1 4 3.43 0.79
Both demand instability and performance risk had a large range and low means.
As a result, the data was reexamined and outliers were detected. In order to address this
issue, demand instability and performance risk were converted to dichotomous variables.
Each variable was split into two groups using the median value. For demand instability
the median was .255 and for performance risk, the media was .134. Those below the
median were set equal to 0 and those above the median were set equal to 1. The
dichotomous variables were later tested in the model along with the original variables.
There results for the models tested with the dichotomous variables and the original
variables were not different. As a result, because demand instability and performance
risk were left in their original form.
Control Variables
Several variables are being controlled for in this study. These include firm’s
industry membership (Adams et al., 1998; Cowen et al., 1987; Hackston & Milne, 1996;

86
Holder-Webb et al., 2009; Patten, 1991; Roberts, 1992), the number of countries in which
the company operates (Ge & McVay, 2010) and the number of years a firm has reported
using the GRI. Descriptive statistics for each of these variables can be found in Table 15.
In the data set, 72.4% of firms were considered to be high profile.
Table 15
Descriptive Statistics for Control Variables
N Minimum Maximum Mean
Std. Deviation
Industry Profile 535 0 1 Segments – Geo 535 0 30 5.01 4.364 Years Reported 535 1 13 4.07 2.704
Correlations between variables, which can be found in Table 16, were reviewed
for both dependent and independent variables. Bivariate correlations of .90 and higher
suggest substantial collinearity, however, it may be present with correlations as low as
.70 (Hair et al., 2010). Correlations between the independent variables were well below
the .70 threshold with the exception of the correlation between the Law and Order Index
and the Bureaucracy Quality Index which was .805. Given this one exception and the
low correlations between variables, collinearity was determined not to be an issue.
Tolerance measures were used to further evaluate the relationship between the Law and
Order Index and the Bureaucracy Quality Index and assess for multicollinearity. The
tolerance value was .213 and the corresponding VIF is 4.69. This is above the common
cutoff threshold of 1.0 for tolerance values of .10 and would not need to be addressed
given the sample size in this study (Hair, et al., 2010).

87
Table 16
Correlation Matrix
App Level Assure
Firm Size
Firm Age
CSR Comm
Segments Business
Corp Gov Ratio
Application Level
Pearson Correlation
1 .298 .083 -.014 .080 .288 -.163
Sig 2 tail .002 .400 .888 .419 .003 .099 Assurance Pearson
Correlation .298 1 -.047 .076 .027 .029 .123
Sig 2 tail .002 .639 .440 .787 .774 .215 Firm Size Pearson
Correlation .083 -.047 1 -.013 -.207 .134 -.048
Sig 2 tail .400 .639 .896 .035 .175 .632 Firm Age Pearson
Correlation -.014 .076 -.013 1 .097 -.097 .007
Sig 2 tail .888 .440 .896 .326 .327 .942 CSR Committee
Pearson Correlation
.080 .027 -.207 .097 1 .124 .142
Sig 2 tail .419 .787 .035 .326 .209 .152 Segments - Business
Pearson Correlation
.288 .029 .134 -.097 .124 1 -.059
Sig 2 tail .003 .774 .175 .327 .209 .551 Corp Gov Ratio
Pearson Correlation
-.163 .123 -.048 .007 .142 -.059 1
Sig 2 tail .099 .215 .632 .942 .152 .551 Lagged ROE Pearson
Correlation -.127 -.138 -.072 -.151 .082 .089 .095
Sig 2 tail .198 .162 .466 .126 .406 .367 .338 Beta Pearson
Correlation .161 -.135 -.093 .019 .014 .146 .008
Sig 2 tail .103 .171 .348 .852 .886 .140 .939 Stakeholders Pearson
Correlation .150 .080 .016 .055 .145 .075 .173
Sig 2 tail .129 .417 .870 .581 .141 .449 .079 Corporate Foundation
Pearson Correlation
.094 -.110 .112 .057 -.198 -.036 -.114
Sig 2 tail .344 .267 .256 .567 .044 .717 .251

88
App Level Assure
Firm Size
Firm Age
CSR Comm
Segments Business
Corp Gov Ratio
Media Exposure
Pearson Correlation
.302 .081 .375 -.013 .079 .318 -.030
Sig 2 tail .002 .415 .000 .897 .428 .001 .766 Corporate Reputation
Pearson Correlation
-.208 .039 .281 .084 -.108 -.098 .112
Sig 2 tail .034 .698 .004 .397 .275 .322 .258 GDP Growth
Pearson Correlation
.181 .101 .114 .248 -.231 -.034 -.037
Sig 2 tail .066 .310 .247 .011 .018 .731 .707 Perf Risk Pearson
Correlation .176 .027 -.047 .059 .035 -.020 .110
Sig 2 tail .074 .789 .634 .554 .726 .837 .265 Demand Instability
Pearson Correlation
-.005 -.126 -.001 .068 -.044 .080 -.027
Sig 2 tail .961 .201 .994 .493 .658 .422 .789 Govt Stability Index
Pearson Correlation
-.243 -.248 -.096 -.170 .032 -.052 .003
Sig 2 tail .013 .011 .332 .085 .750 .598 .980 Law & Order Index
Pearson Correlation
-.003 .085 .031 .040 -.002 .061 -.069
Sig 2 tail .978 .392 .751 .687 .982 .538 .487 Bureaucratic Quality Index
Pearson Correlation
-.011 -.010 .146 .095 -.074 .038 -.112
Sig 2 tail .913 .923 .138 .338 .454 .703 .258 Industry Profile
Pearson Correlation
.036 -.002 .001 -.026 .060 -.024 .120
Sig 2 tail .716 .985 .995 .791 .544 .807 .226 Segments - Geo
Pearson Correlation
.216 .087 -.061 .133 -.071 .260 -.075
Sig 2 tail .028 .379 .536 .178 .477 .008 .450 Years Reported
Pearson Correlation
.513 .255 .197 -.043 .064 .362 .068
Sig 2 tail .000 .009 .045 .663 .521 .000 .495

89
Lagged ROE Beta
Stake-holders
Corporate Found
Media Exposure
Corporate Rep
GDP Growth
Application Level
Pearson Correlation
-.127 .161 .150 .094 .302 -.208 .181
Sig 2 tail .198 .103 .129 .344 .002 .034 .066 Assurance Pearson
Correlation -.138 -.135 .080 -.110 .081 .039 .101
Sig 2 tail .162 .171 .417 .267 .415 .698 .310 Firm Size Pearson
Correlation -.072 -.093 .016 .112 .375 .281 .114
Sig 2 tail .466 .348 .870 .256 .000 .004 .247 Firm Age Pearson
Correlation -.151 .019 .055 .057 -.013 .084 .248
Sig 2 tail .126 .852 .581 .567 .897 .397 .011 CSR Committee
Pearson Correlation
.082 .014 .145 -.198 .079 -.108 -.231
Sig 2 tail .406 .886 .141 .044 .428 .275 .018 Segments - Business
Pearson Correlation
.089 .146 .075 -.036 .318 -.098 -.034
Sig 2 tail .367 .140 .449 .717 .001 .322 .731 Corp Gov Ratio
Pearson Correlation
.095 .008 .173 -.114 -.030 .112 -.037
Sig 2 tail .338 .939 .079 .251 .766 .258 .707 Lagged ROE
Pearson Correlation
1 -.146 -.042 -.115 .022 .096 -.139
Sig 2 tail .140 .674 .245 .823 .334 .160 Beta Pearson
Correlation -.146 1 .031 .112 .012 .070 .144
Sig 2 tail .140 .753 .256 .906 .483 .146 Stakeholders Pearson
Correlation -.042 .031 1 .007 .140 .005 -.027
Sig 2 tail .674 .753 .940 .158 .962 .785 Corporate Foundation
Pearson Correlation
-.115 .112 .007 1 .084 -.057 .021
Sig 2 tail .245 .256 .940 .397 .563 .834

90
Lagged ROE Beta
Stake-holders
Corporate Found
Media Exposure
Corporate Rep
GDP Growth
Media Exposure
Pearson Correlation
.022 .012 .140 .084 1 .090 -.118
Sig 2 tail .823 .906 .158 .397 .362 .233 Corporate Reputation
Pearson Correlation
.096 .070 .005 -.057 .090 1 -.010
Sig 2 tail .334 .483 .962 .563 .362 .921 GDP Growth
Pearson Correlation
-.139 .144 -.027 .021 -.118 -.010 1
Sig 2 tail .160 .146 .785 .834 .233 .921 Perf Risk Pearson
Correlation -.039 .250 .169 .047 .082 .094 .259
Sig 2 tail .698 .010 .086 .633 .405 .343 .008 Demand Instability
Pearson Correlation
-.061 .097 .058 -.080 .020 .056 .301
Sig 2 tail .536 .328 .560 .421 .840 .572 .002 Govt Stability Index
Pearson Correlation
.166 -.014 -.234 .066 -.138 .059 -.435
Sig 2 tail .093 .884 .017 .507 .161 .552 .000 Law & Order Index
Pearson Correlation
.076 -.118 -.197 .015 .052 -.114 -.088
Sig 2 tail .441 .233 .045 .884 .599 .251 .376 Bureaucratic Quality Index
Pearson Correlation
.093 -.054 -.256 .065 .120 -.110 .054
Sig 2 tail .346 .587 .009 .514 .224 .267 .583 Industry Profile
Pearson Correlation
-.107 -.355 .128 -.108 -.002 -.116 -.060
Sig 2 tail .282 .000 .195 .276 .984 .242 .547 Segments - Geo
Pearson Correlation
-.024 .176 .076 -.021 .203 .008 .108
Sig 2 tail .807 .074 .442 .829 .039 .938 .274 Years Reported
Pearson Correlation
-.002 .105 .257 .022 .306 -.010 .086
Sig 2 tail .987 .287 .009 .821 .002 .920 .387

91
Perf Risk
Dem Inst
Govt Stab
Law & Order
Bur Quality
Ind Profile
Seg Geo
Years Report
Application Level
Pearson Correlation
.176 -.005 -.243 -.003 -.011 .036 .216 .513
Sig 2 tail .074 .961 .013 .978 .913 .716 .028 .000 Assurance Pearson
Correlation .027 -.126 -.248 .085 -.010 -.002 .087 .255
Sig 2 tail .789 .201 .011 .392 .923 .985 .379 .009 Firm Size Pearson
Correlation -.047 -.001 -.096 .031 .146 .001 -.061 .197
Sig 2 tail .634 .994 .332 .751 .138 .995 .536 .045 Firm Age Pearson
Correlation .059 .068 -.170 .040 .095 -.026 .133 -.043
Sig 2 tail .554 .493 .085 .687 .338 .791 .178 .663 CSR Committee Pearson
Correlation .035 -.044 .032 -.002 -.074 .060 -.071 .064
Sig 2 tail .726 .658 .750 .982 .454 .544 .477 .521 Segments - Business
Pearson Correlation
-.020 .080 -.052 .061 .038 -.024 .260 .362
Sig 2 tail .837 .422 .598 .538 .703 .807 .008 .000 Corp Gov Ratio Pearson
Correlation .110 -.027 .003 -.069 -.112 .120 -.075 .068
Sig 2 tail .265 .789 .980 .487 .258 .226 .450 .495 Lagged ROE Pearson
Correlation -.039 -.061 .166 .076 .093 -.107 -.024 -.002
Sig 2 tail .698 .536 .093 .441 .346 .282 .807 .987 Beta Pearson
Correlation .250 .097 -.014 -.118 -.054 -.355 .176 .105
Sig 2 tail .010 .328 .884 .233 .587 .000 .074 .287 Stakeholders Pearson
Correlation .169 .058 -.234 -.197 -.256 .128 .076 .257
Sig 2 tail .086 .560 .017 .045 .009 .195 .442 .009 Corporate Foundation
Pearson Correlation
.047 -.080 .066 .015 .065 -.108 -.021 .022
Sig 2 tail .633 .421 .507 .884 .514 .276 .829 .821

92
Perf Risk
Dem Inst
Govt Stab
Law & Order
Bur Quality
Ind Profile
Seg Geo
Years Report
Media Exposure
Pearson Correlation
.082 .020 -.138 .052 .120 -.002 .203 .306
Sig 2 tail .405 .840 .161 .599 .224 .984 .039 .002 Corporate Reputation
Pearson Correlation
.094 .056 .059 -.114 -.110 -.116 .008 -.010
Sig 2 tail .343 .572 .552 .251 .267 .242 .938 .920 GDP Growth
Pearson Correlation
.259 .301 -.435 -.088 .054 -.060 .108 .086
Sig 2 tail .008 .002 .000 .376 .583 .547 .274 .387 Perf Risk Pearson
Correlation 1 .261 -.196 .022 -.075 .013 .131 .078
Sig 2 tail .008 .046 .826 .449 .895 .186 .429 Demand Instability
Pearson Correlation
.261 1 -.099 .129 .030 .015 .237 .070
Sig 2 tail .008 .318 .191 .760 .882 .015 .482 Govt Stability Index
Pearson Correlation
-.196 -.099 1 -.045 .109 -.010 .001 -.230
Sig 2 tail .046 .318 .647 .269 .916 .993 .019 Law & Order Index
Pearson Correlation
.022 .129 -.045 1 .805 .150 -.029 .051
Sig 2 tail .826 .191 .647 .000 .127 .772 .607 Bur Quality Index
Pearson Correlation
-.075 .030 .109 .805 1 .026 -.029 -.032
Sig 2 tail .449 .760 .269 .000 .796 .769 .746 Industry Profile
Pearson Correlation
.013 .015 -.010 .150 .026 1 -.084 .132
Sig 2 tail .895 .882 .916 .127 .796 .396 .180 Segments - Geo
Pearson Correlation
.131 .237 .001 -.029 -.029 -.084 1 .251
Sig 2 tail .186 .015 .993 .772 .769 .396 .010 Years Reported
Pearson Correlation
.078 .070 -.230 .051 -.032 .132 .251 1
Sig 2 tail .429 .482 .019 .607 .746 .180 .010

93
Analytical Approach
The data that has been compiled for this research is complete with one exception.
Corporate reputation scores are only available for 103 of the 535 companies included in
this research. This was identified early in the research as a possible issue because in
studies used to evaluate reputation, a limited numbers of companies are typically
assessed. Some scholars have used the Reputation Institute’s RepTrak as a measure of
corporate reputation in order to overcome to try and overcome this issue (Fombrun &
Pan, 2006; Othman et al., 2011; Vidaver-Cohen 2007). However, for this study, even the
number of companies with publicly available RepTrak scores was limited.
Within the sample, corporate reputation was the only variable with incomplete
data. Given the circumstances and the amount of missing data, the variable was omitted
from the initial analysis. A second analysis was conducted of companies with a corporate
reputation score in order to detect any marked differences (Hair, et al, 2010). The results
of that analysis will be reported later in this chapter.
Logistic Regression Analysis
As in past CSR disclosure research, logistic regression is used to analyze the
relationship between categorical dependent variables and metric and non-metric
independent variables (e.g. Dhaliwal, Li, Tsang & Yang, 2011; Kolk & Perego, 2010;
Kolk & Pinkse, 2010; Perez-Batres, Miller & Pisani, 2010; Roberts, 1992). This type of
analysis requires a minimum of 10 observations per independent variable. It is also
recommended that the total sample be greater than 400 (Hair et al., 2010; Hosmer &
Lemeshow, 2000).
As a result of having two dependent variables, GRI application level and third

94
party assurance, two different logistic models were analyzed. In the first model, the GRI
application level was the dependent variable and third party assurance was the dependent
variable for the second model. The analysis included an overall evaluation, goodness-of-
fit-statistics and tests of individual predictors.
The overall evaluation of the GRI application level model based on the likelihood
ratio test indicated that the final model is a better fit than the intercept-only or null model
(X2=168.794, p = . 000). An evaluation was also done for the third party assurance
model and the likelihood ratio test of the model produced similar results. It also
demonstrated that the full model is a better fit than the intercept or null model
(X2=130.458, p= .000).
Goodness-of-Fit-Statistics.
In assessing the goodness of fit for each model, the Cox and Swain, Nagelkerke
and McFadden tests were used to assess the proportion of explained variance (Hair, et al,
2010). The scores for each test can be found in Table 17. The primary value of this
information is to compare competing models (Hosmer and Lemeshow, 2000).
Table 17
Goodness of Fit Scores
Application Level Model Tool Score
Cox and Nell 0.271 Nagelkerke 0.309 McFadden 0.151 Assurance Model Tool Score Cox and Nell 0.216 Nagelkerke 0.289 McFadden 0.176

95
Tests of Hypotheses. As shown in Table 18, four of the 19 predictor variables were
found to be statistically significant in the application level model. The strongest predictor
in the model, years reported (B= .368, p=. 000), was one of the control variables,. The
other three variables which were found to be significant include (9a) the presence of a
corporate foundation (B= -0.371, p= .046), (15a) government stability (B= -0.196, p=
.015) and (17a) bureaucratic quality (B= -0.615, p= .003). Despite these results, none of
the hypotheses which predicted the firm’s level of CSR disclosure were supported.
While these relationships were predicted as positive, the direction of the relationship was
incorrectly hypothesized and they were instead found to be negative.
For third party assurance, six of the 19 predictor variables were statistically
significant. As shown in Table 19, years reported was the strongest predictor (B= 0.218,
p= .000) just as it had been in the application level model. The second significant
variable was bureaucratic quality, which was negatively related to third party assurance
(B= -1.001, p=. 000). The third significant variable was the government stability, which
was negatively related to the firm deciding to pursue third party assurance (B= -0.286,
p=. 002). The fourth predictor, the Law and Order Index, was positively related to third
party assurance (B= 0.469, p=. 007). The fifth significant variable was the corporate
governance ratio and it is positively related to third party assurance (B= 1.724 p= .009).
The final significant variable was systemic risk-beta and it is positively related to third
party assurance (B= -0.500, p=. 017).

96
Table 18
Application Level Model Parameter Estimates
Estimate Std. Error Wald df Sig. Threshold App Level = 1 -3.678 0.928 15.704 1 0.000 App Level = 2 -1.25 0.913 1.876 1 0.171 Location Firm Size -7.16E-07 1.49E-06 0.231 1 0.631 Firm Age -0.001 0.002 0.503 1 0.478 Corp Governance -0.322 0.581 0.308 1 0.579 Lagged ROE -0.071 0.141 0.254 1 0.614 Beta -0.088 0.177 0.249 1 0.618 GDP -0.098 0.085 1.321 1 0.250 Performance Risk 0.135 0.228 0.351 1 0.554 Demand Instability 0.027 0.098 0.078 1 0.780 Government Stability -0.196 0.081 5.887 1 0.015 Law and Order 0.171 0.15 1.309 1 0.253 Bureaucracy Quality -0.615 0.208 8.742 1 0.003 Segments- Geo 0.007 0.022 0.096 1 0.757 Years Reported 0.368 0.042 77.875 1 0.000 Media 0.004 0.003 1.731 1 0.188 Stakeholders 0.035 0.039 0.816 1 0.366 Segments - Business -0.012 0.033 0.144 1 0.705 CSR Committee -0.196 0.189 1.077 1 0.299 Foundation -0.371 0.186 3.998 1 0.046 Industry -0.178 0.2 0.792 1 0.373
The only hypotheses that were supported in the study were for predictors of the
firm’s choice of third party assurance. These include (5b) governance structure, (7b)
systemic risk and (16b) the Law and Order Index. A positive relationship had also been
hypothesized between government stability and the firm’s choice of third party assurance.
However, it was predicted as positive, but was found instead to be negative.
One of the control variables was also found to be a significant predictor. The
number of years a company has reported was found to be a strong predictor of both GRI

97
application level (B= .368, p= .000) and third party assurance (B= .218, p= .000). This
finding was expected based on comments from the executives interviewed earlier in this
research.
Table 19
Assurance Model Parameter Estimates
Estimate Std. Error Wald df Sig. Threshold Assurance = 0 -2.226 1.034 4.637 1 0.031 Location Firm Size 1.30E-06 1.64E-06 0.622 1 0.430 Firm Age 0.002 0.002 1.032 1 0.310 Corp Governance 1.724 0.661 6.791 1 0.009 Lagged ROE 0.061 0.156 0.153 1 0.696 Beta -0.5 0.209 5.704 1 0.017 GDP -0.113 0.099 1.298 1 0.255 Performance Risk 0.221 0.248 0.791 1 0.374 Demand Instability 0.012 0.112 0.011 1 0.918 Government Stability -0.286 0.092 9.744 1 0.002 Law and Order 0.469 0.175 7.211 1 0.007 Bureaucracy Quality -1.001 0.241 17.231 1 0.000 Segment - Geo 0.049 0.025 3.822 1 0.051 Years Reported 0.218 0.042 26.858 1 0.000 Media 0.001 0.003 0.051 1 0.821 Stakeholder 0.038 0.044 0.73 1 0.393 Segments - Business 0.015 0.037 0.164 1 0.685 CSR Committee -0.192 0.215 0.8 1 0.371 Foundation 0.115 0.209 0.305 1 0.581 Industry -0.326 0.23 2.014 1 0.156
Corporate reputation. As noted earlier, corporate reputation and the associated
set of hypotheses were omitted from the initial analysis. A separate analysis was carried
out of the 103 companies included that have corporate reputation scores available. In
comparing the descriptive statistics of firms with corporate reputation scores with those
of the broader sample, there are some noticeable differences. Firms with reputation scores

98
seem to be larger and older. As shown in Table 20, firms with corporate reputation scores
had a mean of 95,520 employees and had been in business on average nearly 102 years.
Firms without corporate reputation scores had a mean of 29,042 employees and had been
in business on average 74.12 years. Firms with corporate reputation scores on average
also had a higher lagged ROE (.2097 vs. .175). In terms of environmental turbulence,
firms with corporate reputation scores have lower performance risk (.272 vs. .408), lower
demand instability (.238 vs. .412) and slightly higher government stability (7.32 vs.
7.18), law and order (4.90 vs. 4.62) and bureaucratic quality indicators (3.80 vs. 3.34).
Table 20
Descriptive Statistics
N Range Min Max Mean Std. Dev
Firm Size 103 552373 52 552425 95520.0194 1.06E+05 Firm Age 103 340 3 343 101.572 58.244 CSR Committee 103 1 0 1 Segments - Bus 103 21 1 22 4.805 3.084 Corp Gov Ratio 103 0.68 0 0.68 0.181 0.1423 Lagged ROE 103 2.74 -0.31 2.43 0.209 0.269 Beta 103 2.8 -0.27 2.53 0.847 0.525 Stakeholders 103 10 3 13 7.912 2.165 Corp Foundation 103 1 0 1 Media 103 442 0 442 51.417 77.554 Corp Reputation 103 38.21 42.79 81 67.915 7.159 GDP Growth 103 4.3 1.11 5.4 2.869 0.631 Performance Risk 103 1.38 0 1.38 0.271 0.236 Demand Instability 103 5.65 0 5.65 0.238 0.584 Govt Stability 103 3.37 5.13 8.5 7.319 0.882 L&O Index 103 4 2 6 4.909 0.806 Bureaucracy Quality 103 2 2 4 3.801 0.535 Industry Profile 103 1 0 1 Segments-Geo 103 25 0 25 5.6311 4.010 Years Reported 103 12 1 13 5.3786 2.918

99
For this model with the dependent variable of level, the likelihood ratio test of the
final model indicated that the model is a better fit than the intercept-only or null model
(X2= 64.108, p = .000). For assurance in this model, the likelihood ratio test of the final
model also indicated that the model was a better fit than the intercept or null model (X2=
33.407, p= .030). This is shown in Table 21.
Table 21
Goodness of Fit Scores
Application Model With Corporate Reputation Included Tools Scores
Cox and Nell 0.463 Nagelkerke 0.544 McFadden 0.328 Assurance Model With Corporate Reputation Included Tools Scores
Cox and Nell 0.277 Nagelkerke 0.371 McFadden 0.236
When corporate reputation was added to the application level model, three of the
twenty predictor variables were found to be statistically significant. Years reported
remained the strongest predictor in the model (B=.424, p= .000). The corporate
governance ratio (B=-4.386, p= .009) and corporate reputation (B=-.087, p= .034) were
also found to be statistically significant. However, both were negatively related to the
firm’s application level and they had been predicted to be positively related. Just as in
the previously tested model, none of the hypotheses which predicted the firm’s level of
CSR disclosure were supported.
100
Interestingly enough, when corporate reputation was added to the model,
bureaucratic quality and government stability ceased to be significant. This is curious
because these items are not highly correlated with corporate reputation. An additional
analysis was undertaken to investigate the possibility that these may be predictors of
corporate reputation and that corporate reputation serves as a mediator between these
indices and the GRI application level. A separate multiple regression was run which
resulted in an extremely low R2 and showed no statistically significant relationships.
When corporate reputation was added to the third party assurance model, only
two of the twenty predictor variables were statistically significant. Unlike in the
application level model, Beta (B=-1.378, p= .016) was the strongest predictor. Years
reported was the only other variable that proved to be significant (B=.245, p= .020). In
this model, corporate reputation (B=.034. p= .221)was not significant.
Summary
This chapter has presented the results of five qualitative interviews that provide
insights into the suitability of the proposed constructs and into each firm’s approach to
reporting. While the companies represented in the interviews chose a range of
application levels, only one firm chose to pursue third party assurance. The executives
described the focus of their firm’s CSR reports but did not suggest anything that would
raise concern about the suitability of the proposed constructs.
A quantitative analysis was undertaken to understand the determinants of a firm’s
CSR disclosure strategy. The evidence resulting from the present study indicates that
only four of the 19 predictor variables were found to be statistically significant of the
firm’s choice of GRI application level. The strongest predictor in the model was years

101
reported (p= .000) followed by bureaucratic quality (p= .003), government stability (p=
.015) and the presence of a corporate foundation (p= .046). For third party assurance, five
of the 19 predictor variables were statistically significant. Years reported was the
strongest predictor followed by bureaucratic quality (p= .000), government stability (p=
.002), the Law and Order Index (p= .007), the corporate governance ratio (p= .009) and
Beta (p= .024).
The evidence from this study indicated that none of the hypotheses that predicted
the firm’s level of CSR disclosure was supported. There were relationships observed,
however, between the presence of a corporate foundation (Hypothesis 9a), government
stability (Hypothesis 15a) and bureaucracy quality (Hypothesis 17a) and the firm’s
choice of application level. While these relationships were predicted as positive, they
were instead found to be negative.
The only hypotheses in the study that were supported were predictors of the
firm’s choice of third party assurance. Governance structure (Hypothesis 5b), systemic
risk (Hypothesis 7b), and the Law and Order Index (Hypothesis16b) were all supported.
There was also a relationship between government stability and the firm’s choice of third
party assurance. However, it was predicted as positive but was found instead to be
negative.
In the next chapter, these findings are discussed in significant detail. Each of the
constructs is examined through a theoretical lens and the results are explained. The
study’s limitations are also elucidated and future areas of research are proposed. Finally,
the implications of the study for both practitioners and scholars are discussed.

102
CHAPTER 5
Discussion
With the evolution of CSR reporting practices and the introduction and
widespread adoption of the GRI Guidelines, this research sought to understand the factors
that determine a company’s CSR disclosure strategy. This research examined the
relationship between a four-dimensional model of reporting determinants and a firm’s
CSR disclosure strategy and found only one strongly predictive construct. However, the
combination of predictive variables that were shown to be related help strengthen
understanding of disclosure strategy. The findings of this research also suggest that
theoretical models proposed by Ullmann (1985) and Adams (2002) are no longer
sufficient to explain the determinants of a firm’s CSR disclosure strategy.
In an effort to explain a firm’s CSR disclosure strategy, researchers have used a
broad theoretical framework. This has happened because no single theory is able to
effectively explain CSR reporting (Adams & Whelan, 2009; Cormier et al., 2005; Deegan
& Blomquist, 2006; Gray et al., 1995). Past research has focused on stakeholder,
institutional and legitimacy theories and has suggested they have complementary effects.
These theories have helped guide this research and the findings from this study help
further reinforce the role that each theory plays in explaining the determinants of CSR
disclosure. The results also provide added insight into each of the theories despite the
fact that the hypotheses that have been proposed here have gone largely unsupported.

103
The discussion that follows will explain how these outcomes further our understanding of
theory and of the factors that determine the firm’s CSR disclosure strategy.
Non-Financial Corporate Characteristics
Institutional theory suggests that firms operate in environments shaped by shared
rules, values and beliefs (Hoffman, 1999; Jackson & Apostolakou, 2010; Nikolaeva &
Bicho, 2011). The resulting norms influence the strategic adoption and use of CSR
reporting frameworks (Chen & Bouvain, 2009; Hoffman, 1999; Nikolaeva & Bicho,
2011). These norms often lead companies to exhibit mimetic behaviors and justify their
decisions based on actions other companies have taken (Milne & Patten, 2002; Nikolaeva
& Bicho, 2011).
In the past, both firm size and firm age were found to be positively related to the
quantity and quality of CSR disclosures (Adams et al., 1998; Bayoud, Kavanagh &
Slaughter, 2012; Cowen et al., 1987; Dhaliwal et al., 2012; Hackston & Milne, 1996;
Patten, 1991; Roberts, 1992). This would suggest that firms mimicked those with similar
characteristics. The lack of support shown for firm size and firm age in this study, and
the strong support shown for years reported, suggests that firms have changed the criteria
that guide their mimetic behavior. In determining who to benchmark against, firms are
likely to mimic other companies based on their reporting experience.
Results from both the executive interviews and the quantitative study also support
the role of reporting experience when determining how much to report. These findings
suggest that as firms gain experience, their choices of application level and third party
assurance become institutionalized within the firm. The executive interviews performed
in this study involved a group of companies with considerable experience in CSR

104
reporting who consistently applied their disclosure strategy. The most experienced of
these companies issued their first CSR report in 1999 and most of the others started
reporting sometime between 2001 and 2004. Their choice of application level and third
party assurance has remained consistent over the last two years. One executive that was
interviewed said his firm had no plans to change its reporting because it had become so
adept at carrying out the strategy.
The quantitative study produced similar results. On average, companies in the
data set had used the GRI framework for 4 years and over 80% of the firms reported at a
B level or higher. Slightly more than half the firms employed third party assurance. The
reporting experience and level of reporting seem to suggest that for many firms
institutional norms that guide CSR reporting are likely already in place.
This study also examined the role of the company’s Board of Directors. Previous
studies showed that the quantity and quality of CSR reporting was influenced by the
presence of a board level CSR committee and the firm’s governance structure. They also
suggested that CSR practices are more likely to be adopted when they are recognized as
institutionalized norms (Jackson & Apostolakou, 2010). For many companies, a board
level committee was needed to help the company establish institutionalized norms and
make CSR disclosure a common practice.
The role of the Board of Directors, as institutional and stakeholder theories would
support, was to help establish institutional norms for reporting and to represent the
perspective of key stakeholders. Give the theory and results from past research, it was
hypothesized that the presence of a board level CSR committee would be positively
related to the firm’s choice of application level and third party assurance. A similar

105
hypothesis was proposed for the firm’s governance structure. The lack of support shown
for both hypotheses suggest a changing role for the firm’s Board of Directors.
As a result of the firm’s reporting experience and the Board’s influence,
institutional norms that govern the firm’s reporting are now in place. These factors seem
to have changed the role of the Board of Directors in determining CSR disclosure
strategy. During the executive interviews, the Board’s role was described as merely
advisory. The evidence would suggest that more focus is being placed on senior leaders.
These results would suggest that as firms gain experience in reporting and norms are
established, the role of the Board is less central to the firm’s disclosure strategy. It seems
that as the focus shifts to implementation, senior leaders take on an increasing role and
serve to reinforce the norms that have already been established.
Business complexity was the last of the non-financial characteristics to be
examined. Consistent with past studies, business complexity was measured by both the
number of operating segments and geographic segments within a firm (Boesso & Kumar,
2007; Dilling, 2010; Ge & McVay, 2010). It was believed that these measures reflect the
increased risk of interacting with multiple stakeholders and the need to interact with
multiple countries to fulfill the firm’s social contract. The number of operating segments
was not related to either the firm’s choice of application level or third party assurance.
The results that have been reported thus far suggest that while firms with a large number
of operating segments may face increased risk from interacting with multiple
stakeholders, their level of reporting has been maintained over time. The executive
interviews also suggest that because firms are comfortable with the reporting process,
they are less likely to be impacted by the number of operating segments.

106
The number of geographic segments did appear to be related to both the firm’s
choice of application level and third party assurance. However, it lacked statistical
significance. The interviews also suggested that the number of geographic segments
influence the firm’s disclosure strategy. As the numbers of geographic segments grow,
so does the amount of overall information that must be collected to satisfy stakeholders
and fulfill the firm’s social contract. In one of the interviewed firms, responses to more
than 4000 questions had to be collected from multiple geographic units. This clearly
showed that a large increase in the amount of information collected could adversely
affect the firm’s choice of reporting level due to staffing requirements.
Financial Performance
The inclusion of firm financial performance as a construct was predicated on the
belief that economic performance would impact the firm’s ability to invest in CSR and its
associated disclosure. For this study, both lagged return on equity and systemic risk,
were evaluated and neither were related to the firm’s choice of application level. These
results are best explained by the firm’s reporting experience and the observation that for
many firms, reporting practices have become institutionalized within the firm. Reporting
experience has allowed firms to adjust to adverse financial performance and systemic
risk. As a result, firms have remained consistent in their reporting. A few of the firms in
the executive interviews mentioned resource availability as a potential issue. The impact
of this, however, was described only as an issue for firms contemplating future changes
to their reporting levels.
Systemic risk, the other measure of financial performance, was not found to be
related to the firm’s choice of application level. When considering past results and the

107
results from this study, it would seem that as firms gain reporting experience, they
become accustomed to systemic risk. As reporting practices have become more
institutionalized within the firm, systemic risk no longer seems to influence a company’s
disclosure strategy.
In contrast, systemic risk was found to be related to the firm’s decision to pursue
third party assurance. Legitimacy theory suggests that as a firm encounters risks, it must
be ready to engage in a legitimization process (Ashforth & Gibbs, 1990; Islam & Deegan,
2010). The results from this study demonstrated that as systemic risk increases, firms
pursue third party assurance to address the volatility and maintain legitimacy. One
company that was included in the executive interviews employed third party assurance
because it wanted to be perceived as transparent. This may be especially important to
institutional investors who already pay close attention to financial measures. This would
suggest that in addressing systemic risk, it is more important for the firm to have
someone affirm what has been reported rather than to report at the highest level possible.
The executive interviews provided additional insights into the lack of adoption of
third party assurance. Costs were often cited as the reason four of the five firms chose
not to employ third party assurance. Because the cost of third party assurance would
equal that of creating the report, the costs were viewed as excessive. The process was
also considered redundant because much of the data in the report had already been
assured for inclusion in other reports.
Stakeholder Involvement
The results observed with the stakeholder involvement construct could best be
explained by stakeholder theory. As the global marketplace grows more complex, firms

108
find themselves interacting with a broad range stakeholders (Clarkson, 1995; Freeman,
1984; Hult, Mena, Ferrell & Ferrell 2011). Stakeholder theory suggests that in the course
of operating, firms interact with multiple stakeholders (Clarkson, 1995; Freeman, 1984;
Fiss & Zajac, 2006; Hult et al., 2011) and that the expectations of stakeholders are the
primary motivation for CSR reporting (Donaldson & Preston, 1995; Mitchell et al.,
1997). This creates more risk and because there is often incongruity among stakeholders,
the firm focuses on those who are believed to have the greatest priority (Freeman, 1984;
Fiss & Zajac, 2006; Frooman, 1999; Hult et al., 2011; Jones, 1995; Mitchell, Agle &
Wood, 1997).
The number of stakeholders was examined as a predictor of the firm’s disclosure
strategy because it was thought that this measure reflects the increased risk a firm faces
as stakeholder interactions increase. In the executive interviews, the role of the
stakeholder was a central focus. Each of the executives described a group of stakeholders
with whom the firm interacts and suggested that alignment with these stakeholders is
crucial. Executives focused specifically on alignment with government, shareholders,
non-governmental organizations and customers/consumers. Despite the qualitative
findings, the number of stakeholders was not supported as a predictor of the firm’s GRI
application level or its choice of third party assurance.
These findings would seem to suggest that the added risk of interacting with a
number of stakeholders is likely less important in determining the firm’s disclosure
strategy than the type of stakeholder with whom the firm interacts. This would also be
consistent with the concept of stakeholder salience, which suggests that firms prioritize
stakeholders because they lack the resources to treat them all equally. Prioritization is

109
based on the stakeholder’s power to influence the firm, the legitimacy of the their
relationship with the firm and the urgency of their claim (Freeman, 1984; Fiss & Zajac,
2006; Frooman, 1999; Hult et al., 2011; Jones, 1995; Mitchell, Agle & Wood, 1997).
The results seen with political turbulence, which will be discussed later, also reinforce the
role of stakeholder salience. Those results clearly show that government is accorded a
high priority and thus affects the firm’s CSR disclosure strategy.
The relationship between corporate sponsorship of a philanthropic foundation and
the firm’s level of social disclosure was also examined. Previous research showed this
variable to be positive and highly significant (Roberts, 1992). However, this study, found
a negative relationship between corporate sponsorship of a philanthropic foundation and
the GRI application level a firm chooses to declare. One possible explanation for the
negative relationship with GRI application levels is that the firm has been able to
establish legitimacy through the recognition it receives as the sponsor of a corporate
foundation. As a result, a lower application level may be deemed sufficient.
The lack of relationship between corporate foundation sponsorship and third party
assurance would also be explained by legitimacy theory. The theory would suggest that
the firm’s sponsorship of the foundation might have been the result of a separate attempt
to secure legitimacy. The absence of a relationship may indicate that because legitimacy
has been established, the firm does not choose to engage in an additional legitimization
process.
Media exposure has been previously examined as a measure of society’s interest
in a company’s CSR activities. However, it was not supported as a predictor for either the
firm’s application level or its choice of third party assurance (Aerts, Cormier & Magnan,

110
2006; Brammer & Pavelin, 2006; Cormier & Magnan, 2003; Cormier, Magnan & Van
Velthoven, 2005; Kennedy, 2008; Neu et al., 1998, Zyglidopoulos et al., 2012). There
was also no mention of media by any of the executives that were interviewed. These
results are best interpreted using legitimacy theory which suggests that firms want to be
seen as legitimate by society and as a result go through a legitimization process (Ashforth
& Gibbs, 1990; Islam & Deegan, 2010). The findings here suggest that legitimacy may
have already been achieved and is not under threat. As a result, media exposure is not
required to substantiate the GRI application level chosen by the firm. The results would
also suggest that a firm’s state of legitimacy has negated the need to pursue third party
assurance.
Another potential explanation for these results is that the volume of media
exposures does not reflect stakeholder salience. CSR reporting has been viewed as a
means by which to share CSR activities and results with stakeholders. This measure does
not reflect the prioritization of a specific stakeholder or a set of stakeholders. The
findings here suggest that broad media exposures have no influence either on the level of
reporting or the need for third party assurance.
The final measure of stakeholder involvement, corporate reputation, was
described in executive interviews as an important factor in influencing the firm’s choice
of disclosure strategy. The results of the secondary analysis, which included corporate
reputation, suggested that it was negatively related to the GRI application level. While
the sample from this study was too small, the relationship here could best be explained by
legitimacy theory. Low corporate reputation rankings may signal to the firm that
legitimization is required. As a result, firms with lower reputation scores report at higher

111
levels to signal legitimacy. Conversely, for firms with higher reputation scores, a high
application level is not needed to signal legitimacy.
While a relationship was observed between corporate reputation and the firm’s
reporting level, it was not related to the firm’s choice of third party assurance. As noted
earlier, companies often mimic the behaviors of firms they hold up as role models and are
more likely to justify their decisions based on the actions those companies have taken
(Milne & Patten, 2002; Nikolaeva & Bicho, 2011). The findings here would seem to
suggest that the firm’s choice to pursue third party assurance may be driven more by
firms they emulate than by their own corporate reputation.
Environmental Turbulence
Interviews with executives seemed to shed little light on economic turbulence.
While the availability of resources within the firm was mentioned, there were no
references made to either the general economy or to factors affecting the industry of
which they are a part. Economic turbulence, like firm financial performance, was
thought to impact the firm’s ability to invest in CSR and its associated disclosure. In this
study, none of the measures of economic turbulence - GDP growth, performance risk and
demand instability - were related to either the firm’s choice of GRI application level or
the firm’s choice of third party assurance.
The CSR reports, which were the focus of this study, were compiled in 2011
during the global recession. The reporting experience of the firms, which was discussed
relative to financial performance, has seemingly led to the establishment of
institutionalized reporting norms. Evidence of these norms is found in both the executive
interviews and data from the quantitative study. These norms lead firms to maintain their

112
level of reporting despite adverse economic conditions. The lack of relationship between
GDP and the firm’s application level and its choice of third party assurance also suggests
that CSR strategies are stable. This means that CSR reporting can be a valuable tool for
companies to express concern for society and demonstrate legitimacy regardless of
economic conditions (Othman, Darus & Arshad, 2011).
The results of this study also found that industry focused measures of economic
turbulence were not related to either firm’s choice of application level or its choice of
third party assurance. The results for both performance risk and demand instability
suggest that firms are not affected by industry volatility. Past research also has shown
that certain industries have more intense competition, receive more scrutiny from
regulators and/or be more visible by stakeholders. Being part of these higher profile
industries has been shown by earlier researchers to impact the firm’s disclosure strategy.
These results show, however, that firms are not affected by industry membership. Taken
together, these results once again suggest companies’ CSR disclosure strategies are
driven by institutional norms. As was shown before, these results also seem to suggest
that firms compare themselves to firms outside of their industry when assessing their
CSR disclosure.
Unlike economic turbulence, measures of political turbulence were found to be
strong predictors of both the firm’s application level and its choice of third party
assurance. This can be attributed to the firm’s desire to be seen as legitimate. The need
for legitimacy increases during political turbulence and the results from this study support
that notion. Localized external pressure and disruptive events like political turbulence
are believed to be threats to the firm’s legitimacy (Hoffman, 1999). These factors can

113
create institutional pressure to adapt policies and practices. As a result, norms and
expectations may change over time and create incongruity between a firm’s values and
those of society.
In order to maintain legitimacy, the firm must monitor the environment and be
ready to engage in a legitimization process (Ashforth & Gibbs, 1990; Islam & Deegan,
2010). Past research has shown national institutions to be a strong predictor of firm level
CSR practices. Empirical evidence has also suggested that the institutional environment
plays a pivotal role in influencing companies reporting practices (O’Dwyer, 2003). Not
only have institutional pressures been shown to be strong determinants of CSR
disclosures, they have also been able to play a role in firms’ adoption of the GRI
standards. In the executive interviews, one company described its disclosure strategy as
being actively prepared for issues that can be predicted and to respond reactively on a
case-by-case basis for those that cannot be predicted.
The Government Stability Index measured government unity, legislative strength
and popular support (ICRG, 2012). The Law and Order Index assessed the strength and
impartiality of the legal system, as well as observance of the law (ICRG, 2012). Finally,
the Bureaucracy Quality Index measures the expertise, quality and stability of elected
officials and their administrative counterparts. The results from the quantitative study
indicate that as the quality and stability of elected officials drops, there is an increasing
need to be seen as legitimate. This is important because reporting at a higher level may
help reduce future calls for mandatory reporting and for increased government regulation.
Higher reporting levels could also be interpreted by government as a signal from the firm
that it is being more transparent.

114
Government stability and bureaucratic quality were found to be strong predictors
of both the firm’s chosen application level and third party assurance. These findings are
consistent with past research which showed that firms that are more attuned to the
environment are more sensitive to institutional pressures and are more likely to respond
through increased disclosure (Nikolaeva & Bicho, 2011). The disclosures also provide a
means by which to signal stakeholders that companies have sound CSR activities. They
also provide a valuable tool for companies to express concern for society and
demonstrate legitimacy (Othman, Darus & Arshad, 2011).
These findings are important for two reasons. First of all, these findings suggest
as government stability and bureaucratic quality decrease, the firm chooses higher
application levels. It also chooses to have its reports assured by a third party. This could
further indicate that firms may view government as having greater salience than other
stakeholders.
The findings also reinforce the role of legitimacy theory, which suggests that for
the firm to maintain legitimacy; it must be cognizant of changes to the environment and
be ready to engage in a legitimization process (Ashforth & Gibbs, 1990; Islam & Deegan,
2010). Disclosing CSR-related activities and engaging in the assurance process serves to
signal legitimacy, which may be helpful where government stability and bureaucratic
quality are low (Bebbington, Larrinaga-Gonzalez & Moneva-Abadıa, 2008; Fombrun &
Gardberg, 2000; Gray et al., 1995).
The final measure used to assess political turbulence was only found to have a
relationship with a firm’s choice of third party assurance. These results are not
unexpected considering that Law and Order Index is used to assess the observance of the

115
law. This can also be best explained using legitimacy theory. By operating within
society’s norms and expectations and providing third party assurance, the firm receives
support for its operations in an environment, which values adherence to the law (Guthrie
& Parker, 1989; O’Dwyer, 2003; Suchman, 1995).
Limitations
The executive interviews served to help confirm the model and inform data
interpretation. However, due to language limitations, the firms that were included in this
study were restricted to those whose executives spoke English. This led to a sample of
companies based either in the United States or Western Europe. Firms in Asia, Africa
and Latin America were not included. As a result, key insights from these regions were
not included.
Another limitation of the executive interviews was that open-ended questions that
were included were overly broad. The questions were helpful in identifying holes in the
model, but were too broad to sufficiently delve into the constructs or into each of the
individual variables. More specific questions are needed to provide deeper insight into
the firm’s strategy and its process for reporting.
Finally, the questions that were included provided more insight into the choice of
application level than into the firm’s decision to pursue 3rd party assurance. Respondents
were asked what influenced their current application level choice, but they were not
asked what influenced their use of the GRI framework. They were not asked about what
influences their decision to pursue 3rd party assurance. While many of the respondents
shared that information, the interviews could have provided greater insight about the
choice of third party assurance.
The sample used in the quantitative portion of the study also had limitations. With

116
the inclusion of certain financial measures, only public companies were included in the
study. While the data set that resulted was substantial, it was too small to be able to
analyze both an analysis sample and a holdout sample. Splitting the sample into these
smaller samples would have reduced the sample size further and reduced the power of the
model (Hair, et al., 2010).
As a result of the focus on public companies, private firms, cooperatives, non-
profit organizations, partnerships, state owned companies and subsidiaries that are
included in the registry were not included in the sample. While these organizations
would not have been able to be included in the present model given the included
measures, further evaluation and a refined model may help provide additional insight
about CSR disclosure strategies.
There were also limitations associated with specific variables. The most notable
of these is corporate reputation. While difficulty with past corporate reputation measures
was noted prior to the start of the study, the number of companies with RepTrak scores
was so limited that it was difficult to draw conclusions from this variable. Additionally,
measures of stakeholder involvement do not adequately capture the power, legitimacy or
urgency of individual stakeholders.
Future Research
The findings from this study reinforce the need for additional study of CSR
disclosure strategy. As has ben noted throughout the discussion presented here, a number
of questions persist that require examination. These questions will result in areas of
additional research that should be undertaken.
One area that must be more closely examined in future research is the role of
specific stakeholders. The executive interviews shed light on the influence of certain

117
stakeholders. Additional research is needed to understand if the inclusion of specific
stakeholder groups in the CSR report influences either the choice of application level or
the decision to pursue third party assurance. In addition to data that can be gleaned from
a quantitative study, numerous questions remain about stakeholders that require
additional qualitative interviews. For instance, what criteria does the firm use to rank
order its stakeholders? Once the firm has prioritized its stakeholders, do the goals for
reporting differ by stakeholder and if so, how might they differ? These questions can
help shed light on the role of stakeholder salience in determining a firm’s CSR disclosure
strategy.
The results suggested that for firms with reporting experience, firm size and firm
age are no longer criteria that are used to determine potential comparators. Given this
change, it is important to understand the criteria firms now use. It would be useful to
examine companies that have changed their reporting levels during the last two years to
determine if there is a difference between those firms and firms who have maintained
their reporting level. A similar examination should be undertaken of those who have
applied third party assurance in the last two years versus those that have remained
consistent. Finally, it would be useful to examine firms that have not chosen an
application level to understand the role that firm size and firm age have as predictors
compared to reporting experience.
Questions remain about institutional norms that guide companies in the
construction of their CSR reports. It is also not clear what these norms consist of and
what role the firm’s values and corporate culture may play. As the role of the Board of
Directors shifts from strategic to advisory, it would be useful to understand how the role

118
of the Board and the role of senior staff differ. It is also unclear what role individual
business units might play in shaping the disclosure strategy.
There are also questions about institutional processes that companies follow to
construct their CSR reports. While executives described the role of committees within
their firms, the size and makeup of those committees is still unclear. It would be helpful
to understand how many employees may be involved formally and informally and how
their roles differ. The role of third party advisors and consultants is also unclear. Further
research is needed to understand how these individuals may influence the structure of the
report, the choice of application level and the role of third party assurance. Greater
clarity about their role in strategy and report development could also be beneficial. These
questions would require a mix of both qualitative and quantitative research.
One final area of future research that could be useful is to understand the role of
other influencers. A topic that was discussed during one of the executive interviews was
the benchmarking of that firm against others who were thought to be leaders in CSR
reporting. It was not clear what criteria might be used by the firm or by other firms to
determine comparators. It is also unclear what role the UN Global Compact, Carbon
Disclosure Project and other similar efforts may have on a firm’s reporting.
Implications
This study has significant implications for firms that employ CSR disclosure
strategies and for the researchers who study them. The factors that once influenced CSR
disclosure strategies have changed with the evolution of CSR reporting practices and the
introduction and widespread adoption of the GRI Guidelines. This research sought to
understand if theoretical models proposed by Ullmann (1985) and Adams (2002) were
still sufficient to explain the determinants of a firm’s CSR disclosure strategy.

119
Ultimately, it sought to understand if non-financial corporate characteristics, financial
performance, stakeholder involvement and environmental turbulence were predictive of
the firm’s choice of GRI application level and whether or not it should pursue third party
assurance.
While only one of the four constructs was supported, the combination of
predictive variables that were shown to be related help strengthen our understanding of
disclosure strategy. For practitioners, there are four key concepts that firms must
consider in developing their CSR disclosure strategy. These include stakeholder salience,
environmental turbulence, mimetic behavior, and institutional norms.
Stakeholder salience suggests that certain stakeholders are prioritized by the firm
because of their power, their legitimacy and the urgency of their issue (Mitchell, et. al,
1997). Practitioners must pay close attention to these criteria as they determine which
stakeholders should the focus of the firm’s CSR disclosures. Of the stakeholders in this
study, government was most powerful not just because of its interactions with the firm,
but also because of its ability to create a turbulent business environment.
Practitioners must monitor the impact of government at all levels and understand
the threat environmental turbulence may play in undermining the firm’s legitimacy.
Decreases in government stability and bureaucratic quality have created political
turbulence that has led firms to choose higher application levels and third party
assurance. In this turbulent environment, practitioners must also be prepared to modify
the reporting strategy their firm employs for CSR reporting in order to meet society’s
expectations and the expectations of key stakeholders (Ader, 1995, Neu et al., 1998;
Yongvanich & Guthrie, 2006).

120
In developing disclosure strategies, practitioners must also be aware of criteria
that guide their choice of comparator firms and the mimetic behaviors that result. Firms
have based their disclosure strategy on those firms with reporting experience rather than
those who are the largest or oldest. While they have mimicked the reporting practices of
other companies, the influence of those firms may not fully be appreciated. Given this
research, practitioners should proactively consider how they choose comparator firms.
Understanding these factors will help guide future CSR disclosure strategies. It is also
important that they recognize that the practices firms adopt will ultimately become
institutional norms that shape the firm’s reporting. Those charged with developing the
firm’s disclosure strategy should be aware of how institutional norms, values and beliefs
shape the business environment in which the firm operates and its strategy for reporting
(Hoffman, 1999; Jackson & Apostolakou, 2010; Nikolaeva & Bicho, 2011).
For scholars, the results of this study help strengthen the understanding of theories
used to explain a firm’s CSR disclosure strategy. Ultimately, the findings suggest that
theoretical models proposed by Ullmann (1985) and Adams (2002) are no longer
sufficient to explain the factors that influence a firm’s strategy for CSR reporting. Past
efforts to explain the quantity and quality of CSR reporting have relied on a broad set of
theories. Institutional, stakeholder and legitimacy theories all have a role in explaining
the determinants of a firm’s disclosure strategy and must work in concert with one
another if disclosure strategies are to be explained sufficiently.
This study reinforced that no single theory is sufficient to explain CSR reporting.
Instead, future studies must employ a broad theoretical framework similar to that which
has been used here. In applying this theoretical framework, researchers like practitioners

121
must pay attention to certain key concepts. Based on this research, future studies of CSR
disclosure strategy must pay attention to stakeholder salience, environmental turbulence,
the firm’s mimetic behavior and the institutional norms it adopts.
Stakeholder salience suggests that certain stakeholders are prioritized by the firm
because of their power, their legitimacy and the urgency of their issue (Mitchell, et. al,
1997). Research should examine a set of stakeholders that is determined based on
stakeholder salience. Based on this research, specific stakeholders like employees,
customers, shareholders, government and non-governmental organizations must be
included. Others may be examined, but only if they are deemed to have salience and be
central to understanding CSR disclosures.
In this study, government was found to be the most powerful stakeholder.
Government stability and bureaucratic quality have shaped the business environment and
led firms to choose higher application levels and third party assurance. This has created a
need to better understand environmental turbulence and the role of the business
environment in shaping firms’ disclosure strategies. The firm’s pursuit of legitimacy
means it must also monitor the environment and be ready to engage in a legitimization
process. In the future, conceptual models used to explain CSR disclosure strategies
should include both specific stakeholders and environmental turbulence.
Finally, mimetic behaviors and institutional norms are also concepts that shape
the firms reporting strategy. This research suggests that firms are now likely to mimic
other companies CSR reporting efforts based on their reporting experience. Scholars
must better understand the criteria that guide the choice of comparator firms. It is also
crucial to understand the comparison process and how mimetic behaviors develop.

122
As has been noted, firms mimic the reporting practices of other companies, but
may not fully appreciate the influence those firms may have. Given the role that these
firms have, scholars must better understand the process of comparison and how this helps
inform CSR disclosure strategies. As firms gain experience, their choices of application
level and third party assurance are institutionalized within the firm. It is important first to
understand how the practices a firm adopts guides its reporting. It is also important to
understand how the firm’s experience influences institutional norms that ultimately guide
its disclosure strategy. Given what has been learned here, both mimetic behaviors and
institutional norms must be included in future models.
As shown here, this study has significant implications for both practitioners and
scholars in furthering our understanding of CSR disclosure strategies. Widespread
adoption of the GRI Guidelines and firms’ experience with this framework has influenced
CSR disclosure strategies that firms employ. As use of the GRI continues to grow,
practitioners must consider how stakeholder salience, environmental turbulence, mimetic
behavior and institutional norms shape their strategies. At the same time, researchers
must continue to understand how these and other factors that have not been studied here
may be predictive of the firm’s choice of GRI application level and whether or not it
should pursue third party assurance.

123
REFERENCES
Aaker, D. A. (2008). Strategic market management. John Wiley & Sons.
Akhter, S., & Daly, K. J. (2009). Finance and poverty: Evidence from fixed effect vector decomposition. Emerging Markets Review, 10(3), 191-206.
Abbott, W.F. & Monsen, R.J. (1979). On the measurement of corporate social responsibility: Self-Reported Disclosures as a method of measuring corporate social involvement. Academy of Management Journal, 22(3), 501-515.
ABI/Inform (2012). Retrieved from Business Source Complete at http://search.proquest.com.proxy.kennesaw.edu/abicomplete/index.
Ackerman, S.R. and Tobin, J. (2005) Foreign Direct Investment and the Business Environment in Developing Countries: The Impact of Bilateral Investment Treaties. Yale Law & Economics Research Paper No. 293.
Adams, C.A. (2002). Internal organisational factors influencing corporate social and ethical reporting beyond current theorising. Accounting, Auditing & Accountability Journal, 15(2), 223-250. Adams, C.A., Hill, W.Y. & Roberts, C.B. (1998). Corporate social reporting practices in Western Europe: Legitimating corporate behavior. British Accounting Review, 30(1), 1-21.
Adams, C.A. & Kuasirikun, N. (2000). A comparative analysis of corporate reporting on ethical issues by UK & German chemical and pharmaceutical companies. European Accounting Review, 9(1), 53-80.
Adams, C.A. & Whelan, G. (2009). Conceptualising future change in corporate sustainability reporting. Accounting, Auditing & Accountability Journal, 22(1), 118-143.
Ader, C. R. (1995). A longitudinal study of agenda setting for the issue of environmental pollution. Journalism & Mass Communication Quarterly, 72(2), 300–311.
Aerts, W., Cormier, D., & Magnan, M. (2006). Intra-industry imitation in corporate

124
environmental reporting: An international perspective. Journal of Accounting and Public Policy, 25(3), 299–331.
Adsera, A., Boix, C., & Payne, M. (2003). Are you being served? Political accountability and quality of government. Journal of Law, Economics and Organization, 19(2), 445-490. Andersen, M., & Skjoett-Larsen, T. (2009). Corporate social responsibility in global supply chains. Supply Chain Management: An International Journal, 14(2), 75- 86.
Andrews, B.H., Gul, F.A., Guthrie, J.E. and Teoh, H.Y. (1989). A note on corporate social disclosure practices in developing countries: The case of Malaysia and Singapore. British Accounting Review, 21(4), 371-376.
Arvidsson, S. (2010). Communication of corporate social responsibility: A study of the views of management teams in large companies. Journal of Business Ethics, 96(3), 339–354.
Ashforth, B.E. & Gibbs, B.W. (1990). The double-edge of organizational legitimation. Organization Science, 1(2), 177–194.
Barnett, M. L. (2007). Stakeholder influence capacity and the variability of financial returns to corporate social responsibility. Academy of Management Review, 32(3), 794–816.
Barnett, M. L. & Salomon, R. (2006). Beyond dichotomy: The curvilinear relationship between social responsibility and financial performance. Strategic Management Journal, 27(11), 1101–1122.
Bayoud, N. S., Kavanagh, M., & Slaughter, G. (2012). Factors Influencing Levels of Corporate Social Responsibility Disclosure by Libyan Firms: A Mixed Study. International Journal of Economics and Finance, 4(4), 13-29.
Bebbington, J., Larrinaga-Gonzalez, C. & Moneva-Abadıa, J.M. (2008). Corporate social responsibility reporting and reputation risk management. Accounting, Auditing & Accountability Journal, 21(3), 337-62.
Becchetti, L., Ciciretti, R., Hasan, I., & Kobeissi, N. (2012). Corporate social responsibility and shareholder’s value. Journal of Business Research, 65(11), 1628-1635.
Belal, A. R. & Roberts, R. W. (2010). Stakeholders’ perceptions of corporate social reporting in Bangladesh. Journal of Business Ethics, 97(2), 311-324.

125
Belkaoui, A. & Karpik, R.G. (1989). Determinants of the corporate decision to disclose social information. Accounting, Auditing & Accountability Journal, 2(1), 36-51.
Berthon, P., Pitt, L., Nel, D., Salehi-Sangari, E. & Engstrom, A. (2008). The biotechnology and marketing interface: Functional integration using mechanistic and holographic responses to environmental turbulence. Journal of Commercial Biotechnology. 14(3), 213–224. Berthon, P.R., Pitt, L.F., Plangger, K. & Shapiro, D. (2012). Marketing meets Web 2.0, social media and creative consumers: Implications for international marketing strategy. Business Horizons, 55, 261–271.
Bhattacharya, C. B., & Korschun, D. (2008). Stakeholder marketing: Beyond the four Ps and the customer. Journal of Public Policy & Marketing, 27(1), 113–116.
Boesso, G., & Kumar, K. (2007). Drivers of corporate voluntary disclosure. Accounting, Auditing & Accountability Journal, 20(2), 269-296.
Brammer, S. & Pavelin, S. (2006). Voluntary Environmental Disclosures by Large UK Companies. Journal of Business Finance & Accounting 33(7-8), 1168–1188.
Brammer, S. & Pavelin, S. (2008). Factors influencing the quality of corporate environmental disclosure. Business Strategy and the Environment, 17,120–136.
Brown, T. J., Dacin, P. A., Pratt, M. G., & Whetten, D. A. (2006). Identity, intended image, construed image and reputation: An interdisciplinary framework and suggested terminology. Journal of the Academy of Marketing Science, 34(2), 99– 106.
Brown, H. S., de Jong, M., & Levy, D. L. (2009). Building institutions based on information disclosure: Lessons from GRI’s sustainability reporting. Journal of Cleaner Production, 17(6), 571–580.
Bushman, R., Chen, Q., Engel, E., & Smith, A. (2004). Financial accounting information, organizational complexity and corporate governance systems. Journal of Accounting and Economics, 37(2), 167-201.
Campbell, D. J. (2000). Legitimacy theory or managerial reality construction? corporate social disclosure in Marks and Spencer Plc Corporate Reports, 1969– 1997. Accounting Forum 24, 80–100.
Campbell, D., Craven, B. & Shrives, P. (2003). Voluntary Social Reporting in three FTSE sectors: A comment on perception and legitimacy. Accounting, Auditing & Accountability Journal, 16(4), 558–581.

126
Capital IQ (2013). Retrieved from Capital IQ at www.capitaliq.com.
Carroll, A. B. (1991, July/August). The pyramid of corporate social responsibility: Toward the moral management of organizational stakeholders. Business Horizons, 34(4), 39-48.
Carroll, A. B. (1999). Corporate social responsibility evolution of a definitional construct. Business & Society, 38, 268-295.
Carter, S. M. (2006). The interaction of top management group, stakeholder and situational factors on certain corporate reputation management activities. Journal of Management Studies, 43(5), 1145–1176.
Chapple, W. & Moon, J. (2005). Corporate Social Responsibility (CSR) in Asia A Seven-Country Study of CSR Web Site Reporting. Business & Society, 44, 415-441.
Chatterji A. & Levine, D. (2006). Breaking down the wall of codes: evaluating non- financial performance measurement. California Management Review, 48, 29–51.
Chen, S. & Bouvain, P. (2009). Is corporate social responsibility converging: A comparison of corporate responsibility reporting in the USA, UK, Australia and Germany. Journal of Business Ethics, 87, 299-317.
Chen, J., Patten, D. M., & Roberts, R. W. (2008). Corporate charitable contributions: a corporate social performance or legitimacy strategy? Journal of Business Ethics, 82(1), 131-144.
Choi, J.S., Kwak, Y.M., & Choe, C.W. (2010). Corporate social responsibility and corporate financial performance: Evidence from Korea. Australian Journal of Management, 35(3), 291-311.
Clarkson, M.B. (1995). A stakeholder framework for analyzing and evaluating corporate social performance. Academy of Management Review, 20, 92–117.
Cormier, D. Gordon, I.M. & Magnan, M. (2004). Corporate environmental disclosure: contrasting management's perceptions with reality. Journal Of Business Ethics, 49, 143-165.
Cormier, D. & Magnan, M (1999). Corporate environmental disclosure strategies: Determinants, costs and benefits. Journal of Accounting, Auditing and Finance, 14(4), 429–451.
Cormier, D. & Gordon, I.M (2001). An examination of social and environmental

127
reporting strategies. Accounting, Auditing & Accountability Journal, 14, 587 - 617. Cormier, D. & Magnan, M (2003). Environmental reporting management: a continental European perspective. Journal of Accounting and Public Policy, 22(1), 43–62.
Cormier D, M., Magnan, M. & Van Velthoven, B. (2005). Environmental disclosure quality in large German companies: Economic incentives, public pressures or institutional conditions? European Accounting Review, 14(1), 3–39.
Cowen, S.S., Ferreri, L.B. & Parker, L.D. (1987). The impact of corporate characteristics on social responsibility disclosure: A typology and frequency based analysis. Accounting. Organizations and Society, 12(2), 111-22.
Crittenden, V.L., Crittenden, W.F., Ferrell, L.K., Ferrell, O.C. & Pinney, C.C. (2011) Market-oriented sustainability: a conceptual framework and propositions. Journal of the Academy of Marketing Science, 39(1), 71-85.
Cronin, J. J., Smith, J. S., Gleim, M. R., Ramirez, E., & Martinez, J. D. (2011). Green marketing strategies: an examination of stakeholders and the opportunities they present. Journal of the Academy of Marketing Science, 39(1), 158-174.
Dhaliwal, D. S., Radhakrishnan, S., Tsang, A., & Yang, Y. G. (2012). Nonfinancial disclosure and analyst forecast accuracy: International evidence on corporate social responsibility disclosure. The Accounting Review, 87, 723-759.
Dando, N. & Swift, T. (2003). Transparency and assurance: Minding the credibility gap. Journal of Business Ethics, 44(1-2), 195-200.
Deegan C. (2002). The legitimizing effect of social and environmental disclosures – A theoretical foundation. Accounting, Auditing and Accountability Journal, 15, 282–311.
Deegan, C. & Blomquist, C. (2006). Stakeholder influence on corporate reporting: An exploration of the interaction between WWF, Australia and the Australian minerals industry. Accounting, Organizations and Society, 31(4-5), 343-372.
Deegan, C. & Gordon, B. (1996). A study of the environmental disclosure practices of Australian corporations. Accounting and Business Research, 26(3), 187-199. Deegan, C., Rankin, M. & Tobin, J. (2002). An examination of the corporate social and environmental disclosures of BHP from 1983-1997: A test of legitimacy theory. Accounting, Auditing & Accountability Journal, 15(3), 312 – 343.

128
Deephouse, D. L., & Wiseman, R. M. (2000). Comparing alternative explanations for accounting risk-return relations. Journal Of Economic Behavior & Organization, 42(4), 463-482.
Dhaliwal, D. S., Li, O. Z., Tsang, A., & Yang, Y. G. (2011). Voluntary nonfinancial disclosure and the cost of equity capital: The initiation of corporate social responsibility reporting. The Accounting Review, 86(1), 59-100.
Dilling, P. F. (2009). Sustainability reporting in a global context: What are the characteristics of corporations that provide high quality sustainable reports–An empirical study. International Business & Economics Research Journal, 9(1), 19- 30.
Donaldson, T. & Preston, L.E. (1995). The stakeholder theory of the corporation: concepts, evidence and implications. Academy of Management Review, 20(1), 65–91.
Dowling J. & Pfeffer, J. (1975). Organizational legitimacy: social values and organizational behavior. Pacific Sociological Review 18, 122–136.
Du, S., Bhattacharya, C. B., & Sen, S. (2010). Maximizing business returns to corporate social responsibility (CSR): the role of CSR communication. International Journal of Management Reviews, 12(1), 8-19.
Dubbink, W., Graafland, J. & van Liedekerke, L. (2008). CSR, transparency and the role of intermediate organizations. Journal of Business Ethics 82(2), 391–406
Eccles, R. G., Herz, R. H., Keegan, E. M., & Phillips, D. M. (2001). The ValueReporting revolution: moving beyond the earnings game. Wiley. New York, NY.
Edelman Inc. (2009). Trust: 2009 Edelman Trust Barometer. Retrieved from http://www.edelman.com/trust/2011/uploads/Trust%20Executive%20Summary.P DF.
Elkington, J. (1994). Toward the suitable corporation: Win-win-win business strategies for sustainable development. California Management Review, 36(2), 90–100.
Elkington, J. (1998). Partnerships from cannibals with forks: The triple bottom line of 21st century business. Environmental Quality Management, 8(1), 37–51.
Ellen, P. S., Webb, D. J., & Mohr, L. A. (2006). Building corporate associations: consumer attributions for corporate socially responsible programs. Journal of the Academy of Marketing Science, 34(2), 147-157.

129
Eng, L. L., & Mak, Y. T. (2003). Corporate governance and voluntary disclosure. Journal of Accounting and Public Policy, 22(4), 325-345.
Fama, E. F., & Jensen, M. C. (1983). Separation of ownership and control. Journal of Law and Economics, 26, 301.
Ferrell, O. C., Gonzalez-Padron, T. L., Hult, G. T. M., & Maignan, I. (2010). From market orientation to stakeholder orientation. Journal of Public Policy & Marketing, 29(1), 93–96.
Fiss, P. C., & Zajac, E. J. (2006). The symbolic management of strategic change: sensegiving via framing and decoupling. Academy of Management Journal, 49(6), 1173-1193.
Fombrun, C.J. & Gardberg, N.A. (2000). Who’s tops in corporate reputation? Corporate Reputation Review, 3(1), 13-17.
Fombrun, C.J. & Pan, M. (2006). Corporate reputations in China: How do consumers feel about companies? Corporate Reputation Review, 9, 165-170.
Fombrun, C. & Shanley, M. (1990). What’s in a name? Reputation building and corporate strategy. Academy of Management Journal, 33(2), 233–258.
Fontana, A., & Frey, J. H. (1994). Interviewing: The art of science. In N. K. Denzin & Y. S. Lincoln (Eds.), Handbook of Qualitative Research, 361–376. London: Sage.
Fortanier, F., Kolk, A., & Pinkse, J. (2011). Harmonization in CSR Reporting. Management International Review, 51(5), 665-696.
Freedman, M., & Jaggi, B. (1982). Pollution disclosures, pollution performance and economic performance. Omega, 10(2), 167-176.
Freedman, M. & Jaggi, B. (1988). An analysis of the association between pollution disclosure and economic performance. Accounting, Auditing & Accountability Journal, 1(2), 43 – 58.
Freeman, R. E. (1984). Strategic Management: A Stakeholder Approach. Englewood Cliffs, NJ: Prentice-Hall.
Friedman, A.L. & Miles, S. (2001). Socially responsible investment and corporate social and environmental reporting in the UK: An exploratory study. British Accounting Review, 33, 523-48.
Frooman, J. (1999). Stakeholder influence strategies. Academy of Management Review, 24(2), 191-205.

130
Gamerschlag, R., Moller, K. & Verbeeten, F. (2011). Determinants of voluntary CSR disclosure: Empirical evidence from Germany. Review of Managerial Science, 5(2-3), 233–262.
Ge, W., & McVay, S. (2005). The disclosure of material weaknesses in internal control after the Sarbanes-Oxley Act. Accounting Horizons, 19(3), 137-158.
Genetic Engineering and Technology News (2013). The top 15 pharma companies of 2013. Retrieved from http://www.genengnews.com/insight-and- intelligenceand153/top-15-pharma-companies-of-2013. Accessed September 2013.
Global Reporting Initiative (2012). Retrieved from http://www.globalreporting.org. Accessed April 2011.Global Reporting Initiative (2011).
Global Reporting Initiative G3.1Sustainability Guidelines, Amsterdam.
Gray, R. (2006). Social, environmental and sustainability reporting and organisational value creation? Whose value? Whose creation? Accounting, Auditing and Accountability Journal, 19(6), 319–348.
Gray, R.H., Kouhy, R. & Lavers, S. (1995). Corporate Social And Environmental Reporting: A Review Of The Literature And A Longitudinal Study Of UK Disclosure. Accounting, Auditing & Accountability Journal, 8, 47-77.
Gray, R.H., Owen, D.L & Maunders, K.T. (1988). Corporate social reporting: emerging trends in accountability and the social contract. Accounting, Auditing & Accountability Journal, 1(1), 6-20.
Gray, R.H., Owen D.L. & Adams, C. (1996). Accounting and Accountability: Changes and Challenges in Corporate Social and Environmental Reporting. London: Prentice Hall.
Griffin, J. J. & Mahon, J.F. (1997). The corporate social performance and corporate financial performance debate. Business & Society, 36(1), 5–31.
Gundlach, G. T., & Wilkie, W. L. (2010). Stakeholder Marketing: Why “Stakeholder” Was Omitted from the American Marketing Association's Official 2007 Definition of Marketing and Why the Future Is Bright for Stakeholder Marketing. Journal of Public Policy & Marketing, 29(1), 89-92.
Guthrie J. & Farneti, F. (2008) GRI sustainability reporting by Australian public sector organizations. Public Money & Management 28(6), 361–366.

131
Guthrie, J. E., & Parker, L. D (1989). Corporate social reporting: a rebuttal of legitimacy theory. Accounting & Business Research, 19(76), 343–352. Guthrie, J., & Parker, L. D. (1990). Corporate social disclosure practice: a comparative international analysis. Advances in Public Interest Accounting, 3(2), 159-176. Guthrie J., Petty, R., Yongvanich. K. & Ricceri F (2004) Using content analysis as a research method to inquire into intellectual capital reporting. Journal of Intellectual Capital, 5(2), 282–293. Hackston, D. & Milne, M. (1996). Some determinants of social and environmental disclosures in New Zealand companies. Accounting, Auditing & Accountability Journal, 9, 77-108.
Haddock-Fraser, J. & Fraser, I. (2008). Assessing corporate environment reporting motivations: Differences between ‘close-to-market’ and ‘business-to-business’ companies. Corporate Social Responsibility and Environmental Management, 15, 140–155.
Hambrick, D. C. (1983). An Empirical Typology of Mature Industrial-Product Environments. Academy of Management Journal, 26(2), 213-230.
Hambrick, D. C., & Abrahamson, E. (1995). Assessing managerial discretion across industries: A multi-method approach. Academy of Management Journal, 38(5), 1427-1441.
Hair, J. F., Black, W., Babin, B., & Anderson, R. (2010). Multivariate data analysis with readings (7th edition). Englewood Cliffs, NJ: Prentice Hall.
Haleblian, J & Finkelstein, S. (1993). Top management team size, CEO dominance and firm performance: The moderating roles of environmental turbulence and discretion. Academy of Management Journal, 36, 844-863.
Healy, P.M. & Palepu, K.G. (2001). Information asymmetry, corporate disclosure and the capital market: a review of the empirical disclosure literature. Journal of Accounting and Economics, 31(1-3), 405-40.
Herzig, C. & Schaltegger, S. (2006). Corporate sustainability reporting: An overview. Sustainability Accounting and Reporting, 3, 301-324.
Hill, C. W. L. & Jones, T. M. (1992). Stakeholder-Agency theory. Journal of Management Studies, 29(2), 131–154.

132
Ho, LJ & ME Taylor (2007). An empirical analysis of triple bottom-line reporting and its determinants: Evidence from the United States and Japan. Journal of International Financial Management and Accounting 18(2), 123-150.
Hoeffler, S., & Keller, K. L. (2002). Building brand equity through corporate societal marketing. Journal of Public Policy & Marketing, 21(2), 78-89.
Hoffman, Andrew (1999). Institutional evolution and change: Environmentalism and the U.S. chemical industry. Academy of Management Journal, 42(4), 351-371.
Hogner, R.H. (1982). Corporate social reporting: Eight decades of development at US Steel. Research in Corporate Social Performance and Policy, 4, 45-55.
Holder-Webb, L., Cohen, J., Nath, L. & Wood, D. (2009). The supply of corporate social responsibility disclosures among US firms. Journal of Business Ethics, 84(4), 497-527.
Hooghiemstra, R. (2000). Corporate communication and impression management –- new perspectives why companies engage in corporate social reporting. Journal of Business Ethics, 27, 55–68.
Hosmer David, W. & Stanley, L. (2000). Applied logistic regression. John Wiley.
Hossain, Mohammed & Hammami, Helmi (2009). Voluntary disclosure in the annual reports of an emerging country: The case of Qatar. Advances In Accounting, 17, 227-250.
Hristache, D. A., & Iacob, S. E. (2012). Globalism and Corporate Identity in the Post- crisis Economy. Theoretical and Applied Economics, 18(2 (567)), 81-88.
Huang, C.L. & Kung, F.H. (2010). Drivers of Environmental Disclosure and Stakeholder Expectation: Evidence from Taiwan. Journal Of Business Ethics, 96(3), 435-451.
Hubbard, G. (2011). The Quality of the Sustainability Reports of Large International Companies: An Analysis. International Journal of Management, 28(3), 824-848.
Hull, C. E., & Rothenberg, S. (2008). Firm performance: the interactions of corporate social performance with innovation and industry differentiation. Strategic Management Journal, 29(7), 781–789.
Hult, G.T.M., Mena, J.A., Ferrell, O.C. & Ferrell, L. (2011). Stakeholder marketing: a definition and conceptual framework. AMS Review, 1(1), 44-65.

133
Hyman, M. R., & Mathur, I. (2005). Retrospective and prospective views on the marketing/finance interface. Journal of the Academy of Marketing Science, 33(4), 390–400.
International Country Risk Guide (2012). Retrieved from http://www.prsgroup.com. Accessed June 2012.
Ingram, R.W. (1978). An Investigation of the Information Content of (Certain) Social Responsibility Disclosures, Journal of Accounting Research, 16(2), 270-285.
Ingram, R.W. & Frazier, K.B. (1980). Environmental performance and corporate disclosure. Journal of Accounting Research, 18(2), 614-622.
Islam, M.A. & Deegan, C. (2010). Media pressures and corporate disclosure of social responsibility performance information: A study of two global clothing and sports retail companies. Accounting and Business Research, 40, 131-148.
Ismail, K. N., & Chandler, R. (2005). Disclosure in the quarterly reports of Malaysian companies. Financial Reporting, Regulation & Governance, 4(1), 1- 25.
Ivashina,V. & Scharfstein, D. (2010). Bank lending during the financial crisis of 2008. Journal of Financial Economics, 97(3), 319-338.
Jackson, G. & Apostolakou, A. (2010). Corporate social responsibility in Western Europe: An institutional mirror or substitute? Journal of Business Ethics 94(3), 371–394.
Jones, T. M. (1995). Instrumental stakeholder theory: A synthesis of ethics & economics. Academy of Management Review, 20, 404-437. Joshi, P.L. & Gao, S.S. (2009). Multinational corporations’ corporate social and environmental disclosures (CSED) on web sites. International Journal of Commerce and Management, 19, 27-44.
Kaplan, S. N., & Minton, B. A. (1994). Appointments of outsiders to Japanese boards: Determinants and implications for managers. Journal of Financial Economics, 36(2), 225-258.
Kateb, I. (2012). An Analysis of the Determinants of Voluntary Structural Capital Disclosure by Listed French Companies. International Journal of Business and Management, 7(11), 95-110.

134
Keim, G.D. (1978). Managerial Behavior and the Social Responsibilities Debate: Goals Versus Constraints. Academy of Management Journal, 21(1), 57-68.
Kennedy, M. T. (2008). Getting counted: Markets, media, and reality. American Sociological Review, 73(2), 270–295.
Kennedy, S. & Neuger, J.G. (2012). Greek Rescue Leaves Risk of Default Alive in Europe as Austerity Deepens. Bloomberg, Retrieved from http://www.bloomberg.com/news/2012-02-21/greek-rescue-leaves-risk-of- default-alive-in-europe-as-austerity-deepens.html.
KPMG, KPMG International Survey of Corporate Responsibility Reporting (2011). Retrieved from www.kpmg.com.
KPMG, KPMG International Survey of Corporate Responsibility Reporting (2008). Retrieved from www.kpmg.com.
Kolk, A. & Perego, P. (2010), Determinants of the adoption of sustainability assurance statements: an international investigation. Business Strategy and the Environment, 19(3), 182–198.
Kolk, A. & Pinkse, J. (2010). The integration of corporate governance in corporate social responsibility disclosures. Corporate Social Responsibility and Environmental Management, 17(1), 15-26.
Ljungqvist, L., & Sargent, T. J. (2004). European unemployment and turbulence revisited in a matching model. Journal of the European Economic Association, 2(2-3), 456-468.
Ljungqvist, L., & Sargent, T. J. (1998). The European unemployment dilemma. Journal
of Political Economy, 106(3), 514-550. Liu, X., & Anbumozhi, V. (2009). Determinant factors of corporate environmental information disclosure: an empirical study of Chinese listed companies. Journal of Cleaner Production, 17(6), 593-600.
Luo, X. & Bhattacharya, C.B. (2006). Corporate Responsibility, Customer Satisfaction and Value. Journal of Marketing, 70(4) 1–18.
Maignan, I., Ferrell, O.C. & Hult, G.T M. (1999). Corporate citizenship: Cultural antecedents and business benefits. Journal of the Academy of Marketing Science, 27(4), 455-469.

135
Marcus, A. & Kaufman, A. (1988). The continued expansion of the corporate public affairs function. Business Horizons, 31(2), 58-62.
Mason, R. (2006). Coping With Complexity And Turbulence: An Entrepreneurial Solution. Journal of Enterprising Culture, 14(4), 241-266. McGuire, J. B., Sundgren, A. & Schneeweis, T. (1988). Corporate social responsibility and firm financial performance. Academy of Management Journal, 31(4), 854– 872.
McWilliams, A. & Siegel, D. (2000). Corporate social responsibility and financial performance: Correlation or misspecification. Strategic Management Journal, 21(5), 603-609. McWilliams A. & Siegel, D. (2001). Corporate social responsibility: A theory of the firm perspective. Academy of Management Review, 26(1), 117–127.
Milne, M.J. & Patten, D.M. (2002). Securing organizational legitimacy: An experimental decision case examining the impact of environmental disclosures. Accounting, Auditing & Accountability Journal, 15, 372 – 405. Mitchell, R.K., Agle, B.R., & Wood, D.J. (1997). Toward a theory of stakeholder identification and salience: Defining the principle of who and what really counts. Academy of Management Review, 22(4), 853-886
Moneva J.M., Archel, P. & Correa, C. (2006). GRI and the camouflaging of corporate unsustainability. Accounting Forum, 30(2),121–137.
Morsing, M. & Schultz, M. (2006). Corporate social responsibility communication: stakeholder information, response and involvement strategies. Business Ethics: A European Review, 15(4), 323-338.
Moskowitz, M. (1972). Choosing socially responsible stocks. Business and Society, 1, 71-75.
Neu, D., Warsame, H. & Pedwell, K. (1998). Managing public impressions: environmental disclosures in annual reports. Accounting, Organizations and Society, 23(3), 265-282.
Nikolaeva, R. & Bicho, M. (2011). The role of institutional and reputational factors in the voluntary adoption of corporate social responsibility reporting standards. Journal of the Academy of Marketing Sciences, 39, 136–157.
O’Donovan, G. (2002). Environmental disclosures in the annual report: Extending the applicability and predictive power of legitimacy theory. Accounting, Auditing & Accountability Journal, 15, 344-371.

136
O’Dwyer B. (2001). The legitimacy of accountants' participation in social and ethical accounting, auditing and reporting. Business Ethics: A European Review, 10, 27- 39. O’Dwyer B. (2002). Managerial perceptions of corporate social disclosure: An Irish story. Accounting, Auditing and Accountability Journal, 15(3), 406–436.
O’Dwyer, B. (2003). The ponderous evolution of corporate environmental reporting in Ireland: Recent evidence from publicly listed companies. Corporate Social Responsibility and Environmental Management, 10, 91–100.
Oliver, C. (1991). Strategic responses to institutional processes. The Academy of Management Review, 16(1), 145-179.
Orlitzky, M., Schmidt, F. L., & Rynes, S. L. (2003). Corporate social and financial performance: A meta-analysis. Organization Studies, 24(3), 403-441.
Othman, S., Darus, F. & Arshad, R. (2011). The influence of coercive isomorphism on corporate social responsibility reporting and reputation. Social Responsibility Journal, 7(1), 118-135.
Owen, D. L., Swift, T., & Hunt, K. (2001, September). Questioning the role of stakeholder engagement in social and ethical accounting, auditing and reporting. In Accounting Forum (Vol. 25, No. 3, pp. 264-282). Blackwell Publishers Ltd.
Parker, L.D. (2005). Social and environmental accountability research: a view from the commentary box. Accounting, Auditing & Accountability Journal, 18(6), 842-60.
Patten, D.M. (1991). Exposure, legitimacy and social disclosure. Journal of Accounting and Public Policy, 10(4) 297-308.
Patten, D.M. (2002). The relation between environmental performance and environmental disclosure: a research note. Accounting, Organizations and Society, 27, 763–773.
Perez-Batres, L. A., Miller, V. V., & Pisani, M. J. (2010). CSR, sustainability and the meaning of global reporting for Latin American corporations. Journal of Business Ethics, 91, 193-209.
Perrini, F. (2005). Building a European Portrait of Corporate Social Responsibility Reporting. European Management Journal, 23(6), 611-627.

137
Prado-‐Lorenzo, J. M., Gallego-‐Alvarez, I., & Garcia-‐Sanchez, I. M. (2009). Stakeholder engagement and corporate social responsibility reporting: the ownership structure effect. Corporate Social Responsibility and Environmental Management, 16(2), 94-107.
Reputation Institute (2012). Retrieved from http://www.reputationinstitute.com/
Reynolds, M.A. & Yuthas, K. (2007). Moral discourse and corporate social responsibility reporting. Journal of Business Ethics, 78(1-2), 47-64.
Reverte, C. (2009). Determinants of corporate social responsibility disclosure ratings by Spanish listed firms. Journal of Business Ethics, 88, 351-366.
Rissman, E. R. (1997). Measuring labor market turbulence. Economic Perspectives-Federal Reserve Bank of Chicago, 21, 2-14.
Roberts, R. (1992). Determinants of corporate social responsibility disclosure: An application of stakeholder theory. Accounting Organizations and Society, 17(6), 595—612.
Roberts, D.H. & Koeplin, J.P. (2007). Sustainability reporting practices in Portugal: greenwashing or triple bottom line? International Business and Economic Research Journal, 6(9), 29-40.
Roman, R.R., Hayibor, S. & Able, B.R. (1999). The relationship between social and financial performance. Business and Society, 38, 109-125.
Rosebush, J. (1987) Corporate Contribution and the Bottom Line, Business and Economic Review, 26-28.
Sen, S., Bhattacharya, C. B., & Korschun, D. (2006). The role of corporate social responsibility in strengthening multiple stakeholder relationships: A field experiment. Journal of the Academy of Marketing Science, 34(2), 158-166.
Sethi, S. P. (1974). Dimensions of corporate social performance: An analytical framework for measurement and evaluation. Schools of Business Administration, University of California.
Sherman, W. R. (2009). The Global Reporting Initiative: What Value is Added? International Business & Economics Research Journal. 8(5) 9-22.

138
Shinkle, G.A. & Spencer, J.W. (2012). The social construction of global corporate citizenship: Sustainability reports of automotive corporations. Journal of World Business, 47(1), 123–133.
Solis, B., & Webber, A. (2012). The Rise of Digital Influence. Altimeter Group. Suchman, M.C. (1995). Managing legitimacy: Strategic and institutional approaches. The Academy of Management Review, 20(3), 571-610. Sweeney, L., & Coughlan, J. (2011). Do different industries report Corporate Social Responsibility differently? An investigation though the lens of stakeholder theory. Journal of Marketing Communications, 14(2), 113–124. Tinati, R., Carr, L., Hall, W., & Bentwood, J. (2012, April). Identifying communicator roles in twitter. In Proceedings of the 21st international conference companion on World Wide Web (pp. 1161-1168). ACM.
Turban, D. B., & Greening, D. W. (1997). Corporate social performance and organizational attractiveness to prospective employees. Academy of Management Journal, 40(3), 658-672.
Ullmann, AA (1985). Data in search of a theory: A critical examination of the relationships among social performance, social disclosure and economic performance of US Firms. Academy of Management Review, 10(3), 540-557.
Unerman, J. (2008). Strategic reputation risk management and corporate social responsibility reporting. Accounting, Auditing & Accountability Journal, 21(3), 362-364.
Vidaver-Cohen, D. (2007). Reputation beyond the rankings: a conceptual framework for business school research. Corporate Reputation Review, 10(4), 278–304.
Waddock, S., & Googins, B. K. (2011). The Paradoxes of Communicating Corporate Social Responsibility. The Handbook of Communication and Corporate Social Responsibility, 23.
Wagner, T., Lutz, R.J., & Weitz, B.A. (2009). Corporate hypocrisy: Overcoming the threat of inconsistent corporate social responsibility perceptions. Journal of Marketing, 73(6), 77-91.
Webster, J. & Watson, R.T (2002). Analyzing the past to prepare for the future: Writing a literature review. MIS Quarterly, 26, 13-23.

139
Williams, A. & Siddique, A. (2008). The use (and abuse) of governance indicators in economics: a review. Economics of Governance, 9,131–175.
Willis, A. (2003). The role of the global reporting initiative’s sustainability reporting guidelines in the social screening of investments. Journal of Business Ethics, 43(3), 233–237.
Wiseman, I. (1982). An evaluation of environmental disclosures in annual reports. Accounting, Organizations and Society, 7(1), 53-63.
Yongvanich, K. & Guthrie, J. (2006). An Extended Performance reporting Framework for Social and Environmental Accounting. Business Strategy and the Environment, 15, 309-321.
Zahra, S. A., & Stanton, W. W. (1988). The implications of board of directors composition for corporate strategy and performance. International Journal of Management, 5(2), 229-236.
Ziek, P. (2009). Making sense of CSR communication. Corporate Social Responsibility and Environmental Management, 16, 137–145.
Zyglidopoulos, S.C., Georgiadis, A.P., Carroll, C.E. & Siegel, D.S. (2012). Does media attention drive corporate social responsibility? Journal of Business Research, 65(11), 1622–1627.

140
APPENDICES

141
APPENDIX A
GRI Performance Indicators (GRI, 2012, 26-39)
Economic Performance Indicators
Aspect: Economic Performance
EC1 (Core) Direct economic value generated and distributed, including revenues, operating costs, employee compensation, donations and other community investments, retained earnings and payments to capital providers and governments.
EC2 (Core) Financial implications and other risks and opportunities for the organization’s activities due to climate change.
EC3 (Core) Coverage of the organization’s defined benefit plan obligations.
EC4 (Core) Significant financial assistance received from government.
Aspect: Market Presence
EC5 (Additional) Range of ratios of standard entry level wage by gender compared to local minimum wage at significant locations of operation.
EC6 (Core) Policy, practices and proportion of spending on locally-based suppliers at significant locations of operation.
EC7 (Core) Procedures for local hiring and proportion of senior management hired from the local community at locations of significant operation.
Aspect: Indirect Economic Impacts
EC8 (Core) Development and impact of infrastructure investments and services provided primarily for public benefit through commercial, in- kind or pro bono engagement.
EC9 (Additional) Understanding and describing significant indirect economic impacts, including the extent of impacts.
Environmental Performance Indicators
Aspect: Materials
EN1 (Core) Materials used by weight or volume.
142
EN2 (Core) Percentage of materials used that are recycled input materials.
Aspect: Energy
EN3 (Core) Direct energy consumption by primary energy source.
EN4 (Core) Indirect energy consumption by primary source.
EN5 (Additional) Energy saved due to conservation and efficiency improvements.
EN6 (Additional) Initiatives to provide energy-efficient or renewable energy based products and services and reductions in energy requirements as a result of these initiatives.
EN7 (Additional) Initiatives to reduce indirect energy consumption and reductions achieved.
Aspect: Water
EN8 (Core) Total water withdrawal by source.
EN9 (Additional) Water sources significantly affected by withdrawal of water.
EN10 (Additional) Percentage and total volume of water recycled and reused.
Aspect: Biodiversity
EN11 (Core) Location and size of land owned, leased, managed in or adjacent to, protected areas and areas of high biodiversity value outside protected areas.
EN12 (Core) Description of significant impacts of activities, products and services on biodiversity in protected areas and areas of high biodiversity value outside protected areas.
EN13 (Additional) Habitats protected or restored.
EN14 (Additional) Strategies, current actions and future plans for managing impacts on biodiversity.
EN15 (Additional) Number of IUCN Red List species and national conservation list species with habitats in areas affected by operations, by level of extinction risk.

143
Aspect: Emissions, Effluents And Waste
EN16 (Core) Total direct and indirect greenhouse gas emissions by weight.
EN17 (Core) Other relevant indirect greenhouse gas emissions by weight.
EN18 (Additional) Initiatives to reduce greenhouse gas emissions and reductions achieved.
EN19 (Core) Emissions of ozone-depleting substances by weight.
EN20 (Core) NO, SO and other significant air emissions by type and weight.
EN21 (Core) Total water discharge by quality and destination.
EN22 (Core) Total weight of waste by type and disposal method.
EN23 (Core) Total number and volume of significant spills.
EN24 (Additional) Weight of transported, imported, exported or treated waste deemed hazardous under the terms of the Basel Convention Annex I, II, III and VIII and percentage of transported waste shipped internationally.
EN25 (Additional) Identity, size, protected status and biodiversity value of water bodies and related habitats significantly affected by the reporting organization’s discharges of water and runoff.
Aspect: Products And Services
EN26 (Core) Initiatives to mitigate environmental impacts of products and services and extent of impact mitigation.
EN27 (Core) Percentage of products sold and their packaging materials that are reclaimed by category.
Aspect: Compliance
EN28 (Core) Monetary value of significant fines and total number of non-monetary sanctions for non-compliance with environmental laws and regulations.
Aspect: Transport
EN29 (Additional) Significant environmental impacts of transporting products and other goods and materials used for the organization’s operations and transporting members of the workforce.

144
Aspect: Overall
EN30 (Additional) Total environmental protection expenditures and investments by type.
Social Performance Indicators Labor Practices/Work Performance Indicators
Aspect: Employment
LA1 (Core) Total workforce by employment type, employment contract and region, broken down by gender.
LA2 (Core) Total number and rate of new employee hires and employee turnover by age group, gender and region.
LA3 (Additional) Benefits provided to full-time employees that are not provided to temporary or part- time employees, by significant locations of operation.
LA15 (Core) Return to work and retention rates after parental leave, by gender.
Aspect: Labor/Management Relations
LA4 (Core)Percentage of employees covered by collective bargaining agreements.
LA5 (Core) Minimum notice period(s) regarding operational changes, including whether it is specified in collective agreements.
Aspect: Occupational Health And Safety
LA6 (Additional) Percentage of total workforce represented in formal joint management–worker health and safety committees that help monitor and advise on occupational health and safety programs.
LA7 (Core) Rates of injury, occupational diseases, lost days and absenteeism and total number of work-related fatalities, by region and by gender.
LA8 (Core) Education, training, counseling, prevention and risk-control programs in place to assist workforce members, their families or community members regarding serious diseases.
LA9 (Additional) Health and safety topics covered in formal agreements with trade unions.

145
Aspect: Training And Education
LA10 (Core) Average hours of training per year per employee by gender and by employee category.
LA11 (Additional) Programs for skills management and lifelong learning that support the continued employability of employees and assist them in managing career endings.
LA12 (Additional) Percentage of employees receiving regular performance and career development reviews, by gender.
Aspect: Diversity And Equal Opportunity
LA13 (Core) Composition of governance bodies and breakdown of employees per employee category according to gender, age group, minority group membership and other indicators of diversity.
Aspect: Equal Remuneration For Women And Men
LA14 (Core) Ratio of basic salary and remuneration of women to men by employee category, by significant locations of operation
Human Rights Performance Indicators
Aspect: Investment And Procurement Practices
HR1 (Core) Percentage and total number of significant investment agreements and contracts that include clauses incorporating human rights concerns or that have undergone human rights screening.
HR2 (Core) Percentage of significant suppliers, contractors and other business partners that have undergone human rights screening and actions taken.
HR3 (Core) Total hours of employee training on policies and procedures concerning aspects of human rights that are relevant to operations, including the percentage of employees trained.
Aspect: Non-Discrimination
HR4 (Core) Total number of incidents of discrimination and corrective actions taken.

146
Aspect: Freedom Of Association And Collective Bargaining
HR5 (Core) Operations and significant suppliers identified in which the right to exercise freedom of association and collective bargaining may be violated or at significant risk and actions taken to support these rights.
Aspect: Child Labor
HR6 (Core) Operations and significant suppliers identified as having significant risk for incidents of child labor and measures taken to contribute to the effective abolition of child labor.
Aspect: Forced And Compulsory Labor
HR7 (Core) Operations and significant suppliers identified as having significant risk for incidents of forced or compulsory labor and measures to contribute to the elimination of all forms of forced or compulsory labor.
Aspect: Security Practices
HR8 (Additional) Percentage of security personnel trained in the organization’s policies or procedures concerning aspects of human rights that are relevant to operations.
Aspect: Indigenous Rights
HR9 (Additional) Total number of incidents of violations involving rights of indigenous people and actions taken.
Aspect: Assessment
HR10 (Core) Percentage and total number of operations that have been subject to human rights reviews and/or impact assessments.
Aspect: Remediation
HR11 (Core) Number of grievances related to human rights filed, addressed and resolved through formal grievance mechanisms.
Society Performance Indicators
Aspect: Local Communities
SO1 (Core) Percentage of operations with implemented local community engagement, impact assessments and development programs.
SO9 (Core) Operations with significant potential or actual negative impacts on local communities.

147
SO10 (Core) Prevention and mitigation measures implemented in operations with significant potential or actual negative impacts on local communities.
Aspect: Corruption
SO2 (Core) Percentage and total number of business units analyzed for risks related to corruption.
SO3 (Core) Percentage of employees trained in organization’s anti-corruption policies and procedures.
SO4 (Core) Actions taken in response to incidents of corruption.
Aspect: Public Policy
SO5 (Core) Public policy positions and participation in public policy development and lobbying.
SO6 (Additional) Total value of financial and in-kind contributions to political parties, politicians and related institutions by country.
Aspect: Anti-Competitive Behavior
SO7 (Additional) Total number of legal actions for anti- competitive behavior, anti-trust and monopoly practices and their outcomes.
Aspect: Compliance
SO8 (Core) Monetary value of significant fines and total number of non-monetary sanctions for non- compliance with laws and regulations.
Product Responsibility Performance Indicators
Aspect: Customer Health And Safety
PR1 (Core) Life cycle stages in which health and safety impacts of products and services are assessed for improvement and percentage of significant products and services categories subject to such procedures.
PR2 (Additional) Total number of incidents of non-compliance with regulations and voluntary codes concerning health and safety impacts of products and services during their life cycle, by type of outcomes.
Aspect: Product And Service Labeling
PR3 (Core) Type of product and service information required by procedures and percentage of significant products and services subject to such information requirements.

148
PR4 (Additional) Total number of incidents of non-compliance with regulations and voluntary codes concerning product and service information and labeling, by type of outcomes.
PR5 (Additional) Practices related to customer satisfaction, including results of surveys measuring customer satisfaction.
Aspect: Marketing Communications
PR6 (Core) Programs for adherence to laws, standards and voluntary codes related to marketing communications, including advertising, promotion and sponsorship.
PR7 (Additional) Total number of incidents of non-compliance with regulations and voluntary codes concerning marketing communications, including advertising, promotion and sponsorship by type of outcomes.
Aspect: Customer Privacy
PR8 (Additional) Total number of substantiated complaints regarding breaches of customer privacy and losses of customer data.
Aspect: Compliance
PR9 (Core) Monetary value of significant fines for non- compliance with laws and regulations concerning the provision and use of products and services.

149
APPENDIX B
Interview Questions
1. Please describe your role in determining your company’s strategy for disclosing
CSR activities.
2. Describe the manner in which your company’s strategy for disclosing CSR
activities is determined.
3. How long has your company disclosed its CSR activities?
4. How long have you used the GRI Guidelines to guide your CSR reporting?
5. Does your company choose to declare an application level?
6. If so, what GRI application level does your firm currently declare?
7. Has the GRI application level that your company declares changed during the last
two years? If so, please describe the change.
8. What factors influenced your company’s current choice of GRI application level?
9. Does your company currently employ third party assurance?
10. Has this changed during the last two years? If so, please describe the change.

150
APPENDIX C
Interview Transcripts
Interview Transcript - Company A
Company A, listed on the New York Stock Exchange, is a multi-national
automaker with its headquarters in the United States. The company sells automobiles and
commercial vehicles under separate brands and in the past, it has also produced heavy
trucks, tractors and automotive components. Today, the company employs more than
160,000 employees worldwide (Capital IQ, 2013).
This company was included in the executive interviews because of its long-
standing commitment to corporate social responsibility reporting. Company was one of
the first to focus on the environmental impact of its activities and have used this to
distinguish them from other automakers. The company was also an early adopter of the
GRI and has disclosed its activities using the reporting framework since 2000. (GRI,
2012)
1.) Please describe your role in determining your company’s strategy for disclosing CSR
activities.
The formal title of the executive who was interviewed is reporting manager.
Within the corporate structure, his department is referred to as Sustainability and Safety.
His specific role is to manage both the process of reporting and the structure of the
reporting efforts. Those who preceded him established the scope of his role. Today, he is
responsible for the firm’s mandatory 10K’s and its sustainability report.
Company A has produced 14 sustainability reports and it has used the GRI since
the third or fourth report. During the interview, the executive described the firm’s

151
sustainability journey, which has shaped the sustainability report and other types of
communications. The journey has been about more than just the horsepower of its
products. It is characterized by a change in the company’s perspective of the world and
its role in it. The journey has a definitive starting point and some easy to see milestones.
Because it is a continuous process, the journey does not have a definitive end.
The company recognizes it needs to be a responsible steward of its resources. It
sees the business impact of climate change. The company also recognizes that it was part
of the problem and now seeks to be part of the solution. Today, it is focused on the
benefits of smart water and power use. The company has also looked at how to harness
its philanthropic support. As an example, the company’s employees are using technology
from city centers to help ensure pregnant women in Chennai get the healthcare they need.
This demonstrates how the company is thinking about things that it did not think about
before.
2.) Describe the manner in which your company’s strategy for disclosing CSR activities
is determined.
The executive who was interviewed decides the application level for the
company’s report. The decision is somewhat dependent on guidance from the GRI. In
the past, there have been arguments about what constitutes materiality. It is beyond
GRI’s mandate to have companies prove why something is not material. The company
has previously reported at an application level as high as A+.
He suggested that the number of issues that are reported on is not really an
indicator of the report’s quality. The GRI helps provide a wonderful framework to help
guide reporting and helps make reports easier for stakeholders to read. If everyone

152
examined the GRI reports and the framework, then those that would report would be
forced to be more consistent.
The company’s annual objective is to report at an application level A with self-
assessment. Third party assurance is not a focus because it is tantamount to an audit. It
would cost at least as much to assure the report as it does to create it. Additionally, third
party assurance would be redundant because much of the data in the report contains
information that has to be reported to government agencies and has already been assured.
3.) How long has your company disclosed its CSR activities?
The CSR report that Company A issued in June will be the firm’s fourteenth. Its
first report was issued in 1999.
4.) How long have you used the GRI Guidelines to guide your CSR reporting?
The company has used the GRI standard since 2000 and it became an
organizational stakeholder in 2003.
5.) Does your company choose to declare an application level? Yes.
6.) If so, what GRI application level does your firm currently declare?
The firm declares an application level A.
7.) Has the GRI application level that your company declares changed during the last two
years? If so, please describe the change.
The company’s GRI application level has not changed. It last changed 4 years
ago in 2009.
8.) What factors influenced your company’s current choice of GRI application level?
Pride is one of the primary factors. GRI is the best standard and the others
compete rather than cooperate. The GRI is also part of the company’s sustainability

153
journey. CSR disclosures have become a good habit and the company likes the
reputational benefits that come with the good habit. The company is benchmarked by
other companies who are just beginning the sustainability journey.
The primary audience for the CSR report is the company’s employees. Corporate
leadership wants to help employees be educated ambassadors for the company. Investors
are also an important audience, but not the primary audience.
9.) Does your company currently employ third party assurance?
The firm does not employ third party assurance.
10.) Has this changed during the last two years? If so, please describe the change.
The company’s use of third party assurance has not changed in the last two years.
Interview Transcript - Company B
Company B, listed on the New York Stock Exchange, is a multi-national
pharmaceutical company with its headquarters in the United States. It ranks amongst the
top 15 globally based on its market capitalization (Genetic Engineering and
Biotechnology News, 2013). The company discovers, develops, manufactures, and sells
pharmaceutical products for both human and animal health. Today, the company
employs approximately 38,000 employees across the globe (Capital IQ, 2013).
This company was included in the executive interviews because of its intermittent
approach to disclosing its CSR activities. While Company B is well known for its
philanthropic activities, the company has exhibited an inconsistent approach to reporting.
As an example, the company first reported their CSR activities in 2003, but has often
skipped several years between reports. Prior to the firm’s 2011 report, the company’s last
disclosure took place in 2007 (GRI, 2012).

154
1.) Please describe your role in determining your company’s strategy for disclosing CSR
activities.
The executive works with key external advisors outside of Company B to
understand what other companies are doing and this helps influence Company B’s choice.
After the pros and cons are weighed, recommendations are made about the most
appropriate application level. Third party assurance has not been an option due to cost.
2.) Describe the manner in which your company’s strategy for disclosing CSR activities
is determined.
Company B’s reporting is driven by two major factors. The first is the
willingness of key corporate functions to disclose information. Some areas are not
willing at all. The second factor is the adequacy of staff and resources.
3.) How long has your company disclosed its CSR activities?
The company started disclosing its CSR activities in 2003 but it has not reported
continuously. It has reported on an annual basis since signing onto UN Global Compact.
Annual reports meet the criteria set out by both GRI and UN Global Compact. Every
other year it does a full report.
4.) How long have you used the GRI Guidelines to guide your CSR reporting? 2011
5.) Does your company choose to declare an application level? Yes.
6.) If so, what GRI application level does your firm currently declare?
The firm declares an application level B.
7.) Has the GRI application level that your company declares changed during the last two
years?
The company’s GRI application level has not changed.

155
8.) What factors influenced your company’s current choice of GRI application level?
The factors that influenced Company B’s current choice of GRI application level
are the cost of reporting and concerns over reporting data that could prove to be a
competitive disadvantage.
9.) Does your company currently employ third party assurance?
The firm does not employ third party assurance.
10.) Has this changed during the last two years? If so, please describe the change.
The company’s use of third party assurance has not changed in the last two years.
Interview Transcript - Company C
Company C, listed on the Swiss stock exchange, is a multi-national human
resource staffing firm with its headquarters in Switzerland. The company offers firm
provides staffing, placement, career and outsourcing services as well as consulting with
firms about its human resources needs. The company employees 33,000 employees in
over 60 countries around the world (Capital IQ, 2013).
This company was included in the executive interviews because it is focused on
services rather than tangible products. Company C did not begin to use the GRI reporting
framework to disclose its activities until 2008. Since that report was issued, the company
has consistently used the GRI framework (GRI, 2012).
1.) Please describe your role in determining your company’s strategy for disclosing CSR
activities.
The executive is part of a CSR Disclosure Steering Committee that determines the
focus of the report and the key performance indicators.

156
2.) Describe the manner in which your company’s strategy for disclosing CSR activities
is determined.
Company C relies on small group of countries to be part of a CSR Disclosure
Steering Committee. The CSR report is focused on 6 areas and the committee has
developed key performance indicators for each. For the first time, the board of directors
reviewed and approved the company’s CSR report.
The company’s approach to reporting has not always been strategic. In the past,
the information that each country would contribute to the report lacked uniformity. This
year the approach was more strategic. Representatives from each country were given a
questionnaire and asked to collect the required data from different parts of the
organization. The amount of information needed was large with 4,000 questions
requiring answers and it has plans to be more strategic in its future reporting.
3.) How long has your company disclosed its CSR activities?
Company C first disclosed its CSR activities in 2004.
4.) How long have you used the GRI Guidelines to guide your CSR reporting?
Company C has used the GRI Guidelines to guide its CSR reporting since 2008
although it did produce CSR Reports from 2004-2007.
5.) Does your company choose to declare an application level? Yes.
6.) If so, what GRI application level does your firm currently declare?
The firm declares an application level B.
7.) Has the GRI application level that your company declares changed during the last two
years?
The application level that the company declares has not changed during the last

157
two years.
8.) What factors influenced your company’s current choice of GRI application level?
The maturity of CSR within the company has been the primary factor that has
influenced the company’s current application level.
9.) Does your company currently employ third party assurance?
The firm does not employ third party assurance.
10.) Has this changed during the last two years? If so, please describe the change.
The company’s use of third party assurance has not changed in the last two years.
Interview Transcript - Company D
Company D, listed on the DAX, is a multi-national company with its headquarters
in Germany. The company develops, produces, and markets health care and agriculture
products, and high-tech materials worldwide. Today, the company employs
approximately 113,000 employees across the globe (Capital IQ, 2013).
This company was included in the executive interviews because of its broad
business mix and its long-standing approach to CSR reporting. Company D has
consistently used the GRI framework to guide its reporting and has reported at the highest
possible level. The firm has reported at an A+ level since 2008 (GRI, 2012).
1.) Please describe your role in determining your company’s strategy for disclosing CSR
activities.
Company D looks at CSR more holistically and as such refers to its efforts as
sustainability rather than merely CSR. There are people throughout the organization who
are responsible for sustainability and this includes a member of the board of directors as
well as representatives from each division -material science, healthcare and crop science.

158
There is a clear commitment to follow with up on sustainability activities throughout the
company.
Decisions about the firm’s sustainability strategy are made by a sustainability
committee. Three to four times per year representatives from the business units sit
together to talk about activities and strategies. On an annual basis, it discloses activities in
the report. From next year onward, it will be incorporated into the annual report. It will
play an important role in that report. It is important that it be integrated part of its
reporting.
2.) Describe the manner in which your company’s strategy for disclosing CSR activities
is determined.
Each division is asked to develop an individual strategy. Under this motto, it is
the company’s aim to help provide broad access to innovative products in healthcare with
a focus on less well-resourced countries. The commercial focuses on how in the country
availability will be provided. For instance, it has put a program in place for family
planning methods focused on women and girls where it is working with international
partners like the United Nations Population Fund. It is also focusing on tropical and
neglected diseases and looking at how can it broaden its product portfolio to focus on
these under-served areas.
From innovation to areas of pure CSR, each division takes responsibility for its
planning. In order to avoid overlap, the sustainability committee discusses these plans
and the headquarters function is also included.
3.) How long has your company disclosed its CSR activities?

159
It has disclosed its CSR activities since 2001 in a stand-alone report. Next year’s
report will be included as part of the Annual Report rather than as a stand-alone.
4.) How long have you used the GRI Guidelines to guide your CSR reporting?
It has orientated its report on the GRI guidelines since 2001 and reported
according to GRI Guidelines since 2005.
5.) Does your company choose to declare an application level? Yes
6.) If so, what GRI application level does your firm currently declare?
It declared an A+, which has been the declared level since 2008.
7.) Has the GRI application level that your company declares changed during the last
two years?
The application level that the company declares has not changed during the last
two years.
8.) What factors influenced your company’s current choice of GRI application level?
Company D wants to be perceived as a company that is transparent. The latest
report will includes key performance indicators and it reports what it plans to achieve and
what it has achieved. It provides information on all issues which the company and its
stakeholders consider to be relevant for sustainability.
9.) Does your company currently employ third party assurance?
The firm does not employ third party assurance.
10.) Has this changed during the last two years?
The company’s use of third party assurance has not changed in the last two years.
Price Waterhouse Coopers has reviewed all content included in Company D’s
sustainability report. The reason for integrating the sustainability report into the annual

160
report is the growing relevance of non-financial key performance indicators for the
evaluation and assessment of companies. It is also a general trend.
Interview Transcript - Company E
Company E, listed on the NYSE, is a multi-national company with its
headquarters in the United States. The company develops, produces, and markets
consumer packaged goods through its three business units. One of the business units is
focused on the national market for consumer products while another is focused
internationally. The remaining business unit is focused on specialty products. Today, the
company and its subsidiaries employ approximately 4,300 employees across the globe
(Capital IQ, 2013).
This company was included in the executive interviews because of its consumer
focus and its limited experience with CSR reporting. Company E has only reported since
2007 and only employed the GRI framework in its 2011 report (GRI, 2012).
1.) Please describe your role in determining your company’s strategy for disclosing CSR
activities.
The executive who was interviewed is responsible for monitoring indictors and
key forces within the industry. Additionally, topics of interest to customers,
shareholders, NGO’s and government are also monitored. The composite findings are
then shared with the Executive-VP level staff that is responsible for research and
development, human resources, operations, legal and marketing. The findings are also
shared with the CEO who writes introductory comments for the reports.
2.) Describe the manner in which your company’s strategy for disclosing CSR activities is
determined.

161
The company does not seek to be a leader in CSR reporting. Instead, the
company’s strategy is to be actively prepared for issues that can be predicted. For those
that cannot be predicted, the company responds reactively on a case-by-case basis.
Executive-VP level staffs that are responsible for research and development,
human resources, operations, legal and marketing are briefed about indictors and key
industry issues. They are also briefed on key topics of interest to customers, shareholders,
non-governmental organizations and government. The risk level associated with each of
these is determined and this informs leadership’s final determination as to what will be
reported.
If government proposes rules, information is shared with management and a plan
of action is suggested. If a non-governmental organization makes a request, the company
weighs the public relations risks. Shareholders also receive rapid attention. For example,
a financial firm in Canada asked the company in 2007 to issue a sustainability report.
After quickly doing a gap analysis, the info was gathered and a report was started.
Of all its stakeholders, however, alignment with customers and consumers is
considered most critical. The company sells its retail products directly to customers like
groceries and other retailers who then sell them to consumers. It also sells large scale and
bulk products to industrial customers. Because customers are interested in green
disclosures, the company has responded by posting the ingredients to its products.
3.) How long has your company disclosed its CSR activities?
The company first disclosed its CSR activities in 2007 when it issued its first
report. Prior to 2007, the firm shared information about CSR activities in both its 10K
report and its annual report.

162
4.) How long have you used the GRI Guidelines to guide your CSR reporting?
The company has used the GRI standard since 2007.
5.) Does your company choose to declare an application level? Yes.
6.) If so, what GRI application level does your firm currently declare?
The firm declares an application level C.
7.) Has the GRI application level that your company declares changed during the last two
years?
The firm’s application has not changed during the last two years. The firm is
adept at this reporting level.
8.) What factors influenced your company’s current choice of GRI application level?
The company’s current choice of GRI application level is driven by the number of
indicators on which it reports. The company reports on those items required for the C
level plus eight to nine additional items for a total of twenty. While the number of items
is equivalent to that required for a B level, the items on which it reports on are not the
same as those required for the B.
The company’s CSR program is young. In determining its disclosure strategy, the
type of company and its universe of stakeholders must be considered. Those responsible
for the strategy believe it is more important to be consistent in what the firm reports
instead of reporting at the highest level over night. In the future, the firm may choose to
elevate its application level to a level B.
Company E has a long heritage of environmental concern but has yet to sign on to
either the UN Global Compact or the Carbon Disclosure Project. Signing on to either of
these would put too much pressure on the company to move faster in its reporting than it

163
wants to go. Signing on may also cause redundancy. The company already reports green
house gases and it wants to control its own programs rather than ceding control to
someone else.
9.) Does your company currently employ third party assurance?
The firm does not employ third party assurance.
10.) Has this changed during the last two years? If so, please describe the change.
The company’s use of third party assurance has not changed in the last two years.
It does use 3rd party auditors for other programs. Responsible Care is an audit of what the
specialty products division goes through every year.