understanding the determinants of firm growth in …
TRANSCRIPT
UNDERSTANDING THE DETERMINANTS OF FIRM GROWTH
IN YOUNG REITs
Radheshyam C Gopinath
Department of Real Estate
School of Design and Environment
National University of Singapore
4 Architecture Drive
Singapore 117566
June 2012

2
UNDERSTANDING THE DETERMINANTS OF FIRM GROWTH
IN YOUNG REITs
Abstract
The main objective of this study is to investigate the determinants of firm growth in
young REITs with the view that REITs with its unique operating conditions may have
different implications for new venture growth. This study aims to (a) document growth
characteristics of REITs, (b) empirically examine different growth determinants of
REITs, (c) explore different growth strategies adopted by REITs, and (d) investigate the
dual relationship between growth and profitability in REITs. We use GMM-system
estimator to test a dynamic panel data model of firm growth that incorporates different
influencers of growth in REITs. Using data on 148 US equity REITs that had its IPO
during the period 1993-2005, we find that REIT growth is inversely proportional to REIT
size, age and leverage and directly related to cash flow and insider ownership. We also
find positive persistency in growth rates in young REITs. But, sustained growth among
REITs beyond five years is rare. Also, new REITs that experience high growth in its
early years are more likely to survive longer and REITs failure rate declines with size
and age. Finally, we find a small positive influence of profit rates on subsequent growth
and a positive and significant influence of growth on profits.
Keywords: REITs, Firm Growth Determinants, Growth strategy, Growth and profitability

3
1. Introduction
Real Estate Investment Trusts (REITs) have come a long way from 1960s when
it was created in the United States to be passive investment vehicles for real estate.
Over the past two decades REITs have grown phenomenally in size and importance
and have started functioning as growth oriented real estate operating companies.1 This
unprecedented growth, to a large extent, can be attributed to a host of positive
regulatory changes that the REIT structure has undergone after the Tax Reform Act
(TRA) in 1986. The “new-REIT” era, as it is called post 1992, has witnessed a plethora
of Initial Public Offerings (IPOs) and with it the formation of many new high growth
ventures in the REIT sector.2 The primary objective of many of these young REITs has
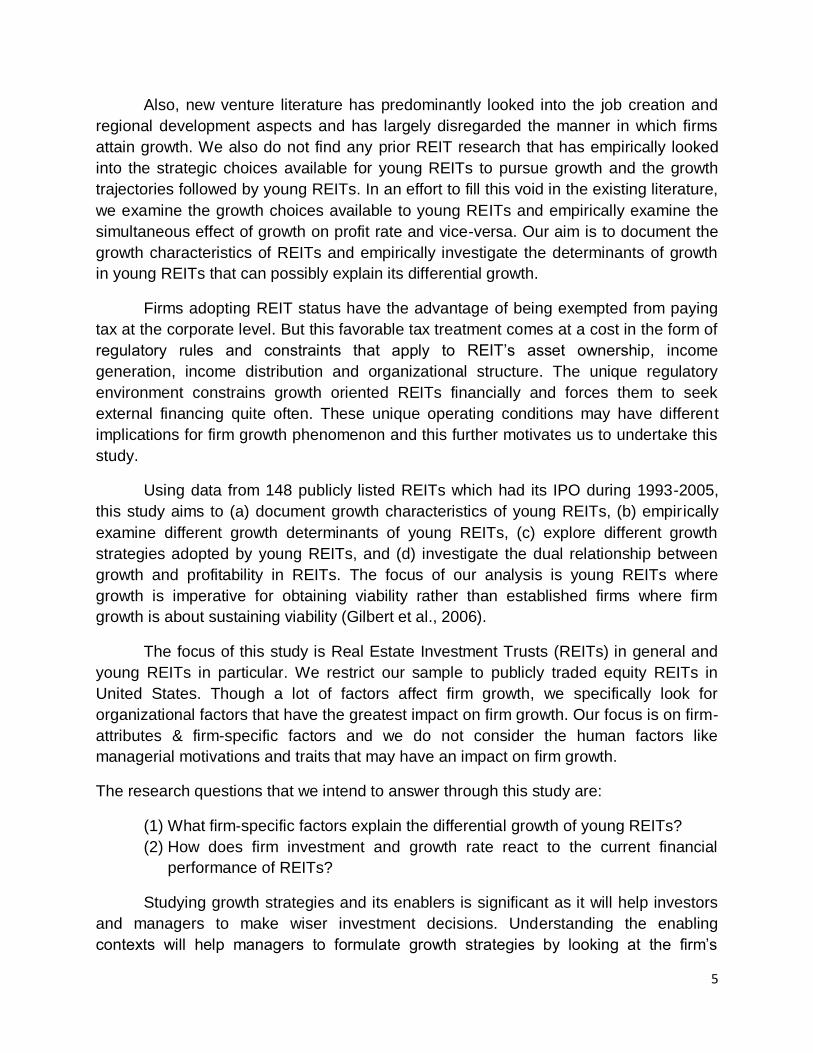
been to grow aggressively in the initial years of its inception. This is evident from the
high asset growth rates of REITs (Figure 1.1) during its nascent years. There can be
diverse reasons for the growth motivations of REITs in its formative years like achieving
economies of scale earlier (to attain critical size and spread fixed costs) and gaining
competitive edge in the market in a shorter time. On the positive side, bigger REIT size
encourages institutional ownership and analyst tracking, improves stock liquidity and
helps in attracting and retaining top quality employees. But, on the flip side, unbridled
growth can also be the result of empire building motives of unethical mangers whose
remuneration is often tied to the assets under management and who want to thwart any
takeover attempt by growing bigger in size.
Figure 1.1: Average asset growth rates with age
This figure depicts the decreasing rate of asset growth over the years since firm listing. Total assets data is obtained from SNL Financials for REITs that had its IPO from 1993 onwards.
1 REITs’ phenomenal growth in the US is evidenced by the change in its average size of total assets from a mere
$193 million in the beginning of 1993 to $3.95 billion by the end of 2010. 2 According to NAREIT statistics, 90 REITs were incorporated in the years 1993 and 1994 combined. Other waves
of REIT IPOs were seen in 1997-98 with 42 new issuances and in 2003-05 with 29 new equity issuances.
0
10
20
30
40
50
60
1 2 3 4 5 6 7 8 9 10
An
nu
al g
row
th r
ate
in %
Years since firm IPO

4
Whatever be the growth motivation of a young firm, growth in its nascent years is
a vital indicator of its survival. Since, new ventures are subject to “liability of newness3
and smallness”, their survival may be significantly reduced in the absence of growth
(Buederal et al, 1992). This is supported by the fact that out of the 90 new REITs that
had its IPO in 1993 and 1994 combined, 70 (78%) survived by the end of five years and
only 35 (39%) survived after 15 years.4 Looking at the same cohort, REITs that did not
survive the first five years had a three year compound annual growth rate (CAGR) in
total assets of 34.45%. The three year CAGR for firms that survived more than 5 years
but less than 10 years was 38.88% and for the firms that survived more than 10 years
was 42.64%. We find that surviving REITs show a higher compound annual asset
growth rate during the early years compared to those that did not survive. Hence, higher
growth rate for REITs during the initial years of its birth is crucial for its survival. Hence,
we focus our study on the REIT sector, in which young firms face similar investment
opportunities and financial constraints, and examine the various predictors of new
venture growth. Since, young REITs exhibit a higher asset growth variance (82%)
compared to established REITs (38%), we also look at the various determinants of
growth in new REITs to address the question of differential growth, i.e., why some new
REITs grow more than the others.
Growth, in general, can be defined as the change in size or magnitude from one
period of time to another. For a firm, it is an increase in certain attributes such as sales,
employment or profit between two points in time and is an important determinant of
firms‟ performance. Firm growth has been addressed both theoretically and empirically
in various disciplines including economics, psychology, entrepreneurship and strategy.
The focus of the past firm growth studies has predominantly been the manufacturing
industry with a limited number of studies undertaken in the service sector. Despite the
large number of studies, little work has been done to examine the growth factors and
growth strategies in REITs.5 Most of the REIT‟s literature, that has some implication for
growth, has focused on the size of the firm and the issue of economies of scales by
consolidation. It is difficult to make comparisons with earlier firm growth literature as
idiosyncrasy in the growth rates and the heterogeneity of firms has made it difficult to
generalize across the growth experiences of the firm (Coad, 2009). Audretsch et al.
(2004) concluded from their study of the Dutch hospitality industry that the growth
dynamics of manufacturing industry may not be applicable to the service industry.
Hence, we look at industry specific growth determinants in the REIT sector to
understand the growth dynamics of REITs.
3 The term “liability of newness” was termed by Stinchcombe (1965) to indicate the phenomenon of limited probability of performance (or survival) related to new firms. 4 A firm is defined as new for the first five years of its existence. This is in line with the OECD definition of new
firms for small and medium-sized enterprises. 5 An et al (2011) is the only study we found in the REIT literature that examines the relationship between corporate
transparency and firm growth in REITs.
5
Also, new venture literature has predominantly looked into the job creation and
regional development aspects and has largely disregarded the manner in which firms
attain growth. We also do not find any prior REIT research that has empirically looked
into the strategic choices available for young REITs to pursue growth and the growth
trajectories followed by young REITs. In an effort to fill this void in the existing literature,
we examine the growth choices available to young REITs and empirically examine the
simultaneous effect of growth on profit rate and vice-versa. Our aim is to document the
growth characteristics of REITs and empirically investigate the determinants of growth
in young REITs that can possibly explain its differential growth.
Firms adopting REIT status have the advantage of being exempted from paying
tax at the corporate level. But this favorable tax treatment comes at a cost in the form of
regulatory rules and constraints that apply to REIT‟s asset ownership, income
generation, income distribution and organizational structure. The unique regulatory
environment constrains growth oriented REITs financially and forces them to seek
external financing quite often. These unique operating conditions may have different
implications for firm growth phenomenon and this further motivates us to undertake this
study.
Using data from 148 publicly listed REITs which had its IPO during 1993-2005,
this study aims to (a) document growth characteristics of young REITs, (b) empirically
examine different growth determinants of young REITs, (c) explore different growth
strategies adopted by young REITs, and (d) investigate the dual relationship between
growth and profitability in REITs. The focus of our analysis is young REITs where
growth is imperative for obtaining viability rather than established firms where firm
growth is about sustaining viability (Gilbert et al., 2006).
The focus of this study is Real Estate Investment Trusts (REITs) in general and
young REITs in particular. We restrict our sample to publicly traded equity REITs in
United States. Though a lot of factors affect firm growth, we specifically look for
organizational factors that have the greatest impact on firm growth. Our focus is on firm-
attributes & firm-specific factors and we do not consider the human factors like
managerial motivations and traits that may have an impact on firm growth.
The research questions that we intend to answer through this study are:
(1) What firm-specific factors explain the differential growth of young REITs?
(2) How does firm investment and growth rate react to the current financial
performance of REITs?
Studying growth strategies and its enablers is significant as it will help investors
and managers to make wiser investment decisions. Understanding the enabling
contexts will help managers to formulate growth strategies by looking at the firm‟s
6
internal resources and the constraints that the firm has to overcome. It would also help
REIT managers to make accurate growth projections to assess the need of external
capital due to capital constraints faced by REITs.6 Investors can also get insights from
this study in terms of selecting and investing in REITs that show prudent growth
strategies in tune with the demographic affiliations of the firm. This analysis will bring
some light in the area of firm growth in REITs and help to fulfill the gaps by providing
empirical evidence that contributes to a broader understanding of factors affecting
growth of REITs. This understanding will also help REIT managers to anticipate
potential problems that the firms can face by adopting a particular growth strategy and
help them overcome these problems to preserve the firm performance. The analysis will
also help academicians understand the reasons new REITs fail based on firm
characteristics and the method adopted by REITs to grow.
The rest of the paper is organized as follows. In section 2 we review the literature
on firm growth and examine the theories on firm growth. We also examine various
determinants and strategies of firm growth and develop the testable hypotheses for the
study. In section 3 we describe the data and estimation methods for the empirical
analysis. In section 4 we present the main empirical results & discuss the results.
Finally, we conclude the paper in section 5 with some suggestions for future research.
2. Literature review and Research Hypotheses
2.1 Theories on firm growth
Over the years various researchers have postulated different theories of firm
growth. These theoretical perspectives can be broadly divided into four groups: (1)
classical models; (2) stochastic models; (3) resource based models; and (4) models of
learning. According to the neo-classical theory, all the firms within an industry are
pushed - by the existence of a U-shaped long-run average cost curve and by the goal of
maximizing profit – to expand their size until they reach the scale corresponding to the
feasible cost (Geroski, 1999). The process of growth is exhausted as far as the process
of optimization is completed, as there is no incentive to grow beyond the optimum size
(Hart, 2000). However, this is made under the assumption that firm operates in a
homogenous product market and can easily expand or contract to arrive at the optimal
output level. In reality, the empirical evidence gives a different story about firm growth
which is beyond the profit maximizing mechanism. Thus, the main criticism of the
classical economist‟s school of thought is that it cannot explain the presence of firms
whose size is larger than the optimum size and how the process of firm growth actually
evolves over time.
6 The capital scarcity in REITs results due to the mandatory disbursement of 90% (95% before year 2000) of its
taxable income as dividends to investors.

7
One of the earliest explanations of firm growth behavior was given by Gibrat
(1931) as the stochastic model of firm growth. In his “law of Proportional effect”, Gibrat
laid out the principle that growth of firms is a random process and the expected increase
in firm size is proportional to the current size of the firm. While there may be a large
number of systematic factors affecting growth, collectively they exercise only a limited
influence on firms' proportionate growth (Hay and Morris, 1979). Gibrat‟s law has been
tested by many researchers with differing results. Some studies support Gibrat‟s law in
totality (Hart and Prais, 1956; Hart, 1962) and some support a part of the law (Hymer
and Pashigan, 1962) about firm growth being independent of firm size. Later studies
have found that there is a negative relationship between size and growth of a firm
(Kumar, 1985; Evans, 1987). Several studies have also shown that smaller and
younger firms grow at a higher rate than the larger and mature firms (Hart, 2000;
Glancey, 1998).
Penrose (1959), moved away from the traditional emphasis on the size of the
firm to a resource based view of firm growth. The resource based view considers the
firm as a collection of resources and the focus is on the activities it can perform with
those resources. Penrose (1959) analyzed the process of growth in terms of the speed
with which firms could accumulate and assimilate such resources, and the opportunities
for further growth which arise when firms‟ internal resources are under used. Thus,
firms‟ resource characteristics were considered to lead to heterogeneity in the firm‟s
performance. Some behavior economists (Baumol, 1959; Chandler, 1962; Marris, 1964)
consider that the differences in firm size (and hence firm growth) are due to the division
between the objectives of control and ownership structures. When ownership is
separate from firm control, the managers, who control the firm, tend to enhance the firm
size to maximize their satisfaction instead of firm value. Thus, these theories suggest
that there are different types of firm behaviors which lead to different levels of
performance and growth.
More recently, models of learning and selection have appeared in the existing
literature. This approach takes into account the dynamics of the firms and their level of
efficiency. Thus, firm growth and survival depends on firm‟s capacity to learn and adapt
its strategies to the changing environment (Geroski, 1995). A model of the evolution of
industry was proposed by Jovanovic (1982) by subjecting each firm‟s cost curve to
randomly distributed, firm specific shocks. He concluded that over time a firm learns
about the effects of these shocks on its efficiency. Firms experiencing favorable shocks
grow and survive. Others do not grow and may decline and even leave the industry. His
model also results in small firms having higher, but more variable growth rates and
higher failure rates than large firms. Chandler (1992) emphasized on the management
of the resources in terms of organizational capabilities to explain the beginnings and
growth of modern industrial enterprises. The literature on organizational capabilities and

8
core competencies are better able to explain the heterogeneities between firms and
offers a plausible, history dependent story of organizational growth and development
(Geroski, 1999).
There have been attempts to develop stage theories of firm growth that outline
the changes in the optimum size over the life of firms. Greiner (1972) argued that firms
evolve through five phases: creativity, direction, delegation, co-ordination and
collaboration. Mueller (1972) argued that a strictly profit maximizing firm is likely to enjoy
only a finite burst of growth associated with each innovation. Though the stage theories
of firm growth are a useful aid for conceptualization, they still fail to explain why different
firms enjoy different growth rates in each stage.
The complexity and the uncertainty surrounding the phenomenon of firm growth
have led to the emergence of various theories predicting the evolution of firm. However,
no single theory can give a complete picture of the impact and evolution of firm growth
phenomenon. In the absence of a complete theory of firm growth dynamics, an
empirical approach is recommended to seek the stylized facts (Coad, 2009).
2.2 Determinants of firm growth
Various determinants of growth have been put forward by researchers depending
on the discipline of study. Researchers from psychology have focused on the behavior
of the entrepreneur, whereas those from the economics discipline have focused on the
relation between growth and firm size. Firm growth is dependent on the path taken by
the organization and is an organizational outcome resulting from the combinations of
firm specific resources, capabilities and routines (Coad, 2009). Firm growth also
depends on the prevailing macro-economic conditions and on the degree of
concentration or competition in the industry. Zhou and Wit (2009) have studied the
determinants of firm growth in an integrated way and classified the determinants into
three dimensions: individual, organizational and environmental determinants.
Individual determinants depend on the personality traits, growth motivation,
individual competencies and personal background of the entrepreneur. Zhou and Wit ‟s
(2009) study finds growth motivation, specific skills and need for achievement to be the
most important individual determinants of firm growth. Even though the general
economic conditions are favorable and firm may be able to exploit the growth in the
market with the use of its resource capabilities, manager‟s ability and managerial
ambition plays a reinforcing effect on the firm growth. Several research studies have
shown that entrepreneur‟s willingness to grow their firms (growth orientation) affects the
performance and realized growth of the firm (Wiklund, 1998; Zahra, 1991). Motivated
managers are able to effectively utilize the resources and select appropriate strategies
to improve growth. This is especially true for a small firm where motivation and the

9
ability related factors of the entrepreneur play an important factor in the success of the
firm. In empirical studies, growth motivation of managers is observed to have a positive
effect on growth (Delmar & Wiklund, 2008).
The environmental determinants like dynamism, hostility and heterogeneity
determine the growth potential of the firms. To some extent growth is externally
determined by the environment in which it operates. Various studies have
acknowledged the effect of these determinants but don‟t consider it to be the most
influential in determining firm growth. Though, growth to a considerable extent is a
matter of willingness and skill, but the fundamental facilitators and obstacles in the
environment cannot be disregarded (Davidsson et al, 2005). Beaudry and Swann
(2009) in their analysis of the influence of strength of industry cluster have shown that
for some industries there is a positive association in the firm growth and own sector
employment.
Organizational determinants are found to have the greatest influence on firm
growth. These determinants have been discussed in the existing literature in the form of
firm attributes, firm specific resources, firm strategies and organizational structure. The
most studied firm attribute is age and size. Age of the firm has a negative relation with
the growth of the firm and this has been empirically supported by many studies (Evans,
1987; Dunne and Hughes, 1994; Glancey, 1998; Yasuda, 2005). Gibrat´s law has been
a much revisited benchmark for research on the determinants of firm growth since its
formulation in 1931 (Sutton, 1997). According to the Gibrat‟s law of proportionate effect,
firm growth is independent of firm size at the beginning of the period. Early studies have
found no relationship between rate of growth and size of the firm (Hart, 1962; Hymer
and Pashigan, 1962). But most of the later studies have found a negative relation
between firm size and growth contrary to Gibrat‟s law (Kumar, 1985; Hall, 1987; Dunne
and Hughes, 1994; Almus and Nerlinger, 2000; Bottazzi and Secchi, 2003). Though,
empirical literature on the relationship between firm size and growth has for the most
part rejected the stochastic model, some have found weak evidence to support Gibrat‟s
law for larger firms (Mansfield, 1962; Evans, 1987). It has also been empirically
supported that firm‟s survivability rises with size and age (Jovanovic 1982; Evans 1987;
Yasuda 2005).
Based on the firm specific resources, financial resources and human capital are
the most important resources for small business growth (Wiklund et al., 2009). With
access to sufficient financial resources, firms are able to pursue growth opportunities.
Human capital represents knowledge, skills and experience. This is especially crucial
for small firms in rapidly changing industry as they have constraints in available
resources and depend on innovation for future growth. Firm strategies include firm‟s
orientation to the market needs and the firm‟s response to the customer preferences.
Firm‟s strategy is basically dependent on the entrepreneurial orientation of the top

10
management and its behavior towards being proactive and competitive in the market.
Empirical evidence shows that entrepreneurial orientation is positively related to growth
(Wiklund, 1998). R&D spending also has a significant impact on firm growth (Griliches
and Klette, 2000; Del Monte & Papagni, 2003; Yasuda, 2005). Organizational structure,
which is related to the distribution of work and the mechanism of co-ordination like
centralization and formalization, has shown to have mixed effects on firm growth.
Organizational dynamism like the strategic decision making, R&D expenditure and
scalability (preparedness to grow) has a positive effect on firm growth.
Factors that inhibit or hinder growth include the institutional barriers and the
financial barriers. Institutional barriers include government policies, legal structure and
taxation related issues. Smaller firms face higher obstacles due to institutional policies.
Financial barriers represent access to financial resources. Access to financial resources
depends on the rate of development of a country‟s financial sector. As financial
development reduces the cost of external financing to financially dependent firms, it has
a substantial supportive influence on the rate of firm growth (Rajan and Zingales, 1998).
Again larger firms are less constrained for finance as compared to smaller firms
(Ayyagari et al, 2008). Other inhibitors include inefficient functioning of financial
markets, inadequate security and enforcement of property rights, poor provision of
infrastructure, inefficient regulation and taxation, and broader governance features such
as corruption (Ayyagari et al., 2008).
Managerial abilities can sometimes constitute the limiting factor for firm growth
(Penrose, 1959). As the firm grows and matures, there is a tendency of managers to
pursue growth rather than stockholder‟s welfare. Managers like to grow in sales or total
assets at the expense of profitability, especially when their remuneration, perquisites
and power are linked to firm size measured by sales. Managers attempt to maximize
growth to achieve non-pecuniary rewards like status and power and in order to build
their own empires. Growing bigger not only gives the managers a sense of achievement
but it is also a mechanism to prevent any hostile takeovers and subsequently their job
loss in the future.
2.3 Growth determinants of REITs
Building on past studies, we evaluate the firm growth determinants in REITs
using the growth determinants established in non-REITs. We also include some REIT-
specific variables that are unique and compelling predictors of REITs‟ growth.
a) Firm size and age: Firm size and age are the most widely studied factors of
firm growth. Age of the firm has an inverse relation with growth of the firm and
this has been empirically supported by many studies (Evans 1987; Dunne
and Hughes, 1994; Glancey 1998; Yasuda 2005). We expect the same

11
negative relationship to hold for REITs, i.e., younger REITs grow more rapidly
than older REITs. Majority of the recent empirical literature on the relationship
between firm size and growth has for the most part rejected Gibrat‟s
stochastic model. We also expect to find a negative growth-size relationship
as newly formed REITs are small and need to grow rapidly to achieve the
minimum efficient size (Almus and Nerlinger, 1999; Audretsch et al., 2004).
b) REIT Structure: Umbrella Partnership REITs (UPREIT) enables existing
property owners to contribute properties to REITs, on a tax-deferred basis, in
exchange for Operating Partnership (OP) units. The UPREIT structure has
the tax advantage as compared to traditional structure as they pay lower
prices to acquire properties. Also, the OP unit holders have an incentive to
actively monitor firm action. At the same time, OP unit holders may face the
conflict of interest when it comes to sale of properties contributed by them as
this may trigger a large capital gains tax for them (Han, 2006). Thus,
UPREITs may have less flexibility in disposing less desired properties,
depending on the voting rights of the OP unit holders, and may be
constrained to grow. But at the same time, REITs that follow the UPREIT
structure engage in tax advantaged acquisitions that helps in increasing its
growth. We expect a positive effect of the UPREIT status based on the tax
advantage it offers.
c) Institutional Ownership: Being active long-term stockholders, Institutional
investors are expected to better monitor and evaluate REITs‟ management
decisions than outside investors. Positive monitoring effect may help in firm
growth decisions by management rather than managerial entrenchment. In
spite of the intuition that Institutional investors should have a positive effect on
functioning of REITs, Friday et al. (1999) find no support for monitoring
benefits by outside block-holders for REITs. Also, Ghosh and Sirmans (2003)
find that institutional ownership fails to serve as an alternate disciplining
mechanism, although their presence seems to enhance performance. Greater
institutional participation may mean better growth prospects, though the same
cannot be ascertained about better monitoring benefits. We expect a positive
effect on growth even though institutional investors usually invest in large cap
REITs.
d) Insider Ownership: Higher proportion of insider ownership by the managers
means better alignment of monetary incentives between managers and other
shareholders (Jensen and Meckling, 1976). However, higher insider
ownership also means increased managerial consumption of perquisites and
tendency of managers to build their own empires. Though the research in this
area has provided mixed results, most of the studies have found a significant

12
non-linear relationship between firm performance and insider ownership
(Morck et al. 1988; McConnell and Servaes, 1990). Han (2006) takes into
consideration the dual ownership structure of common shares and operating
partnership units in REITs and finds a similar significant and robust non-linear
relation between REIT insider ownership and performance. We would also
expect a positive effect on growth at lower levels of insider ownership and a
probable change in effect at higher levels.
e) Geographic Focus: Some locations are more conducive to firm growth
(Storey, 1994). REITs having properties in regions where there is large
market demand are likely to experience high growth than REITs owning and
managing properties elsewhere. Though Almus and Nerlinger (1999) contend
that location is probably of secondary importance as it is closely associated
with industry clustering, Davidsson (1989) argues that characteristics of the
geographical area are important for industries where firms are bound to the
local market. In case of REITs, Ambrose et al. (2000) have argued that
geographic concentration does not translate to higher income growth rates.
But, we would like to test whether geographic focus as an additional factor
contributes to REITs asset growth.
f) Management Structure (Self-managed): Most of the present day REITs are
self-managed, which means that the management of REITs properties is
done by its employees. Thus, self-managed REITs have a better control and
supervision on its activities and that may help in the growth of the REITs.
Most of the times Self-advised and Self-managed go hand in hand, but we
still find some REITs that are self-advised and not self-managed. These
REITs that are self-advised but not self-managed are prominently found in the
hotel and retail sector. We expect the self-management of REITs to have a
positive effect on growth.
g) Management Style (Self-advised): Most of the REITs in the nineties changed
its management style to self-advise with the passage of the Tax Reform Act
(TRA) of 1986 that allowed REITs to have internal advisement. It is argued
that since internal advisors have an ownership stake in REIT they advise,
their interests are more closely aligned with the other stakeholders of the firm.
On the other hand, agency issues are a concern in the case of externally
advised REITs. This has been documented in terms of their
underperformance, to their internally-advised counterparts, based on stock
returns and Tobin‟s Q (Cannon and Vogt, 1995; Capozza and Seguin, 2000).
Thus, internally-advised have a superior ability to raise capital at better terms
than externally-advised REITs that are more financially constrained due to
weaker capital market access (Ambrose and Linneman, 2001). Hence, we
13
expect internally advised REITs, with better access to funds, to grow more
than the externally advised REITs.
h) Liquidity/ Cash-flow: Financial means to grow can be accessed through
various sources like retained earnings, short and long term borrowings and
issuance of new shares. For REITs, finance is always a hurdle as they have
to disburse 90% of its taxable income as dividends and have to look for
external sources.7 But REITs still hold 1.57% of its total assets in cash and its
cash holdings are directly related to cost of finance and growth opportunities
(Hardin et al. 2009). However, Ott et al. (2005) argue that internally generated
capital would be insufficient to fund an aggressive growth strategy and REITs
have to necessarily go to external sources for finance. Hence REITs are
better off by disbursing cash and reducing the agency cost associated with
free cash flow. We still expect a positive relationship with cash-flow as more
of it would require REITs to procure a lesser amount from the external
providers of finance.
i) Property Type: Different property sectors grow at different rates and hence
the variation in growth rates can be attributed to the specific nature of the
property sector in which the REIT operates. More prominent property types
like retail, office and residential are expected to show better growth dynamics.
j) Financing choice: REITs need for capital and its unique regulatory
environment makes them seek external sources of financing very frequently.
Since REITs don‟t pay corporate taxes, they have no incentive to issue debt.
Also, since REITs can‟t retain most of its earning, debt as a medium to
mitigate information asymmetries has no apparent benefit. But still they tend
to have persistently high leverage ratio of more than 50 percent (Capozza
and Seguin, 2001; Feng et al. 2007). According to Lang et al. (1996), there is
a negative relationship between leverage and future growth at firm level for
firms with low Tobin‟s q-ratio. But, they also find that leverage does not
reduce growth for firms known to have good investment opportunities. This
argument is supported for REITs by Feng et al. (2007) who find that REITs
with high growth opportunities and high market valuation raise funds through
debt. In a more recent paper Huynh and Petrunia (2010) consider the role of
financial variables in the growth of new firms in the Canadian manufacturing
industry. They find that controlling for age and size, leverage has a positive
effect on growth of new firms. The issuance of debt by REITs is also
consistent with Pecking order theory which states that mangers prefer to fund 7 Though Hardin et al. (2009) assert that this restriction understates REITs actual ability to accumulate cash since the
mandatory dividend is calculated as a portion of taxable income that is calculated after depreciation which is a non
cash expense.

14
investment with retained earning first, then debt and equity as the last resort.
For REITs that have high asset growth, we expect a negative relationship with
leverage.
Other factors that may affect firm growth include market competition,
organizational form, capital market access and finite life of REIT. REITs facing less
competition may grow faster, REITs that have the backing of a bigger establishment
may have better access to resources to grow, REITs having better and easier access to
financing have better prospects of growth and REITs having infinite life REITs can grow
indefinitely.
2.4 Strategies of firm growths
Firm growth is not static in nature. Firms grow in many different ways and the
patterns of growth can vary significantly and have different causes (Delmar et al., 2003).
Research on firm growth has identified three major strategic choices for firm growth,
viz., undertaking internal expansion, conducting Mergers & Acquisitions and developing
trust based network relationships (Peng and Heath, 1996). A firm can grow by
expansion of the current activities which is referred as “organic growth”. Firms can also
grow by acquiring existing firms. Trust based relationships are based on interpersonal
relationships to form networks and alliances. Different types of growth have different
implications for the firm managers and also have different impact on the firm
performance. Firms that grow organically show a smoother growth pattern over time
compared to firms that grow mainly through acquisitions (Penrose, 1959). Firms early in
their life cycle and small firms tend to take the organic growth path whereas mature and
large firms predominantly grow by acquiring existing businesses (Penrose, 1959:
Davidsson et al., 2006). Firms can decide to grow in the domestic market or take their
business to the international market when the domestic market gets saturated.
International growth is more associated with large firms as they have the wherewithal to
compete and to withstand setbacks.
Acquisition strategy is used by firms to rapidly achieve growth and competitive
advantage. Acquisitions can translate into economies of scale, improved market reach
and visibility through the positive synergies of the two firms. But, from societal point of
view, organic growth creates new jobs whereas acquisitions tend to move existing jobs
from one firm to another and sometimes may even reduce jobs. Also, growth through
acquisitions is faced with various challenges of merging organizational cultures and
executive overload. The pitfalls may be severe if the anticipated synergies of the
acquisition are not realized and a hefty premium is paid for the acquisition.
Though most of the growth research fails to make the distinction between organic
and acquisition growth when conducting empirical analysis, some researchers have

15
specifically tried to understand the growth patterns in high growth industries. Delmar et
al. (2003), find that 10% of the firms in their sample grew primarily via acquisition. Size
of the firm also has an influence on the choice to grow organically or through
acquisition. Large firms primarily grow by acquiring others whereas small firms grow
organically (McKelvie and Wiklund, 2010).
2.5 Growth strategies of REITs
REITs‟ growth strategy can broadly be divided into two categories: Internal
growth and external growth. Internal or organic growth is usually achieved through
maintenance and improvement of rental income and occupancy rates of the existing
assets as well as the optimization of asset management quality and costs. Internal
growth usually takes a longer time as it depends on the availability of resources with the
firm (Penrose, 1959). Thus, firms that grow organically show smoother but slower rates
of growth. External growth, on the other hand, is achieved primarily through acquiring
new income producing properties or developing new properties that can earn income in
the future. Though REITs have opportunities to increase cash flow from its existing
properties by providing efficient property and lease management, there is a limit to FFO
growth that can be achieved by organic growth alone.
Most REITs typically resort to external growth through expansions, acquisitions
and property development to achieve faster and substantial growth. REITs generally
grow by acquiring properties with yield higher than the REITs‟ cost of capital. Source of
acquisition value comes from increased economies of scale and the potential to improve
value of the property by better management. Acquisition can be in the form of a single
asset, a portfolio of assets or merging with another REIT or acquiring a private/public
real estate company. Traditionally, the strategy of merging with other firms is used by
well-established firms as an effective external source of growth as younger and smaller
firms lack the wherewithal to acquire other firms. It is generally believed that young firms
are acquisition targets and they are rarely considered to be potential acquirers
themselves. But, if young REITs want to expand rapidly to attain economies of scale
then young REITs should consider acquiring/merging with its competitors as a viable
strategic option.
Development on the other hand is considered risky due to construction and
leasing concerns. Even if some REITs have pre-leasing commitments for some portion
of development, the changed market conditions by the time the property is ready for
occupation may result in investments being unprofitable. Though development has the
potential to create higher returns due to development profits, it is dilutive to REITs‟ stock
price as it is capital intensive (REITs can‟t retain much cash) and provides no cash flow
to the bottom line in the short term. Development is an option that is irreversible and is
expensive and it engenders a higher cost of capital due to increased risk. Though real

16
estate values are created by development activities, many things can go wrong or
change during the period of development as seen in the recent financial crisis. Yields
are low during the development period which may affect the revenue targets. Since,
development is considered to be increasingly risky, not many REITs undertake this
strategy for external growth. Only established REITs with proven history of revenue
generation can raise the necessary capital to weather the development process.
According to Brounen et al (2000), who study the effects of property development
activities on the performance of REITs during the period 1993-1999, property
development is undertaken mainly by large REITs as development activities require a
certain size in order to generate spin-offs. They also conclude that REITs specializing in
outlet centers and regional malls almost always develop property themselves and cite
the reason as the scarcity of existing properties in these markets during the time period
of their study.
The growth strategy of REITs depends on the prevailing economic condition that
has a bearing on the demand and supply of these income producing properties. The
growth strategy is also dependent on REIT‟s capital raising ability from external
sources. This proves to be a challenge, especially to young REITs that find it difficult to
compete with their well-established counterparts. Growth through acquisition of
properties is the most often path taken by REITs to grow externally as compared to
growth through development of new properties (Figure 2.1). Property development is
considered to be relatively risky and cash intensive activity and hence is limited to more
established REITs as compared to young and small REITs. Acquisition on the other
hand is relatively less risky and the key is to find a property with yield higher than the
REIT‟s cost of capital.
Figure 2.1: REITs investment through acquisition and development (2001-2010)
This figure depicts that property acquisition is the preferred route for REITs to grow compared to property development. The data for total acquisitions and development is obtained from SNL Financials.
0
10
20
30
40
50
60
2001 2002 2003 2004 2005 2006 2007 2008 2009 2010
USD
Bill
ions
Total acquisition Total Development

17
Over the years, REITs have moved from being passive real estate holding
companies to firms that cater to various real estate services. REITs have also evolved
by strategic tie-ups and joint ventures with developers and real estate operators to add
to its asset growth. The REIT modernization Act (RMA) in 2001, allowed REITs to own
100% of stock of a Taxable REIT Subsidiary (TRS) that provides services to REIT
tenants. This has provided an avenue for REITs‟ to increase its real estate services like
asset management, property management and development consultancy to related and
unrelated parties to generate the most needed additional income to grow.
2.6 Firm growth and profitability
The inter-relationship between growth and profitability is complex and is the
reason for the mixed picture provided by the empirical evidences. There are theoretical
arguments that growth affects future profitability and profitability supports future growth.
But, the exact nature of these relationships and causality remains unresolved.
Intuitively, it can be argued that firms with better financial performance will reinvest their
profits for further growth. This means that more efficient and profitable firms will have
higher growth rates. But, regulations stipulate that REITs distribute 90% of its taxable
income as dividends, which leaves them with little retained earnings to reinvest. This
makes the relationship between financial performance and expansionary investment
even more unique as REITs face the constraint of sourcing external financing for further
investment. Even though REITs can‟t retain majority of its profits for further expansion,
profits can act as signal to obtain external finance at favorable terms.
Also, the empirical evidence from the manufacturing sector suggests that the
actual positive relationship between performance and growth is generally lower than
expected and in some cases even non-existent (Markman and Gartner, 2002). Hence,
there is no evidence of universal positive relationship between growth and profitability.
This anomaly between the theoretical predictions and the empirical findings needs to be
verified for REITs. How does firm investment and growth rate react to the current
financial performance of the REIT? Whether the influence of profits on growth is more
important than the influence of growth on profits?
2.7 Research Hypotheses
One of the main objectives of this study is to find the firm-specific determinants
that have an impact on REITs‟ growth. Since we consider various determinants that
may have a relationship with firm growth, it leads us to make a number of hypothesis
which depict positive, negative or no relationship between a determinant and firm
growth. Based on literature review, the hypothesized relationships are categorized into
the following:

18
Hypothesis 1: REIT size, age and leverage have a negative relationship with REIT
growth.
Hypothesis 2: UPREIT structure, Insider ownership, Institutional ownership, self
managed & self advised REIT structure and cash flow have positive effect on REIT
growth.
The dual-relationship between growth and profitability is still an unresolved issue in
REITs. We would like to find whether financial performance is a good predictor of
growth in REITs or whether asset growth leads to more profitable REITs?
Hypothesis 3: REIT‟s asset growth has a positive relationship with profitability.
Hypothesis 4: REITs‟ profitability has a positive influence on firm growth.
3. Data and Methodology
3.1 Measurement of firm growth
Diverse metrics of firm growth have been used in the existing literature. Based
on extensive literature review, Delmar (1997) and Ardishvili et al. (1998) have compiled
a list of possible growth indicators: assets, employment, market share, physical output,
profits, stock market value and sales. Sales and employment are the most widely used
measures in empirical growth research (Delmar 1997). Since, firm growth is
fundamentally a multidimensional phenomenon, researchers have used different growth
measures for different forms of growth (Delmar et al., 2003). Sales, seems to be the
consensus indicator for the preferred measure of firm growth as it is easily available and
applies to all sorts of firms (Ardishvili et al., 1998). But use of sales as a precursor of
growth has its shortcomings too. For start-ups like the technology firm, growth in sales
may happen at a later stage and assets and employment growth may be a better
indicator of growth. Also, sales are sensitive to inflation and currency exchange rates
(Delmar et al, 2003). Employment measure may be preferable if the focus of study is
the managerial implication of growth (Churchill and Lewis, 1983). But, with technological
innovations and with the substitution of capital for labor, a firm may grow considerably in
terms of assets and output without any substantial growth in employment. Measuring
growth in assets may be problematic if the firms in the sample have different capital
intensities and also if intangible assets are as important to the company‟s growth
prospects. Hence, the selection of growth indicator depends on the research question
and the type of firms that are included in the sample (Davidsson and Wiklund, 2000).
The two basic approaches used in the literature to measure firm growth are the
absolute and relative growth. Absolute growth measures the absolute increase or
19
decrease in numbers of firm size whereas relative growth measures the growth rate in
percentage terms. Firm growth is usually measured by taking the log-differences of size.
log(Git) = log(Sit) – log(Si,t-1)
where “Sit” is the size of the firm i at time t.
Using the log differences instead of relative growth helps in minimizing the effect of
heteroscedasticity in statistical analysis. But, measuring growth by these two methods
can often lead to different results (Sheperd and Wiklund, 2009). Weinzimmer et al.
(1998) found a weak correlation between the different formulae for computing growth.
Measures of absolute growth are biased towards large firms whereas that of relative
growth is biased towards smaller firms. To overcome this problem, Birch (1981) used a
combination of absolute and relative growth (known as Birch index) to reduce the
impact of firm size. Sometimes, growth rates are also scaled down by average size to
reduce the ambiguity in results that can rise if the initial size is too low.
A comparison between the previous studies on firm growth is made difficult with
the variations in the growth indicators, the growth formula (absolute or relative) and the
time frame (Delmar et al., 2003). The challenge is to develop better knowledge about
the relative and combined effects of many predictors under different circumstances
(Davidsson et al., 2005). The diversity of measures used in the growth studies has
made it difficult to generate a cumulative body of knowledge (Weinzimmer et al.,
1998).The interpretation of growth metric also depends on the length of time over which
it is measured and due to the possibility of the exit of a firm that may again make
comparisons misleading. Since there is no one best measure of firm growth, some
researchers have advocated composite measures using multiple indicators (Davidsson,
1989) to measure heterogeneity in firm growth. Using multiple measures helps not only
in providing a “big picture” of the empirical relationships but also allow comparisons with
the earlier studies.
3.2 Data set and source
The initial sample includes all publicly traded US equity REITs covered by SNL
Financial and that had its IPO during 1993 to 2005, both years inclusive. We also match
the Equity REITs (EREITs) universe of SNL with those identified by NAREIT to verify
the investment focus of REITs. Our sample period starts from 1993 onwards as the
new-REIT era (post 1992) is more representative of the present REITs‟ characteristics
and is significantly different in ownership structure and management style to pre-1990
REITs.8 Also, during the early nineties dramatic changes happened in the REIT
8 Ott et al (2005) analyzed the differences in the old-REIT (1981-1992) and new-REIT eras (1993-1999) and
concluded that the REIT sector experienced rapid growth in the new-REIT era.

20
regulatory environment and with those changes REITs have predominately become
actively managed (Ross and Klein, 1994). Institutional investors had limited role before
1993, but with the “look through” provision passed in 1993, REITs have attracted more
investments from Institutional investors.9 Also, UPREIT structure was first developed in
1992 and various debt-ridden real estate developers, in the early nineties, found this as
a tax-deferred strategy to get the REIT status and finance its growth.
We have in our sample all equity REITs that are publicly traded, which includes
listed (NYSE, AMEX and NASDAQ) and unlisted REITs.10 We exclude Mortgage and
Hybrid REITs as the number of these types of REITs have declined over the recent
years.11 Also, we are interested to study the growth dynamics in REITs and equity
REITs, which own and operate income producing properties, provide a better metric to
measure growth than mortgage REITs. In addition to SNL, we also use Bloomberg,
COMPUSTAT and firm‟s SEC filing (10Ks, proxy statements DEF 14A, 13-F filings)
from SEC EDGAR database. Institutional ownership data for the sample REITs are
collected from the historical 13(F) SEC filings and insider ownership data is computed
from the manual tracking of the firm‟s DEF14A proxy statements yearly from 1993-2010
from each of the sample REITs‟ webpage.
We start with 167 equity REITs that were incorporated during 1993-2005. We
restrict our sample to REITs that had at least three years data during 1993-2010.12 We
eliminate 9 REITs that had only one year of data and further eliminate 10 more REITs
that had data for only two years. Following Hartzell et al. (2006), we eliminate 22 REIT-
years where asset growth rates are greater than 100%. We do this to mitigate the effect
of extreme outliers due to mergers and acquisitions. The merger or take-over of a firm
implies a substantial increment to the growth of the acquiring firm. Hence, we eliminate
extreme growth rates in our sample. These eliminations reduce our sample to 148
unique public equity REITs with 1505 REIT-year observations. To eliminate survivorship
bias, we retain in our sample REITs that were acquired, merged or delisted up to the
time of its existence. The final sample consists of 148 equity REITs and is an
unbalanced panel dataset.
3.3 Variable definitions and Summary statistics
The variables used for the empirical investigation of determinants of growth in
REITs are enumerated below. The summary statistics along with the variable
description for the final sample are presented in Table 3.1.
9 The Omnibus Budget and Reconciliation Act (OBRA) of 1993 relaxed the five-or-fewer ownership rule for Institutional investors. 10 We have around 60% of our sample firms listed on NYSE. 11 According to NAREIT statistics, by the end of 2010, over 80% of publicly traded REITs were Equity REITs. 12 A similar criterion of three years or more of data is used by Himmelberg et al. (1999) in their study on
determinants of managerial ownership.

21
Table 3.1: Variable definitions and Summary statistics
Table 3.2 shows the distribution of the sample across the study period, property
focus, REIT‟s operating structure, REIT‟s management structure and management
style. The table details both absolute and relative growth of total assets. The REIT-year
observations are highest in the years 1999 and 2000 and are more or less evenly
distributed. Based on property focus, Industrial, Healthcare, Hotel and Office show
relatively more annual average asset growth over the sample period. The distribution of
sample by REIT structure shows that majority of the sample, around 85%, comprised
UPREIT structure REITs. Similarly, the distribution of samples by REIT management
style and management structure shows that more than 95% of the sample consists of
internally advised REITs and more than 85% of the sample comprises of self managed
REITs. Running a t-test for mean equality, we fail to reject the null hypothesis of mean
equality of total asset growth by REIT structure, advisor type and management style
type. This test result suggests that the difference in the growth of REITs is not
significantly influenced by those variables.
The correlation matrix for the variables in this study is presented in Table 3.3.
The correlations support many of the expected relations. REIT asset growth is
significantly and negatively correlated with firm size (proxied by total asset), firm age
and leverage. Firm growth is significantly and positively correlated with scaled cash flow
(funds from operation/total assets) and Tobin‟s q. But, ownership by institutional
investors has no significant influence on REIT asset growth and insiders hold small
positive effect on growth.
Variable Variable Definition No. of Mean Median Standard Min. Max.
name code Obs. deviation
Absolute Firm Growth TA_Gr Annual total asset growth [ln (TA i,t ) -ln (TA i,t-1 ) ] 1335 0.1457 0.0801 0.2592 -2.927 0.9872
Relative Firm Growth TA_Gr_rel Annual % change in Total assets [(TAi,t- TAi,t-1)/TAi, t-1] 1278 0.1476 0.0754 0.2365 -0.946 0.9992
Size TA Natural log of end of period total assets [ln(TA t ) ] 1505 20.769 20.792 1.353 10.954 24.2
MKTCAP Natural log of end of period Market Cap [MKTCAPt ) ] 1505 20.1 20.15 1.415 12.9 24.09
Age AGE Natural Log of one plus years since IPO 1505 1.757 1.856 0.733 0 2.94
Cash flow Sc_FFO Funds from Operation scaled by Total assets 1460 0.051 0.054 0.027 -0.201 0.1274
Leverage LEV Book value of Debt scaled by Total assets 1505 0.5159 0.5111 0.1724 0 1.618
Tobin's Q TQ (Market value of equity+ book value of Debt) 1505 1.145 1.119 0.2549 0.4865 2.39
Book value of total assets
REIT Structure UPREIT Indicator Variable, Equal to 1 if UPREIT, 0 otherwise 1505 0.8671 1 0.3395 0 1
Management Structure SELFMAN Indicator Variable, Equal to 1 if Self managed, 0 otherwise 1505 0.8564 1 0.3567 0 1
Management Style SELFADV Indicator Variable, Equal to 1 if internally advised, 0 if 1505 0.9681 1 0.1757 1 1
externally advised
Institutional Ownership INSTIOWN % of total O/s shares owned by Institutional Investors 1380 0.6 0.6396 0.2742 0.0006 1.281
Insider Ownership INSIDOWN % of total O/s common shares and OP units owned by 1122 0.1262 0.091 0.1207 0 0.826
Directors and executive officers as a group

22
Table 3.2 Sample distribution of REITs
Table 3.3 Correlation of key variables
Variables
a) Size: We use annual data of the natural log of Total assets (TA) as our main
proxy for firm size. We adjust total assets for inflation. Alternate measures of firm size
such as real estate value, total market capitalization and total recurring revenue are also
considered in order to check the robustness of our results. The distribution of size
measure is log-normal. We lag this measure in the regression equation.
1) Time Distribution 2) Property type Distribution
Average Total Assets Growth Average Total Assets Growth
Year # of Obs Relative Absolute Prop Type # of Obs Relative Absolute
1994 37 0.3353 0.316 Diversified 43 0.1834 0.1578
1995 78 0.2478 0.2079 Healthcare 54 0.1670 0.1834
1996 80 0.2933 0.2812 Hotel 157 0.1462 0.1667
1997 84 0.4099 0.4202 Industrial 69 0.2142 0.1807
1998 96 0.358 0.3535 Residential 246 0.1513 0.1506
1999 101 0.1168 0.1134 Office 239 0.1318 0.1572
2000 101 0.0244 0.0061 Retail 373 0.1189 0.1061
2001 92 0.0375 0.0333 Specialty 154 0.1893 0.1620
2002 85 0.0749 0.0599
2003 81 0.0874 0.0934
2004 81 0.1265 0.1048 3) REIT Structure Distribution
2005 84 0.2058 0.1968 Average Total Assets Growth
2006 75 0.1388 0.1506 REIT Stucture # of Obs Relative Absolute
2007 67 0.1137 0.1207 UPREIT 1161 0.1413 0.1407
2008 65 0.0338 0.0281 Non-UPREIT 174 0.1895 0.1788
2009 64 -0.0114 -0.0153
2010 64 0.0372 0.0279
4) REIT Management Structure Distribution 5) REIT Management Style Distribution
Average Total Assets Growth Average Total Assets Growth
Mgmt Structure # of Obs Relative Absolute Mgmt Style # of Obs Relative Absolute
Self-managed 1150 0.1517 0.1499 Self-advised 1293 0.1468 0.1453
Ext-managed 185 0.1215 0.1196 Ext-advised 42 0.1728 0.1578
This table presents the distribution of the sample across time, property type, structure, management and style of REITs used in the
determinants of firm growth analysis. The sample consist of 1,335 REIT-year observations for 148 publicly traded US equity REITs
that had its IPO during 1993-2005 and traded during 1993-2010. REITs are classified into eight property categories by regrouping the SNL
classification. The eight categories are Diversified, Healthcare, Hotel, Industrial, Residential (Multi–family), Office, Retail (Regional mall,
shopping center and Retail) and Specialty (Storage, Manufactured homes, etc.).
Growth Size Age Sc Cashflow Leverage Tobin's Q Insti Own Insider Own
Growth 1.0000
Size `-0.2593*** 1.0000
Age `-0.3945*** 0.5112*** 1.0000
Leverage `-0.2350*** 0.1970*** 0.3066*** 1.0000
Scaled Cash flow 0.0683** `-0.0880*** 0.0406 `-0.1922*** 1.0000
Tobin's Q 0.2368*** 0.0515* 0.0678** 0.1740*** 0.2240*** 1.0000
Institutional Ownership 0.0057 0.5291*** 0.2570*** `-0.1479*** `-0.0486*** 0.1866*** 1.0000
Insider Ownership 0.0081 `-0.2417*** `-0.1157*** 0.2106*** 0.0366 `-0.1282*** `-0.4921*** 1.0000
This table presents the pair-wise correlations of the variables used in the regression model.
Size and Age are in Natural logs. Size is measured by Total assets. Other definitions of variables are given in Table 3.1.
***, ** and * refer to the statistical significance at 1%, 5% and 10% respectively.
23
b) Age: Firm age (AGE) is measured as the number of years since the Initial
public offer. Firm age is assumed to have a non-linear impact on firm growth. Hence, we
include a squared age term in the regression equation. The average age of the sample
is 5.86 years. We lag this measure.
c) Firm Growth: We use the absolute measure of firm growth (TA_Gr) as the
dependent variable, which is calculated as the change in the logarithm of total assets
between the current year and the previous year.
TA_Gri,t = ∆ ln (TAi,t) = ln (TAi,t) – ln (TAi,t-1)
where i = 1,….., N are firms‟ labels and t = 1993,…, 2010 is our sample period
The distribution of asset growth rate is right-skewed across the sample of REITs with a
sample mean and median equal to 14.57% and 8.02% respectively. This indicates that
several REITs in the sample grow at a high rate relative to others in the sample. The
periods between 1993-1999 and 2003-2006 were high growth periods for REITs in
terms of asset acquisition. The period during 2006-2009 is characterized by decreasing
growth in total assets due to the credit crunch that was created by the financial crisis.
The debt exposure of REITs coupled with the increasing cost of funds led many REITs
to shelve their asset growth plans soon after the crisis. We also use a relative measure
of firm growth (TA_Gr_rel) which is the annual percentage change of total assets.
d) REIT Structure: We use a dummy variable (UPREIT) for the REIT structure.
UPREIT is assigned a value of one if the REIT is an UPREIT, zero otherwise. We
identify REIT as an UPREIT or non-UPREIT at the time they enter the sample and
change the code if the REIT changes it structure midway. Most of the REITs entering in
the new-REIT era are UPREITs. By the end of 2010, we had over 80% of REITs that
had the UPREITs structure in our sample.
e) Institutional Ownership: We take the percentage of the total shares owned by
institutions according to 13F filings. Due to options and OP units the sum of shares
owned by institutions may appear greater than 100%. Average ownership by
Institutional owners (INSTIOWN) by the end of year 2010 was 81.34%.
f) Insider Ownership: We measure insider ownership (INSIDOWN) as the
common shares owned by all insiders i.e., all Directors and executive officers divided by
the total common shares outstanding. The security ownership details of the company
management are obtained from Definitive Proxy Solicitation Material (DEF14A) proxy
statements filed by the company with the Securities and Exchange Commission (SEC).
The average insider ownership by the year end 2010 for our sample of REITs was
9.01%.

24
g) Management Structure (Self-managed): Self-managed (SELFMAN) is a
dummy variable which is equal to 1 if it is internally managed and 0 otherwise. Around
85% of our sample by the end of 2010 comprises of self-managed REITs.
h) Management Style (Self-advised): Self-advised (SELFADV) is again a dummy
variable equaling 1 if internally advised and 0 otherwise. The majority of the sample,
slightly more than 95%, comprises of internally advised REITs and gives support to
Ambrose and Linneman‟s (2001) findings that the externally advised REITs are on the
decline. Public and listed REITs are typically self-managed and self-advised, whereas
public but non-listed REITs are typically externally managed and advised.
i) Liquidity/Cash-flow: We use Funds from Operation (FFO) to measure the
liquidity of REITs. We take the FFO value as reported by the company for the period,
which is typically calculated as GAAP net income excluding gains or losses from sales
of properties or debt restructuring, and adding back real estate depreciation. FFO can
be highly correlated with size measures such as total assets and hence we reduce this
effect by scaling the cash measure by total assets (Sc_FFO) and lag this measure in
the regression equation.
j) Property Type: Since, growth rates of REITs differ based on the property focus,
we control for different property sector effects. As REITs specialize in different property
markets we classify REITs into eight property categories by regrouping the SNL
classification. The eight categories are Diversified, Healthcare, Hotel, Industrial,
Residential (Multi–family), Office, Retail (Regional mall, shopping center and Retail) and
Specialty (Storage, Manufactured homes, etc.). Diversified is used as the reference
case in the regression.
k) Financing choice: Leverage (LEV) is measured as the ratio of firm‟s total debt
to total assets. We lag this measure to examine the effect of leverage at the beginning
of the year on firm growth. Average leverage for our sample is 51.59%.
l) Tobin‟s Q: We use the Tobin‟s Q (TQ) as a proxy for growth opportunities. We
adopt Perfect and Wiles (1994) measure of Tobin‟s Q, which is calculated as the sum of
the market value of equity and the book value of debt, divided by the book value of the
firm‟s total assets.13 We lag this measure so that investment opportunities available at
the beginning of the year can be used to predict investment during the year. The
average value of the proxy for Tobin‟s Q is 1.145.
Consistent with previous studies, we control for firm and year fixed effects for some
models.
13 Perfect and Wiles (1994) measure of Q has a correlation of 0.93 with that estimated using Linderberg and Ross
(1981) approach which takes the replacement costs of assets into consideration. The latter approach though more
accurate is more cumbersome to compute.
25
3.4 Research design
Based on Hall (1987) and Evans (1987), we begin our empirical tests with
standard growth size regressions and compare models obtained by adding covariates.
The growth equation is a function of initial firm size, age and a stochastic error term.
TA_Gri,t = β0 + β1ln(TAi,t-1) + β2ln(AGEi,t-1) + β3ln(AGEi,t-1)2 + εi,t (1)
and εi,t = ρεi,t-1 + µi,t, where µi,t is a random disturbance assumed to be iid and ρ captures
persistence of chance or serial correlation in µi,t . We include the squared age term
variable to reflect the non-linear impact of firm age on firm growth.
Model 1 is a simple model in which firm growth is regressed on logarithm of lag of total
assets and logarithm of lag of age. We take the lag of both size and age variables as we
want the beginning of period values in our regression equation and the data we have is
for the end of period. The following empirical model serves as the baseline model to
study the impact of other determinants on firm growth:
TA_Gri,t = β0 + β1ln(TAi,t-1) + β2ln(AGEi,t-1) + β3ln(AGEi,t-1)2 +β4(LEVi,t-1) + β5(Sc_FFOi,t-1)
+ β5(TQi,t-1) + βj(Control Variablesj,t) + εi,t (2)
Next, the effect of Institutional and insider ownership on firm asset growth is examined
by including these variables in the baseline equation.
We use panel data regression instead of OLS to avoid heterogeneity bias as the
variation in REIT asset growth is partially caused by REIT specific unobservable factors.
We employ Hausman‟s specification test to examine whether the unobservable
heterogeneity is correlated with independent variables and to determine whether fixed
effects model is preferable to random effects model. The test produces a chi-squared
statistics of 33.89 with a p-value of zero. The Hausman test result suggests that fixed
method model specification is preferable for our data. Time-invariant variables like
UPREIT, property type and advisor type are dropped from the fixed-effects model. In
order to include the time-invariant variables in the model, we also report the results
using the random-effects methodology. Annual dummy variables controlling for time-
effects are included in both fixed and random effects model. We select the robust
standard errors in Stata to calculate t-statistics corrected for serial correlation and
heteroskedasticity.
To account for the serial correlation between the lagged regressor and the error
term, we make use of the Generalized Method of Moments (GMM)-system estimator,
which is a dynamic panel data technique developed by Blundell and Bond (1998).
“System GMM” panel data estimator controls for the presence of unobserved firm

26
specific effects and gives unbiased and consistent estimates in presence of
endogenous explanatory variables.
3.5 Growth and Profitability
A final test would be to examine the relationship between profitability and growth.
Again, we resort to GMM-system estimator as the explanatory variables here are
endogenous, i.e. there is a bi-directional causation between the dependent and
independent variable. In such a condition OLS regression yields biased and inconsistent
estimates as it requires the explanatory variables to be orthogonal to the residual error
term. The problem of endogeneity can also be resolved by using instrumental variables
that are uncorrelated with the error term but are correlated with the explanatory variable.
But, if the instrument variables are weak, then the regression estimates are again
biased and inconsistent. To overcome this problem, Arellano and Bond (1991) proposed
a GMM estimator for panel data in which regression equations are expressed in terms
of first differences (eliminating time-invariant firm-specific effects) and endogenous
explanatory suitable variables are instrumented with suitable lags of their own levels.
Though this estimator can give far better results than the previously used methods, it
has its shortcomings if used for our purpose. The high persistence in profitability can
give rise to weak correlation between the lagged levels of the endogenous variable and
differences of the explanatory variables. In such a case the instruments included by the
estimator are not useful and this leads to large finite sample bias. Hence, an improved
panel data estimator proposed by Arellano and Bover (1995) and further developed by
Blundell and Bond (1998) is used. Arellano and Bover (1995) constructed a panel data
GMM estimator in which the regression equations are in levels and the additional
instruments are expressed in lagged differences. Blundell and Bond (1998) further
developed this by augmenting the original differences GMM estimator with the level
equation estimator to form a system of equations known as “System-GMM”. In the
context of our study, system GMM is best able to deal with endogeneity and firm-
specific effects and can give unbiased and consistent estimates.
4. Results and Discussions
4.1 Growth characteristics of REITs
This study provides the first comprehensive study of firm growth rates in publicly
listed US equity REITs. We undertake this study to examine the heterogeneity of REITs‟
growth dynamics by plotting the distribution of firm growth rates. We document the
growth rates of REITs using different growth indicators and describe their distribution
across age, size and property types over different time periods. Since firm growth is a
dynamic measure of change over time and a multi-dimensional phenomenon (Delmar et
al, 2003), we use different growth measures that are suitable to the REIT sector. We
27
use growth indicators in terms of inputs (Real estate investment), in terms of the value
of the firm (total assets, market capitalization and Enterprise value) and outputs
(Recurring revenue and Funds from Operation). We also use the data to examine the
survival and growth profile of a cohort of new REITs over ten years. A detailed
examination of the evolution over a decade of 90 REITs founded in 1993 and 1994 is
conducted and its pattern of asset and revenue growth is analyzed. We identify the
pattern of growth for all firms and categorize their growth is episodic or continuous. We
compare the survival of high growth firms with those of slower- growth firms. While
roughly one half of all firms founded in 1993-94 survived the ten year period, the
survival rate of high growth firms for the same ten year period was 90%.
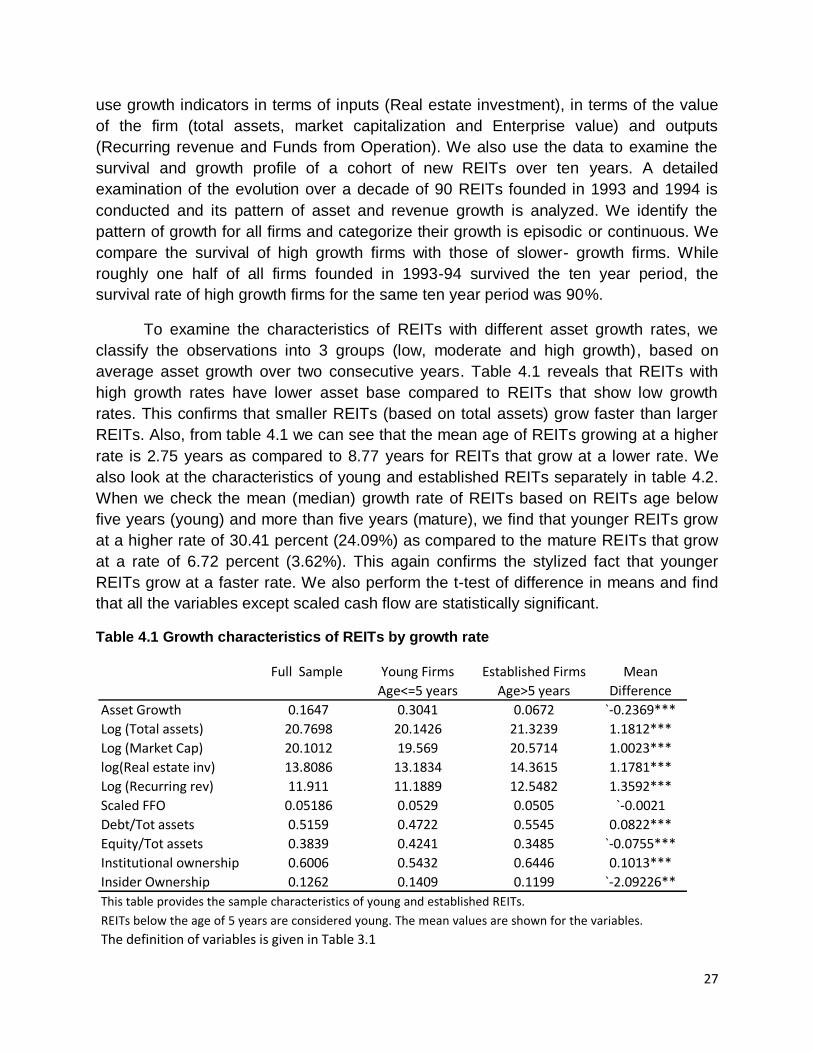
To examine the characteristics of REITs with different asset growth rates, we
classify the observations into 3 groups (low, moderate and high growth), based on
average asset growth over two consecutive years. Table 4.1 reveals that REITs with
high growth rates have lower asset base compared to REITs that show low growth
rates. This confirms that smaller REITs (based on total assets) grow faster than larger
REITs. Also, from table 4.1 we can see that the mean age of REITs growing at a higher
rate is 2.75 years as compared to 8.77 years for REITs that grow at a lower rate. We
also look at the characteristics of young and established REITs separately in table 4.2.
When we check the mean (median) growth rate of REITs based on REITs age below
five years (young) and more than five years (mature), we find that younger REITs grow
at a higher rate of 30.41 percent (24.09%) as compared to the mature REITs that grow
at a rate of 6.72 percent (3.62%). This again confirms the stylized fact that younger
REITs grow at a faster rate. We also perform the t-test of difference in means and find
that all the variables except scaled cash flow are statistically significant.
Table 4.1 Growth characteristics of REITs by growth rate
Full Sample Young Firms Established Firms Mean
Age<=5 years Age>5 years Difference
Asset Growth 0.1647 0.3041 0.0672 `-0.2369***
Log (Total assets) 20.7698 20.1426 21.3239 1.1812***
Log (Market Cap) 20.1012 19.569 20.5714 1.0023***
log(Real estate inv) 13.8086 13.1834 14.3615 1.1781***
Log (Recurring rev) 11.911 11.1889 12.5482 1.3592***
Scaled FFO 0.05186 0.0529 0.0505 `-0.0021
Debt/Tot assets 0.5159 0.4722 0.5545 0.0822***
Equity/Tot assets 0.3839 0.4241 0.3485 `-0.0755***
Institutional ownership 0.6006 0.5432 0.6446 0.1013***
Insider Ownership 0.1262 0.1409 0.1199 `-2.09226**
This table provides the sample characteristics of young and established REITs.
REITs below the age of 5 years are considered young. The mean values are shown for the variables.
The definition of variables is given in Table 3.1

28
Table 4.2 Growth characteristics of REITs by age
4.1.1 Growth rate distribution
We start with an analysis of the distribution of growth rates in the entire
population of REITs operating over specific time periods. Using the data from this
distribution, we delve on growth characteristics of young REITs. To analyze the growth
rate, we allocate the firms in one of the seven growth intervals from less than -10% to
more than +40% annualized growth rate per annum. Since, we are interested in the
growth profile in the new REIT era, we focus on three year period, viz, 1995-1997 and
2005-2007 in each of the last two decades.14 We choose these two periods for the
following reason: during 1993-94 and 2003-04, the REIT industry saw a wave of REIT
IPOs. Since, our focus is young REITs, choosing this time period will enable our sample
to be well represented by new REITs. In these two periods, we have included only those
firms that were in existence at the beginning of each period and have not included the
firms that were born in the first year of each period. We identify 91 and 101 REITS
surviving over each period 1995-97 and 2005-07 respectively. Specifically, we look at
the distribution of growth rates in total assets and revenue for the firms over the two
three-year periods, 1995-97 and 2005-07, breaking it down by firm size, age and
property type.
14 We use growth rates over three years to be consistent with the organization of economic cooperation and
development’s (OECD) definition of high-growth firms.
Full Sample Young Firms Established Firms Mean
Age<=5 years Age>5 years Difference
Asset Growth 0.1647 0.3041 0.0672 `-0.2369***
Log (Total assets) 20.7698 20.1426 21.3239 1.1812***
Log (Market Cap) 20.1012 19.569 20.5714 1.0023***
log(Real estate inv) 13.8086 13.1834 14.3615 1.1781***
Log (Recurring rev) 11.911 11.1889 12.5482 1.3592***
Scaled FFO 0.05186 0.0529 0.0505 `-0.0021
Debt/Tot assets 0.5159 0.4722 0.5545 0.0822***
Equity/Tot assets 0.3839 0.4241 0.3485 `-0.0755***
Institutional ownership 0.6006 0.5432 0.6446 0.1013***
Insider Ownership 0.1262 0.1409 0.1199 `-2.09226**
This table provides the sample characteristics of young and established REITs.
REITs below the age of 5 years are considered young. The mean values are shown for the variables.

29
Figure 4.1: Distribution of Firm growth rates by Total assets
Figure 4.2: Distribution of Firm growth rates by Revenue
Figure 4.1 and Figure 4.2 present the distribution of the three year firm growth
rates in terms of total assets and recurring revenue respectively. Looking at the two
graphs, it is evident that growing firms are overrepresented in REITs sector which
supports the conclusion of Gallagher and Miller (1991) who confirm the
overrepresentation of growth firms in certain industries like services, finance and
distribution. For total assets, we see that for the sub-period 1995-97, bulk of the
distribution (around 66%) is concentrated in the over 20% growth interval compared to
around 33% in the same growth interval of the sub-period 2005-07. Furthermore, the
distribution is different between the two time periods. In the earlier 1995-97 period just
over 5 % of the REITs exhibited low growth (growth interval 1-10%). However, in the
more recent 2005-07 period, the proportion of firms registering a small growth in total
assets in the same growth interval shot up to around 35 percent. The shape of the
distribution in terms of revenue looks similar in both the sub-periods to that of the shape
of the asset growth distribution. Overall, in 2005-07 we observe that there is a
significant rise in the number of firms experiencing low growth in total assets as well as
revenue. Probably, the REIT sector is witnessing a shift from being high growth industry
<-10 `-10;-1 `-1;1 1;10 10;20 20;40 >40
Yr_1995-97 3.30 4.40 5.49 5.49 15.38 34.07 31.87
Yr_2005-07 1.98 8.91 2.97 35.64 16.83 20.79 12.87
0
5
10
15
20
25
30
35
40%
0f fi
rms
Distribution of REITs growth rates: Assets
<-10 `-10;-1 `-1;1 1;10 10;20 20;40 >40
Yr_1995-97 3.30 1.10 1.10 13.19 20.88 31.87 28.57
Yr_2005-07 0.99 7.92 0.99 36.63 23.76 16.83 12.87
0.00
5.00
10.00
15.00
20.00
25.00
30.00
35.00
40.00
% of
firm
s
Distribution of firm Revenue growth rates

30
to a more mature industry. We try and dissect the reason for the low levels of growth in
the latter sub-period and find that the average age of the firms in the earlier period was
7.3 years as compared to the average age of 14.13 years in the latter sub-period. This
supports the stylized fact in firm growth literature that younger firms grow faster than
older firms. Since, our focus is young REITs, we further investigate the characteristics of
the high-growth REITs in its early years.
According to OECD, a high-growth firm is defined as a firm with an average
annualized employment or turnover growth rate exceeding 20 percent per annum over a
three year period and with ten or more employees at the start of the period. Therefore,
we now look at firms that have annual revenue growth rates that exceed 20% over each
of the three year periods. The revenue profile of the high-growth firm shows that
majority of the high growth firms are smaller in size in both sub-periods. This again
supports the stylized fact that smaller firms grow at a faster rate. When we look at the
share of gazelles in the high-growth firms, we find that their share has drastically come
down from 73% in 1995-97 to 27% in 2005-07.15 Since, majority of high growth firms in
the sub-period 2005-07 are well established firms, we can say that gazelles are not a
common feature of the high growth firms in the latter sub-period. This is probably due to
more number of young REITs in the earlier period sample. But, this brings us to the next
important question of survival of these young and high growth firms. What happens to
these gazelles after their intensive growth period? Do they continue on their growth
surge or slow down, stagnate or decline? When we take a look at the 40 firms that were
gazelles in the sub-period 1995-97, we find that 36 firms (90%) survived till the sub-
period 2005-07 and out of 40 REITs that were gazelles in 1995, only 2 maintained its
high-growth status in 2005. Thus, firms growing at high rates in early years survive
longer, but rapid growth is not sustainable in the longer run. For US small businesses,
Headd and Kirchhoff (2007) found that the year after fast growth, 55 percent of fast
growers declined in employment versus the universe's 25 percent. This gives us a fair
idea that rapidly growing REITs may not be able to sustain its growth levels for a long
time and hence the growth trajectories of young REITs requires further exploration.
4.1.2 Growth trajectories and Persistence
Since, the analysis of growth over the three year period does not give a full
picture of the development path of REITs, we conduct a detailed examination of the
1993 and 1994 cohort of new REIT entrants. We focus on the dynamic evolution of the
cohort of REITs over ten years after firm incorporation and examine how they have
actually achieved growth. Out of the 90 equity REITs that had its IPO in 1993 and 1994,
only 50 survived their ten years of operation. Using the annual growth rate in total
15 Gazelles are a subset of high-growth firms with less than five years in business at the beginning of the three-year
time period. This term was coined by Birch (1981).

31
assets of these 50 surviving REITs, we analyze its growth for each year for the next 10
years. We also look at the timing of the high growth instances in those ten years to
ascertain whether the high growth occurs immediately after the IPO listing or whether it
occurs when REITs are more established. To examine the high growth instances of the
cohort, we code the growth rates for each year into four categories: High growth (year-
on-year asset growth, Gr >30%), Moderate growth (5%<Gr<30%), Low growth
(0%<Gr<5%) and Negative growth (Gr<0%). Out of 50 new surviving REITs in the 1993-
94 cohort, 45 (90%) recorded one or more annual instances of high-growth in the 10
year period after its inception. The first five years of the REIT incorporation also
witnessed multiple annual high growth instances and these episodes drastically reduced
beyond five years of REITs‟ existence. Also, achieving high growth in consecutive years
was not rare in young REITs (less than five years old) whereas it was rare for better
established REITs. Timing wise, REITs experience an annual spurt of high growth when
they are young i.e, they are less than five years old and high growth instances are
comparatively less in more established REITs. Thus, REITs grow extremely fast when
they are young. For the first three years the surviving REITs grew by 42.16 percent on
an annualized basis. After the initial spurt, the growth slowed and over the latter seven
years the 1993-94 cohort of REITs averaged about 14.6 percent annualized growth per
year. This observation also supports the negative relationship between age and growth
presented in the existing literature.
Figure 4.3: Survival of REITs: 1993-94 cohort
The figure shows the survival rate of the cohort of 1993-94 listed REITs over the years. Data for the
REITs survival is obtained from SNL Financials.
We trace new REITs‟ growth trajectories to examine if any typical growth
trajectory exists for these young REITs. To map the growth path we again make use of
the 1993-94 cohorts of young REITs surviving over the 10 year period. The survival rate
(figure 4.3) of 52% over a decade shows relatively good survival performance of US
40
50
60
70
80
90
100
110
0 1 2 3 4 5 6 7 8 9 10
% S
urvi
ved
Age in years
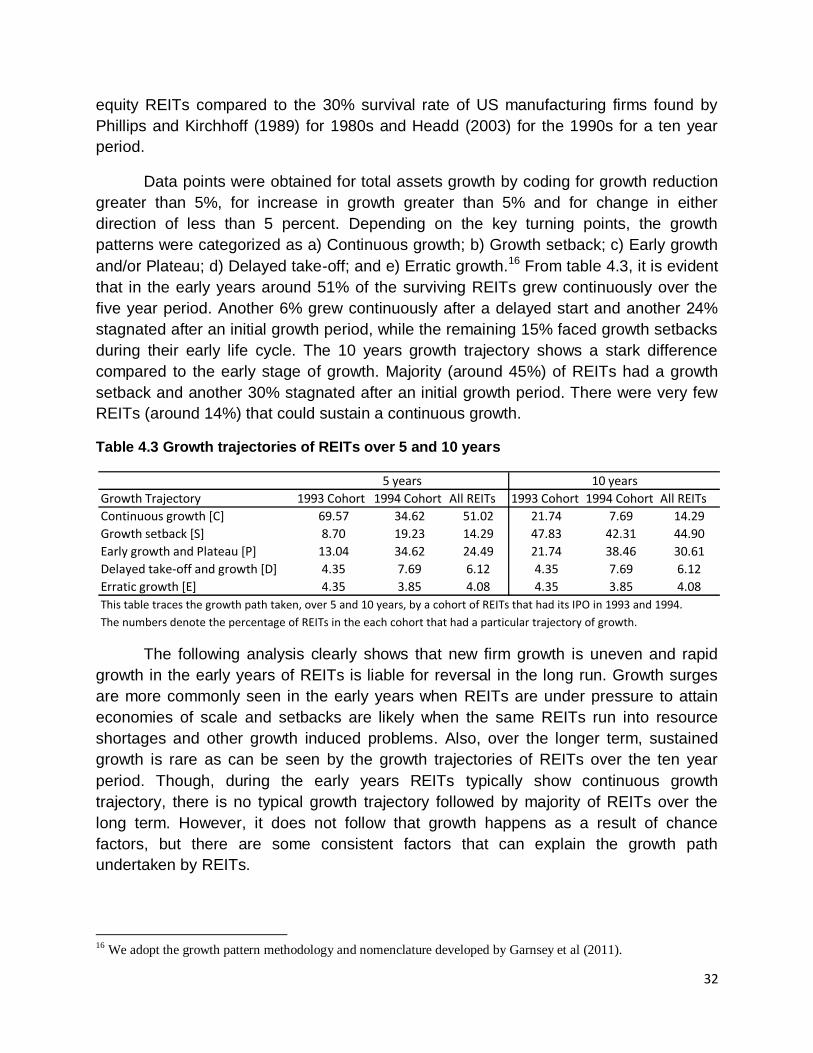
32
equity REITs compared to the 30% survival rate of US manufacturing firms found by
Phillips and Kirchhoff (1989) for 1980s and Headd (2003) for the 1990s for a ten year
period.
Data points were obtained for total assets growth by coding for growth reduction
greater than 5%, for increase in growth greater than 5% and for change in either
direction of less than 5 percent. Depending on the key turning points, the growth
patterns were categorized as a) Continuous growth; b) Growth setback; c) Early growth
and/or Plateau; d) Delayed take-off; and e) Erratic growth.16 From table 4.3, it is evident
that in the early years around 51% of the surviving REITs grew continuously over the
five year period. Another 6% grew continuously after a delayed start and another 24%
stagnated after an initial growth period, while the remaining 15% faced growth setbacks
during their early life cycle. The 10 years growth trajectory shows a stark difference
compared to the early stage of growth. Majority (around 45%) of REITs had a growth
setback and another 30% stagnated after an initial growth period. There were very few
REITs (around 14%) that could sustain a continuous growth.
Table 4.3 Growth trajectories of REITs over 5 and 10 years
The following analysis clearly shows that new firm growth is uneven and rapid
growth in the early years of REITs is liable for reversal in the long run. Growth surges
are more commonly seen in the early years when REITs are under pressure to attain
economies of scale and setbacks are likely when the same REITs run into resource
shortages and other growth induced problems. Also, over the longer term, sustained
growth is rare as can be seen by the growth trajectories of REITs over the ten year
period. Though, during the early years REITs typically show continuous growth
trajectory, there is no typical growth trajectory followed by majority of REITs over the
long term. However, it does not follow that growth happens as a result of chance
factors, but there are some consistent factors that can explain the growth path
undertaken by REITs.
16 We adopt the growth pattern methodology and nomenclature developed by Garnsey et al (2011).
Growth Trajectory 1993 Cohort 1994 Cohort All REITs 1993 Cohort 1994 Cohort All REITs
Continuous growth [C] 69.57 34.62 51.02 21.74 7.69 14.29
Growth setback [S] 8.70 19.23 14.29 47.83 42.31 44.90
Early growth and Plateau [P] 13.04 34.62 24.49 21.74 38.46 30.61
Delayed take-off and growth [D] 4.35 7.69 6.12 4.35 7.69 6.12
Erratic growth [E] 4.35 3.85 4.08 4.35 3.85 4.08
This table traces the growth path taken, over 5 and 10 years, by a cohort of REITs that had its IPO in 1993 and 1994.
The numbers denote the percentage of REITs in the each cohort that had a particular trajectory of growth.
5 years 10 years

33
To check whether there is persistence in growth, we look at the “growth-growth”
formation, i.e., a year of growth followed by another year of growth in our 1993-94
cohorts. We see that the G-G sequence was the most common sequence representing
48% of all two paired sequences in the sample. Also, around 78% of the sequences
beginning with an incidence of growth were followed by a second period of growth,
whereas only 38% of sequences beginning with a plateau were followed by growth. This
clearly reflects that growth is conducive to further growth. We will return back to the
question of persistence of growth in more detail in the empirical analysis section.
4.2 Growth determinants: Panel regression results
Table 4.4 presents the panel data regression results for the determinants of
REITs‟ growth. Model 1 estimates the equation (1), while models 2 through 5 estimate
equation 2 and its variations using both fixed-effects. Since, Weinzimmer et al. (1998)
suggest relative or percentage change in firm size to be a better method to measure
firm growth, we also run our panel regressions with the relative measure of growth as
the dependent variable (not reported in the paper). Results from panel regressions
show that the estimated coefficient of firm size (as measured by total assets) and firm
age, in all the models, are significantly and negatively related to firm growth. These
finding suggest that smaller and younger REITs grow faster than the larger and older
ones. These results are consistent with the stylized facts found in the firm growth
literature and rejects Gibrat‟s law of proportional effect. The negative growth-age
relationship in our sample is consistent with the theory of firm learning (Jovanovic,
1982). We also include a squared age variable in the models to examine the non-linear
impact of age on firm growth. The positive coefficient on the age squared variable
suggests a non-linear relationship between age and growth which means that younger
firms experience faster growth than their older counterparts, but up to some threshold
age.
The results provide strong evidence of an inverse relation between asset growth
and leverage. Leverage is significantly and negatively related to growth, suggesting that
firms with high leverage would not be able to take advantage of growth opportunities.
This result is similar to many studies on capital structure that have shown that increased
leverage reduces firm‟s ability to raise additional funds to invest (Myers, 1977;
Auerbach, 1985; Lang, 1996).17 But, our results are not consistent with the positive and
significant relationship between leverage and firm growth found by An et al. (2011) in
their study of corporate transparency and firm growth in REITs.
The results further show that REITs‟ asset growth is positively and significantly
related with cash flow. This finding suggests that REITs, which are usually financially
17 Unlike Titman and Wessels (1988), we do not make any distinction between long-term, short-term and
convertible debt.

34
constrained, value its excess funds from operation and utilize it to further its growth
objectives. 18 Tobin‟s q also shows a similar significant and positive relationship with
firm growth. REITs having more growth opportunities grow more. We use Tobin‟s q in
the regression to control for the growth opportunities. In models 3 to 5, insider
ownership shows a weak positive effect on total asset growth in REITs. This result
supports Han (2006) findings that the relationship between REIT‟s insider ownership
and Tobin‟s q is positive at low levels and turns negative at high level. Institutional
ownership also influences the REIT‟s growth positively and is statistically significant as
shown in models 3 to 5.
We use indicator variables to test for the effect of UPREIT status, self
advisement style and self management structure of REITs in model 4 and model 5.
UPREIT structure and self advisement structure do not seem to influence growth of
assets in REITs. The insignificant and negative coefficient for self advisement structure
in model 4 is contrary to our expectation that self advised REITs with less agency
issues will be able to finance its capital at lower cost and grow more. Self management
structure of REITs has a positive and significant influence on asset growth. Dummy
variables categorizing property types are used in model 5 to control for the different
property type effects that may impact the growth rates. Since, we use an intercept in our
model we leave diversified property type out of the model. The results are not
conclusive as compared to the reference group (diversified property type) none of the
other property types significantly impact asset growth in REITs. The panel regression
results are similar when relative measure of firm growth is taken as the dependent
variable, except that the scaled cash flow variable becomes insignificant. We check for
the robustness of the results by taking market capitalization as the proxy for firm size.
The results are quantitatively similar to what we find with the full sample and hence the
results are not reported.
Since, our interest is in young REITs, we conduct the panel data regressions for
the sample of REITs that are less than 5 years of age (table 4.5). All the variables have
the same influence on firm growth for young REITs except that age becomes
insignificant. Size and leverage has a negative relationship with growth. Whereas, cash
flow, institutional ownership and insider ownership show a positive relationship. Upreit
and self-advisement structure do not have any significant influence and self
management structure is positively and significantly related to growth. None of the
property types show any significant influence on firm growth of young REITs.
18 Hardin and Hill (2008) suggest that REITs that generate excess funds from operation pay out more dividends.
Since, REITs necessarily require additional capital from both equity and debt market for future growth, by paying
excess dividends from excess FFO it reduces the agency costs which in turn reduce its cost of capital.

35
Table 4.4: Panel Data regression results (entire sample)
Explanatory Variable Predicted Model 1 Model 2 Model 3 Model 4 Model 5
Intercept (+/-) 2.5804*** 2.8210*** 3.1759*** 1.848*** 1.1157***
[0.6194] [0.4354] [0.6131] [0.2463] [0.2465]
Size (-) -0.1159*** -0.1365*** -0.1403*** -0.0501*** -0.0534***
[0.0314] [0.0210] [0.0282] [0.0112] [0.0112]
Age (-) -0.2225** -0.2070** `-0.1966 -0.2280*** -0.2740***
[0.0987] [0.0878] [0.1919] [0.0723] [0.0725]
Age 2 (+) 0.0004 0.0487 0.0292 0.0397* 0.0607***
[0.0737] [0.0668] [0.1169] [0.0220] [0.0225]
Leverage (-) - `-0.3770*** -0.4335*** -0.4042*** -0.3549***
[0.0757] [0.1007] [0.0719] [0.0722]
Cashflow (+) - 0.0637* 0.8448** 0.6702* 0.6831**
[0.3572] [0.3393] [0.3486] [0.3459]
Tobin's q (+) - 0.2912*** 0.2523*** 0.2578*** 0.2687***
[0.0469] [0.0657] [0.0441] [0.0437]
Institutional Ownership (+/-) 0.1383* 0.1106*** 0.1297***
[0.0822] [0.0413] [0.0415]
Insider Ownership (+/-) 0.0018 0.0016** 0.0018**
[0.0020] [0.0008] [0.0007]
UPREIT (+/-) - - - 0.0281 0.0439
[0.0438] [0.0447]
Self-managed (+) 0.1072*** 0.3688***
[0.0412] [0.0655]
Self-advised (+) `-0.0741 `-0.2863**
[0.0786] [0.0884]
Healthcare (+/-) `-0.0526
[0.0650]
Hotel (+/-) 0.2948
[0.0661]
Industrial (+/-) -0.055
[0.0633]
Residential (+/-) -0.0086
[0.0492]
Office (+/-) -0.0123
[0.0450]
Retail (+/-) -0.0549
[0.0434]
Specialty (+/-) -0.1215
[0.0880]
Fixed/Random Eff FE FE FE RE RE
Observations 1335 1299 920 920 920
R-squared 0.3748 0.4898 0.4135 0.3936 0.3958
This table presents fixed-effects and random-effects regression results for the determinants of firm growth in REITs.
The dependent variable is the absolute growth in total assets measured as the change in the logarithms of total assets
between the current year and the previous year. The definitions of the independent variables and the control variables
are given in Table 3.1. For both random and fixed-effects models, annual dummy variables are used to control for time
effects. Robust standard errors are reported in paranthesis. Statistical significance is displayed by the use of one (10%),
two (5%) and three (1%) asterisks.
Dependent Variable: Absolute Growth in Total assets

36
Table 4.5: Panel Data regression results (Young REITs)
Explanatory Variable Predicted Model 1 Model 2 Model 3 Model 4 Model 5
Intercept (+/-) 6.067*** 3.6733** 7.9400*** 0.9588* 1.1333*
[1.8410] [2.3566] [2.4160] [0.6592] [0.6666]
Size (-) -0.3004*** -0.2031** -0.4390*** -0.0634** -0.0813**
[0.0685] [0.0913] [0.1118] [0.0292] [0.0290]
Age (-) `-0.0509 `-0.2861 `-0.0877 `-0.0751 `-0.8860
[0.2467] [0.2632] [0.3885] [0.2995] [0.2924]
Age 2 (+) `-0.0106 0.0026 0.103 0.069 0.0758
[0.4190] [0.4298] [0.7383] [0.1458] [0.1434]
Leverage (-) - `-0.4890*** `-0.2370** -0.4498** -0.2766**
[0.1251] [0.1007] [0.2292] [0.2301]
Cashflow (+) - 1.7936* 4.1698** 3.0469 2.6368*
[0.9167] [1.8000] [1.4054] [1.4090]
Tobin's q (+) - 0.4389*** 0.6134*** 0.4196*** 0.5014***
[0.1106] [0.1585] [0.1611] [0.1602]
Institutional Ownership (+/-) 0.4789* 0.3348*** 0.4152***
[0.2585] [0.1269] [0.1342]
Insider Ownership (+/-) 0.0039 0.0045** 0.0052**
[0.0030] [0.0022] [0.0022]
UPREIT (+/-) - - - 0.0182 0.0469
[0.1110] [0.1111]
Self-managed (+) 0.2029** 0.5304***
[0.0932] [0.1350]
Self-advised (+) `-0.2202 `-0.5195
[0.1756] [0.2056]
Healthcare (+/-) `-0.1002
[0.2536]
Hotel (+/-) 0.1732
[0.2612]
Industrial (+/-) -0.0781
[0.2744]
Residential (+/-) -0.0164
[0.2562]
Office (+/-) -0.133
[0.2487]
Retail (+/-) -0.2807
[0.2431]
Specialty (+/-) -0.2056
[0.2549]
Fixed/Random Eff FE FE FE RE RE
Observations 538 517 178 178 178
R-squared 0.3824 0.4466 0.6466 0.5459 0.5686
This table presents fixed-effects and random-effects regression results for the determinants of firm growth in young REITs.
The dependent variable is the absolute growth in total assets measured as the change in the logarithms of total assets
between the current year and the previous year. The definitions of the independent variables and the control variables
are given in Table 3.1. For both random and fixed-effects models, annual dummy variables are used to control for time
effects. Robust standard errors are reported in paranthesis. Statistical significance is displayed by the use of one (10%),
two (5%) and three (1%) asterisks.
Dependent Variable: Absolute Growth in Total assets
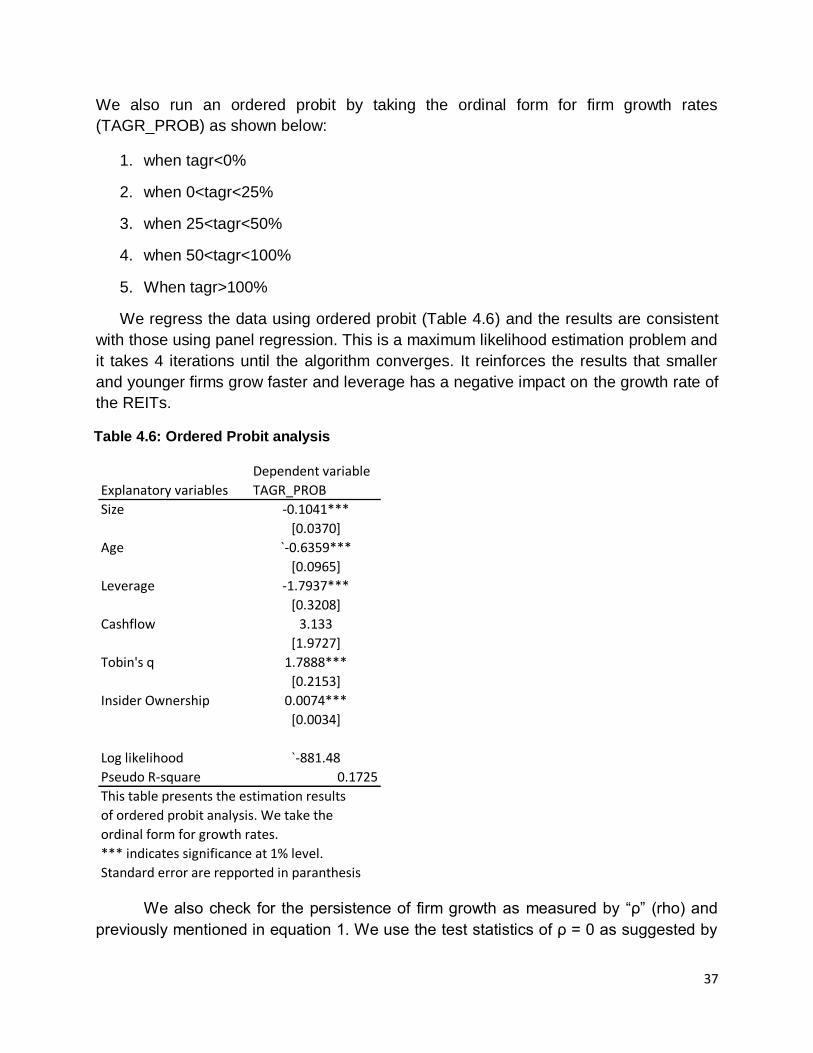
37
We also run an ordered probit by taking the ordinal form for firm growth rates
(TAGR_PROB) as shown below:
1. when tagr<0%
2. when 0<tagr<25%
3. when 25<tagr<50%
4. when 50<tagr<100%
5. When tagr>100%
We regress the data using ordered probit (Table 4.6) and the results are consistent
with those using panel regression. This is a maximum likelihood estimation problem and
it takes 4 iterations until the algorithm converges. It reinforces the results that smaller
and younger firms grow faster and leverage has a negative impact on the growth rate of
the REITs.
Table 4.6: Ordered Probit analysis
We also check for the persistence of firm growth as measured by “ρ” (rho) and
previously mentioned in equation 1. We use the test statistics of ρ = 0 as suggested by
Dependent variable
Explanatory variables TAGR_PROB
Size -0.1041***
[0.0370]
Age `-0.6359***
[0.0965]
Leverage -1.7937***
[0.3208]
Cashflow 3.133
[1.9727]
Tobin's q 1.7888***
[0.2153]
Insider Ownership 0.0074***
[0.0034]
Log likelihood `-881.48
Pseudo R-square 0.1725
This table presents the estimation results
of ordered probit analysis. We take the
ordinal form for growth rates.
*** indicates significance at 1% level.
Standard error are repported in paranthesis

38
Baltagi and Wu (1999). We find the coefficient of ρ = 0.393>0 and Baltagi-Wu LBI
(Locally Best Invariant) test statistic equal to 1.86. The Baltagi-Wu LBI statistic is
equivalent of the Durbin-Watson statistic and is a relevant test for serial correlation.
Since the Baltagi-Wu LBI statistic is not very much below 2, it indicates slight positive
persistence in growth rates i.e., above average growth in one period tends to persist
into the next.
4.3 Growth determinants: GMM-System results
Table 4.7 presents the GMM system results for the whole sample. Column 1
gives a different picture than the results of our panel regressions. The estimated
coefficient of size is negative and significant (-0.3439), indicating that smaller firms grow
faster than larger ones during our sample period. However, the coefficient of age is
positive and significant. This is in contrast to our earlier result of an inverse relationship
between age and growth. Hence, we split the sample by firm age (young firms < 5
years) and report the GMM-sys results in column 2 and column 3 of Table 4.7. The
results clearly show that there is difference in behavior between young and mature
REITs. In the case of young REITs we find that age is inversely related to growth
whereas for mature REITs the relationship becomes positive. This supports the idea
that age-growth relationship is non-linear and the negative relationship holds up to
some age. Looking at the persistence (coefficient of growth it-1), we find that for younger
firms growth encourages growth i.e., firms that grew faster in the past will grow faster in
the present. In the case of mature firms growth in one period may or may not tend to
persist in the next period. When we look at the significance of cash flow for both young
and old firms, we find that the estimated coefficient for the cash flow is higher for
younger firms. This signifies that the cash flow plays a much more important role in the
younger firms than in other firms. This is especially true for younger REITs that can‟t
hold on to most of its earnings and are more often constrained to grow due to capital
constraints.

39
Table 4.7: GMM-system results
4.4 Growth and Profitability – Dual relationship
We first investigate the effect of profitability (Return on average assets) on
subsequent growth by estimating the following regression:
TA_Gri,t = β0 + β1(RoAAi,t-1) + β2(Controli,t-1) + εi,t
where β0, β1 and β2 are parameters to be estimated and εi,t are i.i.d. error terms. RoAA
represents the return on average assets of firm i in year t. The control variables are
lagged firm size , lagged RoAA and year dummies. We also add leverage as a control
variable to control for method of financing.
Full Sample Young Firms Mature Firms
(<= 5 years old) (> 5 years old)
Intercept 7.3958*** 3.7240*** 6.8891***
[0.3404] [0.7370] [0.3645]
Growthi,t-1 0.0634*** -0.1725** 0.0979***
[0.0197] [0.0864] [0.0208]
Size -0.3439*** -0.1336*** -0.3266***
[0.0173] [0.0365] [0.0184]
Age 0.0870*** -0.3589** 0.1170***
[0.0230] [0.1523] [0.0250]
Leverage -0.3204*** -0.9878*** -0.1850*
[0.0994] [0.3394] [0.1065]
Cashflow 0.7577** 2.6176** 0.9186***
[0.2990] [2.5366] [0.2980]
Insider Ownership -0.0061*** -0.0008 -0.0063***
[0.0011] [0.0038] [0.0011]
W js Chi2 (6) 806.300 51.150 566.500
This table presents the GMM-sys results for the whole sample and the split
sample by firm age. The definitons of the independent variables and the control
variables are given in Table 3.1. All estimates include a full set of time dummies as
regressors and instruments. Null hypothesis that each coefficient is equal to
zero is tested using robust standard errors (reported in paranthesis).
Wjs is the Wald statistic of joint significance of the independent variables.
Statistical significance is displayed by the use of one (10%), two (5%) and
three (1%) asterisks.

40
We report the system-GMM estimates in table 4.8. 19 We first test the validity of
the instruments used by reporting Hansen „J‟ statistic of the over-identifying restrictions.
The corresponding p-value for the Hansen statistic are high (0.338), hence we fail to
reject the null hypothesis that the instruments are exogenous. Another key identifying
assumption is that there is no serial correlation in the εi,t disturbances. This can be
examined by testing for no second order serial correlation in the first differenced
residuals. Although first order autocorrelation is present, we fail to reject the null
hypothesis of no AR(2) serial autocorrelation as the p-value is 0.411. Thus, System
GMM is considered suitable for this study. From the results we detect a small positive
(0.03) and statistically significant influence of profits on the asset growth. The lower
value of the coefficient maybe due to the fact that REITs have to disburse most of its
profits as dividends and have to necessarily go to external sources for financing growth.
Table 4.8: System GMM regression results- Effect of profit rate on growth
“Penrose effects” (1959) suggests that growth may lead to reduction in profit rate
as managers may start focusing on exploiting the growth opportunities which diverts
their attention from keeping the operating costs down. Whereas „increasing returns‟
predicts that growth will lead to higher profit rate due to economies of scale that reduces
the unit cost. Also, from resource-based view, growth may lead to increases in profit if
organizational slack that was under-utilized previously is used. Thus, we would like to
verify the influence of growth on profitability in REITs. The system-GMM estimator is not
19 We acknowledge Roodman (2006) for writing the code “xtabond2” of system-GMM for Stata and making it
available to all users. A similar code “xtdpdsys” is now available in Stata 11.
Dependent Variable: Asset Growth(t)
p-values
Profit rate (t-1) 0.0297*** 0.0108
AR(1) z-stat and p-value -4.99 0.0000
AR(2) z-stat and p-value -0.82 0.4110
No.of instruments 44
Hansen J stat 29.47
d.f and p-value 27 0.3380
Observations 1051
This table presents the GMM-sys regression results for the profit indicator RoAA
and growth indicator of total asset growth.
*** refers to the statistical significance at 1% level.

41
appropriate here as it is difficult to find suitable instruments for growth rates as they are
quite random. Hence, we estimate the following regression using fixed effects:
RoAAi,t = β0 + β1(TA_Gri,t-1) + β2(Controli,t-1) + εi,t
We use similar control variables as before. The fixed-effects regression results (table
4.9) indicate a small but positive and significant influence of growth on profit rates.
According to the estimates, an increase in the growth rate of assets of 1% over the
period t-1: t leads ceteris paribus to an increase in profit rate at time t of about 0.011%.
Thus, growth produces increasing returns that has a slight positive influence on
subsequent profit rates. Though our results show a positive association between firm
growth and profitability, the question of causality is yet to be determined.
Table 4.9: Fixed effect regression results- Effect of growth on profits
5. Conclusions
A plethora of empirical studies on firm growth have found evidence linking firm
growth to firm attributes such as size and age. Proving or disproving Gibrat‟s law has
been the hallmark of most of these growth studies. Previous studies have focused on
firm specific attributes in the manufacturing sector to explain the observed heterogeneity
of growth rates. This study provides econometric evidence on the relationship of firm
growth to firm specific attributes in the REIT sector using the GMM-system estimator
technique. We also look at the unresolved issue of growth and profitability using the
GMM estimator. System-GMM estimators are well suited for our study as it overcomes
problems of endogeneity, persistence and unobserved firm-specific effects.
Examining the growth characteristics of REITs, we find that high-growth REITs
are smaller and younger than other REITs. Also, new REIT growth is uneven and there
Dependent Variable: Profit (t)
Growth (t-1) 0.011***
R-squared overall 0.24
F-stat 15.24
p-value 0
Observations 1205
This table presents the fixed-effects estimate of
the effect of growth on profits.
*** refers to the statistical significance at 1% level.

42
are turning points in new REITs‟ growth path that may lead to growth stagnation or
growth reversals. New REITs that experience high growth in its early years are most
likely to survive longer, but sustained growth among REITs beyond five years is rare.
REITs failure rate declines with size and age and growth is conducive to further growth.
Looking at the growth strategies of REITs, we document that REITs achieve
growth in a number of different ways (organic, acquisition, development etc.) and the
pattern of growth differs across REITs based on demographic characteristics, financing
choices and ownership structure. The firm specific determinants of growth in REITs
include size, age, leverage and cash flow. We also document the influence of
management structure, management style and UPREIT status on firm growth. These
results are robust to different econometric methodologies.
Our results are in close agreement with the previous empirical findings. Our
findings support path dependency feature of firm growth (Coad, 2009). Gibrat‟s law that
postulates independence between firm growth and size is rejected and Jovanovic‟s
model that predicts a negative relationship between firm growth and age holds for our
sample. The inverse relationship between growth and leverage is consistent with many
capital structure studies. Our findings are consistent with the idea that small and young
firms that face liquidity and financing constraints are more sensitive to the availability of
cash flow. We also identify a small positive effect of profit rates on subsequent growth
and the influence of growth on profit rates. The results are also valid for different
specifications that account for ownership structure and REIT structure.
Firm growth in REITs has never been examined in the existing literature like we
have done by documenting the growth characteristics and its determinants. This study
is a starting point that provides a better understanding of the phenomenon of firm
growth in the REIT sector. We study the growth dynamics of REITs by mapping the
growth trajectories and growth persistency in young REITs. This study makes an
empirical contribution to the growth literature by finding the organizational determinants
that are found to be most important for REITs‟ growth. Our empirical findings should be
treated as a new beginning to develop a more complex model that incorporates other
managerial determinants to REITs‟ growth. This study also contributes to the literature
of firm growth and profitability.
This study has implications for managers and investors alike. This would help
managers to make investment decisions that would be beneficial to improve the firm
value for the shareholders. This would also help managers to make prudent growth
strategies depending on the firm resources. Investors can also benefit from this study in
terms of making better informed investment decisions. The study has some implications
for regulators who can frame policies to help firms survive in difficult market and also to
safeguard the interests of the investors. For academicians, this study will also give a

43
push for growth studies in the real estate sector and open the floodgates for further
research on issues like corporate governance, capital structure, etc., that would
incorporate firm growth as an important parameter.
The present study is not without limitations. Firm growth is a complex
phenomenon and it can‟t be explained by one particular dimension or determinant.
Since, we focus on the firm specific determinants only, the characteristics of managerial
traits like work experience, educational background and motivations are not considered
in this present study. Though these managerial attributes are equally important to a
firm‟s growth, we reserve his issue for further research in the future. Also, we focus our
study to empirical investigations of growth in publicly listed equity REITs. Public REITs
may face certain pressure from investors to grow larger as is the case with most of the
publicly listed firms. Thus, in our sample larger firms may be overrepresented leading to
certain sample bias. We also do not investigate the interlinks between the different
growth indicators.
In future, the effect of external growth strategies (acquisition vs. development) on
the performance of small and young REITs that face financial constraints can be studied
further. An in-depth empirical examination of the differential impact of various growth
strategies on growth and performance can be undertaken. Given the importance of
managers in new venture growth, inclusion of manger‟s characteristics into our study
would be more fruitful. The relationship between firm asset growth and subsequent
stock returns is another area to look into. We can study if asset growth rates are strong
predictors of future abnormal stock returns. Finally, our research is a beginning step to
the firm growth study in REITs, even though it focuses on REITs growth in USA. The
application of the results to other emerging REIT markets would provide further insights
into growth dynamics of REITs worldwide.

44
Bibliography
Almus M and Nerlinger E A (1999). “Growth of New Technology-based firms: Which factors
matter?”, Small business economics 13(2), 141-154
Almus M and Nerlinger E (2000). “Testing Gibrat‟s Law for young firms – empirical results for
West Germany”, Small Business Economics, 15(1), 1–12.
Ambrose B W, Ehrlich S R, Hughes W T and Watcher S M (2000). “REIT economies of scale:
fact or fiction?”, Journal of real estate finance and economics, 20:2, 211-224
Ambrose B W and Linneman P D (2001). “REIT organizational structure and operating
characteristics”, Journal of real estate research, 21:141-162.
An H, Cook D O and Zumpano L V (2011). “Corporate transparency and Firm growth: Evidence
from Real Estate Investment Trusts”, Real estate economics 39(3): 429-454.
Ardishvili A, Cardozo S, Harmon, S and Vadakath S (1998). “Towards a theory of new venture
growth”, Paper presented at the 1998 Babson Entrepreneurship Research Conference, Ghent,
Belgium.
Arellano M and Bond S (1991). “Some tests of specification for panel data: Monte Carlo
evidence and an application to employment equations”. The Review of Economic Studies 58
(2), 277–297.
Arellano M and Bover O (1995). “Another look at the instrumental variable estimation of error-
components models”. Journal of Econometrics 68, 29–51.
Audretsch D B, Klomp L, Sanatarelli E and Thurick A R (2004). "Gibrat's Law: Are the Services
Different?" Review of Industrial Organization 24(3): 301-324.
Auerbach A J (1985). “Real determinants of corporate leverage'', in Friedman B M (Ed.),
Corporate Capital Structures in the United States, University of Chicago Press, Chicago, IL, pp:
301-24.
Ayyagari M, Demirgüç-Kunt A and Maksimovic V (2008). "How Important Are Financing Constraints? The Role of Finance in the Business Environment," World Bank Economic Review, Oxford University Press, vol. 22(3), pp 483-516.
Balatagi B H and Wu P X (1999). “Unequally spaced panel data regressions with AR(1)
disturbances”, Econometric theory, 15:814-823.
Baumol W J (1959). “Business Behaviour, Value and Growth”, Harcout Brace and World, New
York.

45
Beaudry C and G M P Swann (2009). “Firm growth in industrial clusters of the United Kingdom”, Small Business Economics, 32:409–424
Birch D L (1981). “Who Creates Jobs?” The Public Interest 65, 3-14.
Blundell R and S Bond (1998). “Initial Conditions and Moment Restrictions in Dynamic Panel Data Models”, Journal of Econometrics 87, 115–143.
Bottazzi G and Secchi A (2003). “Common properties and sectoral specificities in the dynamics
of US manufacturing companies”, Review of Industrial Organization, 23, 217–32.
Brounen D, Eichholtz P M A and Kanters P M (2000). “The effects of property development activities on the performance of REITs”, Real estate finance, 16(4), 17-22.
Buederal J, Preisendoerfer P, and Ziegler R (1992). “Survival chances of newly founded business organizations”, American Sociological Review, 57: 227-242.
Cannon S E and Vogt S C (1995). “REITs and their management: An examination of
organizational structure, performance and management compensation”, Journal of real estate
research, 10:297-317.
Capozza D and Seguin P (2000). “Debt, agency and management contracts in REITs: The
external advisor puzzle”, Journal of real estate finance and economics, 20, 91-116.
Capozza D and Seguin P (2001). “Debt without taxes: Capital structure in REITs”, Real estate
finance, 18,1: 38-46
Chandler A (1992). “What is a Firm? A Historical Perspective”, European Economic Review, 36,
483-492.
Churchill C and Lewis VL (1983). “The five stages of small business growth”, Harvard Business
Review 61 (3), 30–50.
Coad A (2009). “The Growth of Firms: A Survey of Theories and Empirical Evidence” Edward
Elgar: Cheltenham.
Davidsson P (1989). “Continued Entrepreneurship and small firm growth,” Ph.D. dissertation,
Stockholm school of economics.
Davidsson P and Wiklund J (2000). “Conceptual and empirical challenges in the study of firms,"
in The Blackwell handbook of Entrepreneurship, edited by D. Sexton, and H. Landstrm, pp. 26-
44.
Davidsson P and Achtenhagen L and Naldi L (2005). “Research on Small Firm Growth: A
Review”. In: European Institute of Small Business.
Davidsson P, Delmar F, and Wiklund J (2006). “Entrepreneurship and the growth of firms”.
Cheltenham, UK: Edward Elgar Publishing.

46
Del Monte A and Papagni E (2003). “R&D and the growth of firms: empirical analysis of a panel
of Italian firms”, Research policy, 32(6), pp 1003-1014.
Delmar F (1997). “Measuring growth: methodological considerations and empirical results. In:
Donckels, R., Miettinen, A. (Eds.), Entrepreneurship and SME Research: On its Way to the Next
Millennium, pp.199–216.
Delmar F, Davidsson P and Gartner W B (2003). “Arriving at the high-growth firm”, Journal of
Business Venturing, 18(2), 189-216.
Delmar F and Wiklund J (2008). “The Effect of Small Business Managers‟ Growth Motivation on
Firm Growth: A Longitudinal Study”, Entrepreneurship: Theory & Practice, 32(3), 437-457.
Dunne P and Hughes A (1994). “Age, size, growth and survival: UK companies in the late
1980‟s”, Journal of Industrial Economics, 42(2),115–140.
Evans D S (1987). “The relationship between firm growth, size and age: Estimates for 100
manufacturing industries”, The journal of industrial economics, Vol. 35, no.4, 567-581
Feng Z, Ghosh C and Sirmans C F (2007). “On the capital structure of Real Estate Investment
Trusts (REITs)”, Journal of Real estate finance and economics, 34:81-105
Friday H S, Sirmans G S and Conver C M (1999). “Ownership structure and the value of the
firm: the case of REITs”, Journal of Real Estate Research 17(1):71–90.
Gallagher C and P Miller (1991). “New Fast growing Companies Create Jobs”, Long Range
Planning 24: 96–101
Garnsey E, Stam E and Heffernan P (2011). “New Firm Growth: Exploring processes and
paths”, Industry and Innovation, Vol.13, No.1, 1-20
Geroski P (1995). “What Do We Know About Entry?”, International Journal of Industrial
Organization 13(4), 421–440
Geroski P A (1999). “The growth of firms in theory and in practice”. CEPR discussion paper
2092
Ghosh C and Sirmans C F (2003). “Board composition, ownership structure and performance:
evidence from real estate investment trusts”, Journal of Real Estate Finance and Economics
26(3), 283–314.
Gibrat R (1931). “Les in´egalit´es ´economiques”, Paris: Librairie du Receuil Sirey.
Gilbert B, McDougall P and Audretsch D (2006). “New venture growth: a review and extension”,
Journal of Management, Vol. 32 No. 6, 926-50.
Glancey K (1998). “Determinants of growth and profitability in small entrepreneurial firms”,
International Journal of entrepreneurship behavior and research, 4(1): 18-27.

47
Greiner L E (1972). “Evolution and revolution as organizations grow”, Harvard Business Review,
July–August, pp. 37–46.
Hall B H (1987). “The Relationship between Firm Size and Firm Growth in the U.S.
Manufacturing Sector”, Journal of Industrial Economics 35 (4), 583-600.
Han B, (2006). “Insider Ownership and Firm Value: Evidence from Real Estate Investment
Trusts”, Journal of Real Estate Finance and Economics, vol. 32(4), 471-493.
Hardin W G and Hill M (2008). “REIT Dividend determinants: Excess dividends and capital
markets”, Real estate economics, Vol 36 (2): 349-369
Hardin W G, Highfield M, Hill M and Kelly G, (2009). "The Determinants of REIT Cash
Holdings," The Journal of Real Estate Finance and Economics, vol. 39(1), 39-57
Hart P E (1962). “The Size and Growth of Firms”, Economica 29 (113), 29-39.
Hart P E (2000). “Theories of Firms‟ growth and the generation of jobs”, Review of industrial
organization, 17: 229-248.
Hart P E and Prais S J (1956). “The Analysis of Business Concentration: A Statistical
Approach”, Journal of the Royal Statistical Society 119, 150-191.
Hartzell J C, Sun L and Titman S (2006). “The Effect of Corporate Governance on Investment:
Evidence from Real Estate Investment Trusts”, Real Estate Economics 34: 343–376.
Headd B (2003). “Redefining Business Success: Distinguishing Between Closure and Failure”
Small Business Economics, v. 21, p. 51-61.
Headd B and Kirchhoff B (2007). “Small business growth: Searching for stylized facts”. Small
Business Administration, Office of Advocacy. http://archive.sba.gov/advo/research/rs311tot.pdf
Himmelberg C, Hubbard G, Palia D (1999). “Understanding the determinants of managerial
ownership and the link between ownership and performance”, Journal of Financial Economics
53:353–384
Hymer S and Pashigan P (1962). “Firm size and rate of growth”, The journal of political
economy, Vol. 70, No. 6, 556-569.
Huynh K P and Petrunia R J (2010). “Age effects, leverage and firm growth”, Journal of
Economic Dynamics and Control, 34:1003-1013
Jensen M and Meckling W (1976). “Theory of the firm: managerial behavior, agency costs, and
ownership structure”, Journal of Financial Economics, 3:305–360
Jovanovic B (1982). “Selection and evolution of industry”. Econometrica Vol 50, No. 3
48
Kumar M S (1985). “Growth, Acquisition Activity and Firm Size: Evidence from the United
Kingdom”, Journal of Industrial Economics, 33 (3), 327-338.
Lang L, Ofek E, Stulz R M (1996). “Leverage, investment and firm growth”, Journal of financial
economics 40: 3-29.
Lindenberg E B and Ross S A (1981). “Tobin‟s q ratio and industrial organization”, Journal of
Business 54, 1-32.
Mansfield E, (1962). “Entry, Gibrat's Law, Innovation, and the Growth of Firms”, American
Economic Review, 52: 1031-105 1.
Markman G D and Gartner W B (2002). “Is extraordinary growth profitable? A study of Inc. 500
high growth companies”, Entrepreneurship theory and practice, 27(1), 65-75
McConnell J and Servaes H (1990). “Additional evidence on equity ownership and corporate
value”, Journal of Financial Economics 27:595–612
McKelvie A and Wiklund J (2010). “Advancing Firm Growth Research: A Focus on Growth Mode
Instead of Growth Rate”. Entrepreneurship Theory and Practice, 34: 261–288.
Morck R, Shleifer and Vishny R (1988). “Management ownership and market valuation: an
empirical analysis”, Journal of Financial Economics 20:293–315
Mueller D (1972). “A Life Cycle Theory of the Firm”, Journal of Industrial Economics, 20, 199-
219.
Myers S (1977). “Determinants of corporate borrowing”, Journal of Financial Economics, 5: 147-
175.
Ott S H, Riddiough T J and Yi H C (2005). “Finance, Investment and Investment performance:
Evidence from the REIT sector”, Real estate economics, V33, 1:203-235.
Peng M W and Heath P S (1996). “The growth of the firm in planned economies in transition:
Institutions, organizations and strategic choice”, Academy of Management review, 21(2), 492-
528.
Penrose E (1959). “The Theory of the Growth of the Firm”. Oxford: Oxford University Press.
Perfect S B, Wiles K W (1994). “Alternative constructions of Tobin‟s Q: an empirical
comparison”, Journal of Empirical Finance 1:313–341
Rajan R G and Zingales L (1998). “Financial dependence and growth”, The American economic
review. 88, 559-586

49
Roodman D (2006). “How to do xtabond2: An introduction to difference and system GMM in
Stata”, Stata Journal 9(1): 86-136.
Ross S and Klein R (1994). “Real estate investment trusts for the 1990s”, Real estate finance
journal, Summer, 37-44
Shepherd D and Wiklund J (2009). “Are we comparing apples with apples or apples with
oranges? Appropriateness of knowledge accumulation across growth studies",
Entrepreneurship Theory and Practice, 33(1), 105-123.
Stinchcombe A L (1965). “Social structure and organizations”, In J G March (Ed.), Handbook of
Organization, 142-193, Chicago: RandMcNally.
Storey D J (1994). “Understanding the small business sector”, Routledge Press, London.
Sutton J (1997). “Gibrat‟s Legacy,” Journal of Economic Literature, vol. 35, pp. 40-59.
Titman S and Wessels R (1988). “Determinants of capital structure choice”, Journal of finance,
Vol XLIII, No. 1: 1-19
Weinzimmer L G, Nystron P C and Freeman S J (1998). “Measuring organizational growth:
issues, consequences and guidelines”. Journal of Management 24 (2), 235–262.
Wiklund J. (1998). “Small Firm Growth and Performance: Entrepreneurship and Beyond”.
Jönköping International Business School, Jönköping
Wiklund J, Patzelt H and Shepherd D (2009). “Building an integrative model of small business
growth”, Small Business Economics, 32(4), 351-374.
Yasuda T (2005). “Firm growth, size, age and behaviour in Japanese manufacturing”. Small
Business Economics, 24(1): 1-15
Zhou H and De Wit G (2009). “Determinants and Dimensions of Firm Growth” SCALES EIM
Research Reports (H200903). Available at SSRN: http://ssrn.com/abstract=1443897 or
doi:10.2139/ssrn.1443897