understanding and measuring user engagement and attention ...mounia/papers/wsdm2016.pdf ·...
TRANSCRIPT
Understanding and Measuring User Engagement andAttention in Online News Reading
Dmitry Lagun∗
Mounia LalmasYahoo Labs
ABSTRACTPrior work on user engagement with online news sites iden-tified dwell time as a key engagement metric. Whereas onaverage, dwell time gives a reasonable estimate of user en-gagement with a news article, it does not capture user en-gagement with the news article at sub-document level nor itallows to measure the proportion of article read by the user.
In this paper, we analyze online news reading patternsusing large-scale viewport data collected from 267,210 pageviews on 1,971 news articles on a major online news website.We propose four engagement metrics that, unlike dwell time,more accurately reflect how users engage with and attend tothe news content. The four metrics capture different levelsof engagement, ranging from bounce to complete, providingclear and interpretable characterizations of user engagementwith online news. Furthermore, we develop a probabilisticmodel that combines both an article textual content andlevel of user engagement information in a joint model. In ourexperiments we show that our model, called TUNE, is ableto predict future level of user engagement based on textualcontent alone and outperform currently available methods.
1. INTRODUCTIONUser engagement has been coined as the “emotional, cog-
nitive and behavioral connection that exists between a userand a resource” [5]. Online content providers such as newsportals constantly seek to attract large shares of online at-tention by keeping their users engaged. A common challengeis to identify which aspects of the online interaction influ-ence user engagement the most. We focus on one componentof engagement with online content, “stickiness”, concernedwith users “spending time” on a content provider site.
This component of engagement is usually described as acombination of cognitive processes such as focused attention,affect and interest, traditionally measured using surveys [29].It is also measured through large-scale analytical metrics
∗Work done while a student at Emory University, and aspart of a Yahoo Faculty Research and Engagement Program.
Permission to make digital or hard copies of all or part of this work for personal orclassroom use is granted without fee provided that copies are not made or distributedfor profit or commercial advantage and that copies bear this notice and the full citationon the first page. Copyrights for components of this work owned by others than theauthor(s) must be honored. Abstracting with credit is permitted. To copy otherwise, orrepublish, to post on servers or to redistribute to lists, requires prior specific permissionand/or a fee. Request permissions from [email protected].
WSDM’16, February 22 - 25, 2016, San Francisco, CA, USAc© 2016 Copyright held by the owner/author(s). Publication rights licensed to ACM.
ISBN 978-1-4503-3716-8/16/02. . . $15.00
DOI: http://dx.doi.org/10.1145/2835776.2835833
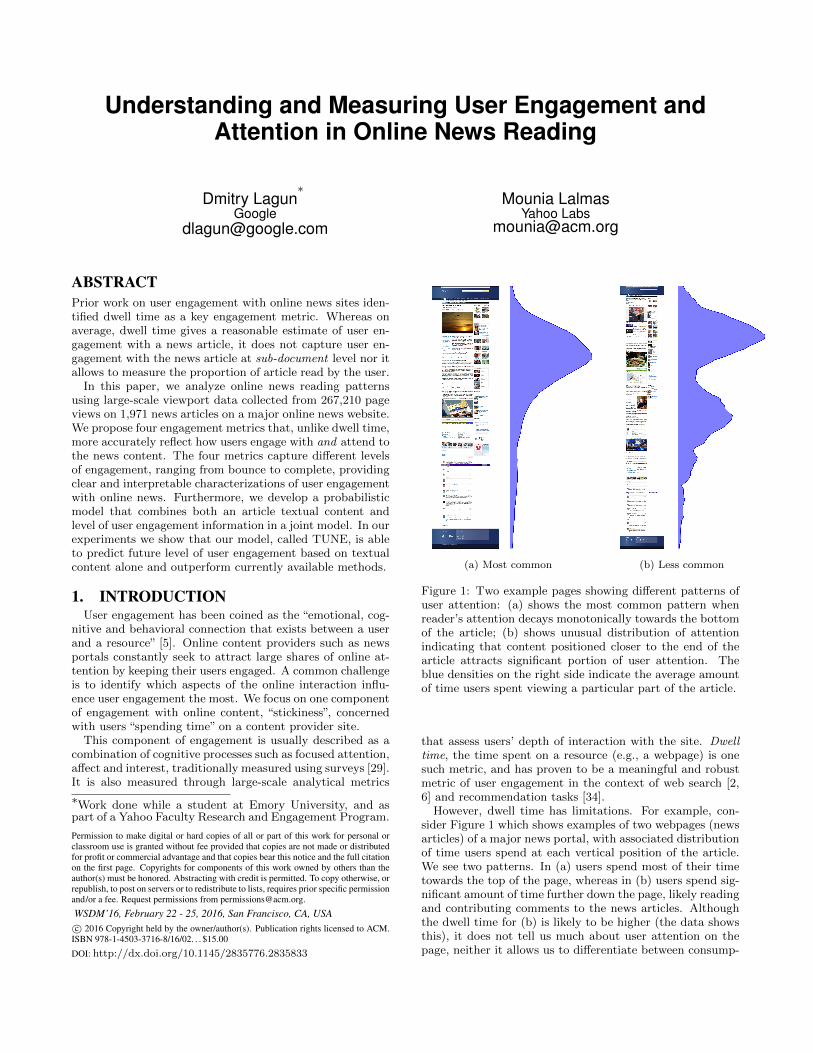
(a) Most common (b) Less common
Figure 1: Two example pages showing different patterns ofuser attention: (a) shows the most common pattern whenreader’s attention decays monotonically towards the bottomof the article; (b) shows unusual distribution of attentionindicating that content positioned closer to the end of thearticle attracts significant portion of user attention. Theblue densities on the right side indicate the average amountof time users spent viewing a particular part of the article.
that assess users’ depth of interaction with the site. Dwelltime, the time spent on a resource (e.g., a webpage) is onesuch metric, and has proven to be a meaningful and robustmetric of user engagement in the context of web search [2,6] and recommendation tasks [34].
However, dwell time has limitations. For example, con-sider Figure 1 which shows examples of two webpages (newsarticles) of a major news portal, with associated distributionof time users spend at each vertical position of the article.We see two patterns. In (a) users spend most of their timetowards the top of the page, whereas in (b) users spend sig-nificant amount of time further down the page, likely readingand contributing comments to the news articles. Althoughthe dwell time for (b) is likely to be higher (the data showsthis), it does not tell us much about user attention on thepage, neither it allows us to differentiate between consump-
tion patterns with similar dwell time values. Using viewporttime allows us to do exactly this.
In this work we build upon this observation and analyzepatterns in online news reading using viewport data. View-port is defined as the position of the webpage that is visibleat any given time to the user. Such data allows us to mea-sure aspects of user engagement with news articles that arenot measurable with dwell time, such as the proportion ofarticle read by the user or the amount of time spent at eachpart of the article. Furthermore, we employ viewport datato develop user engagement metrics that can measure towhat extent the user interaction with a news article followsthe signature of positive user engagement, i.e., users readmost of the article and read/post/reply to a comment. Un-like dwell time, our metrics do not depend on the amount oftextual content in the article but, instead, on the proportionof article read by users making it easier to compare articleswith different amount of content.
We take one step further and develop a probabilistic modelthat accounts for both the extent of the engagement andthe textual topic of the article. In contrast with previouslyexplored text-only approaches, our model utilizes the view-port behavioral data, that enables the model to learn a jointmapping between textual topic and user engagement level.Through our experiments we demonstrate that such modelis able to predict future level of user engagement with a newsarticle significantly better than currently available methods.In addition, our model can be used, e.g. by the news ed-itors, as an exploratory tool to investigate which textualtopics correspond to higher engagement levels.
Our paper makes the following contributions:
• an analysis of large-scale viewport data in news read-ing, including the description of typical patterns ofnews reading by the online users of a large news portal;
• a family of user engagement levels that reflects userattention during news article reading; and
• a joint model of news article textual content and levelof user engagement.
2. BACKGROUND AND MOTIVATIONSeveral works looked at the relationship between dwell
time and properties of webpages. A study [27] asking par-ticipants to provide explicit feedback about the interesting-ness of news articles they read revealed a strong tendencyto spend more time on interesting articles rather than onuninteresting ones, similarly to that reported in [10, 14].However, only a very weak correlation between the lengthof articles and associated reading times was found, indicat-ing that most articles were only read in parts, not in theirentirety. Recently, [34] showed that article length correlatedwith dwell time, but only to some extent. They observeda large variance for articles longer than 1,000 words, sug-gesting that users may have a maximum “time-budget” toconsume an article. The presence of videos and photos, andthe article genre (e.g. politics versus food) had an effect ondwell time [34]. Works looking at webpage aesthetics showedthat layout and textual features [33], and that a combinationof content and dynamic features (e.g. page size or time todownload all URLs) [22] had an effect on page dwell time.Finally, [18] successfully incorporated webpage readabilitylevel and search query topic into predicting dwell time.
The above and other works showed dwell time to be strongsignal of user interest, an important component of user en-gagement [3, 4, 24]. Their aim was also to identify aspectsof the webpage that make users spend time on it. How-ever, dwell time does not capture where on the page usersare focusing, namely the user attention. It just tells us thatusers spend time on it and this may be caused by the pageproperties such as its length, its genre, etc. Hence the sug-gestion of using other measurements to study user attention,an important component of user engagement [5].
Studies of user attention using eye-tracking provided nu-merous insights about typical content examination strate-gies, such as top to bottom scanning of web search results [23].In the context of news reading, [4] showed gaze to be reli-able indicator of interestingness and to correlate with self-reported engagement metrics, such as focused attention andaffect. However, due to the high cost of eye-tracking stud-ies, a considerable amount of research was devoted to find-ing more scalable methods of attention measurement, whichwould allow monitoring attention of online users at largescale. Mouse cursor tracking was proposed as a cheap alter-native to eye-tracking, and the relationship between cursorand gaze was studied [28]. Mouse cursor position was shownto be aligned with gaze position, when users performed aclick or a pointing action in many search contexts.
Mouse cursor movement has been studied to inform var-ious types of user engagement with web content, in partic-ular to infer user interests in webpages [15]. For instance,[31] found that the ratio of mouse cursor movement to timespent on a webpage was a good indicator of how interestedusers were in the webpage content, and explored the extentto which cursor tracking can inform about whether usersare attentive to certain content when reading it, and whattheir experience was. Recently, [3] recorded the mouse cur-sor movements from users reading interesting versus non-interesting news articles, from which they generated cur-sor gesture patterns through unsupervised learning. Theyidentified several significant correlations between cursor be-haviour and the focused attention and affect engagementmetrics, and could predict with high accuracy user interestson the news articles based on the cursor gestures. Finally,[16, 19] showed that mouse cursor movements outperformdwell time in their ability to predict relevance ratings.
However, despite promising results on using mouse cursorfor measurement of user attention [28] in web search, it hasbeen shown that the extent of coordination between gazeand mouse cursor depends on the user task [9], e.g. texthighlighting, pointing or clicking. Moreover, it was found[9] that eye and cursor are poorly coordinated during cursorinactivity, hence limiting the utility of mouse cursor as anattention measurement tool in a news reading task, whereminimal pointing is required. Thus, we propose to use in-stead viewport time to study user attention.
Using viewport to measure the amount of time users spendon each portion of the webpage is not new. It was usedas an implicit feedback information to improve search re-sult ranking for subsequent search queries [8], to help elimi-nating position bias in search result examination, detectingbad snippets and improving search result ranking [20] andin document summarization [1]. Viewport time was suc-cessfully used on mobile devices to infer user interest at thesub-document level [17]. More recently, it was used for accu-rate measurement of search result examination on a mobile
phone and was helpful for the evaluation of rich informa-tional results that may lack active user interaction, such asclick [21]. Our work adds to this body of works, and exploresviewport time, as a coarse, but more robust instrument tomeasure user attention during news reading.
3. VIEWPORT DATAInformation about the amount of time online users spend
reading a particular portion of a news article can be mea-sured by tracking the position of user viewport. Similarlyto [21], we define viewport as the position of the webpageportion visible to the user at any given time.
To collect viewport data for our study, we used JavaScripttracking instrumentation that allowed us to track user scrollpositions, the size of the user browser viewport (width andheight), as well as the position of key page elements, such asarticle header, body and comment blocks. This informationallowed us to reconstruct the scrolling actions and calculatethe amount of time users spend at given portion of the newsarticle. Similar instrumentation was used in [1, 17, 20, 21].
We calculate the time a user spent viewing an article at avertical position y, or simply viewport time, as:
V iewportT ime(y) =
#scrolls∑i=1
ti · I(y ∈ Vi)
where ti is the time the user spent at the i-th scroll position,Vi is the viewport defined by the scroll offset and the sizeof the user browser window and I(·) is an indicator func-tion that evaluates to one if y falls inside of Vi, otherwise itevaluates to zero.
We analyze the viewport of a sample of data collectedduring one calendar month in 2013. We collected viewportdata for 267,210 page views on an online news website fromYahoo!. These page views include visits to 1,971 uniquenews articles. We ensured that each individual news articlereceived at least 10 page visits. Approximately 60% of thearticles in our dataset have user comments.
4. NEWS READING BEHAVIORWe take a holistic approach to analyze how users read
online news. First, we analyze the overall pattern of newsarticle examination represented by a distribution of the timeusers spend at each portion of the article. Then, we describeour findings on the effect of the article media componentson the attention of a news reader. Finally, to analyze se-quence of user actions (e.g., scroll), we apply a mixture ofMarkov chains model that enables us to identify commonnews article reading patterns from the viewport data.
4.1 Overall Pattern of User AttentionFirst, we analyze the overall pattern of news article exam-
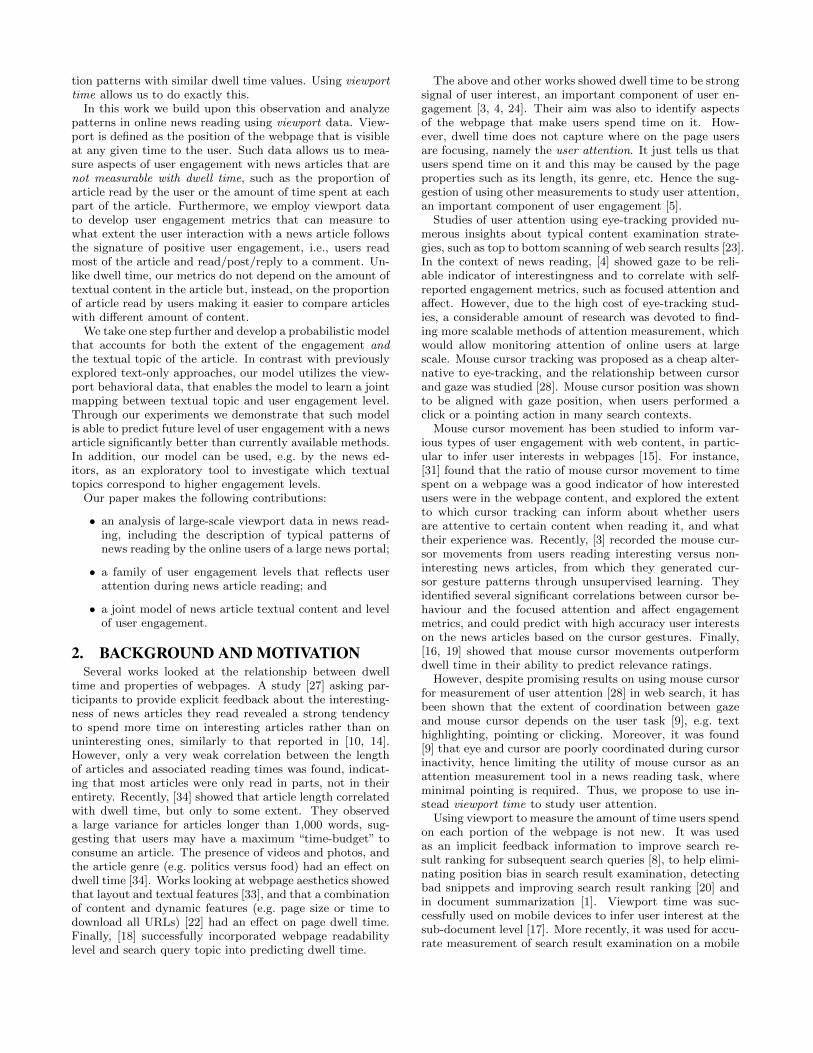
ination measured with viewport time. Figure 2 shows theviewport time distribution computed from all page viewsin our data. It has a bi-modal shape with the first peakoccurring at approximately 1000 px and the second, lesspronounced peak at 5000 px. This suggests that most pageviews have the viewport profile that falls between cases (a)and (b) of Figure 1. This also shows that on average userspends significantly smaller amount of time at lower scrollpositions – the viewport time decays towards the bottomof the page. The fact that users spend substantially less
Figure 2: Distribution of viewport time averaged across allpage views.
time reading seemingly equivalent amount of text (top ver-sus bottom of the article) may also explain the weak corre-lation between article length and the dwell time reported inseveral works [22, 27, 34].
Figure 2 provides us with an overall picture on how usersconsume the news articles; however, it tells us nothing aboutarticle reading dynamics, i.e., “how often do users skip por-tion of the article”. In Section 4.3, we attempt to answersuch questions, and analyze how users navigate through thenews article until they decide to leave the page.
4.2 Effect of Media ElementsWe now analyze the possible impact of image and video
on viewport time. We use non-parametric methods to esti-mate the distributions of viewport time conditioned on thepresence of image or video element on the page. Using aGaussian kernel density estimator we estimate the joint dis-tribution of four variables: viewport time T , viewport verti-cal position Y , presence of image element I and presence ofvideo element V . By fixing the values for some of the vari-ables and ensuring proper normalization (by numerical inte-gration) we can derive a conditional distribution of the othervariable(s). For example, if we are interested in the effect ofarticle images on viewport time at the same position, we cananalyze the differences between the conditional distributionsP (T |Y = y, I = 0, V = 0) and P (T |Y = y, I = 1, V = 0).
When expected viewport times are different across differ-ent conditions (e.g., video presence versus absence), we per-form the Kolmogorov-Smirnov (KS) test to establish statisti-cal significance of the observed difference D = supx |F1(x)−F2(x)|, where D is the test statistic, F1(x) and F2(x) are cu-mulative distributions under comparison. We compute theempirical distribution of viewport time by evaluating theappropriate condition distribution at fixed number of points(N = 200) that reasonably covers the support of viewporttime distribution ([0, 300] seconds).
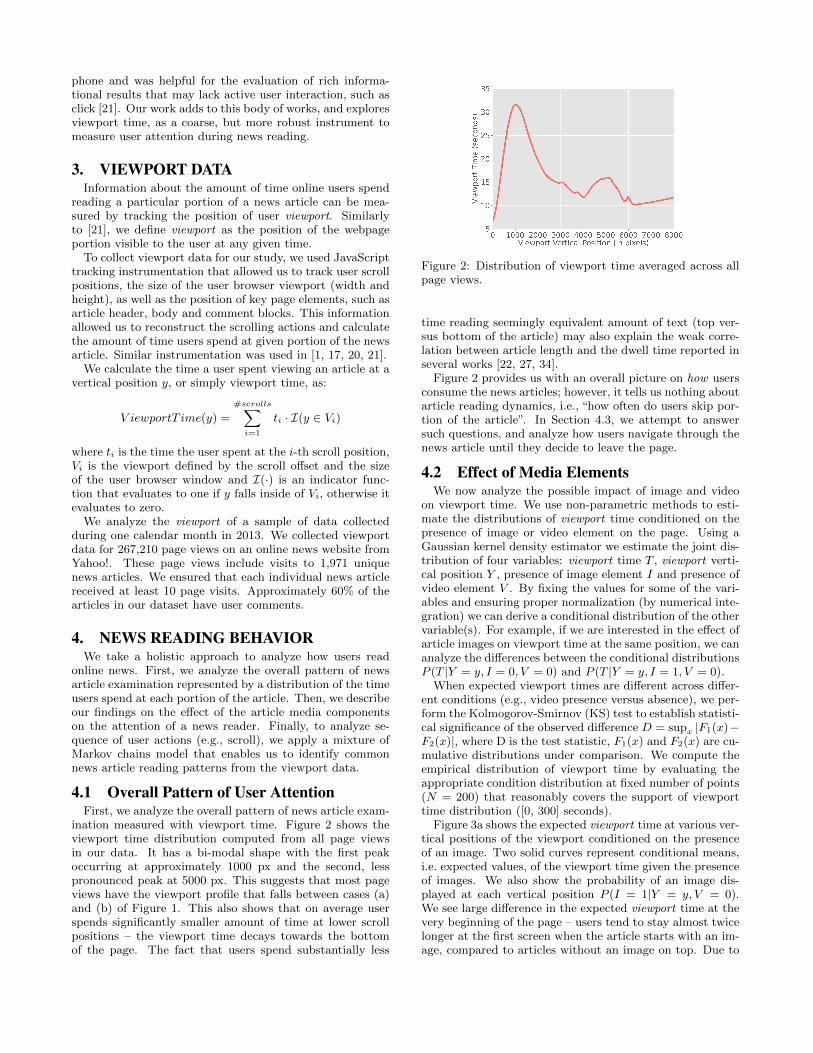
Figure 3a shows the expected viewport time at various ver-tical positions of the viewport conditioned on the presenceof an image. Two solid curves represent conditional means,i.e. expected values, of the viewport time given the presenceof images. We also show the probability of an image dis-played at each vertical position P (I = 1|Y = y, V = 0).We see large difference in the expected viewport time at thevery beginning of the page – users tend to stay almost twicelonger at the first screen when the article starts with an im-age, compared to articles without an image on top. Due to
(a) Image (b) Video
Figure 3: Effect of media elements on viewport time.
the large sample size, the KS-test shows significant differ-ences (p<0.001) at all vertical offsets. However, the peakvalue of the KS test statistic D is found near the article’stop, which is consistent with the difference in distributionmeans. Figure 3b shows the same as above, but with respectto video. Overall, the presence of image or video significantlyaffects viewport time in initial viewport.
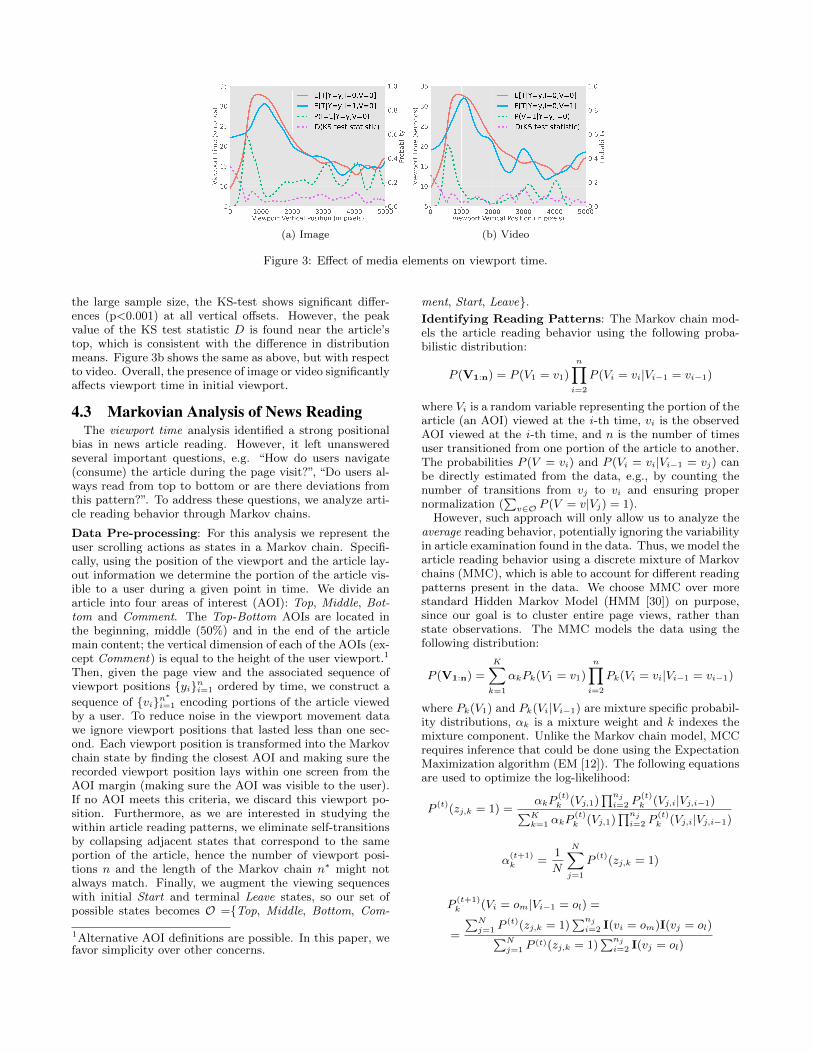
4.3 Markovian Analysis of News ReadingThe viewport time analysis identified a strong positional
bias in news article reading. However, it left unansweredseveral important questions, e.g. “How do users navigate(consume) the article during the page visit?”, “Do users al-ways read from top to bottom or are there deviations fromthis pattern?”. To address these questions, we analyze arti-cle reading behavior through Markov chains.
Data Pre-processing: For this analysis we represent theuser scrolling actions as states in a Markov chain. Specifi-cally, using the position of the viewport and the article lay-out information we determine the portion of the article vis-ible to a user during a given point in time. We divide anarticle into four areas of interest (AOI): Top, Middle, Bot-tom and Comment. The Top-Bottom AOIs are located inthe beginning, middle (50%) and in the end of the articlemain content; the vertical dimension of each of the AOIs (ex-cept Comment) is equal to the height of the user viewport.1
Then, given the page view and the associated sequence ofviewport positions {yi}ni=1 ordered by time, we construct a
sequence of {vi}n∗i=1 encoding portions of the article viewed
by a user. To reduce noise in the viewport movement datawe ignore viewport positions that lasted less than one sec-ond. Each viewport position is transformed into the Markovchain state by finding the closest AOI and making sure therecorded viewport position lays within one screen from theAOI margin (making sure the AOI was visible to the user).If no AOI meets this criteria, we discard this viewport po-sition. Furthermore, as we are interested in studying thewithin article reading patterns, we eliminate self-transitionsby collapsing adjacent states that correspond to the sameportion of the article, hence the number of viewport posi-tions n and the length of the Markov chain n∗ might notalways match. Finally, we augment the viewing sequenceswith initial Start and terminal Leave states, so our set ofpossible states becomes O ={Top, Middle, Bottom, Com-
1Alternative AOI definitions are possible. In this paper, wefavor simplicity over other concerns.
ment, Start, Leave}.Identifying Reading Patterns: The Markov chain mod-els the article reading behavior using the following proba-bilistic distribution:
P (V1:n) = P (V1 = v1)n∏i=2
P (Vi = vi|Vi−1 = vi−1)
where Vi is a random variable representing the portion of thearticle (an AOI) viewed at the i-th time, vi is the observedAOI viewed at the i-th time, and n is the number of timesuser transitioned from one portion of the article to another.The probabilities P (V = vi) and P (Vi = vi|Vi−1 = vj) canbe directly estimated from the data, e.g., by counting thenumber of transitions from vj to vi and ensuring propernormalization (
∑v∈O P (V = v|Vj) = 1).
However, such approach will only allow us to analyze theaverage reading behavior, potentially ignoring the variabilityin article examination found in the data. Thus, we model thearticle reading behavior using a discrete mixture of Markovchains (MMC), which is able to account for different readingpatterns present in the data. We choose MMC over morestandard Hidden Markov Model (HMM [30]) on purpose,since our goal is to cluster entire page views, rather thanstate observations. The MMC models the data using thefollowing distribution:
P (V1:n) =
K∑k=1
αkPk(V1 = v1)
n∏i=2
Pk(Vi = vi|Vi−1 = vi−1)
where Pk(V1) and Pk(Vi|Vi−1) are mixture specific probabil-ity distributions, αk is a mixture weight and k indexes themixture component. Unlike the Markov chain model, MCCrequires inference that could be done using the ExpectationMaximization algorithm (EM [12]). The following equationsare used to optimize the log-likelihood:
P (t)(zj,k = 1) =αkP
(t)k (Vj,1)
∏nj
i=2 P(t)k (Vj,i|Vj,i−1)∑K
k=1 αkP(t)k (Vj,1)
∏nj
i=2 P(t)k (Vj,i|Vj,i−1)
α(t+1)k =
1
N
N∑j=1
P (t)(zj,k = 1)
P(t+1)k (Vi = om|Vi−1 = ol) =
=
∑Nj=1 P
(t)(zj,k = 1)∑nj
i=2 I(vi = om)I(vj = ol)∑Nj=1 P
(t)(zj,k = 1)∑nj
i=2 I(vj = ol)
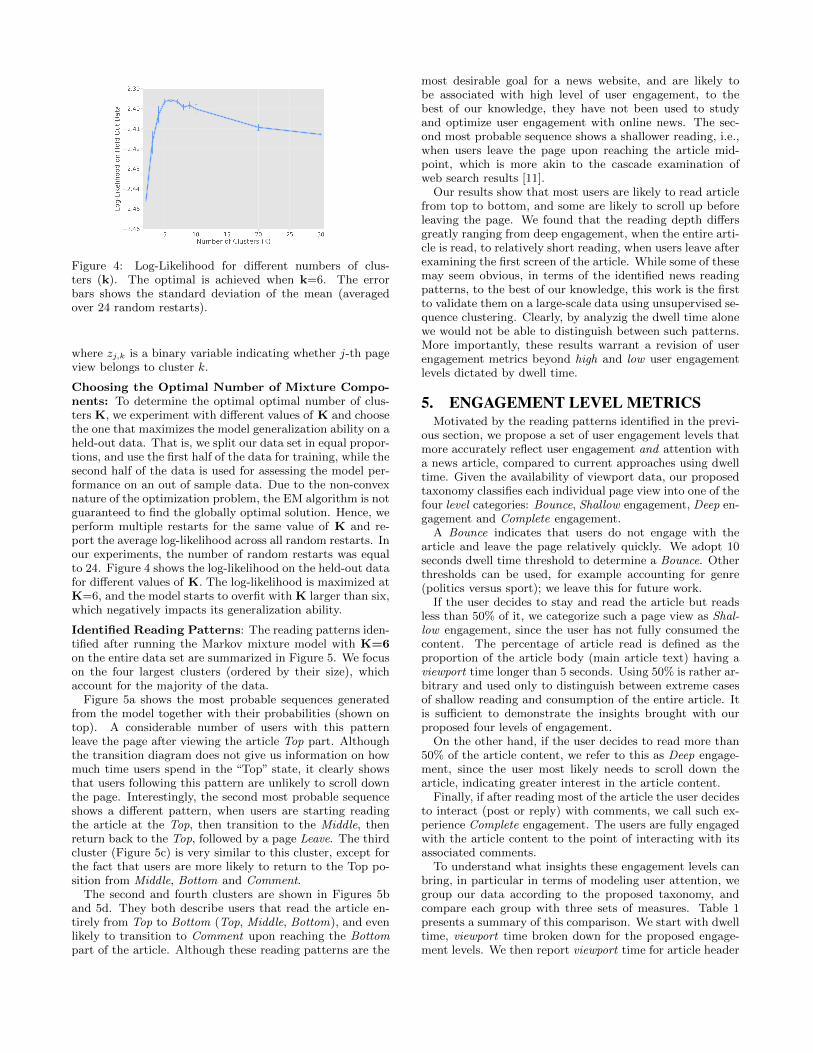
Figure 4: Log-Likelihood for different numbers of clus-ters (k). The optimal is achieved when k=6. The errorbars shows the standard deviation of the mean (averagedover 24 random restarts).
where zj,k is a binary variable indicating whether j-th pageview belongs to cluster k.
Choosing the Optimal Number of Mixture Compo-nents: To determine the optimal optimal number of clus-ters K, we experiment with different values of K and choosethe one that maximizes the model generalization ability on aheld-out data. That is, we split our data set in equal propor-tions, and use the first half of the data for training, while thesecond half of the data is used for assessing the model per-formance on an out of sample data. Due to the non-convexnature of the optimization problem, the EM algorithm is notguaranteed to find the globally optimal solution. Hence, weperform multiple restarts for the same value of K and re-port the average log-likelihood across all random restarts. Inour experiments, the number of random restarts was equalto 24. Figure 4 shows the log-likelihood on the held-out datafor different values of K. The log-likelihood is maximized atK=6, and the model starts to overfit with K larger than six,which negatively impacts its generalization ability.
Identified Reading Patterns: The reading patterns iden-tified after running the Markov mixture model with K=6on the entire data set are summarized in Figure 5. We focuson the four largest clusters (ordered by their size), whichaccount for the majority of the data.
Figure 5a shows the most probable sequences generatedfrom the model together with their probabilities (shown ontop). A considerable number of users with this patternleave the page after viewing the article Top part. Althoughthe transition diagram does not give us information on howmuch time users spend in the “Top” state, it clearly showsthat users following this pattern are unlikely to scroll downthe page. Interestingly, the second most probable sequenceshows a different pattern, when users are starting readingthe article at the Top, then transition to the Middle, thenreturn back to the Top, followed by a page Leave. The thirdcluster (Figure 5c) is very similar to this cluster, except forthe fact that users are more likely to return to the Top po-sition from Middle, Bottom and Comment.
The second and fourth clusters are shown in Figures 5band 5d. They both describe users that read the article en-tirely from Top to Bottom (Top, Middle, Bottom), and evenlikely to transition to Comment upon reaching the Bottompart of the article. Although these reading patterns are the
most desirable goal for a news website, and are likely tobe associated with high level of user engagement, to thebest of our knowledge, they have not been used to studyand optimize user engagement with online news. The sec-ond most probable sequence shows a shallower reading, i.e.,when users leave the page upon reaching the article mid-point, which is more akin to the cascade examination ofweb search results [11].
Our results show that most users are likely to read articlefrom top to bottom, and some are likely to scroll up beforeleaving the page. We found that the reading depth differsgreatly ranging from deep engagement, when the entire arti-cle is read, to relatively short reading, when users leave afterexamining the first screen of the article. While some of thesemay seem obvious, in terms of the identified news readingpatterns, to the best of our knowledge, this work is the firstto validate them on a large-scale data using unsupervised se-quence clustering. Clearly, by analyzig the dwell time alonewe would not be able to distinguish between such patterns.More importantly, these results warrant a revision of userengagement metrics beyond high and low user engagementlevels dictated by dwell time.
5. ENGAGEMENT LEVEL METRICSMotivated by the reading patterns identified in the previ-
ous section, we propose a set of user engagement levels thatmore accurately reflect user engagement and attention witha news article, compared to current approaches using dwelltime. Given the availability of viewport data, our proposedtaxonomy classifies each individual page view into one of thefour level categories: Bounce, Shallow engagement, Deep en-gagement and Complete engagement.
A Bounce indicates that users do not engage with thearticle and leave the page relatively quickly. We adopt 10seconds dwell time threshold to determine a Bounce. Otherthresholds can be used, for example accounting for genre(politics versus sport); we leave this for future work.
If the user decides to stay and read the article but readsless than 50% of it, we categorize such a page view as Shal-low engagement, since the user has not fully consumed thecontent. The percentage of article read is defined as theproportion of the article body (main article text) having aviewport time longer than 5 seconds. Using 50% is rather ar-bitrary and used only to distinguish between extreme casesof shallow reading and consumption of the entire article. Itis sufficient to demonstrate the insights brought with ourproposed four levels of engagement.
On the other hand, if the user decides to read more than50% of the article content, we refer to this as Deep engage-ment, since the user most likely needs to scroll down thearticle, indicating greater interest in the article content.
Finally, if after reading most of the article the user decidesto interact (post or reply) with comments, we call such ex-perience Complete engagement. The users are fully engagedwith the article content to the point of interacting with itsassociated comments.
To understand what insights these engagement levels canbring, in particular in terms of modeling user attention, wegroup our data according to the proposed taxonomy, andcompare each group with three sets of measures. Table 1presents a summary of this comparison. We start with dwelltime, viewport time broken down for the proposed engage-ment levels. We then report viewport time for article header
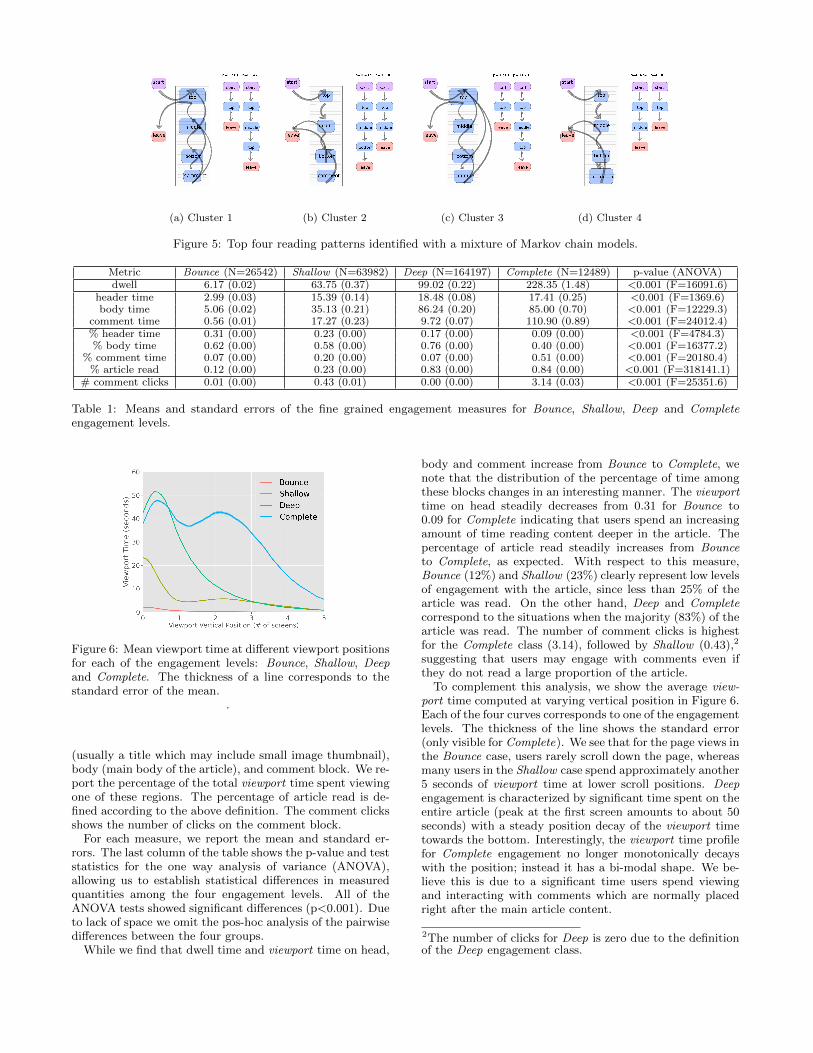
(a) Cluster 1 (b) Cluster 2 (c) Cluster 3 (d) Cluster 4
Figure 5: Top four reading patterns identified with a mixture of Markov chain models.
Metric Bounce (N=26542) Shallow (N=63982) Deep (N=164197) Complete (N=12489) p-value (ANOVA)dwell 6.17 (0.02) 63.75 (0.37) 99.02 (0.22) 228.35 (1.48) <0.001 (F=16091.6)
header time 2.99 (0.03) 15.39 (0.14) 18.48 (0.08) 17.41 (0.25) <0.001 (F=1369.6)body time 5.06 (0.02) 35.13 (0.21) 86.24 (0.20) 85.00 (0.70) <0.001 (F=12229.3)
comment time 0.56 (0.01) 17.27 (0.23) 9.72 (0.07) 110.90 (0.89) <0.001 (F=24012.4)% header time 0.31 (0.00) 0.23 (0.00) 0.17 (0.00) 0.09 (0.00) <0.001 (F=4784.3)% body time 0.62 (0.00) 0.58 (0.00) 0.76 (0.00) 0.40 (0.00) <0.001 (F=16377.2)
% comment time 0.07 (0.00) 0.20 (0.00) 0.07 (0.00) 0.51 (0.00) <0.001 (F=20180.4)% article read 0.12 (0.00) 0.23 (0.00) 0.83 (0.00) 0.84 (0.00) <0.001 (F=318141.1)
# comment clicks 0.01 (0.00) 0.43 (0.01) 0.00 (0.00) 3.14 (0.03) <0.001 (F=25351.6)
Table 1: Means and standard errors of the fine grained engagement measures for Bounce, Shallow, Deep and Completeengagement levels.
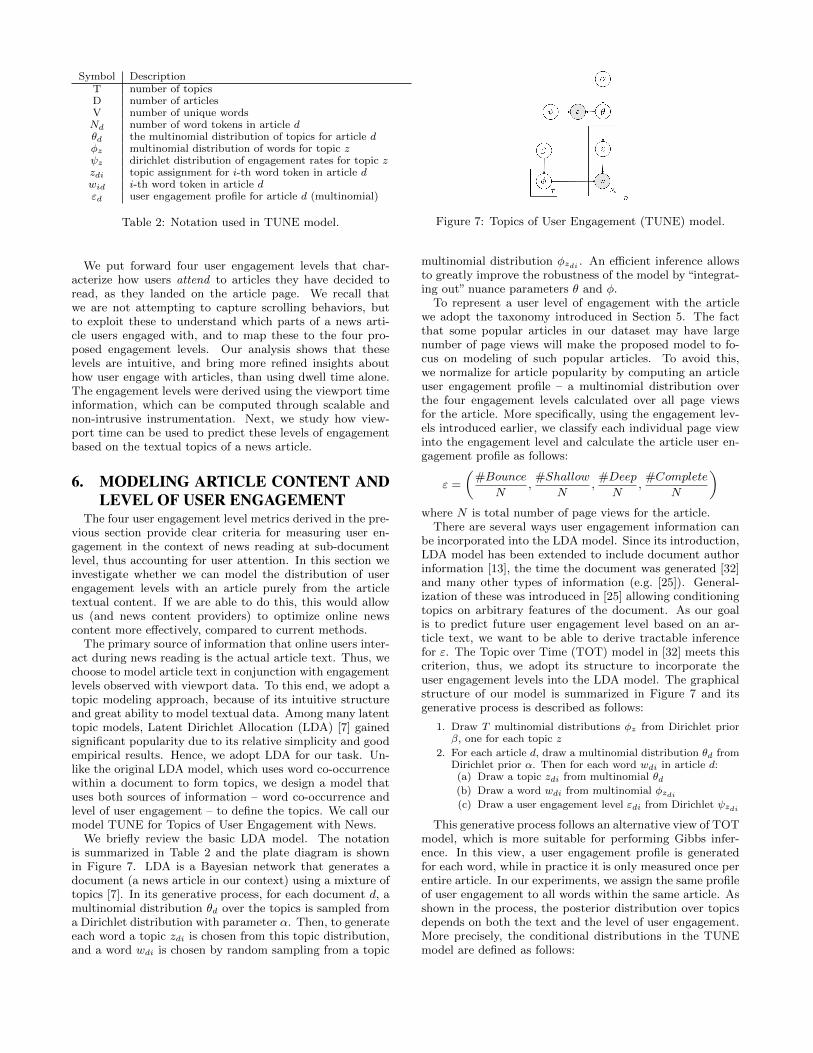
Figure 6: Mean viewport time at different viewport positionsfor each of the engagement levels: Bounce, Shallow, Deepand Complete. The thickness of a line corresponds to thestandard error of the mean.
.
(usually a title which may include small image thumbnail),body (main body of the article), and comment block. We re-port the percentage of the total viewport time spent viewingone of these regions. The percentage of article read is de-fined according to the above definition. The comment clicksshows the number of clicks on the comment block.
For each measure, we report the mean and standard er-rors. The last column of the table shows the p-value and teststatistics for the one way analysis of variance (ANOVA),allowing us to establish statistical differences in measuredquantities among the four engagement levels. All of theANOVA tests showed significant differences (p<0.001). Dueto lack of space we omit the pos-hoc analysis of the pairwisedifferences between the four groups.
While we find that dwell time and viewport time on head,
body and comment increase from Bounce to Complete, wenote that the distribution of the percentage of time amongthese blocks changes in an interesting manner. The viewporttime on head steadily decreases from 0.31 for Bounce to0.09 for Complete indicating that users spend an increasingamount of time reading content deeper in the article. Thepercentage of article read steadily increases from Bounceto Complete, as expected. With respect to this measure,Bounce (12%) and Shallow (23%) clearly represent low levelsof engagement with the article, since less than 25% of thearticle was read. On the other hand, Deep and Completecorrespond to the situations when the majority (83%) of thearticle was read. The number of comment clicks is highestfor the Complete class (3.14), followed by Shallow (0.43),2
suggesting that users may engage with comments even ifthey do not read a large proportion of the article.
To complement this analysis, we show the average view-port time computed at varying vertical position in Figure 6.Each of the four curves corresponds to one of the engagementlevels. The thickness of the line shows the standard error(only visible for Complete). We see that for the page views inthe Bounce case, users rarely scroll down the page, whereasmany users in the Shallow case spend approximately another5 seconds of viewport time at lower scroll positions. Deepengagement is characterized by significant time spent on theentire article (peak at the first screen amounts to about 50seconds) with a steady position decay of the viewport timetowards the bottom. Interestingly, the viewport time profilefor Complete engagement no longer monotonically decayswith the position; instead it has a bi-modal shape. We be-lieve this is due to a significant time users spend viewingand interacting with comments which are normally placedright after the main article content.
2The number of clicks for Deep is zero due to the definitionof the Deep engagement class.
Symbol DescriptionT number of topicsD number of articlesV number of unique wordsNd number of word tokens in article dθd the multinomial distribution of topics for article dφz multinomial distribution of words for topic zψz dirichlet distribution of engagement rates for topic zzdi topic assignment for i-th word token in article dwid i-th word token in article dεd user engagement profile for article d (multinomial)
Table 2: Notation used in TUNE model.
We put forward four user engagement levels that char-acterize how users attend to articles they have decided toread, as they landed on the article page. We recall thatwe are not attempting to capture scrolling behaviors, butto exploit these to understand which parts of a news arti-cle users engaged with, and to map these to the four pro-posed engagement levels. Our analysis shows that theselevels are intuitive, and bring more refined insights abouthow user engage with articles, than using dwell time alone.The engagement levels were derived using the viewport timeinformation, which can be computed through scalable andnon-intrusive instrumentation. Next, we study how view-port time can be used to predict these levels of engagementbased on the textual topics of a news article.
6. MODELING ARTICLE CONTENT ANDLEVEL OF USER ENGAGEMENT
The four user engagement level metrics derived in the pre-vious section provide clear criteria for measuring user en-gagement in the context of news reading at sub-documentlevel, thus accounting for user attention. In this section weinvestigate whether we can model the distribution of userengagement levels with an article purely from the articletextual content. If we are able to do this, this would allowus (and news content providers) to optimize online newscontent more effectively, compared to current methods.
The primary source of information that online users inter-act during news reading is the actual article text. Thus, wechoose to model article text in conjunction with engagementlevels observed with viewport data. To this end, we adopt atopic modeling approach, because of its intuitive structureand great ability to model textual data. Among many latenttopic models, Latent Dirichlet Allocation (LDA) [7] gainedsignificant popularity due to its relative simplicity and goodempirical results. Hence, we adopt LDA for our task. Un-like the original LDA model, which uses word co-occurrencewithin a document to form topics, we design a model thatuses both sources of information – word co-occurrence andlevel of user engagement – to define the topics. We call ourmodel TUNE for Topics of User Engagement with News.
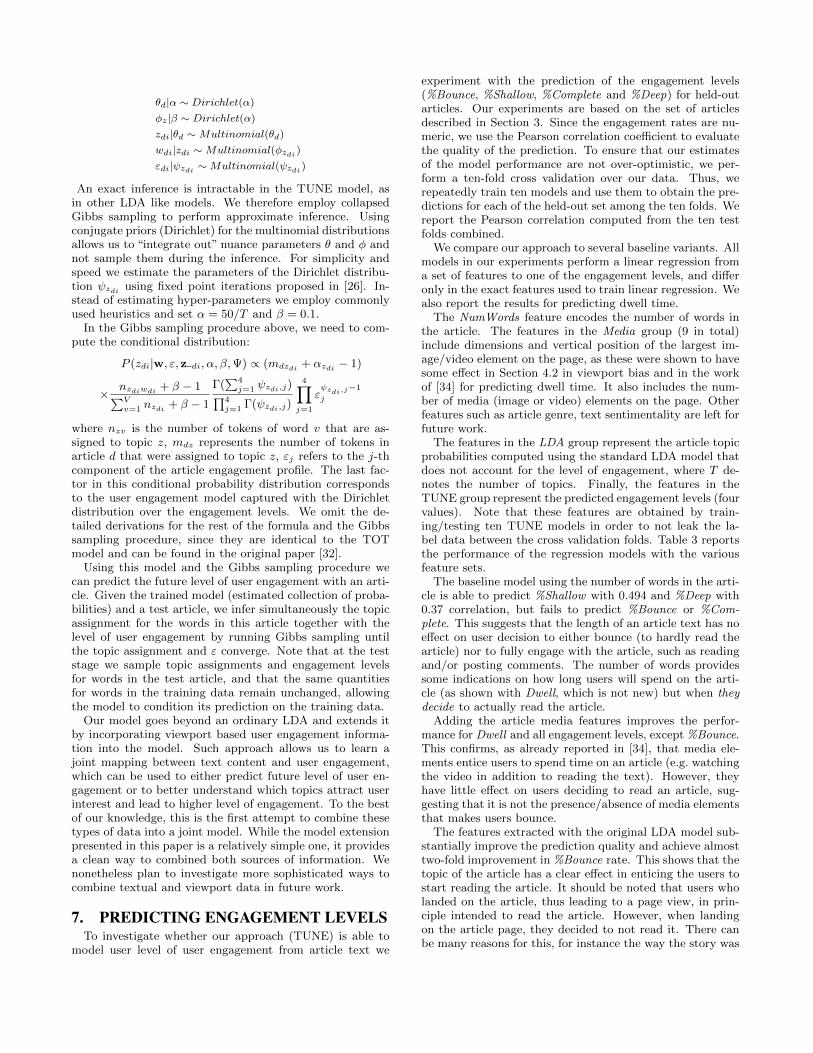
We briefly review the basic LDA model. The notationis summarized in Table 2 and the plate diagram is shownin Figure 7. LDA is a Bayesian network that generates adocument (a news article in our context) using a mixture oftopics [7]. In its generative process, for each document d, amultinomial distribution θd over the topics is sampled froma Dirichlet distribution with parameter α. Then, to generateeach word a topic zdi is chosen from this topic distribution,and a word wdi is chosen by random sampling from a topic
Figure 7: Topics of User Engagement (TUNE) model.
multinomial distribution φzdi . An efficient inference allowsto greatly improve the robustness of the model by “integrat-ing out” nuance parameters θ and φ.
To represent a user level of engagement with the articlewe adopt the taxonomy introduced in Section 5. The factthat some popular articles in our dataset may have largenumber of page views will make the proposed model to fo-cus on modeling of such popular articles. To avoid this,we normalize for article popularity by computing an articleuser engagement profile – a multinomial distribution overthe four engagement levels calculated over all page viewsfor the article. More specifically, using the engagement lev-els introduced earlier, we classify each individual page viewinto the engagement level and calculate the article user en-gagement profile as follows:
ε =
(#Bounce
N,
#Shallow
N,
#Deep
N,
#Complete
N
)where N is total number of page views for the article.
There are several ways user engagement information canbe incorporated into the LDA model. Since its introduction,LDA model has been extended to include document authorinformation [13], the time the document was generated [32]and many other types of information (e.g. [25]). General-ization of these was introduced in [25] allowing conditioningtopics on arbitrary features of the document. As our goalis to predict future user engagement level based on an ar-ticle text, we want to be able to derive tractable inferencefor ε. The Topic over Time (TOT) model in [32] meets thiscriterion, thus, we adopt its structure to incorporate theuser engagement levels into the LDA model. The graphicalstructure of our model is summarized in Figure 7 and itsgenerative process is described as follows:
1. Draw T multinomial distributions φz from Dirichlet priorβ, one for each topic z
2. For each article d, draw a multinomial distribution θd fromDirichlet prior α. Then for each word wdi in article d:(a) Draw a topic zdi from multinomial θd(b) Draw a word wdi from multinomial φzdi(c) Draw a user engagement level εdi from Dirichlet ψzdi
This generative process follows an alternative view of TOTmodel, which is more suitable for performing Gibbs infer-ence. In this view, a user engagement profile is generatedfor each word, while in practice it is only measured once perentire article. In our experiments, we assign the same profileof user engagement to all words within the same article. Asshown in the process, the posterior distribution over topicsdepends on both the text and the level of user engagement.More precisely, the conditional distributions in the TUNEmodel are defined as follows:
θd|α ∼ Dirichlet(α)
φz |β ∼ Dirichlet(α)
zdi|θd ∼Multinomial(θd)
wdi|zdi ∼Multinomial(φzdi )
εdi|ψzdi ∼Multinomial(ψzdi )
An exact inference is intractable in the TUNE model, asin other LDA like models. We therefore employ collapsedGibbs sampling to perform approximate inference. Usingconjugate priors (Dirichlet) for the multinomial distributionsallows us to “integrate out” nuance parameters θ and φ andnot sample them during the inference. For simplicity andspeed we estimate the parameters of the Dirichlet distribu-tion ψzdi using fixed point iterations proposed in [26]. In-stead of estimating hyper-parameters we employ commonlyused heuristics and set α = 50/T and β = 0.1.
In the Gibbs sampling procedure above, we need to com-pute the conditional distribution:
P (zdi|w, ε, z di, α, β,Ψ) ∝ (mdzdi + αzdi − 1)
× nzdiwdi + β − 1∑Vv=1 nzdi + β − 1
Γ(∑4j=1 ψzdi,j)∏4
j=1 Γ(ψzdi,j)
4∏j=1
εψzdi,j
−1
j
where nzv is the number of tokens of word v that are as-signed to topic z, mdz represents the number of tokens inarticle d that were assigned to topic z, εj refers to the j-thcomponent of the article engagement profile. The last fac-tor in this conditional probability distribution correspondsto the user engagement model captured with the Dirichletdistribution over the engagement levels. We omit the de-tailed derivations for the rest of the formula and the Gibbssampling procedure, since they are identical to the TOTmodel and can be found in the original paper [32].
Using this model and the Gibbs sampling procedure wecan predict the future level of user engagement with an arti-cle. Given the trained model (estimated collection of proba-bilities) and a test article, we infer simultaneously the topicassignment for the words in this article together with thelevel of user engagement by running Gibbs sampling untilthe topic assignment and ε converge. Note that at the teststage we sample topic assignments and engagement levelsfor words in the test article, and that the same quantitiesfor words in the training data remain unchanged, allowingthe model to condition its prediction on the training data.
Our model goes beyond an ordinary LDA and extends itby incorporating viewport based user engagement informa-tion into the model. Such approach allows us to learn ajoint mapping between text content and user engagement,which can be used to either predict future level of user en-gagement or to better understand which topics attract userinterest and lead to higher level of engagement. To the bestof our knowledge, this is the first attempt to combine thesetypes of data into a joint model. While the model extensionpresented in this paper is a relatively simple one, it providesa clean way to combined both sources of information. Wenonetheless plan to investigate more sophisticated ways tocombine textual and viewport data in future work.
7. PREDICTING ENGAGEMENT LEVELSTo investigate whether our approach (TUNE) is able to
model user level of user engagement from article text we
experiment with the prediction of the engagement levels(%Bounce, %Shallow, %Complete and %Deep) for held-outarticles. Our experiments are based on the set of articlesdescribed in Section 3. Since the engagement rates are nu-meric, we use the Pearson correlation coefficient to evaluatethe quality of the prediction. To ensure that our estimatesof the model performance are not over-optimistic, we per-form a ten-fold cross validation over our data. Thus, werepeatedly train ten models and use them to obtain the pre-dictions for each of the held-out set among the ten folds. Wereport the Pearson correlation computed from the ten testfolds combined.
We compare our approach to several baseline variants. Allmodels in our experiments perform a linear regression froma set of features to one of the engagement levels, and differonly in the exact features used to train linear regression. Wealso report the results for predicting dwell time.
The NumWords feature encodes the number of words inthe article. The features in the Media group (9 in total)include dimensions and vertical position of the largest im-age/video element on the page, as these were shown to havesome effect in Section 4.2 in viewport bias and in the workof [34] for predicting dwell time. It also includes the num-ber of media (image or video) elements on the page. Otherfeatures such as article genre, text sentimentality are left forfuture work.
The features in the LDA group represent the article topicprobabilities computed using the standard LDA model thatdoes not account for the level of engagement, where T de-notes the number of topics. Finally, the features in theTUNE group represent the predicted engagement levels (fourvalues). Note that these features are obtained by train-ing/testing ten TUNE models in order to not leak the la-bel data between the cross validation folds. Table 3 reportsthe performance of the regression models with the variousfeature sets.
The baseline model using the number of words in the arti-cle is able to predict %Shallow with 0.494 and %Deep with0.37 correlation, but fails to predict %Bounce or %Com-plete. This suggests that the length of an article text has noeffect on user decision to either bounce (to hardly read thearticle) nor to fully engage with the article, such as readingand/or posting comments. The number of words providessome indications on how long users will spend on the arti-cle (as shown with Dwell, which is not new) but when theydecide to actually read the article.
Adding the article media features improves the perfor-mance for Dwell and all engagement levels, except %Bounce.This confirms, as already reported in [34], that media ele-ments entice users to spend time on an article (e.g. watchingthe video in addition to reading the text). However, theyhave little effect on users deciding to read an article, sug-gesting that it is not the presence/absence of media elementsthat makes users bounce.
The features extracted with the original LDA model sub-stantially improve the prediction quality and achieve almosttwo-fold improvement in %Bounce rate. This shows that thetopic of the article has a clear effect in enticing the users tostart reading the article. It should be noted that users wholanded on the article, thus leading to a page view, in prin-ciple intended to read the article. However, when landingon the article page, they decided to not read it. There canbe many reasons for this, for instance the way the story was
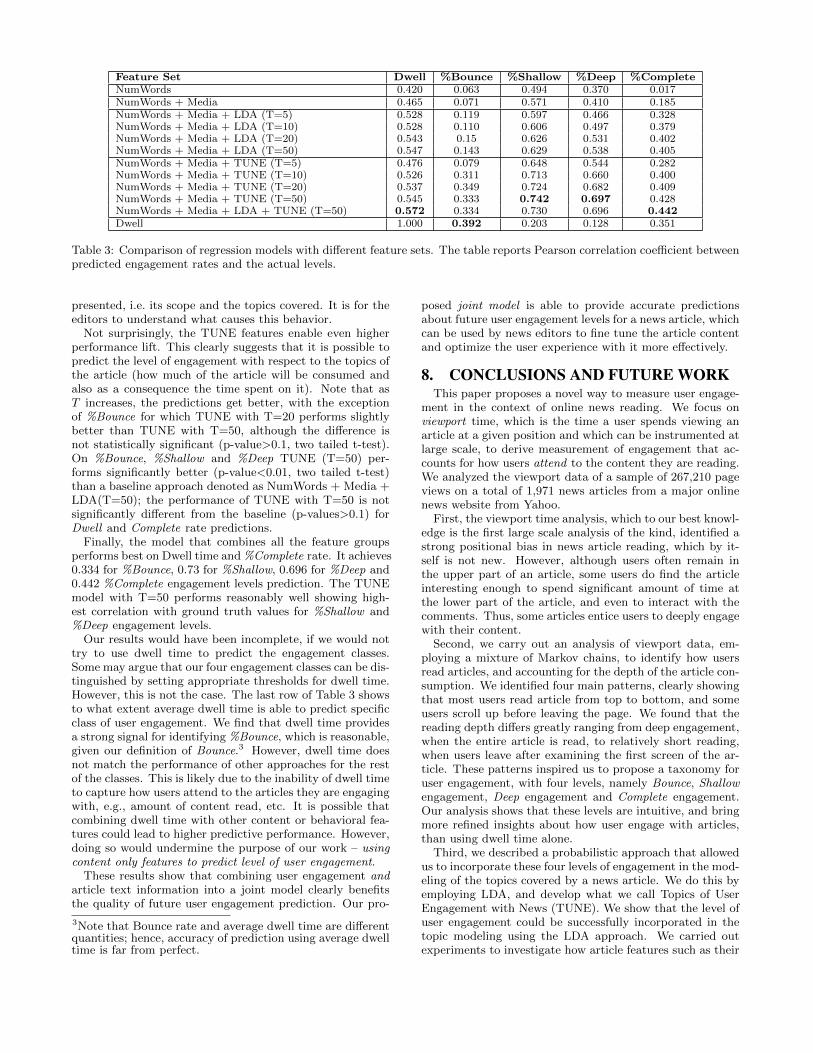
Feature Set Dwell %Bounce %Shallow %Deep %CompleteNumWords 0.420 0.063 0.494 0.370 0.017NumWords + Media 0.465 0.071 0.571 0.410 0.185NumWords + Media + LDA (T=5) 0.528 0.119 0.597 0.466 0.328NumWords + Media + LDA (T=10) 0.528 0.110 0.606 0.497 0.379NumWords + Media + LDA (T=20) 0.543 0.15 0.626 0.531 0.402NumWords + Media + LDA (T=50) 0.547 0.143 0.629 0.538 0.405NumWords + Media + TUNE (T=5) 0.476 0.079 0.648 0.544 0.282NumWords + Media + TUNE (T=10) 0.526 0.311 0.713 0.660 0.400NumWords + Media + TUNE (T=20) 0.537 0.349 0.724 0.682 0.409NumWords + Media + TUNE (T=50) 0.545 0.333 0.742 0.697 0.428NumWords + Media + LDA + TUNE (T=50) 0.572 0.334 0.730 0.696 0.442Dwell 1.000 0.392 0.203 0.128 0.351
Table 3: Comparison of regression models with different feature sets. The table reports Pearson correlation coefficient betweenpredicted engagement rates and the actual levels.
presented, i.e. its scope and the topics covered. It is for theeditors to understand what causes this behavior.
Not surprisingly, the TUNE features enable even higherperformance lift. This clearly suggests that it is possible topredict the level of engagement with respect to the topics ofthe article (how much of the article will be consumed andalso as a consequence the time spent on it). Note that asT increases, the predictions get better, with the exceptionof %Bounce for which TUNE with T=20 performs slightlybetter than TUNE with T=50, although the difference isnot statistically significant (p-value>0.1, two tailed t-test).On %Bounce, %Shallow and %Deep TUNE (T=50) per-forms significantly better (p-value<0.01, two tailed t-test)than a baseline approach denoted as NumWords + Media +LDA(T=50); the performance of TUNE with T=50 is notsignificantly different from the baseline (p-values>0.1) forDwell and Complete rate predictions.
Finally, the model that combines all the feature groupsperforms best on Dwell time and %Complete rate. It achieves0.334 for %Bounce, 0.73 for %Shallow, 0.696 for %Deep and0.442 %Complete engagement levels prediction. The TUNEmodel with T=50 performs reasonably well showing high-est correlation with ground truth values for %Shallow and%Deep engagement levels.
Our results would have been incomplete, if we would nottry to use dwell time to predict the engagement classes.Some may argue that our four engagement classes can be dis-tinguished by setting appropriate thresholds for dwell time.However, this is not the case. The last row of Table 3 showsto what extent average dwell time is able to predict specificclass of user engagement. We find that dwell time providesa strong signal for identifying %Bounce, which is reasonable,given our definition of Bounce.3 However, dwell time doesnot match the performance of other approaches for the restof the classes. This is likely due to the inability of dwell timeto capture how users attend to the articles they are engagingwith, e.g., amount of content read, etc. It is possible thatcombining dwell time with other content or behavioral fea-tures could lead to higher predictive performance. However,doing so would undermine the purpose of our work – usingcontent only features to predict level of user engagement.
These results show that combining user engagement andarticle text information into a joint model clearly benefitsthe quality of future user engagement prediction. Our pro-
3Note that Bounce rate and average dwell time are differentquantities; hence, accuracy of prediction using average dwelltime is far from perfect.
posed joint model is able to provide accurate predictionsabout future user engagement levels for a news article, whichcan be used by news editors to fine tune the article contentand optimize the user experience with it more effectively.
8. CONCLUSIONS AND FUTURE WORKThis paper proposes a novel way to measure user engage-
ment in the context of online news reading. We focus onviewport time, which is the time a user spends viewing anarticle at a given position and which can be instrumented atlarge scale, to derive measurement of engagement that ac-counts for how users attend to the content they are reading.We analyzed the viewport data of a sample of 267,210 pageviews on a total of 1,971 news articles from a major onlinenews website from Yahoo.
First, the viewport time analysis, which to our best knowl-edge is the first large scale analysis of the kind, identified astrong positional bias in news article reading, which by it-self is not new. However, although users often remain inthe upper part of an article, some users do find the articleinteresting enough to spend significant amount of time atthe lower part of the article, and even to interact with thecomments. Thus, some articles entice users to deeply engagewith their content.
Second, we carry out an analysis of viewport data, em-ploying a mixture of Markov chains, to identify how usersread articles, and accounting for the depth of the article con-sumption. We identified four main patterns, clearly showingthat most users read article from top to bottom, and someusers scroll up before leaving the page. We found that thereading depth differs greatly ranging from deep engagement,when the entire article is read, to relatively short reading,when users leave after examining the first screen of the ar-ticle. These patterns inspired us to propose a taxonomy foruser engagement, with four levels, namely Bounce, Shallowengagement, Deep engagement and Complete engagement.Our analysis shows that these levels are intuitive, and bringmore refined insights about how user engage with articles,than using dwell time alone.
Third, we described a probabilistic approach that allowedus to incorporate these four levels of engagement in the mod-eling of the topics covered by a news article. We do this byemploying LDA, and develop what we call Topics of UserEngagement with News (TUNE). We show that the level ofuser engagement could be successfully incorporated in thetopic modeling using the LDA approach. We carried outexperiments to investigate how article features such as their
length and the presence of media elements affect the pre-diction of our proposed metrics of engagement levels. Wefound that TUNE, compared to two baselines (using articlelength only and using the original LDA) leads to improvedperformance not only with respect to the proposed metricsof engagement levels, but also dwell time.
We also obtained several interesting insights. The pres-ence of media elements, although enticing users to dwelllonger on the page, has little effect on users deciding whetherto actually read the article (i.e. the effect on Bounce wassmall). The same was observed with respect to article length.This indicates that what matters most is the actual contentof the article and the way the story it is covering is pre-sented. Although, in itself, this statement may be obvious,we could demonstrate this effect by incorporating the fourengagement levels within the LDA topic modeling approach.
In the future, we want to experiment further with TUNE,and look at more features of articles, including with respectto aspects related to their genre, layout, and the presenceof advertisements on the article page. This will bring moreextensive insights into user engagement with online content,that are usually only possible through small-scale experi-mentation using surveys and eye-tracking. Furthermore, inthis paper, the engagement patterns and the resulting mod-eling were with respect to article pages, and not users. Itis very likely that users engage in different ways with onlinecontent, and whether this has an effect on our proposed fourengagement levels should be investigated. Finally, this workwas applied in the context of news reading on desktop. Thenext step would be to deploy the same instrumentation andcorresponding measurement methodology in the context oftablet and smartphone.
9. REFERENCES[1] M. Ageev, D. Lagun, and E. Agichtein. Improving search
result summaries by using searcher behavior data. In Proc.of SIGIR, pages 13–22. ACM, 2013.
[2] E. Agichtein, E. Brill, and S. Dumais. Improving websearch ranking by incorporating user behavior information.In Proc. of SIGIR, pages 19–26. ACM, 2006.
[3] I. Arapakis, B. Cambazoglu, and M. Lalmas.Understanding within-content engagement through patternanalysis of mouse gestures. In Proc. of CIKM. ACM, 2014.
[4] I. Arapakis, M. Lalmas, B. B. Cambazoglu, M.-C. Marcos,and J. M. Jose. User engagement in online news: Under thescope of sentiment, interest, affect, and gaze. JAIST, 2014.
[5] S. Attfield, G. Kazai, M. Lalmas, and B. Piwowarski.Towards a science of user engagement (position paper). InWSDM Workshop on UMWA, year=2011.
[6] M. Bilenko and R. W. White. Mining the search trails ofsurfing crowds: identifying relevant websites from useractivity. In Proc. of WWW, pages 51–60, 2008.
[7] D. M. Blei, A. Y. Ng, and M. I. Jordan. Latent dirichletallocation. JMLR, 3:993–1022, 2003.
[8] G. Buscher, L. van Elst, and A. Dengel. Segment-leveldisplay time as implicit feedback: a comparison to eyetracking. In Proc. of SIGIR, pages 67–74, 2009.
[9] M. C. Chen, J. R. Anderson, and M. H. Sohn. What can amouse cursor tell us more?: correlation of eye/mousemovements on web browsing. In CHI extended abstracts,pages 281–282. ACM, 2001.
[10] M. Claypool, P. Le, M. Wased, and D. Brown. Implicitinterest indicators. In Proc. of IUI. ACM, 2001.
[11] N. Craswell, O. Zoeter, M. Taylor, and B. Ramsey. Anexperimental comparison of click position-bias models. InProc. WSDM, pages 87–94. ACM, 2008.
[12] A. P. Dempster, N. M. Laird, and D. B. Rubin. Maximum
likelihood from incomplete data via the em algorithm.Journal of the Royal Statistical Society, pages 1–38, 1977.
[13] E. Erosheva, S. Fienberg, and J. Lafferty.Mixed-membership models of scientific publications. InProc. of PNAS, 101:5220–5227, 2004.
[14] S. Fox, K. Karnawat, M. Mydland, S. Dumais, andT. White. Evaluating implicit measures to improve websearch. TOIS, 23(2):147–168, 2005.
[15] J. Goecks and J. Shavlik. Learning users’ interests byunobtrusively observing their normal behavior. In Proc. ofIUI, pages 129–132.
[16] Q. Guo and E. Agichtein. Beyond dwell time: estimatingdocument relevance from cursor movements and otherpost-click searcher behavior. In Proc. of WWW, pages569–578. ACM, 2012.
[17] J. Huang and A. Diriye. Web user interaction mining fromtouch-enabled mobile devices, 2012.
[18] Y. Kim, A. Hassan, R. W. White, and I. Zitouni. Modelingdwell time to predict click-level satisfaction. In Proc. ofWSDM, pages 193–202. ACM, 2014.
[19] D. Lagun, M. Ageev, Q. Guo, and E. Agichtein. Discoveringcommon motifs in cursor movement data for improving websearch. In Proc. of WSDM, pages 183–192. ACM, 2014.
[20] D. Lagun and E. Agichtein. Viewser: enabling large-scaleremote user studies of web search examination andinteraction. In Proc. of SIGIR, 2011.
[21] D. Lagun, C. Hsieh, D. Webster, and V. Navalpakkam.Towards better measurement of attention and satisfactionin mobile search. In Proc. of SIGIR. ACM, 2014.
[22] C. Liu, R. W. White, and S. Dumais. Understanding webbrowsing behaviors through weibull analysis of dwell time.In Proc. of SIGIR, pages 379–386, 2010.
[23] L. Lorigo, M. Haridasan, H. Brynjarsdottir, L. Xia,T. Joachims, G. Gay, L. Granka, F. Pellacini, and B. Pan.Eye tracking and online search: Lessons learned andchallenges ahead. JASIST, 59(7):1041–1052, 2008.
[24] L. McCay-Peet, M. Lalmas, and V. Navalpakkam. Onsaliency, affect and focused attention. In Proc. of CHI,pages 541–550, 2012.
[25] D. Mimno and A. McCallum. Topic models conditioned onarbitrary features with dirichlet-multinomial regression.arXiv preprint arXiv:1206.3278, 2012.
[26] T. Minka. Estimating a dirichlet distribution, 2000.
[27] M. Morita and Y. Shinoda. Information filtering based onuser behavior analysis and best match text retrieval. InProc. of SIGIR, pages 272–281, 1994.
[28] V. Navalpakkam, L. Jentzsch, R. Sayres, S. Ravi,A. Ahmed, and A. Smola. Measurement and modeling ofeye-mouse behavior in the presence of nonlinear pagelayouts. In Proc. of WWW, pages 953–964, 2013.
[29] H. L. O’Brien and E. G. Toms. The development andevaluation of a survey to measure user engagement.JASIST, 61(1):50–69, January 2010.
[30] L. Rabiner and B.-H. Juang. An introduction to hiddenmarkov models. ASSP Magazine, IEEE, 3(1):4–16, 1986.
[31] B. Shapira, M. Taieb-Maimon, and A. Moskowitz. Study ofthe usefulness of known and new implicit indicators andtheir optimal combination for accurate inference of usersinterests. In Proc. SAC, pages 1118–1119, 2006.
[32] X. Wang and A. McCallum. Topics over time: anon-markov continuous-time model of topical trends. InProce. of KDD, pages 424–433. ACM, 2006.
[33] O. Wu, Y. Chen, B. Li, and W. Hu. Evaluating the visualquality of web pages using a computational aestheticapproach. In Proc. of WSDM, pages 337–346, 2011.
[34] X. Yi, L. Hong, E. Zhong, N. N. Liu, and S. Rajan. Beyondclicks: dwell time for personalization. In Proc. of RecSys,pages 113–120, 2014.