measuring employee engagement at the united
TRANSCRIPT
IQP Project Number: 1204
Faculty Code: MR1
Division Number: 46
MEASURING EMPLOYEE ENGAGEMENT AT THE
UNITED STATES PATENT AND TRADEMARK OFFICE
An Interactive Qualifying Project Report
For the United States Patent and Trademark Office
Submitted to the Faculty of the
WORCESTER POLYTECHNIC INSITUTE
In Partial Fulfillment of the Requirements for the
Degree of Bachelor Science
Submitted by:
Sarah Conlin
Jeannette Gerry
Alula Shiferaw
Andrew Sinkewicz
Date: 13 December 2012
Approved by:
Mr. James Dwyer, USPTO Liaison
Mr. William Korzuch, USPTO Co-Liaison
Professor Marsha Rolle, Lead Advisor
Professor R. Creighton Peet, Co-Advisor
This report represents work of WPI undergraduate students submitted to the faculty as evidence
of a degree requirement. WPI routinely publishes these reports on its web site without editorial
or peer review. For more information about the projects program at WPI, see
http://www.wpi.edu/Academics/Project
ii
Abstract
The USPTO is facing the challenge of improving employee engagement among
employees who work both in the office and from home. Using interviews, surveys and a focus
group we developed an Employee Engagement Metric System that allows the USPTO to
measure employee engagement and provides a framework for future engagement measurement
and improvement. Using this system, we were able to calculate a baseline engagement score for
the USPTO to use as a comparison for future years.
iii
Acknowledgments
Our team would like to recognize several people who were continuous sources of
knowledge and advice throughout our project. First, we would like to thank our advisors,
Professors Marsha Rolle and Creighton Peet, for helping our team to gather our sometimes
scattered ideas and for pushing us to provide the USPTO with the strongest recommendations
possible. We would also like to thank our liaisons, Jim Dwyer and Bill Korzuch, for their
guidance and support throughout our tenure at the office.
We would additionally like to acknowledge the USPTO employees who have helped us
to conduct research and gather data for our project. Special thanks to:
The Patent Employee Engagement Team (PEET)
Marty Rater
Dan Hunter
Colby Clugston
Craig Sokol
iv
Authorship
Section Author (s) Editor (s) Abstract Sarah Jeannette
Acknowledgements Sarah Jeannette
Executive Summary All Four Sarah
1.0 Introduction All Four Sarah & Jeannette
2.0 Background Sarah Jeannette
2.1 Definition of Employee Engagement Alula Sarah
2.2 How Employee
Engagement is Measured
Jeannette Andrew
2.3 Employee Engagement Indicators Jeannette Sarah
2.3.1 Sick Leave Andrew Jeannette
2.3.2 Employee Viewpoint Survey Jeannette Sarah
2.3.3 Attrition Rates Alula Sarah
2.4 Employee Engagement at Selected Companies Alula Sarah
2.4.1 Employee Engagement at Pixar Alula Jeannette
2.4.2 Employee Engagement at Campbell’s Soup
Company
Alula Sarah
2.4.3 Employee Engagement at Google Alula Jeannette
2.5 What is Teleworking? Jeannette Sarah
2.6 Employee Engagement at the USPTO Sarah Jeannette
2.6.1 The Changing Nature of the Patent Office Sarah Jeannette
2.6.2 What Has Been Done in the Past Sarah Jeannette
2.6.3 What Can Be Done in the Future Sarah Jeannette
2.7 Summary Sarah Alula
3.0 Methodology Sarah Jeannette
3.1 Identification of Engagement Categories for the
Metric System
Jeannette Sarah
3.2 Feedback on the Metric System
Jeannette &
Sarah
Sarah
3.3 Determine the Current Level of Employee
Engagement
Alula &
Andrew
Sarah
4.0 Results and Analysis Sarah Jeannette
4.1 Employee Opinions of Engagement at the
USPTO
Sarah Jeannette
4.1.1 Patent Examiners’ Perspectives Andrew Sarah
4.1.2 Teleworker’s Perspective Andrew Alula & Jeannette
4.1.3 Managerial Perspective Alula Sarah
4.1.4 Managerial Survey Open-Ended Question
Responses
All Four Sarah & Alula
4.1.5 Employee Viewpoint Survey Responses Sarah Jeannette
4.1.6 Data Based Engagement Indicators Andrew Sarah
4.2 Factors Working Against Engagement at the
USPTO
Andrew &
Alula
Sarah
v
4.3 Stakeholders’ Metric System Input Jeanette Sarah
4.4 Determination of the Metric System Weights Jeannette Sarah
4.4.1 Reasoning for Other Indicators of
Engagement Category
Jeannette Sarah
4.4.2 Reasoning for Production and Recognition
Category
Jeannette Sarah
4.4.3 Reasoning for EVS Survey Results Category Jeannette Sarah
4.4.4 Reasoning for the WPI Patent Examiner
Survey and Managerial Survey Categories
Jeannette Sarah
4.5 FY 2012 Engagement Baseline Sarah Jeannette
4.5.1 Other Indicators of Engagement Category Sarah Jeanette
4.5.2 Performance and Recognition Category Sarah Jeannette
4.5.3 Employee Viewpoint Survey Category Sarah Jeannette
4.5.4 WPI Team Patent Examiner Survey Category Sarah Jeannette
4.5.5 WPI Team Managerial Survey Category Sarah Jeanette
4.5.6 Baseline Employee Engagement
Measurement
Sarah Jeannette
4.6 Results Summary Sarah Jeannette
5.0 Conclusions and Recommendations Sarah Jeannette
5.1 The USPTO’s Baseline Engagement Data is
Encouraging
Andrew Sarah
5.2 The Point System is the First of its Kind at the
USPTO
Jeannette Sarah
5.3 Teleworkers’ Engagement Jeannette Sarah
5.4 Expanding Recognition Awards Alula Sarah
5.5 Annual Distribution of Surveys Alula Jeannette
5.6 Increasing Annual Survey Scores Sarah Jeannette
5.6 Conclusions and Recommendations Summary Sarah Jeannette
References All Four All Four
Appendix A: Managerial (SPE) Focus Group
Protocol
All Four Jeannette
Appendix B: Meeting Notes from the Focus Group
with 11 Anonymous SPEs
Jeannette Sarah
Appendix C: Employee Engagement Survey for all
Patent Examiners
All Four Jeannette
Appendix D: Survey for Managerial Employees
(SPEs)
All Four Sarah
Appendix E: USPTO Staff One-on-One Interview
Protocol
Jeannette Sarah
Appendix F: Meeting Notes from Formal Interview
with Mr. Marty Rater
Jeannette
Sarah
Appendix G: The Point Based Metric System for
Measuring Employee Engagement
All Four Jeannette
Appendix H: Sponsor Description All Four Jeannette
**It is important to note that Alula and Andrew worked closely with the analysis of data
collected through surveys and USPTO contacts.
vi
Table of Contents
Abstract ii
Acknowledgements iii
Authorship iv
Table of Contents vi
Table of Figures ix
Table of Tables ix
Acronyms x
Executive Summary xi
1.0 Introduction 1
2.0 Background 4
2.1 Definition of Employee Engagement 4
2.2 How Employee Engagement is Measured 7
2.3 Employee Engagement Indicators 8
2.3.1 Sick Leave 9
2.3.2 Employee Viewpoint Survey 10
2.3.3 Attrition Rates 12
2.4 Employee Engagement at Selected Companies 13
2.4.1 Employee Engagement at Pixar 14
2.4.2 Employee Engagement at Campbell’s Soup Company 15
2.4.3 Employee Engagement at Google 17
2.5 What is Teleworking? 18
2.6 Employee Engagement at the USPTO 20
2.6.1 The Changing Nature of the Patent Office 20
2.6.2 What Has Been Done in the Past 21
2.6.3 What Can Be Done in the Future 22
2.7 Summary 24
3.0 Methodology 25
3.1 Identification of Engagement Categories for the Metric System 25
3.2 Feedback on the Metric System 27
3.3 Determine the Current Level of Employee Engagement 30
vii
4.0 Results and Analysis 32
4.1 Employee Opinions of Engagement at the USPTO 32
4.1.1 Patent Examiners’ Perspectives 32
4.1.2 Teleworker’s Perspective 35
4.1.3 Managerial Perspective 40
4.1.4 Managerial Survey Open-Ended Question Responses 44
4.1.5 Employee Viewpoint Survey Responses 50
4.1.6 Data Based Engagement Indicators 51
4.2 Factors Working Against Engagement at the USPTO 53
4.3 Stakeholders’ Metric System Input 56
4.4 Determination of the Metric System Weights 58
4.4.1 Reasoning for Other Indicators of Engagement Category 60
4.4.2 Reasoning for Production and Recognition Category 61
4.4.3 Reasoning for EVS Survey Results Category 62
4.4.4 Reasoning for the WPI Patent Examiner Survey and Managerial Survey
Categories 62
4.5 FY 2012 Engagement Baseline 63
4.5.1 Other Indicators of Engagement Category 63
4.5.2 Performance and Recognition Category 65
4.5.3 Employee Viewpoint Survey Category 66
4.5.4 WPI Team Patent Examiner Survey Category 68
4.5.5 WPI Team Managerial Survey Category 69
4.5.6 Baseline Employee Engagement Measurement 71
4.6 Results Summary 71
5.0 Conclusions and Recommendations 73
5.1 The USPTO’s Baseline Data is Encouraging 73
5.2 The Point System is the First of its Kind at the USPTO 74
5.3 Teleworkers’ Engagement 75
5.4 Expanding Recognition Award 76
5.5 Annual Distribution of Surveys 76
5.6 Increasing Annual Survey Scores 77
viii
5.7 Conclusions and Recommendations Summary 78
References 79
Appendix A: Managerial (SPE) Focus Group Protocol 84
Appendix B: Meeting Notes from the Focus Group with 11 Anonymous SPEs 86
Appendix C: Employee Engagement Survey for all Patent Examiners 89
Appendix D: Survey for Managerial Employees (SPEs) 92
Appendix E: USPTO Staff One-on-One Interview Protocol 94
Appendix F: Meeting Notes from Formal Interview with Mr. Marty Rater 95
Appendix G: The Point Based Metric System for Measuring Employee Engagement 101
Appendix H: Sponsor Description 104
ix
Table of Figures
Figure 1: Metric System for Engagement Breakdown xiii, 59
Figure 2: Employee Engagement Process 6
Figure 3: Responses to Question #13 on the Patent Examiner Survey 33
Figure 4: Responses to Question #21 on the Patent Examiner Survey 34
Figure 5: Responses to Question #17 on the Patent Examiner Survey 35
Figure 6: Response to Question #9 on the Patent Examiner Survey 36
Figure 7: Response to Question #8 on the Patent Examiner Survey 37
Figure 8: Response to Question #12.23 on the Patent Examiner Survey 38
Figure 9: Response to Question #12.11 on the Patent Examiner Survey 39
Figure 10: Overall Average Result of the Managerial Survey 40
Figure 11: Responses to Question #5 on the Managerial Survey 41
Figure 12: Responses to Question #7 on the Managerial Survey 42
Figure 13: Responses to Question #14 on the Managerial Survey 43
Figure 14: Preferred Method of Communication for SPEs 45
Figure 15: Responses to Open-Ended Question #2 from the Managerial Survey 48
Figure 16: Average Sick Leave Hours Taken Per Employee 52
Figure 17: Employee Attrition Rates from 1998-2011 53
Figure 18: Responses to Question #5 on the Patent Examiner Survey 54
Figure 19: Responses to Question # 11 on the Patent Examiner Survey 55
Figure 20: Strategic Management Satisfaction Score 56
Figure A-1: Organization of the USPTO 106
Table of Tables
Table 1: Indicators Measured for Each Category xiv
Table 2: Employee Engagement Index Score FY 2012 71
x
Acronyms
USPTO – United States Patent and Trademark Office
PEET – Patent Employee Engagement Team
EE – Employee Engagement
EVS – Employee Viewpoint Survey
BPW – Best Place to Work
DOC – Department of Commerce
SPE – Supervisory Patent Examiner
TC – Technology Center
WPI – Worcester Polytechnic Institute
xi
Executive Summary
In order for organizations or companies to succeed, it is essential that they make
employee engagement a central part of their mission. However, just having an employee
engagement plan does not guarantee the success of the organization. It is vital for a company to
find effective methods to measure the success of employee engagement initiatives so that those
initiatives can be improved.
Project Background
Employee Engagement is especially important to companies that have employees in
remote locations. Companies across the country have developed systems for increasing
engagement with employees working in different office locations as well as from home.
Employee engagement defines the state of existence where employees feel committed to their
workplace, competent in their job, valued by their organization, and are in tune with the mission
of their respective company. Some of the methods used to identify indicators of engagement
include gathering employee opinions through surveys, interviews, and focus groups, and
collecting quantitative data such as the number of sick days taken by employees each year. The
USPTO has developed such an engagement system, and has expressed an interest in measuring
the success of newly implemented engagement programs and the engagement of teleworking
employees. Analyses of current programs are required in order to develop an appropriate set of
metrics.
xii
Project Focus
The goal of our project was to propose a feasible system for measuring the effectiveness
of current and future employee engagement at the USPTO, as well as providing an example of
how our metric system is to be used. We established specific objectives in order to attain this
goal. First, we acknowledged that there were no previous measurement systems established for
employee engagement at the USPTO. Second, our group identified potential methods for
measuring effectiveness of future and current employee engagement, created and implemented
WPI Team Patent Examiner and Managerial Surveys to collect engagement data from USPTO
employees, and prioritized those findings to create the metric system. Fifty percent of the data
collected and used in the metric system came from the surveys created by the WPI Team.
Finally, we determined how to measure the current employee satisfaction level through the use
of our employee engagement measurement system.
Outcomes
Our objectives were met by utilizing survey questionnaires, one-on-one interviews, and a
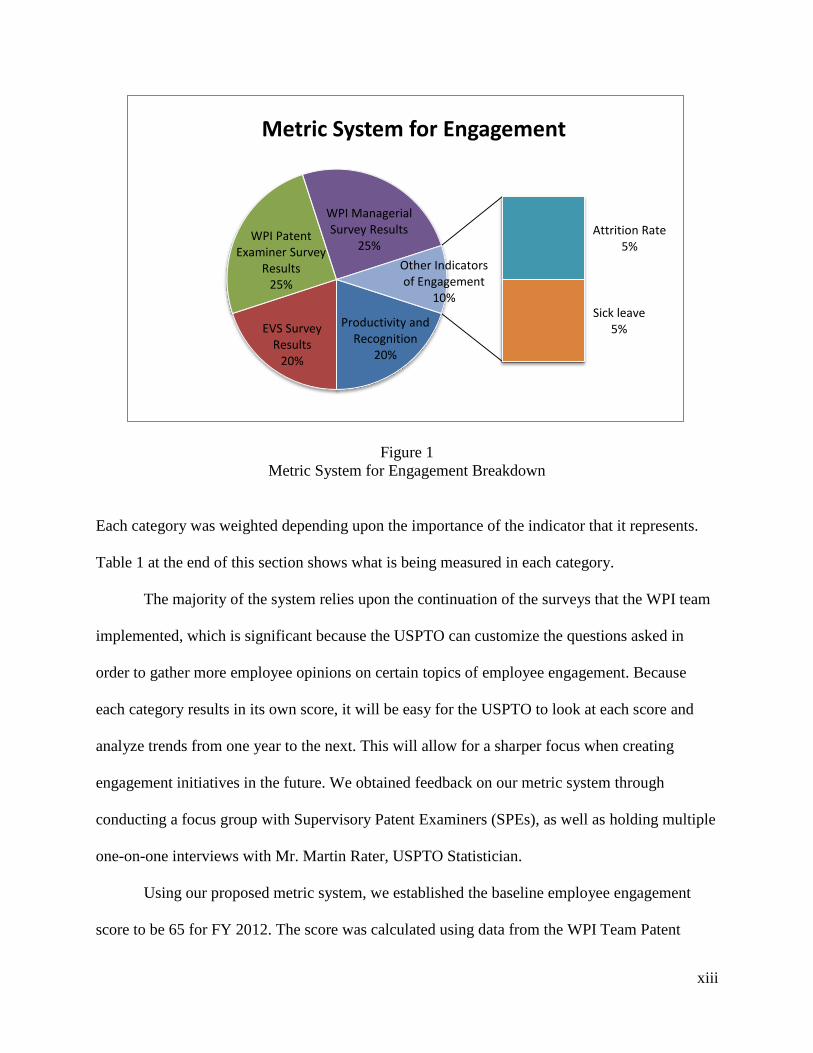
focus group. We established a metric system comprised of five categories, as seen in Figure 1.
xiii
Figure 1
Metric System for Engagement Breakdown
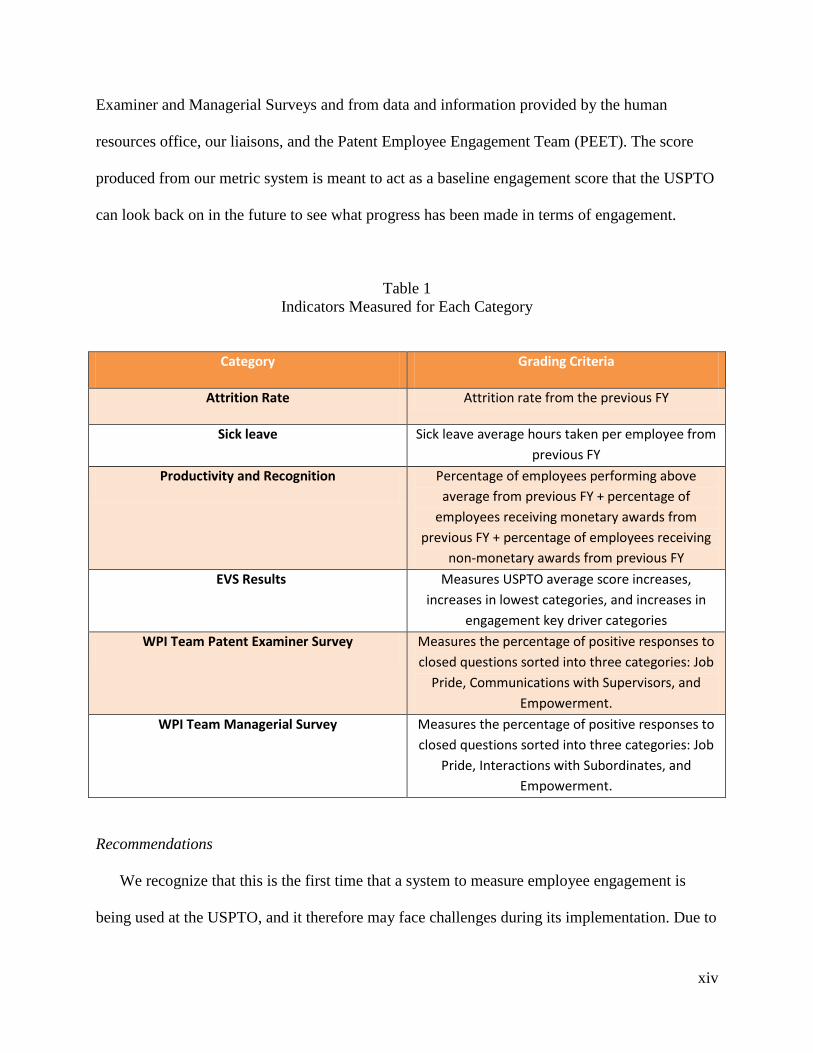
Each category was weighted depending upon the importance of the indicator that it represents.
Table 1 at the end of this section shows what is being measured in each category.
The majority of the system relies upon the continuation of the surveys that the WPI team
implemented, which is significant because the USPTO can customize the questions asked in
order to gather more employee opinions on certain topics of employee engagement. Because
each category results in its own score, it will be easy for the USPTO to look at each score and
analyze trends from one year to the next. This will allow for a sharper focus when creating
engagement initiatives in the future. We obtained feedback on our metric system through
conducting a focus group with Supervisory Patent Examiners (SPEs), as well as holding multiple
one-on-one interviews with Mr. Martin Rater, USPTO Statistician.
Using our proposed metric system, we established the baseline employee engagement
score to be 65 for FY 2012. The score was calculated using data from the WPI Team Patent
Productivity and Recognition
20%
EVS Survey Results
20%
WPI Patent Examiner Survey
Results 25%
WPI Managerial Survey Results
25% Attrition Rate
5%
Sick leave 5%
Other Indicators of Engagement
10%
Metric System for Engagement
xiv
Examiner and Managerial Surveys and from data and information provided by the human
resources office, our liaisons, and the Patent Employee Engagement Team (PEET). The score
produced from our metric system is meant to act as a baseline engagement score that the USPTO
can look back on in the future to see what progress has been made in terms of engagement.
Table 1
Indicators Measured for Each Category
Recommendations
We recognize that this is the first time that a system to measure employee engagement is
being used at the USPTO, and it therefore may face challenges during its implementation. Due to
Category Grading Criteria
Attrition Rate Attrition rate from the previous FY
Sick leave Sick leave average hours taken per employee from
previous FY
Productivity and Recognition Percentage of employees performing above
average from previous FY + percentage of
employees receiving monetary awards from
previous FY + percentage of employees receiving
non-monetary awards from previous FY
EVS Results Measures USPTO average score increases,
increases in lowest categories, and increases in
engagement key driver categories
WPI Team Patent Examiner Survey Measures the percentage of positive responses to
closed questions sorted into three categories: Job
Pride, Communications with Supervisors, and
Empowerment.
WPI Team Managerial Survey Measures the percentage of positive responses to
closed questions sorted into three categories: Job
Pride, Interactions with Subordinates, and
Empowerment.

xv
this, we have developed the following recommendations for the continued use of the system. A
more complete list of recommendations can be found in the full report.
1. In order to continue to respond to feedback and improve the point based metric
system, we recommend that the point system be kept flexible.
2. We recommend that an annual meeting be held by the directors and other
executives of the USPTO to determine the most accurate weights for the following
fiscal year’s point system.
3. It is important to know that in order to compare the flexible system scores each year
the previous years’ scores may need to be recalculated.
4. The USPTO should analyze the 2012 EVS survey results upon their release in order
to finalize the baseline for FY 2012.
5. We endorse the use of the surveys used to create the baseline, and encourage the
USPTO to send them to the patent examiners and SPEs annually.
6. We suggest that the USPTO look into creating and encouraging the use of non-
monetary awards that all employees can be equally considered for.
7. It would be in the best interest of the USPTO to mold our metric system into a
system that is specifically for measuring teleworker’s engagement.
Summary
In conclusion, our team has provided the USPTO with a metric system for employee
engagement. This system is flexible, and can be tailored to the yearly needs of the USPTO.
Through the utilization of this metric system, we have determined the baseline score of employee
engagement at the USPTO for FY 2012. This metric system will be of substantial future use to
the USPTO, as it encompasses both teleworking employees and main campus employees.
1
1.0 Introduction
In order for an organization or a company to become successful, it is important to have
engaged employees that take pride in their work and their organization’s mission. Engaged
employees are the key for maximizing efficiency and are a vital asset that insures the
sustainability and growth of the company (MacLeod & Clarke, 2009). It is especially challenging
for managers and other company executives to sustain and enhance employee engagement when
all of their employees do not work under the same roof. This is one of the biggest problems the
United States Patent and Trademark Office (USPTO) is facing, as the organization opens more
satellite offices and allows employees to work remotely from different locations through their
teleworking programs (Ross & Atkisson, 2012). Without physical interaction among employees,
it is more difficult to build trust and develop effective manager-patent examiner relationships,
which are the key factors for engagement.
The USPTO has moved to a more flexible schedule, which allows its employees to work
in the office at more convenient hours, or alternatively, to work from home through teleworking.
As long as employees can be as efficient and engaged at home as they would be in the USPTO
main office, there should not be any problems with teleworking (Bates, 2004). The USPTO
(2012d) defines employee engagement for both teleworkers and workers at the main campus as
“…the connection through which the employee feels valued, is committed, and is empowered to
perform his or her duties with a sense of purpose, satisfaction, and pride” (p. 9). Currently the
USPTO is conducting employee engagement initiatives in order to maintain connectivity among
employees at separate locations. However, the USPTO needs ways to measure how well these
employee engagement procedures are working, especially with employees who work from home
or other remote locations.
2
Many companies have begun to analyze various indicators, such as a lowered sickness
rate among employees, a decrease in sick leave taken, the improvement of project performance,
lowered attrition rates, increased financial success, and the reduction in the number of employee
complaints, in order to measure the level of employee engagement (MacLeod & Clarke, 2009;
Johnson, 2012). An employee’s opinion is vital to the level of success of an engagement
initiative. Historically, researchers have used surveys as a simple method to gather employees’
opinions about their level of engagement (Frey & Fontana, 1991). However, current
measurement tools such as the survey can be of limited use because not all employees provide
feedback; they are often hesitant to report on actual situations in the workplace, and it takes
many years to accumulate valid or useful data (Harder, 2008; MacLeod & Clarke, 2009). To
lessen such a roadblock to data collection, one-on-one interviews and focus groups have also
been used to gather employees’ opinions.
Although there has been extensive research on the methods and strategies used to
improve employee engagement, ways to accurately measure the success of these engagement
initiatives at the USPTO are nonexistent. The Patent Employee Engagement Team (PEET)
(2012d) at the USPTO is devoted to gathering data on employee engagement, but they need to
analyze the data they have collected in a meaningful way in order to provide useful feedback to
the USPTO. The main tool used by the USPTO to collect data on employee engagement, like
many other institutions across the nation, is an employee survey. However, these surveys are not
able to accommodate or measure all indicators of employee engagement. Developing a
measuring tool that can efficiently analyze different data gathered from employees at different
locations is vital to the USPTO’s objective of measuring the level of employee engagement.
3
The goal of this project was to provide an effective system for measuring the current
level of employee engagement at the USPTO. To achieve this goal, we met three objectives.
First, because employee engagement tools may have varying degrees of success, we determined
the USPTO’s most important indicators of engagement and identified a feasible system for
measuring employee engagement. We then used the system to measure a baseline index score of
employee engagement at the USPTO. With this data in hand, we provided recommendations to
the USPTO as to what tools and indicators to use in order to help them measure how successful
their existing and proposed engagement initiatives are or will be. Effectively measuring
employee engagement is important to the USPTO because improved employee relations will
allow the agency to run more smoothly and will result in a quicker patent review process.
Additionally, the managers at the USPTO are all “home grown”; if employees are not engaged
and satisfied in their work, the USPTO will lose not only experienced employees but potential
managers. Measuring engagement will allow the USPTO monitor how satisfied and engaged
their employees are, as well as guide future initiatives to increase engagement among all
employees.
4
2.0 Background
Employee engagement is not a new concept. Many companies believe that employee
engagement, and the measurement of it, are central to achieving efficiency and success. In this
chapter we will explain what employee engagement is and describe examples of engagement
initiatives various companies have implemented. We will also review how employee engagement
has helped companies become more competitive and successful, and discuss how employee
engagement is measured. Lastly, we will examine employee engagement at the United States
Patent and Trademark Office (USPTO) and how the USPTO is trying to achieve improved
employee engagement.
2.1 Definition of Employee Engagement
In a competitive economy, having employees who simply show up for work and ‘do their
job’ will not guarantee the success of an organization (JRA, 2008). It is critical to have
employees who believe in and support the organization’s mission and help the organization
grow. Having the brightest employees does not guarantee the development of a company, unless
the employees are properly engaged, because the best innovations and ideas generally come from
collaborating minds. Having workers doing only the bare minimum just to get by will not assure
the future success of the organization. It is important that managers and company executives
look for ways to improve their work force’s performance.
Employee engagement has often been publicized as the key to an organization's success
and competitiveness (Gruman and Saks, 2011). In order to bring out employees’ potential, it is
essential that they feel they are a part of something important. Employee engagement helps the
staff feel involved and empowered, as well as helping keep their faith in their organization.
5
Companies become successful when they make their employees’ commitment, potential, and
creativity central to their mission and goals (MacLeod and David, 2009). Even though having
capital and a practical business strategy is crucial for a company, the performance of the
employees determines the success or failure of the organization.
The term “employee engagement” has been given many different definitions by
corporations and researchers, but all agree that employee engagement is beneficial to an
organization’s growth. Professor John Storey, from The Open University Business School,
defined employee engagement as “a set of positive attitudes and behaviors enabling high job
performance of a kind, which are in tune with the organization’s mission” (MacLeod and David,
2009, p.8). It is necessary for employees to understand and believe in their organization’s
mission in order to do their job with passion. Focal EE (2010) defined employee engagement as,
“The extent to which employees feel passionate about their jobs, are committed to the
organization, and put discretionary effort into their work” (¶. 1). Engaged employees work
harder because they love their work, believe what they do matters, and want to see their
organization succeed.
MacLeod and David (2009) define employee engagement as “when the business values
the employee and the employee values the business” (p. 7). The existence of mutual respect
between the workers and the employer is essential in order to create and maintain trust between
them. When an organization values its employees, the employees will value their organization
and help with its growth. Steve Bates (2004) from HR Magazine looked at engagement as the
emotional state of the employees in the their company; he argued that when people feel
appreciated and respected by their employers, they are more engaged and drive the company to
greater success.
6
Some corporations such as Caterpillar defined engagement as, “The extent of employees'
commitment, work effort, and desire to stay in an organization” (Bates, 2004, ¶. 2). In addition,
the USPTO (2012d) has defined engagement as “the interactive relationship an employee has
with the people and the work of the USPTO. This relationship is the connection through which
the employee feels valued, is committed, and is empowered to perform his or her duties with a
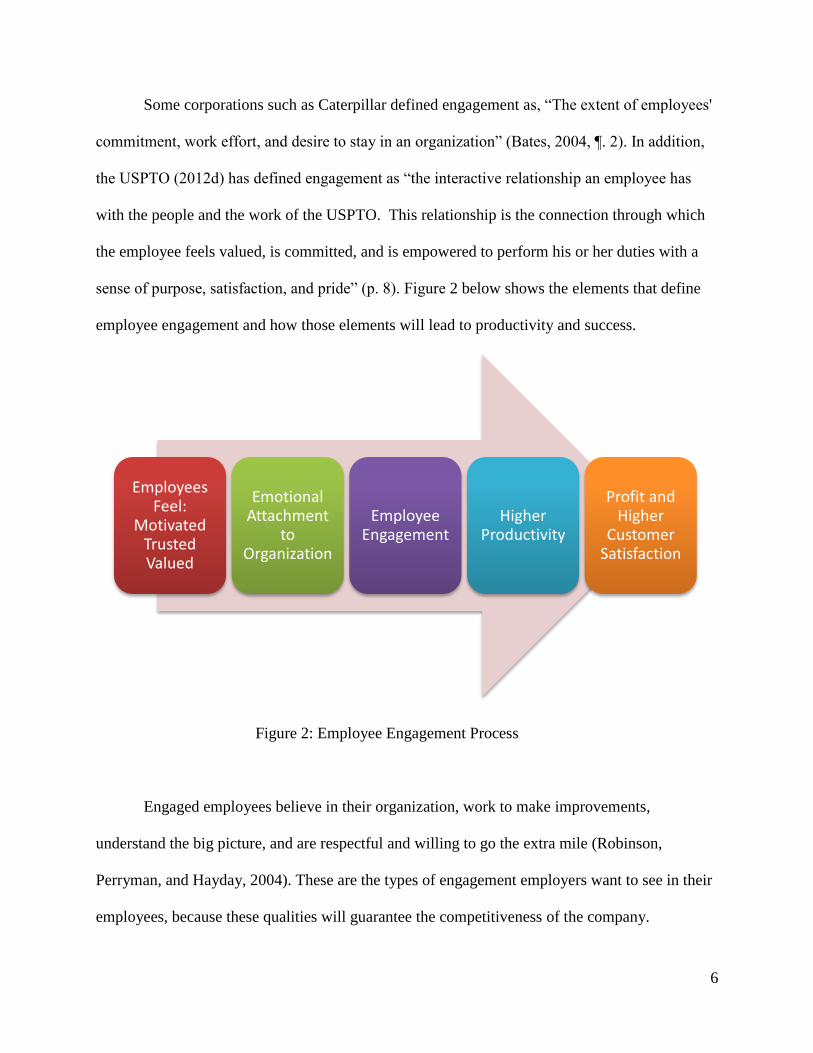
sense of purpose, satisfaction, and pride” (p. 8). Figure 2 below shows the elements that define
employee engagement and how those elements will lead to productivity and success.
Figure 2: Employee Engagement Process
Engaged employees believe in their organization, work to make improvements,
understand the big picture, and are respectful and willing to go the extra mile (Robinson,
Perryman, and Hayday, 2004). These are the types of engagement employers want to see in their
employees, because these qualities will guarantee the competitiveness of the company.
Employees Feel:
Motivated Trusted Valued
Emotional Attachment
to Organization
Employee Engagement
Higher Productivity
Profit and Higher
Customer Satisfaction
7
Employee engagement is essential for any organization that wants to grow. However,
engagement initiatives alone do not guarantee success, unless the outcomes of the initiatives are
being measured and improved.
2.2 How Employee Engagement is Measured
Many variables can be looked at from within a company to determine if employee
engagement is at the desired level. Lowered sickness rates, decreased sick leave days taken,
improved project performance, quality of manager feedback, lower staff turnover, increased
financial success, and a reduction in complaints are just a few metrics that can be analyzed
(MacLeod & Clark, 2009; Johnson, 2012). Missing work without notice or leaving the agency
can result from employee discontent. An improvement in these statistics shows that employees
have become more engaged with their jobs than they previously were. Feedback from the
managers can also show improved engagement due to the supervisors knowing the employees in
more than a professional way. Enhanced performance, whether it is manifested as the
improvement in the company’s financial state or a specific project within the company, is an
indicator of more productive employees, which can help support the conclusion that employees
are happier and more engaged than they were before, along with other factors such as increased
scores on satisfaction surveys or other engagement indicators. Finally, an engaged employee will
be more pleasant for a customer, client or associate to work with. Fewer complaints from people
whom the employees interact with can be a direct result of more engaged employees.
Another way to assess if employees are engaged or have become more engaged is to
gather their opinions. Opinions cannot be collected by simply analyzing quantitative data. To
gain this vital feedback, surveys are typically used (MacLeod & Clark, 2009; Walton, 2009;
8
Harder, 2008; Johnson, 2012). Survey questionnaires are normally issued to the general staff
body by the company’s management staff, company human resources staff, or a third party. A
third party is often used to ensure that the results and analysis of results are not biased towards
showing that the company has indeed improved. The questionnaires typically give various
options per question, and the employee rates them voluntarily and anonymously; an employee is
never forced to take the survey.
A second way to gather opinions of employees is through group interviews, such as focus
groups. Group interviews can be utilized to explore the various views on how successfully a
company or agency is accomplishing its goal to increase employee engagement (Frey & Fontana,
1991). A group interview can also give baseline data to determine how current initiatives are
going before the researcher makes recommendations on how to improve, if any improvements
are needed. For example, in the health industry, focus groups have been used to understand the
beliefs of patients, to evaluate the success of a nutrition improvement initiative, and to develop
strategies in care management (Rabiee, 2004). The formality of a group interview can vary, but
the interview typically is useful for gathering data that rely on social interaction, whether simply
as a baseline, as aforementioned, or to measure the progress the company is making in its
engagement initiatives.
2.3 Employee Engagement Indicators
There are many different factors that are encompassed by individual indicators of
employee engagement. In the following sections, we will discuss three main indicators of
engagement that are or can be used by the USPTO: sick leave, the results from the Employee
9
Viewpoint Survey (EVS), and employee attrition rate. These indicators are commonly used to
measure engagement.
2.3.1 Sick Leave
Sick leave is considered a serious problem that every company has to deal with. There is
the concern that employees use sick leave as extra vacation time instead of for legitimate health
reasons. This illegitimate use of sick leave is an indicator of an employee’s negative engagement
at the agency. Excessive use of sick leave can lower the level of production for the company,
which can lead to an overall financial loss. High rates of sick leave among employees can result
in lower customer satisfaction (Mateo, Tanco, & Santos, 2012). To fight this, companies need to
lower their rates of employee sick leave so they are getting the most out of a limited number of
workers while not losing money.
One main factor in decreasing sick leave is offering flexibility in working hours. Workers
desire flexibility in their hours so they can deal with unexpected family events or so they can
take a short personal break for leisure (Hunt, 2012). This cuts down on sick leave because
someone with flexible hours can take off a few hours, where as someone with a rigid work
schedule may have to take off the whole day. To solve this problem, companies can offer more
flexible hours to their workers, often through teleworking programs. At the USPTO, the rate of
sick leave has dropped off recently, mostly due to the fact that employees can choose to work
their own hours (C. Clugston, personal communication, October 30, 2012). They can work at the
main campus or from their homes and are given the option to complete their work at home if
they do not finish it while on the main campus.
10
2.3.2 Employee Viewpoint Survey
The Federal Employee Viewpoint Survey (EVS) is distributed to all federal agencies by
the US Office of Personal Management with the intention to measure employee satisfaction
(Partnership for Public Service, 2011b; Partnership for Public Service, 2011d). The Partnership
for Public Service uses the EVS to create the Best Places to Work in the Federal Government
rankings as a mechanism to hold agency leaders accountable for employee satisfaction and the
health of their organization. The EVS results and Best Places to Work (BPW) rankings
encompass 308 federal organizations, 33 of which are large federal agencies, 35 are small
agencies, and 240 are agency subcomponents. The USPTO is categorized as an agency
subcomponent under the Department of Commerce (Partnership for Public Service, 2011d). The
data trends that are provided in the EVS results and BPW rankings allow side-by-side
comparison of agencies or agency subcomponents to see if a particular workplace has improved
or regressed over time.
The EVS was conducted April 4 through May 31, 2011 (Partnership for Public Service,
2011d). The survey was completed by 266,376 federal workers, giving a response rate of 49.3%
of all federal employees. The sampling error is ± 3% at a 95% confidence level. The statistical
model used by the BPW to analyze the EVS is based on the CFI Group’s methodology, the CFI
being the group that created the American Consumer Satisfaction Index. The BPW index is
calculated by the percentage of positive responses, Strongly Agree/Agree or Very
Satisfied/Satisfied, to three workplace satisfaction questions within the EVS. These three
questions are used only in determining the index and are not the key drivers of engagement. The
three workplace satisfaction questions are: I recommend my organization as a good place to
work; considering everything, how satisfied are you with your job; and considering everything,
11
how satisfied are you with your organization. The results are then weighted by a proprietary
formula developed in 2007 by the Hay Group. In addition to the index, workplace environment
scores are calculated by the percentage of positive responses in ten categories that include the
three key drivers of engagement: effective leadership, employee skills/mission match, and pay
(Partnership for Public Service, 2011d; Partnership for Public Service, 2011c; USPTO, 2012c).
For the data provided to the agencies, a regression analysis is performed to determine which
categories within the agencies had the highest BPW rankings and index satisfaction scores.
Beyond the raw data provided to agencies, the BPW also provides descriptions of the
categories that EVS questions are placed in for analysis (Partnership for Public Service, 2011a).
One category that is a key engagement driver is the employee skills/mission match category.
Employee skills/mission match measures the extent that employee skills and talent are used
effectively. It also assesses at what level the employees gain satisfaction from their work and
how much an average employee understands how his/her job is relevant to the agency. The
second key driver category is effective leadership, which has four subcategories to encompass all
important factors. Empowerment that results from effective leadership is intended to measure the
extent employees feel empowered in their work processes and how satisfied employees are with
being included in decisions that affect their work.
The “fairness” of effective leadership subcategory is described as how much an employee
feels that disputes are resolved fairly in a work unit, whether an employee believes that
favoritism or arbitrary actions are tolerated, and if an employee feels comfortable reporting
illegal activity without fear of being reprimanded. The effective leadership of the agency’s senior
leaders subcategory measures employee respect for senior leaders, satisfaction with the amount
of information management provides, and perceptions about a senior leader’s honesty, integrity,
12
and ability to motivate employees. Finally, the effective supervisor leadership subcategory
measures the employees’ opinions of immediate supervisors. These opinions cover the
supervisors’ job performance, the opportunity for supervisors to allow leadership among
employees, and the ability of supervisors to provide developmental support and worthwhile
feedback to employees.
2.3.3 Attrition Rates
A good indicator of positive employee engagement is employee retention. Attrition rates
show employees’ involvement and commitment to their organization (Scott, McMullen, &
Royal, 2001). It is also important that companies create programs to retain positive and
motivated workers while also maintaining good performance and productivity among the
employees. When the attrition rate for any organization is high, it suggests that the employees
feel disengaged and not committed to their organization. Nonetheless, when employees are
satisfied and engaged in their company, evidence shows they are more likely to be loyal to their
organization, which leads to a low attrition rate.
Employee retention is vital for any organization’s success because a low attrition rate
allows the continuity of business performance (Scott, 2012). According to the report Retaining
Talent by David Allen (2008), from the Society for Human Resource Management, “Employee
turnover matters for three main reasons, first it is costly, second it disrupts business performance,
and thirdly it becomes increasingly difficult to manage” (p. 3). One of the first reasons attrition
rates matter is because of the large monetary expense to replace employees. Most organizations
like the USPTO train their newly hired employees until the employees fully understand their
roles and tasks in the workplace. The USPTO (2012f) trains their new employees in four to
13
twelve month intervals before the patent office allows them to examine patents independently.
Training employees comes with a great expense and use of resources; if those employees leave
the organization within three years, they are increasing expenditures to the organization because
the employee does not contribute enough to allow the company to profit from the employee’s
work. According to a study done by D. Scott, T. McMullen, and M. Royal (2012) with the
WorldatWork analysis organization, “estimates suggest that the cost of employee turnover often
ranges from 50% to 200% of the employee’s annual salary based on the type and level of job
he/she holds” (p. 2). It is important that companies attract quality employees and retain these
employees in order to reduce the cost of replacing workers.
Another finding from Allen’s (2008) report about the importance of employee turnover is
that turnover disrupts business performance, preventing the growth of the organization. It is
important that businesses everywhere gather employees that specialize in skills the company
needs in order to be competitive and stay ahead. The loss of these quality employees interrupts
company performance and halts their progress to success. It is vital to find ways to retain and
engage quality employees because replacing and training new employees will slow down the
potential to compete.
2.4 Employee Engagement at Selected Companies
In this section we will discuss successful employee engagement initiatives that
companies, such as Pixar, Campbell’s Soup Company, and Google, have taken and how the
initiatives have benefited the organizations.
14
2.4.1 Employee Engagement at Pixar
One of the best examples of a success story in employee engagement is Pixar Studios. A
main reason Pixar is the most successful studio in the industry is due to the workforce behind it
(Goldstein, 2008). Pixar has some of the most engaged employees, and they thrive to bring in
high quality and well developed products for their customers. According to Ed Catmull (2008),
President of Walt Disney and Pixar Animation, “Pixar has an environment that nurtures trusting
and respectful relationships and unleashes everyone’s creativity” (p. 4). Pixar employees go the
extra mile because they truly believe in their organization. They believe what they do is
extraordinary, everyone’s ideas and work is respected, and all employee input is encouraged.
A second employee engagement initiative that has allowed Pixar to succeed is the
environment and the setting of the work place itself. The atmosphere of a workplace plays an
important role in shaping the employees’ mood and their engagement level (Stallard, 2012). This
employee initiative was developed by one of the greatest innovators of the 21st century, Steve
Jobs. Jobs knew that innovation and creativity do not happen in cubicles or through emails; he
believed “creativity comes from spontaneous meetings and from random discussions” (Ashley,
2012, ¶. 2). The design for Pixar’s headquarters was specifically intended to enhance employee
interaction and to create an atmosphere that is new and enjoyable to everyone. According to
Pixar designer and Academy Award-winning director Brad Bird, “The cafeteria, meeting rooms,
employee mail boxes and restrooms are centralized to make it more likely Pixar employees will
interact with one another”(Stallard, 2012, ¶. 7).
Instead of assembling their offices with cubicles, Pixar created a very modern work place
filled with common areas, spacious work areas, game lounges, a fitness center, and even a large
theater (Ashley, 2012). Pixar’s Chief Creative Officer, John Lasseter, describes his experience as
15
the following, “I kept running into people that I hadn’t seen for months. I’ve never seen a
building that promoted collaboration and creativity as well as this one” (¶. 4). The Pixar office is
a great example that shows interaction and promoting innovation, and this fact motivates and
attracts employees to come to work every day and enjoy what they do. It is an appealing
environment that makes workers feel like a part of a community as a whole, despite their varying
job descriptions and positions.
2.4.2 Employee Engagement at Campbell’s Soup Company
Leadership is an important aspect of employee engagement. Employees need some push
and motivation from leaders in the company, such as CEOs and managers, in order to collaborate
and work together. Leaders are the engine that drives employee engagement, so it is important
for an organization to have a leader that is able to inspire and make the workers passionate about
their organization (MacLeod and Clarke, 2009). The former CEO of Campbell’s Soup, Doug
Conant, is the perfect example of a leader that motivated and inspired his employees. When
Conant joined Campbell’s Soup, he recalled the distrust that existed between employees and
managers due to recent layoffs (Waghorn, 2009). In order to gain the employee’s trust and to
have them engaged, Conant declared himself committed to enhancing employee engagement and
increasing productivity.
The first step the former CEO took was to find ways to earn his employees’ trust back
(Waghorn, 2009). Employees trust their organization when the managers respect and value their
contribution to the company, and Conant understood this. According to an interview by Waghorn
from Forbes Magazine, Conant delivered hand-written notes all around the world to his
employees celebrating what each person did and their contribution to the organization. This
16
showed that the company was paying attention to its employees and that it cared about the work
they were doing. Mr. Conant (2012) recalled his visit to Campbell’s factories all around the
world and found his hand-written notes posted on their bulletin boards in their cubicles. These
notes led them to feel valued and respected. Conant claimed in the course of 10 years he wrote
about 30,000 notes and that the company only had 20,000 employees.
Involvement from managers and CEO’s is necessary for engagement. When employees
see their managers or CEO more often, it will make them feel that what they are doing matters
(Bates, 2004). The former CEO of Campbell’s Soup implemented another engagement initiative
with this in mind. During his lunch hours, Conant (2012) walked around the building of his
company with his pedometer and walking shoes on. He walked around the building for two
reasons; the first was to get some exercise and to promote well-being since an employee’s health
can have an impact on his or her work. The second reason was to talk to his employees and to
see how they were doing. During this process he got to know his employees, which sent a
positive message throughout the company.
Due to the high involvement and strong employee engagement initiatives from the CEO,
Campbell’s Soup (2011) was able to overcome the problems they had been facing before Conant
took over Campbell’s leadership; now they are one of the companies that has the most engaged
employees. The productivity and the work atmosphere inside the company can speak for the
success of their employee engagement initiatives. In 2010 they were awarded the Gallup Great
Workplace Award for the fourth consecutive year.
17
2.4.3 Employee Engagement at Google
In order to unleash a worker's creativity, managers need to trust their employees and give
them some freedom to think and practice their own ideas that may become beneficial to the
company (Ulanoff, 2009). Google understood this philosophy, and created the “20% time”
program to encourage employee creativity. Through the 20% time program, Google engineers
are allowed to work on a project of their own design that is related to Google’s mission one day
per week (Marre, 2011). The results of Google’s 20% time program have been astonishing. The
ideas for popular Google products, such as Gmail and Google News, came from their 20% time
engagement initiative.
When people are free to practice their own ideas and theories, it leads to creativity, which
leads to success (Bates, 2004). In order for employees to go the extra mile, they need to know
that their ideas are being respected by the organization. Giving them time to be creative
independently makes employees feel empowered. When the 20% time idea creates a new
product, other employees will form groups and work on the idea to make it a reality (Meddiratta,
2007). These groups don’t have any budget or any authority figure that manages the project, but
rather they are committed employees working on their ideas, trying to make the ideas a reality
and propose them to Google managers. When a company has employees who strive for
innovation and are engaged with new ideas, the results are substantial. Engaged employees are
one of the reasons that Google has become one of the most important companies in the 21st
century.
The other employee engagement initiative that is implemented at Google is based on the
theory that employees should not just raise problems, but they should solve them too (Marre,
2011). Google holds focus groups called “Fixit”, which are problem solving sessions for
18
employees on current business plans and internal and external problems the employees are
facing. Employees have a better understanding of what goes on in their organizations, and they
have a better understanding of how their work place can be improved, so it is important for a
company to have its employees involved in identifying and solving problems that exist in their
organizations.
2.5 What is Teleworking?
Teleworking has recently become much more common in the workplace as a solution to
some engagement issues, as well as to lower company operating costs. Teleworking is an
arrangement in which the employee can work during any portion of regular paid hours at an
approved worksite such as at home or a telework center (US Office of Personal Management,
2012d). However, neither official travel nor mobile work is considered teleworking. Any
employee can telework according to individual company policy, but the management has the
final say whether or not the employee is allowed to telework (US Office of Personal
Management, 2012c). If any employee’s performance and productivity declines or fails, the
management of the company has the right to end the employee’s telework arrangement.
Managers who oversee teleworkers are encouraged to participate in teleworking as well so as to
set a positive example for their subordinates (US Office of Personal Management, 2012a). The
passing of the Telework Enhancement Act of 2010 requires managers to treat teleworkers and
non-teleworkers the same, although some changes in communication techniques may be needed
(US Office of Personal Management, 2012b).
The number of teleworkers has greatly increased in response to the cost efficiency, saving
at least $2000 per employee from company expenses in areas such as sick leave and saving
19
employees’ expenditures on gas and parking (Sundin, 2010). Teleworking also allows for greater
work/life flexibility; employees may then have a higher degree of satisfaction and productivity.
The sick leave, turnover, and job burnout rates are also lower among teleworking employees.
While it is considered that these benefits outweigh the costs of teleworking, the one cost that
cannot be ignored is that teleworking can lead to a feeling of isolation, long hours, and lowered
engagement.
To avoid a major decrease in engagement, Kirsten Sundin (2010) suggests that
employees who telework have a strong balance of technical knowledge and social skills, are
adaptable, organized, self-motivated, and flexible. These traits will also allow employees who
telework to be more successful. Sundin also suggests that managers who oversee teleworkers
should be organized and be effective communicators. Being an effective communicator will
allow the virtual interactions that dominate the teleworking supervisor/supervisee relationship to
have the same quality of interaction as typical in person interactions around the office. The
virtual interactions will tend to be short and frequent, but the interactions must have a purpose so
that the teleworker can feel included and connected to the rest of the company. Teleworkers will
have increased engagement if they receive informal feedback from the managers as well through
the virtual interactions. Finally, the teleworkers’ sense of being valued and engaged will increase
if company recognition of achievements, through means such as promotions or pay raises, is at
the same rate for both teleworkers and on site employees. In general, an employee who teleworks
must feel that he or she is valued by the company just as much as an employee who works on
site.
20
2.6 Employee Engagement at the USPTO
The USPTO wants its employees to feel valued, committed and empowered to fulfill their
duties (USPTO, 2012d). If employees do not currently feel engaged, then it indicates that not
enough is being done to promote positive engagement between the USPTO and its employees.
Government employers such as the USPTO have begun to implement new programs in order to
increase employee engagement, and therefore increase the feeling of self-worth and productivity
amongst employees.
2.6.1 The Changing Nature of the Patent Office
In response to the rapidly changing lifestyles of employees, the USPTO has revamped its
hours of business and the way some employees do business. At an earlier point in time all
employees operated out of the same office; now workers are spread out across the country,
reaching from Detroit, Michigan, to the main office in Alexandria, Virginia (Ross & Atkisson,
2012). Additionally, the USPTO runs a hoteling program, which allows employees to
telecommute and come into the main office only once a week in some programs. This expansion
provides a unique challenge to the USPTO. How does a business maintain connections among
employees if all employees are not housed under the same roof?
To address this problem, the USPTO (2012f) is working to provide a worker friendly,
productive, and communication-based atmosphere for employees. “The USPTO recognizes the
importance of fostering an active communication culture as a vital part to achieving
transparency, accountability and interactivity through the agency” (p. 7). The USPTO has
created a Patent Employee Engagement Team (PEET), in order to implement programs and
measure the success of these programs. This team strives for the highest ratings and the most
21
satisfaction from employees, in order to achieve the goals outlined by the Strategic Human
Capital Plan (USPTO, 2012d).
2.6.2 What Has Been Done In The Past
The EVS is currently the system wide measure in place to gauge employee satisfaction
and work-life balance (USPTO, 2009a). In the past, the USPTO has had high scores in the
categories of diversity, highly educated employees, flexible schedules, and a good balance
between the business world and the personal world. It is important for the USPTO to maintain
these scores as well as improve in areas such as timeliness of patent approval that were not
scored as high.
The USPTO currently has a few measures in place to analyze employee engagement and
the type of environment at the main office. These tools include general surveys as well as ideas
for social media outlets. In the near future, the USPTO will be taking part in websites and virtual
groups such as YouTube, Flickr and Facebook (USPTO, 2012f). These websites will allow for
positive external communications, as well as give employees another avenue to engage with the
bigger picture of what is happening at the USPTO. Focus groups are an additional way used to
gain knowledge of employee conditions. These avenues for feedback have been very helpful in
maintaining employee engagement, but efforts are being put towards new outlets such as week-
long feedback and training sessions, which may be more successful. These strategies have a time
frame that began in Fiscal Year 2011 and are scheduled to last until Fiscal Year 2015.
Additionally, the USPTO (2012d) offers training sessions on topics such as “Managing in
a Telework World”, “Setting Examiner Goals and Providing Effective Feedback”, and “USPTO
Engagement Overviews” (p. 23). These initiatives provide employees with opportunities to learn
22
more about themselves and what the company has to offer, allowing them to become more
personally involved in the day-to-day activities of the company.
Other avenues of communication between employees and management of the USPTO
include Town Hall Meetings and Affinity Groups (USPTO, 2012d). Town Hall Meetings are a
gathering of a large number of employees to share their input and ideas. Designated USPTO staff
members run the meetings while all USPTO employees are encouraged to attend. These
meetings allow new ideas from employees to come to the forefront. Affinity Groups provide
support for an increasingly decentralized and diversified workplace. In these groups, members
who have a common background, ancestry, or share common ground on current political issues
are provided with a social outlet as well as a business support group. These two outlets allow
employees to connect on more than just a workplace level, but also on a personal level.
2.6.3 What Could Be Done In The Future
There is a three phase Strategic Human Capital Plan process currently in place at the
USPTO (2012f). This plan was created in 2010 and is meant to reach from 2011 to 2015. Phase I
deals with Talent Management, as the USPTO’s mission requires a highly skilled workforce.
This Phase focuses specifically on motivating a diverse workforce, which becomes key in
forging relationships and mentorships that will help to keep employees engaged and interested in
the company for the long term. This phase also focuses on hiring people who are technically
proficient. An additional focus will be placed on addressing any gaps in the workforce that are
based on competency. The USPTO’s goal is to use percentages of hired employees, completion
of training courses, mentoring framework developed, and focus group sessions conducted every
year to measure the success of Phase I.
23
Phase II, the Results Oriented Performance Culture Phase, involves identifying a way to
measure the success of employee engagement programs by evaluating the outcomes of the goals
and objectives across the agency (USPTO, 2012f). It becomes incredibly important in this phase
to have outstanding communication between employees and customer service both internally and
externally. The USPTO has developed a few benchmarks specific to their organization that will
help them to measure success. These include measuring employee engagement levels and
tracking the number of approved patents over a specific period of time. These goals are
productivity-oriented and easily achievable if the initiatives are successful. Lastly, this phase
looks to improve the USPTO’s performance management and reward system, which will be
impossible without a clear measurement system with defined objectives.
Phase III introduces a top down approach, focusing on the leader’s method to keep the
employees involved (USPTO, 2012f). This Phase is called the Leadership and Knowledge
Management Phase. The USPTO believes that “leadership is demonstrated at all levels within the
organization” (p. 18). In order to maintain this leadership, there must be opportunities for
improvement along every step of the way. The success of these training programs will be gauged
by year-to-year improvement on the EVS, an increase in the number of managerial problems
discussed and resolved, and the frequency of shared successful business practices. Overall, this
approach emphasizes the need for managers to maintain a finger on the pulse of the atmosphere
amongst their subordinates.
While these are useful measurement systems, they rely heavily on the USPTO’s ability to
organize and on the self-assessments provided by employees. Surveys are unbiased and able to
get a lot of information for the company, however, employees provide little feedback in the first
years that the surveys are implemented, and it often takes several years of distributing the survey
24
to gather viable data (Harder, 2008). In fact, it takes three to four years to truly see useful results
from surveys, as employees are more likely to complete surveys if they are confident that their
feedback will indeed be used by management to improve working conditions.
2.7 Summary
Employee engagement is one of the central pillars in any successful company. An
understanding of programs at other companies, both successful and unsuccessful, may stir new
ideas for creating employee engagement initiatives as well as new systems for measuring
engagement in the future. The USPTO’s teleworking program is unique in the fact that all
managers are required to work on campus, whereas any patent examiner can work from home.
This presents the difficulty of how to keep examiners who are in another location engaged, and
furthermore, how to measure that engagement. The measurement programs at other companies
provided the basis for the research conducted by our group at the USPTO, as we worked to
develop engagement metrics that are best suited for the USPTO.
25
3.0 Methodology
The goal of this project was to propose a metric system to measure employee engagement
at the USPTO. Through background research, we identified specific pieces of the current
engagement program that we determined may be in need of re-evaluation. Our objectives were
to identify inclusive categories for the metric system, determine employee opinions about
measuring engagement, and determine a baseline level of employee engagement at the USPTO
using our metric system. We have outlined our research methods in the following sections to
address how our major research objectives were reached and how the data from this research was
analyzed to achieve our goal.
3.1 Identification of Engagement Categories for the Metric System
The EVS is created and distributed to all federal agencies by the non-governmental
agency, the Partnership for Public Service. This agency has the intent to standardize a scoring
system to identify the best federal agency to be employed by, as well as provide a roadmap that
these agencies can use to improve their management. The survey contains 84 questions targeted
at determining employee engagement and satisfaction. We analyzed the responses of USPTO
employees to each question to determine the reasons why patent examiners were in favor of,
neutral to, or opposed to a given statement. We closely examined the questions associated with
the three key drivers of employee engagement. This allowed our team to identify the most
important questions to ask in surveys for future use at the USPTO. We then collected the scores
in each key driver category for the past five years. These scores were entered into an Excel
spreadsheet, and the trends in the scores were analyzed to determine category relationships. This
analysis consisted of plotting the previous four years of scores in a line graph and observing the
26
overall trends among the scores. We were looking to see if there were increases from year to year
among key driver satisfaction scores.
Data from the EVS were also collected from the Federal Best Place to Work website.
This data was also analyzed by moving them to an Excel spreadsheet; we created line graphs to
measure changes in each category over the past five years. We chose to compare the USPTO to
the Department of Commerce (DOC) as a whole, because the USPTO is one branch of the DOC,
and comparing it to the whole department enables the USPTO to see where it stands among its
immediate peers. We calculated the difference between the USPTO averages and the
corresponding DOC averages, and plotted the difference on scatterplots to visualize variability in
the responses. The question categories with the most change were identified through the use of
statistical analysis. We calculated the standard deviation of the variables for each category and
time period. We then identified the three categories whose scores had the highest number of
standard deviations from the mean. This allowed us to identify the three lowest scoring
categories that needed to be improved upon by the USPTO.
We received attrition data in the Office of Patent Financial Management report, which
showed the number of supervisory patent examiners (SPEs) and patent examiners who have
resigned, been terminated, or passed away in the past thirteen years (1998-2011). We looked at
the distribution of attrite employees compared to the time that these employees stayed at the
USPTO. We then looked at how many employees resigned, or were terminated during each of
the last thirteen fiscal years and compared the results from each fiscal year. We did this in order
to understand employee retention trends for the past thirteen fiscal years.
27
Along with the attrition data, we also received employee sick leave data from the Office
of Patent Financial Management for the past five fiscal years (2008-2012). First, we looked for
changes in patent examiners’ used leave from year-to-year. Then we divided the sick leave hours
per year by the number of patent examiners at the USPTO each year in order to identify the
average sick leave hours taken per employee. This analysis was done to investigate absenteeism
as an indicator of engagement and to determine the increase or decrease in the use of sick leave
in recent years.
Lastly, we assessed the level of production and recognition among employees at the
USPTO. The data on both production and recognition were obtained from the Human Resources
Office. Production is defined as the number of patents approved each year by examiners, and in
order to measure production we looked at the percentage of employees who performed above the
average level, or at 110% or higher. The data on recognition were split into two categories:
monetary awards (bonuses) and non-monetary awards. Since all employees are paid, it is not
useful to compare pay scales alone. The first category measured the number of employees who
were recognized monetarily with annual bonuses. The second category identified the number of
patent examiners who were annually recognized with non-monetary awards, such as the Gold,
Silver and Bronze USPTO awards for performance.
3.2 Feedback on the Metric System
Due to a low response rate from the SPEs, we only performed one focus group in order to
gain first-hand ideas about what managers would like to see in a measurement system for
employee engagement. We hoped that this focus group would allow us to gain feedback on our
proposed evaluation system, as well include managers in the process of creating a system for
28
measuring the relationships between themselves and the patent examiners.
With the help of the nine technology center (TC) Directors, we contacted thirty-six SPEs,
with the hope of assembling a focus group made up of nine SPEs. To organize the focus group,
each SPE was assigned a number so that four SPEs from each technology center (TCs 1600,
1700, 2100, 2400, 2600, 2800, 2900, 3600, and 3700) could be chosen through a random number
generator. One focus group was then planned since only eleven SPEs responded with an
affirmative; some TC’s were not represented, but enough variation was present with five TC’s
participating. Two members of our WPI team were present, one to lead the group and one to take
notes. The note-taker was present to allow the moderator to focus solely on interacting with the
participants. The moderator introduced the WPI team and our goal of helping the USPTO
measure employee engagement and explained the informed consent policy. The focus group
session followed the protocol in Appendix A, and the minutes of the session can be found in
Appendix B. All questions asked were open-ended and were geared toward gathering input on
the categories that should be included in an engagement index as well as how each category
should be rated.
We also carried out one-on-one interview sessions with Mr. Martin Rater, USPTO
Statistician, who became a vital person in creating and weighting the metric system. Mr. Rater
was selected based on his position held within the office, as he could provide feedback on our
point-based metric system based on experience with other employee related measures. We
carried out four interviews, two formal and two informal, so that way we could make
adjustments as our understanding of the system grew and changed. An interviewer and scribe
were both present with the interviewee. The one-on-one interviews were much more structured
than the focus group sessions, though similar information was gathered. Again, all questions
29
asked were open-ended, but the responses differed in that they reflected the individual’s opinions
without any influence from other employees. Lastly, we were given feedback on our methods of
collecting the EVS, attrition rate, survey results and focus group data. We requested this
feedback during the interview with Mr. Rater in case he could suggest better methods for
collecting data that we had not originally considered.
In order to gain a much wider perspective on employee engagement and approaches to
improving it and measuring it, we carried out two surveys (one to managerial staff and one to
patent examiners) using a web-based means of distributing the questionnaires. The questionnaire
was uploaded to the online survey software, SurveyMonkey, and then distributed as a link
through an email with an explanation of the survey’s purpose.
Mr. James Dwyer, USPTO Assistant Deputy Commissioner, directly distributed the
patent examiner survey to Technology Centers 1600, 1700, 2100 and 2400. Mr. Dwyer then sent
the patent examiner survey to the directors in the remaining Technology Centers: 2600, 2800,
2900, 3600, and 3700; the directors of these five technology centers were asked to send the
survey on to the patent examiners in their centers. This decision to send the survey to two
separate groups of patent examiners (7,700 patent examiners in total) by two different
mechanisms helped us determine if examiners were more likely to respond to the survey if it
came from their direct supervisor, rather than from a more distant supervisor; if the former, then
it would show a higher level of engagement.
The email that distributed the managerial survey contained an attached document that the
WPI team created stating that participation in the survey was voluntary, anonymous, and would
have no impact on the participant’s standing with the USPTO. The email sent from Mr. Dwyer
30
contained a description of the survey and referred the reader to the document. The same
explanation was provided in the body of the email in which the patent examiner survey was sent.
The questions, included in Appendix C, focused on patent examiners’ feelings of engagement,
while the managerial survey was sent to the SPEs (seen in Appendix D) with a focus on the
engagement initiatives they have implemented with the patent examiners they oversee. Both
surveys contained closed questions, but the managerial survey also contained open-ended
questions which asked for their opinions on why they think that engagement initiatives have been
effective or have not been effective. The questions lent themselves to specific and similar
answers given by the SPEs, which allowed us to easily quantify the trends in responses.
3.3 Determine the Current Level of Employee Engagement
In determining measurement plans for current and future employee engagement
initiatives at the USPTO, we established a baseline for employee engagement. We consulted
with the PEET that the USPTO had previously formed in order to establish this baseline.
Consultation with PEET continued throughout our time spent at the USPTO, because the PEET
will be able to use the metrics that we created to measure engagement in the future. This baseline
provided a starting point that USPTO managerial staff can look at years later to determine if their
engagement initiatives have been successful. The formation of this baseline was done through
the use of a point-based metric system. To develop the baseline, we first identified variables such
as communication, attitude, and feelings of employees to be the key to engagement at the
USPTO. We collected information about these variables from previous surveys conducted by the
USPTO, interviews, focus groups, and through our own surveys (see Appendix A, B, C, and D
for interview protocols, focus group protocols, and survey questions).
31
We used the questions and results from the 2011 EVS to analyze employee responses to
engagement and used these responses to help establish the baseline along with the surveys we
sent to patent examiners and managers. Our survey questionnaires mainly focused on the
employees’ and supervisors’ feelings and attitudes toward the USPTO. It also asked how the
employees prefer to contact each other (email, conference call, chat rooms, social networks,
face- to- face, etc.), and how many emails or phone calls they sent to or received from their co-
workers per week. This allowed us to identify the types of communication methods employees
prefer and how often teleworkers communicate with the main office. Therefore, the survey
results gave us an understanding of the employees’ emotional attachment to the USPTO and
helped us to identify the current level of engagement.
With the opening of new branches, the USPTO may have to change its approach to
achieving engagement, from initiatives that involve employees all located in the same place, to
initiatives encompassing the entire company, including teleworkers. The USPTO additionally
has to know what is working in regard to engagement as well as what is not working, which is
where the baseline data we obtained and the system we have developed will become extremely
important. The following chapter contains the results of our research on developing a reliable
way to measure employee engagement at the USPTO.
32
4.0 Results and Analysis
The development of the employee engagement metric system for the USPTO first
involved identifying individual indicators that would be most useful for measuring engagement.
The system was scrutinized many times, and the importance and weighting of each category in
the system was evaluated. The finalized metric system is a fluid model that allows the USPTO to
take multiple indicators of engagement and combine them into one easily defined score. This
section will discuss the different outcomes we obtained when testing and creating the metric
system.
4.1 Employee Opinions of Engagement at the USPTO
We utilized surveys to gather employee opinions on their engagement at the USPTO. We
sent two surveys to employees: one to the patent examiners and the other to the patent
examiner’s supervisors, the SPEs. Collecting data from these two different types of employees at
the USPTO gave us meaningful insights into the engagement process, depending upon the level
of the employee’s experience. Additionally, we analyzed the number of days of sick leave used
and attrition rates amongst employees.
4.1.1 Patent Examiners’ Perspectives
The USPTO has a set guideline for the number of positive responses they hope to receive
whenever they send out questionnaires or conduct interviews. Their goal is to obtain at least five
positive responses for every negative response. The USPTO’s statistical department reasons
that one person will tell around 5 people about a bad experience with a company, whereas that
same person is likely to tell only a couple of people, if any at all, when he/she has a good
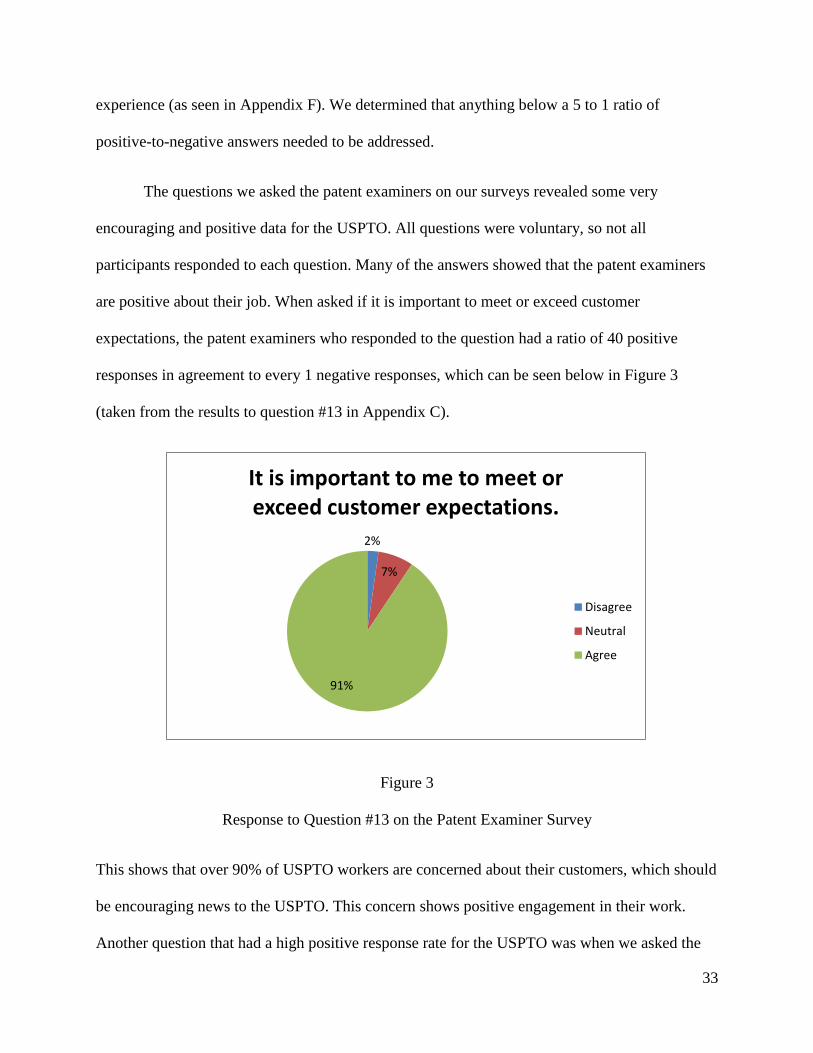
33
experience (as seen in Appendix F). We determined that anything below a 5 to 1 ratio of
positive-to-negative answers needed to be addressed.
The questions we asked the patent examiners on our surveys revealed some very
encouraging and positive data for the USPTO. All questions were voluntary, so not all
participants responded to each question. Many of the answers showed that the patent examiners
are positive about their job. When asked if it is important to meet or exceed customer
expectations, the patent examiners who responded to the question had a ratio of 40 positive
responses in agreement to every 1 negative responses, which can be seen below in Figure 3
(taken from the results to question #13 in Appendix C).
Figure 3
Response to Question #13 on the Patent Examiner Survey
This shows that over 90% of USPTO workers are concerned about their customers, which should
be encouraging news to the USPTO. This concern shows positive engagement in their work.
Another question that had a high positive response rate for the USPTO was when we asked the
2%
7%
91%
It is important to me to meet or exceed customer expectations.
Disagree
Neutral
Agree
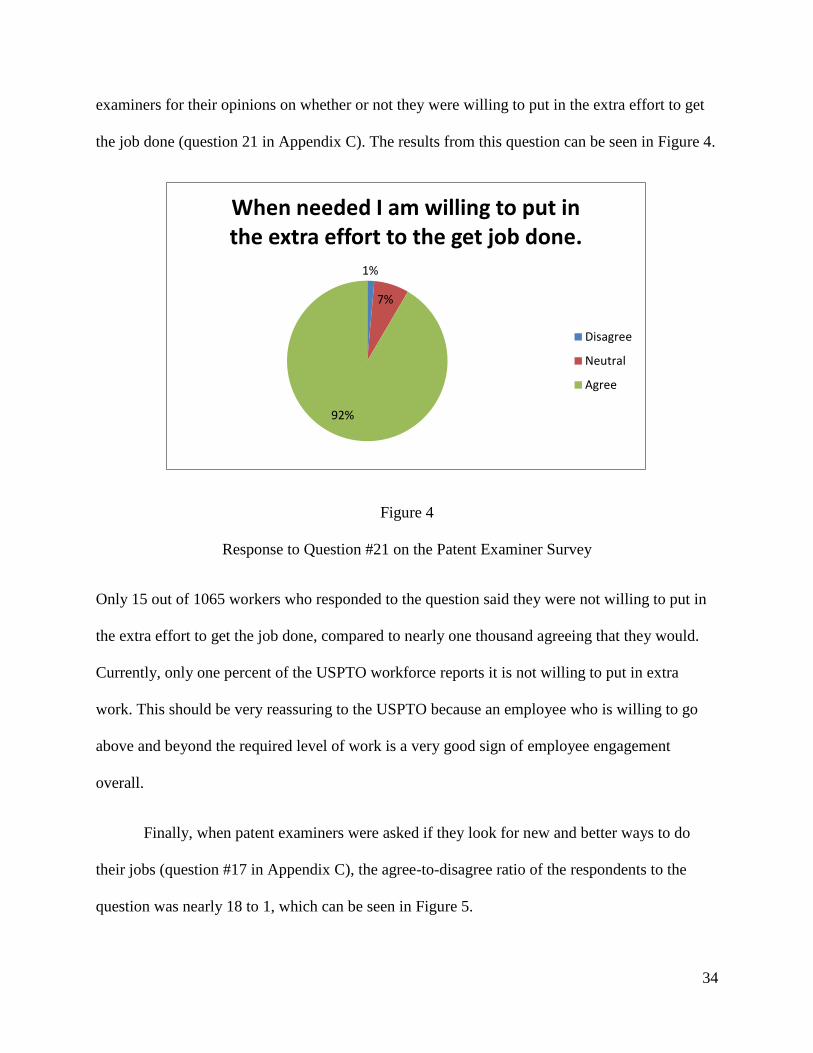
34
examiners for their opinions on whether or not they were willing to put in the extra effort to get
the job done (question 21 in Appendix C). The results from this question can be seen in Figure 4.
Figure 4
Response to Question #21 on the Patent Examiner Survey
Only 15 out of 1065 workers who responded to the question said they were not willing to put in
the extra effort to get the job done, compared to nearly one thousand agreeing that they would.
Currently, only one percent of the USPTO workforce reports it is not willing to put in extra
work. This should be very reassuring to the USPTO because an employee who is willing to go
above and beyond the required level of work is a very good sign of employee engagement
overall.
Finally, when patent examiners were asked if they look for new and better ways to do
their jobs (question #17 in Appendix C), the agree-to-disagree ratio of the respondents to the
question was nearly 18 to 1, which can be seen in Figure 5.
1%
7%
92%
When needed I am willing to put in the extra effort to the get job done.
Disagree
Neutral
Agree
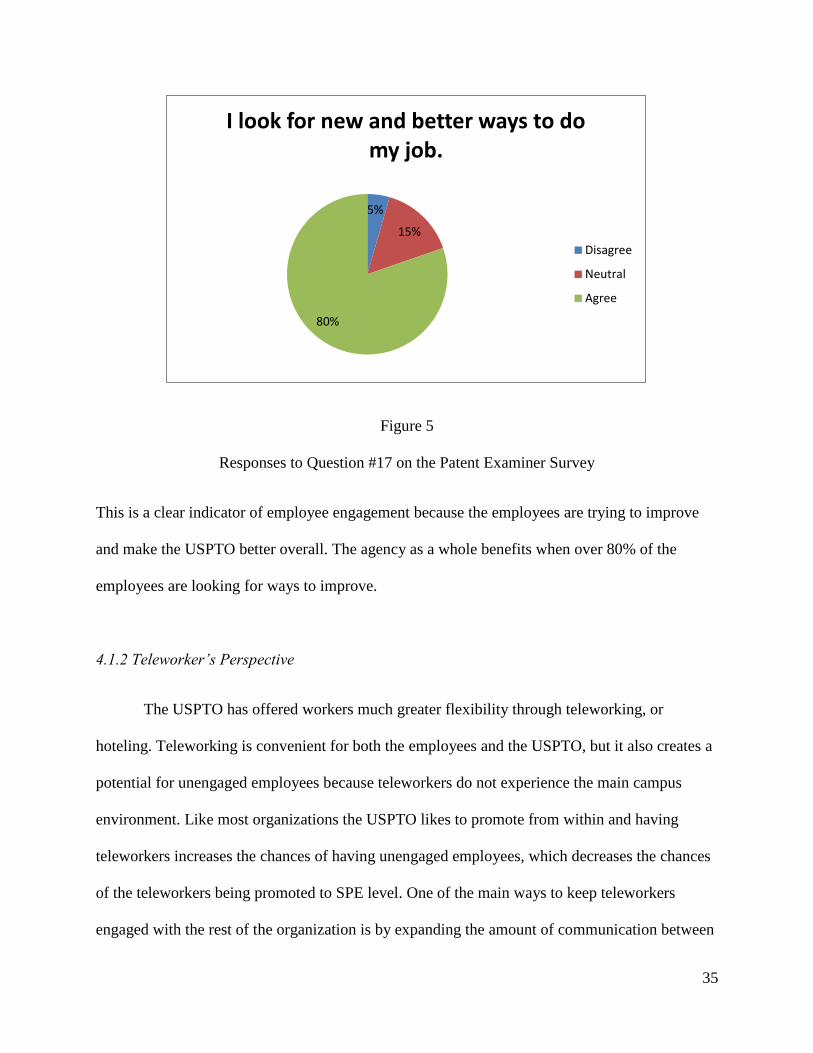
35
Figure 5
Responses to Question #17 on the Patent Examiner Survey
This is a clear indicator of employee engagement because the employees are trying to improve
and make the USPTO better overall. The agency as a whole benefits when over 80% of the
employees are looking for ways to improve.
4.1.2 Teleworker’s Perspective
The USPTO has offered workers much greater flexibility through teleworking, or
hoteling. Teleworking is convenient for both the employees and the USPTO, but it also creates a
potential for unengaged employees because teleworkers do not experience the main campus
environment. Like most organizations the USPTO likes to promote from within and having
teleworkers increases the chances of having unengaged employees, which decreases the chances
of the teleworkers being promoted to SPE level. One of the main ways to keep teleworkers
engaged with the rest of the organization is by expanding the amount of communication between
5%
15%
80%
I look for new and better ways to do my job.
Disagree
Neutral
Agree
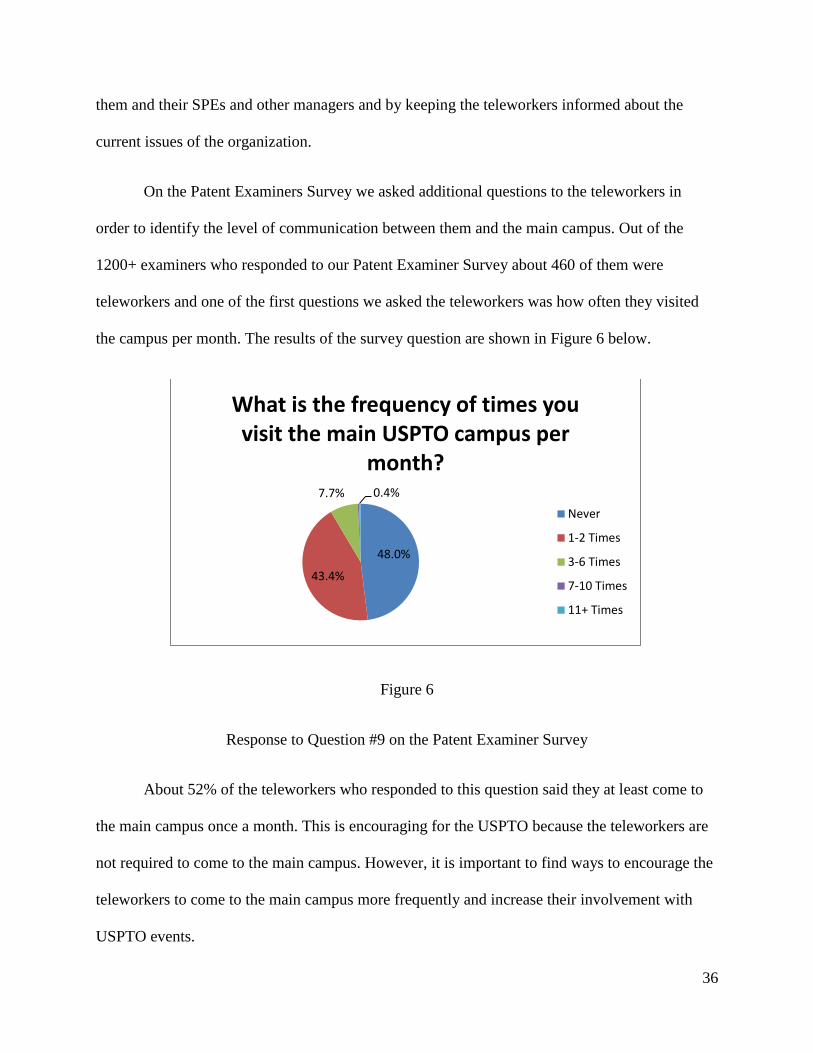
36
them and their SPEs and other managers and by keeping the teleworkers informed about the
current issues of the organization.
On the Patent Examiners Survey we asked additional questions to the teleworkers in
order to identify the level of communication between them and the main campus. Out of the
1200+ examiners who responded to our Patent Examiner Survey about 460 of them were
teleworkers and one of the first questions we asked the teleworkers was how often they visited
the campus per month. The results of the survey question are shown in Figure 6 below.
Figure 6
Response to Question #9 on the Patent Examiner Survey
About 52% of the teleworkers who responded to this question said they at least come to
the main campus once a month. This is encouraging for the USPTO because the teleworkers are
not required to come to the main campus. However, it is important to find ways to encourage the
teleworkers to come to the main campus more frequently and increase their involvement with
USPTO events.
48.0%
43.4%
7.7% 0.4%
What is the frequency of times you visit the main USPTO campus per
month?
Never
1-2 Times
3-6 Times
7-10 Times
11+ Times
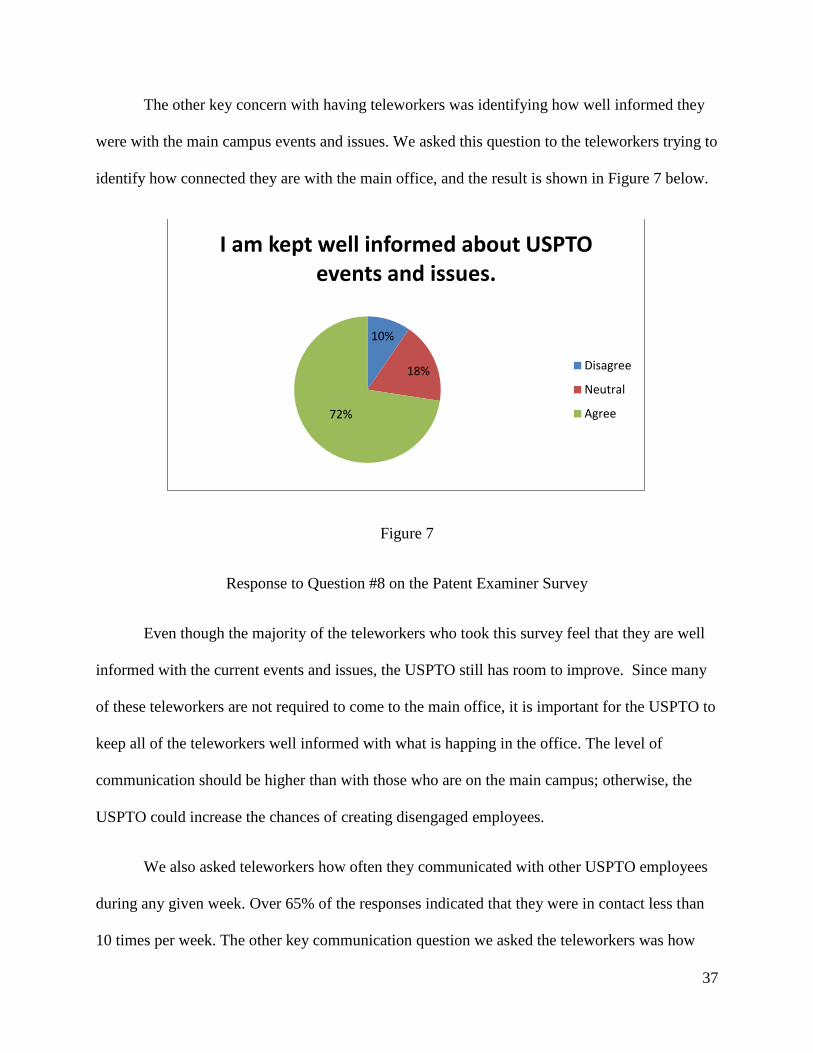
37
The other key concern with having teleworkers was identifying how well informed they
were with the main campus events and issues. We asked this question to the teleworkers trying to
identify how connected they are with the main office, and the result is shown in Figure 7 below.
Figure 7
Response to Question #8 on the Patent Examiner Survey
Even though the majority of the teleworkers who took this survey feel that they are well
informed with the current events and issues, the USPTO still has room to improve. Since many
of these teleworkers are not required to come to the main office, it is important for the USPTO to
keep all of the teleworkers well informed with what is happing in the office. The level of
communication should be higher than with those who are on the main campus; otherwise, the
USPTO could increase the chances of creating disengaged employees.
We also asked teleworkers how often they communicated with other USPTO employees
during any given week. Over 65% of the responses indicated that they were in contact less than
10 times per week. The other key communication question we asked the teleworkers was how
10%
18%
72%
I am kept well informed about USPTO events and issues.
Disagree
Neutral
Agree
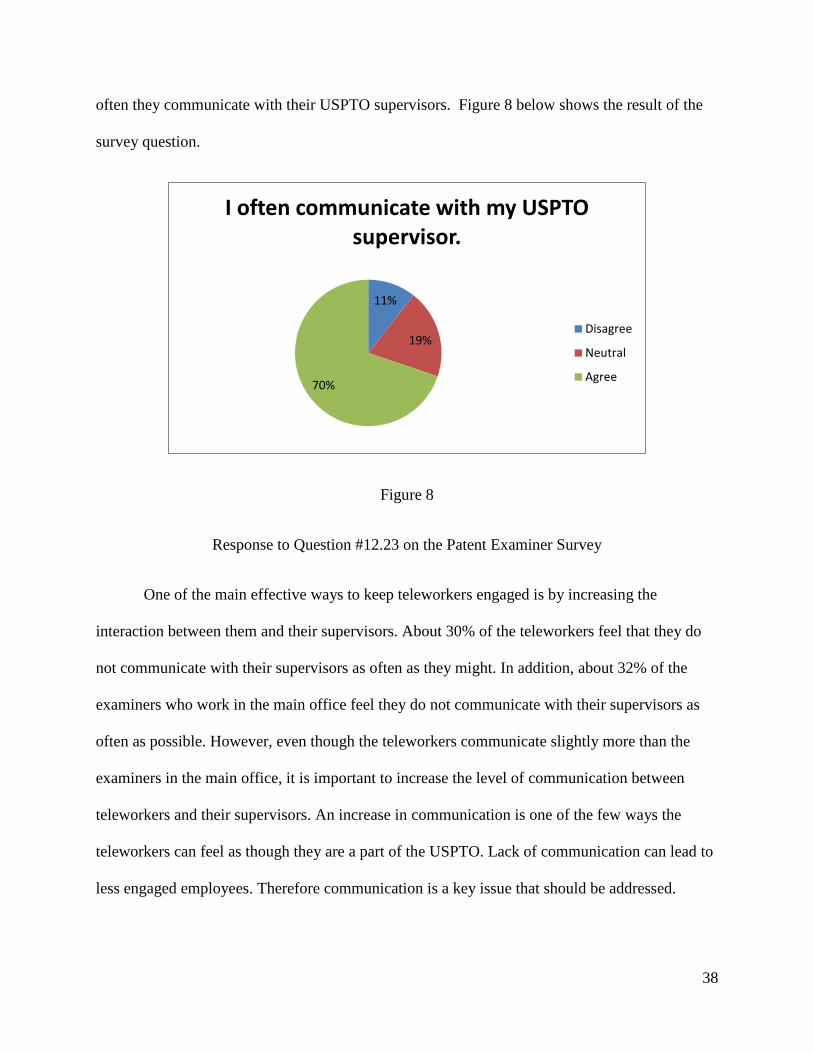
38
often they communicate with their USPTO supervisors. Figure 8 below shows the result of the
survey question.
Figure 8
Response to Question #12.23 on the Patent Examiner Survey
One of the main effective ways to keep teleworkers engaged is by increasing the
interaction between them and their supervisors. About 30% of the teleworkers feel that they do
not communicate with their supervisors as often as they might. In addition, about 32% of the
examiners who work in the main office feel they do not communicate with their supervisors as
often as possible. However, even though the teleworkers communicate slightly more than the
examiners in the main office, it is important to increase the level of communication between
teleworkers and their supervisors. An increase in communication is one of the few ways the
teleworkers can feel as though they are a part of the USPTO. Lack of communication can lead to
less engaged employees. Therefore communication is a key issue that should be addressed.
11%
19%
70%
I often communicate with my USPTO supervisor.
Disagree
Neutral
Agree
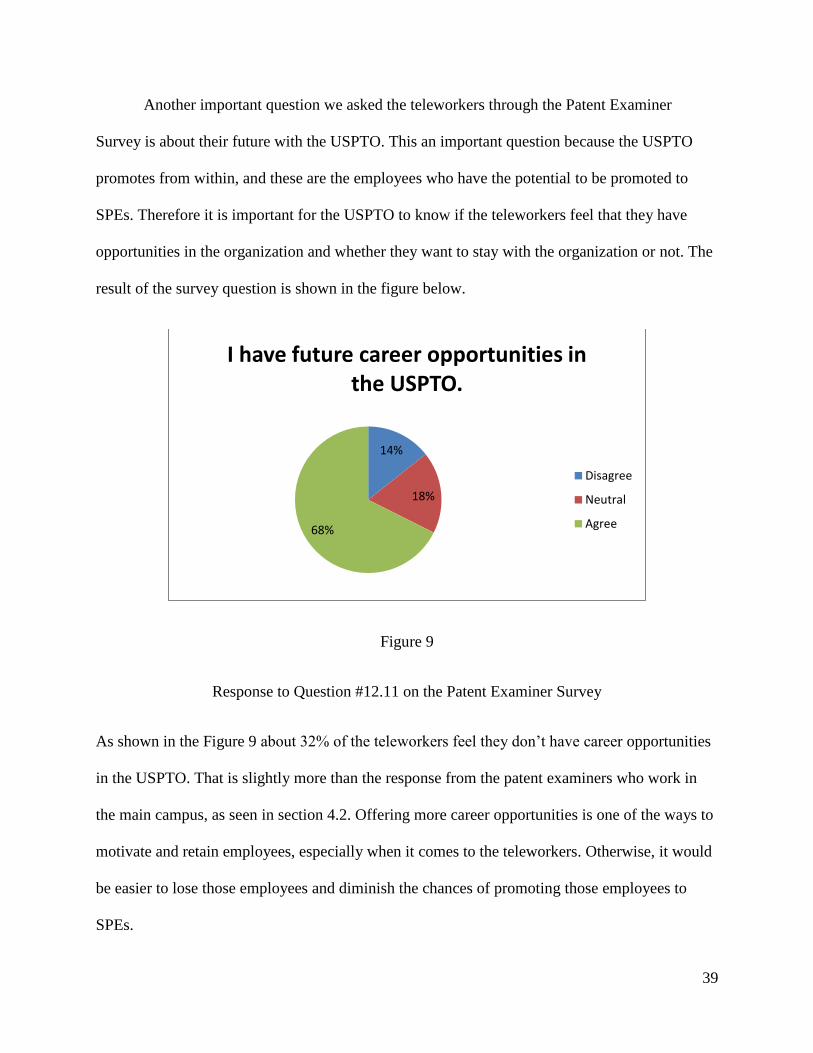
39
Another important question we asked the teleworkers through the Patent Examiner
Survey is about their future with the USPTO. This an important question because the USPTO
promotes from within, and these are the employees who have the potential to be promoted to
SPEs. Therefore it is important for the USPTO to know if the teleworkers feel that they have
opportunities in the organization and whether they want to stay with the organization or not. The
result of the survey question is shown in the figure below.
Figure 9
Response to Question #12.11 on the Patent Examiner Survey
As shown in the Figure 9 about 32% of the teleworkers feel they don’t have career opportunities
in the USPTO. That is slightly more than the response from the patent examiners who work in
the main campus, as seen in section 4.2. Offering more career opportunities is one of the ways to
motivate and retain employees, especially when it comes to the teleworkers. Otherwise, it would
be easier to lose those employees and diminish the chances of promoting those employees to
SPEs.
14%
18%
68%
I have future career opportunities in the USPTO.
Disagree
Neutral
Agree
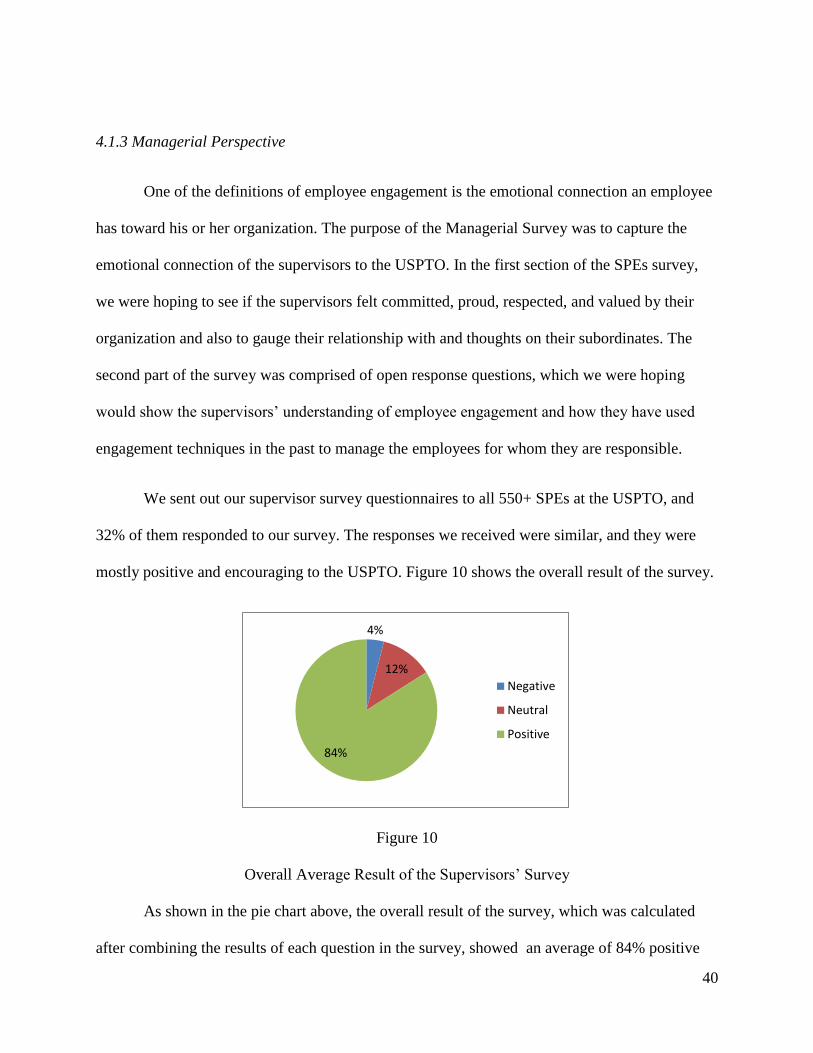
40
4.1.3 Managerial Perspective
One of the definitions of employee engagement is the emotional connection an employee
has toward his or her organization. The purpose of the Managerial Survey was to capture the
emotional connection of the supervisors to the USPTO. In the first section of the SPEs survey,
we were hoping to see if the supervisors felt committed, proud, respected, and valued by their
organization and also to gauge their relationship with and thoughts on their subordinates. The
second part of the survey was comprised of open response questions, which we were hoping
would show the supervisors’ understanding of employee engagement and how they have used
engagement techniques in the past to manage the employees for whom they are responsible.
We sent out our supervisor survey questionnaires to all 550+ SPEs at the USPTO, and
32% of them responded to our survey. The responses we received were similar, and they were
mostly positive and encouraging to the USPTO. Figure 10 shows the overall result of the survey.
Figure 10
Overall Average Result of the Supervisors’ Survey
As shown in the pie chart above, the overall result of the survey, which was calculated
after combining the results of each question in the survey, showed an average of 84% positive
4%
12%
84%
Negative
Neutral
Positive
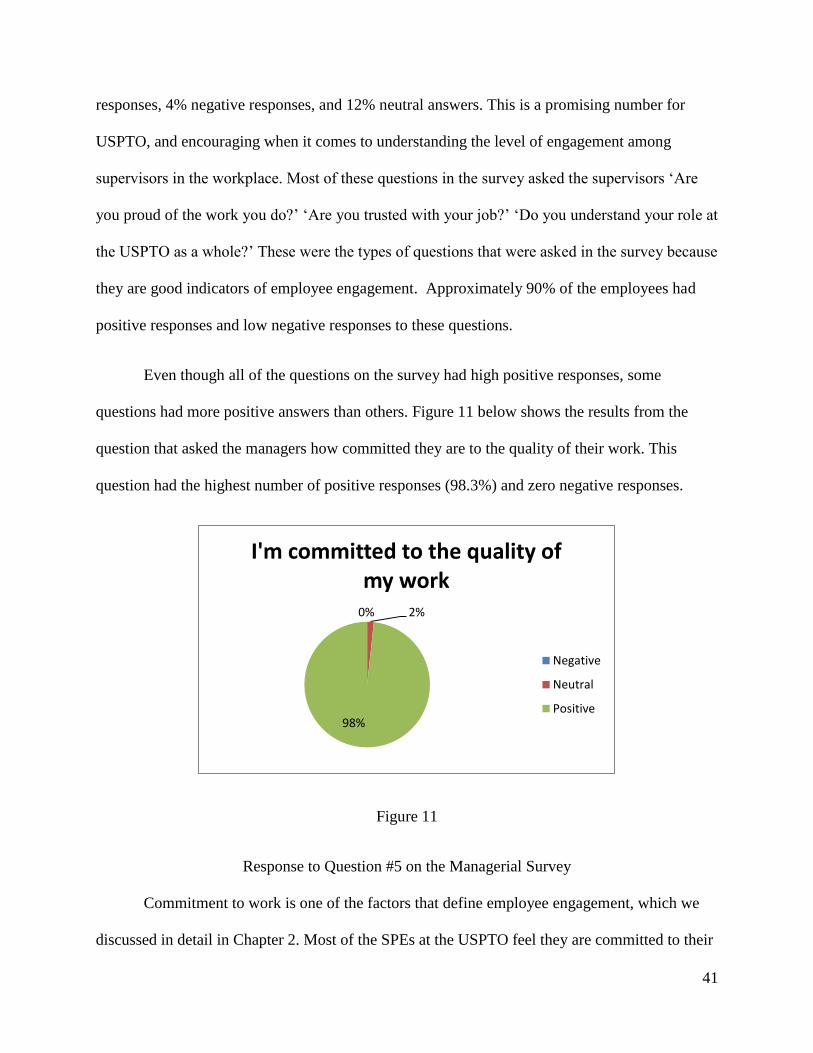
41
responses, 4% negative responses, and 12% neutral answers. This is a promising number for
USPTO, and encouraging when it comes to understanding the level of engagement among
supervisors in the workplace. Most of these questions in the survey asked the supervisors ‘Are
you proud of the work you do?’ ‘Are you trusted with your job?’ ‘Do you understand your role at
the USPTO as a whole?’ These were the types of questions that were asked in the survey because
they are good indicators of employee engagement. Approximately 90% of the employees had
positive responses and low negative responses to these questions.
Even though all of the questions on the survey had high positive responses, some
questions had more positive answers than others. Figure 11 below shows the results from the
question that asked the managers how committed they are to the quality of their work. This
question had the highest number of positive responses (98.3%) and zero negative responses.
Figure 11
Response to Question #5 on the Managerial Survey
Commitment to work is one of the factors that define employee engagement, which we
discussed in detail in Chapter 2. Most of the SPEs at the USPTO feel they are committed to their
0% 2%
98%
I'm committed to the quality of my work
Negative
Neutral
Positive
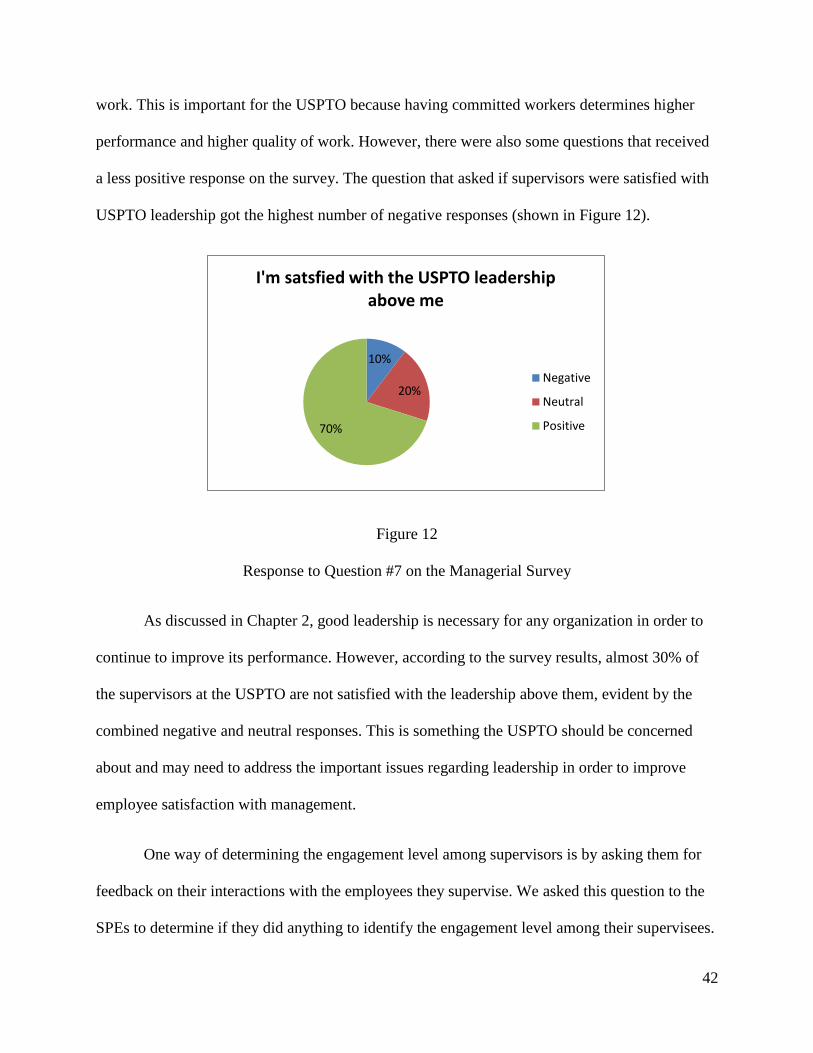
42
work. This is important for the USPTO because having committed workers determines higher
performance and higher quality of work. However, there were also some questions that received
a less positive response on the survey. The question that asked if supervisors were satisfied with
USPTO leadership got the highest number of negative responses (shown in Figure 12).
Figure 12
Response to Question #7 on the Managerial Survey
As discussed in Chapter 2, good leadership is necessary for any organization in order to
continue to improve its performance. However, according to the survey results, almost 30% of
the supervisors at the USPTO are not satisfied with the leadership above them, evident by the
combined negative and neutral responses. This is something the USPTO should be concerned
about and may need to address the important issues regarding leadership in order to improve
employee satisfaction with management.
One way of determining the engagement level among supervisors is by asking them for
feedback on their interactions with the employees they supervise. We asked this question to the
SPEs to determine if they did anything to identify the engagement level among their supervisees.
10%
20%
70%
I'm satsfied with the USPTO leadership above me
Negative
Neutral
Positive
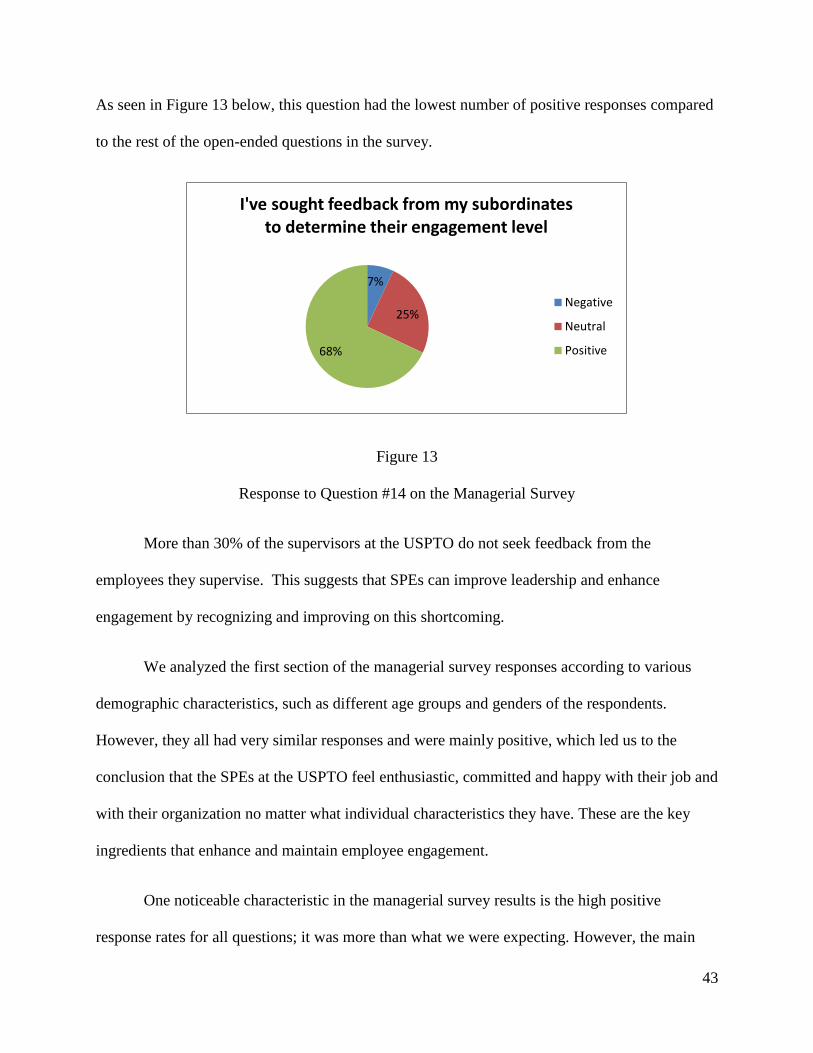
43
As seen in Figure 13 below, this question had the lowest number of positive responses compared
to the rest of the open-ended questions in the survey.
Figure 13
Response to Question #14 on the Managerial Survey
More than 30% of the supervisors at the USPTO do not seek feedback from the
employees they supervise. This suggests that SPEs can improve leadership and enhance
engagement by recognizing and improving on this shortcoming.
We analyzed the first section of the managerial survey responses according to various
demographic characteristics, such as different age groups and genders of the respondents.
However, they all had very similar responses and were mainly positive, which led us to the
conclusion that the SPEs at the USPTO feel enthusiastic, committed and happy with their job and
with their organization no matter what individual characteristics they have. These are the key
ingredients that enhance and maintain employee engagement.
One noticeable characteristic in the managerial survey results is the high positive
response rates for all questions; it was more than what we were expecting. However, the main
7%
25%
68%
I've sought feedback from my subordinates to determine their engagement level
Negative
Neutral
Positive
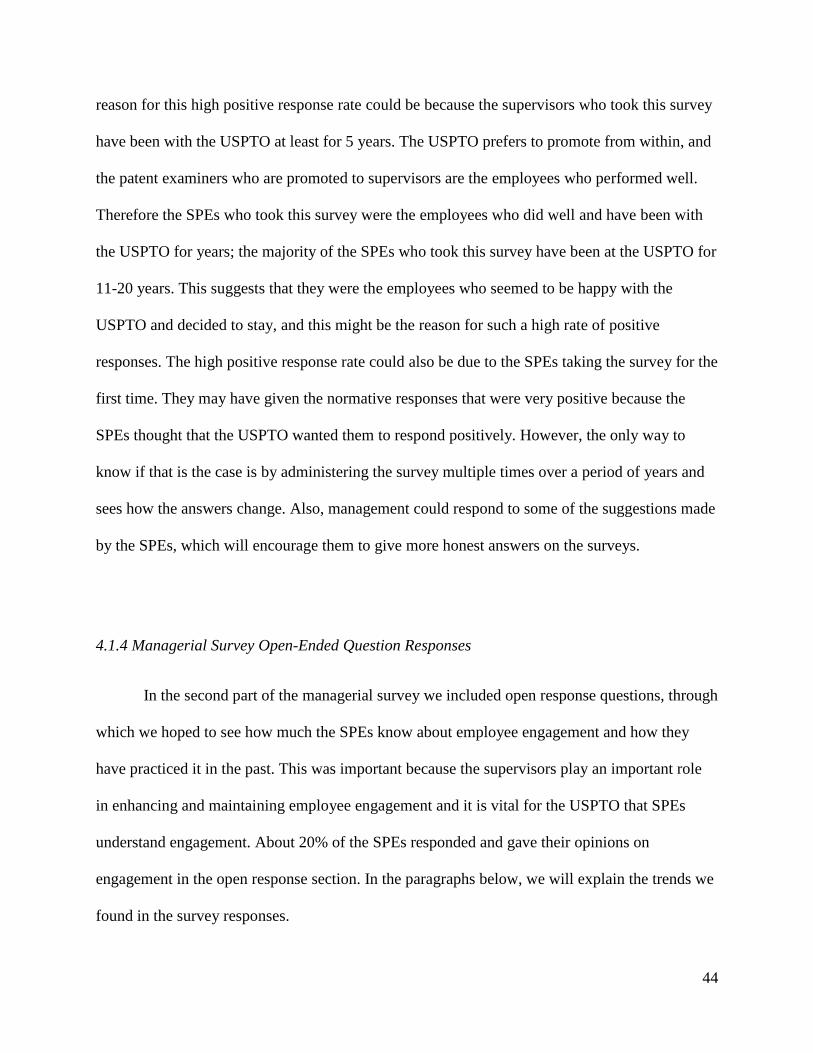
44
reason for this high positive response rate could be because the supervisors who took this survey
have been with the USPTO at least for 5 years. The USPTO prefers to promote from within, and
the patent examiners who are promoted to supervisors are the employees who performed well.
Therefore the SPEs who took this survey were the employees who did well and have been with
the USPTO for years; the majority of the SPEs who took this survey have been at the USPTO for
11-20 years. This suggests that they were the employees who seemed to be happy with the
USPTO and decided to stay, and this might be the reason for such a high rate of positive
responses. The high positive response rate could also be due to the SPEs taking the survey for the
first time. They may have given the normative responses that were very positive because the
SPEs thought that the USPTO wanted them to respond positively. However, the only way to
know if that is the case is by administering the survey multiple times over a period of years and
sees how the answers change. Also, management could respond to some of the suggestions made
by the SPEs, which will encourage them to give more honest answers on the surveys.
4.1.4 Managerial Survey Open-Ended Question Responses
In the second part of the managerial survey we included open response questions, through
which we hoped to see how much the SPEs know about employee engagement and how they
have practiced it in the past. This was important because the supervisors play an important role
in enhancing and maintaining employee engagement and it is vital for the USPTO that SPEs
understand engagement. About 20% of the SPEs responded and gave their opinions on
engagement in the open response section. In the paragraphs below, we will explain the trends we
found in the survey responses.
45
When asked to define employee engagement in their own words, the supervisors at the
USPTO had a variety of answers; however, there were some noticeable trends. The supervisors
felt that communication was vital to the success of the USPTO and without it, production would
suffer. Communication was deemed the best indicator for measuring employee engagement.
They felt that employees would not be as engaged without proper communication between
themselves and their bosses. Figure 14 below shows the ranking of preferred methods of
communication for the supervisors.
Figure 14
Preferred Method of Communication for SPEs
The first choice in communication method for SPEs is face-to-face, followed by emails
and phone calls. This is important data for the USPTO to look at because it shows that the SPEs
believe a big part of engagement is communication, and it is important that the USPTO improve
and facilitate their preferred methods of communication.
The other main part of defining employee engagement that many of the supervisors
agreed on was that examiners needed to be motivated and excited about their work. They argued
0
1
2
3
4
5
6
Face-to-Face Phone Calls Email IM VideoConference
SocialNetworks
Ave
rage
Ran
kin
g
46
that engaged workers are the type of people who like their jobs and submit their work in a timely
manner. These are employees who are always willing to go above and beyond, while consistently
producing quality work and meeting any time restrictions.
Another open-ended question posed to the SPEs in the supervisor survey was one asking
about how the SPEs gauge employee engagement among their subordinates; in essence, they
were asked how they determine if the examiners they oversee are positively or negatively
engaged. Overall, SPEs reported they use two ways to gauge engagement, depending on the
individual SPEs employee engagement definition. About 41% of the SPEs liked to use the level
of productivity as a tool to gauge engagement, confirming ideas we had previously formed. We
realized that SPEs like to measure something that they can control and can be represented in
numbers. Looking at productivity based on the number of approved or rejected patents is an
easy numerical way to determine if an examiner is doing his/her job well, and to some SPEs this
indicates good employee engagement.
Approximately 56% of the SPEs gauge employee engagement through direct interaction,
or communication, as seen in the first open-response question answers. Whether this involves
talking face-to-face or communicating over email, phone, or video conference with teleworkers,
SPEs like to interact with the examiners to determine if they are engaged. Feedback can be
exchanged, and discussion about topics other than work can happen as well. SPEs find that it is
easiest to measure engagement with direct interaction and the frequency with which non-work
related topics come up in conversation. In the open-ended responses, the theme of
communicating and interacting with examiners was much more common than the theme of
production and productivity. Even though communication and personal interaction was the
preferred method that SPEs use to gauge patent examiner engagement, it brings up challenges
47
when it comes to teleworkers. In the open-ended responses only 4% of the SPEs mention any
initiatives they used to gauge engagement among the teleworkers, so it important that they
develop and expand other forms of communications. such as emails and video conferencing, in
order to engage the teleworkers.
The survey additionally asked the SPEs what they would consider to be the best way to
measure employee engagement, or what metric could be implemented in the future. The open-
ended responses show that about 60% of the SPEs would encourage face-to-face communication
and interaction to measure engagement, which are methods they used in the past to measure
engagement. They also mentioned looking at the productivity and ability of the individual
examiners to excel in their careers. The measurement of productivity was further defined as the
use of docket management, which measures the quality and amount of work being produced by
examiners.
Another question that the managerial survey’s open-ended section asked the SPEs was
what kind of initiatives geared toward increasing engagement were they a part of. Figure 15
below shows the engagement initiatives the SPEs have used in the past.
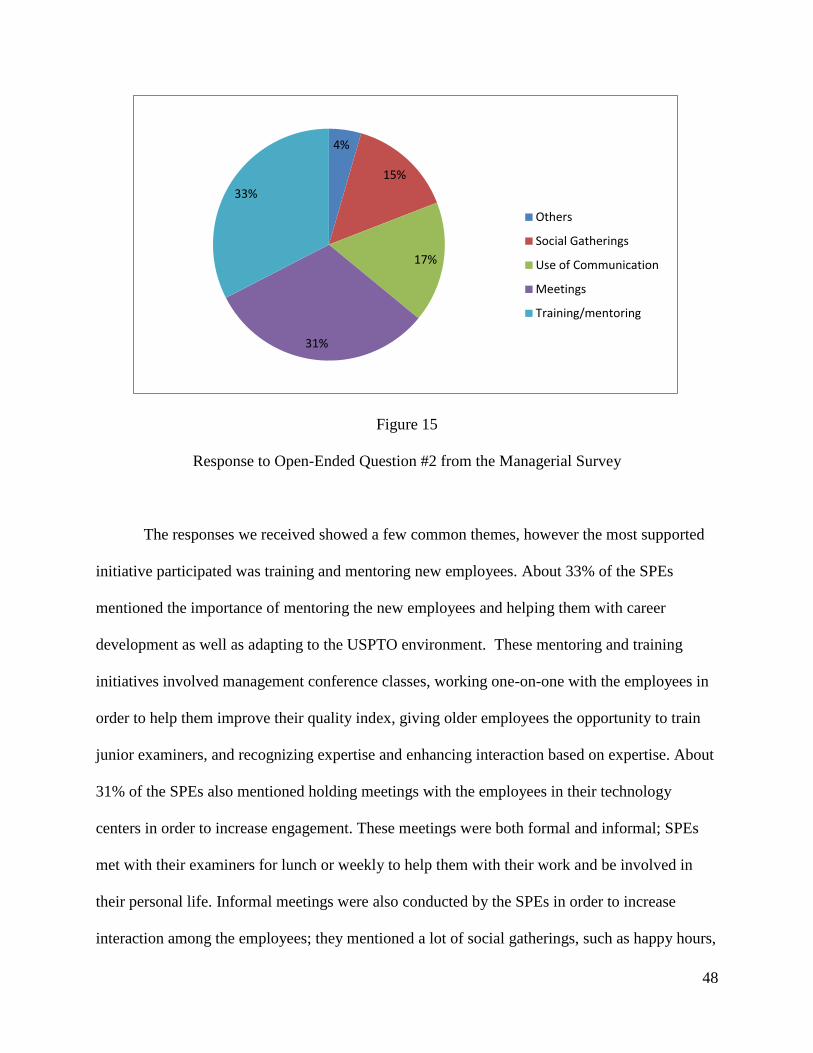
48
Figure 15
Response to Open-Ended Question #2 from the Managerial Survey
The responses we received showed a few common themes, however the most supported
initiative participated was training and mentoring new employees. About 33% of the SPEs
mentioned the importance of mentoring the new employees and helping them with career
development as well as adapting to the USPTO environment. These mentoring and training
initiatives involved management conference classes, working one-on-one with the employees in
order to help them improve their quality index, giving older employees the opportunity to train
junior examiners, and recognizing expertise and enhancing interaction based on expertise. About
31% of the SPEs also mentioned holding meetings with the employees in their technology
centers in order to increase engagement. These meetings were both formal and informal; SPEs
met with their examiners for lunch or weekly to help them with their work and be involved in
their personal life. Informal meetings were also conducted by the SPEs in order to increase
interaction among the employees; they mentioned a lot of social gatherings, such as happy hours,
4%
15%
17%
31%
33%
Others
Social Gatherings
Use of Communication
Meetings
Training/mentoring
49
birthdays, holidays, and community days. Additionally, some SPEs hold one-on-one interviews
and focus groups with their employees seeking feedback on their work as a manager.
The other main initiative that 17% of the SPEs mentioned was the use of communication.
These communication methods involve having open door policies in order to increase
communication and encouraging their employees to come to their office and interact with them.
The SPEs also mentioned adapting to their employees preference of communication, since some
employees prefer IM rather than phone calls. However, as previously mentioned, these methods
become challenging when it comes to teleworkers. We found very few responses on initiatives
they took to increase engagement among the teleworkers. We also found that the SPEs
mentioned very few other important engagement initiatives, such as recognizing employees,
trusting employees, and giving their employees more responsibilities. These are important
engagement initiatives that will allow the employees to feel valued in the organization. It is also
important that the SPEs personally acknowledge their employees for the work they are doing.
Additionally, the survey asked the supervisors how they gauged the success of initiatives
put in place to improve employee engagement. The supervisors seemed to agree that the most
important measure of success at the USPTO is an examiner’s productivity, and therefore,
performance. This includes having good attendance and meeting their assigned goals. The SPEs’
argument stated that if an employee was not engaged or coming into work, he or she would not
be producing at the desired level, and their performance would suffer. SPEs use biweekly
reports, as well as looking at each examiner’s production over pay periods, quarters and whole
fiscal years. In addition, about 45 % of the supervisors measured the levels of success of
initiatives of employee engagement through communication with their subordinates and co-
workers. Many of the supervisors ask employees for feedback on ways to improve, through
50
surveys, face-to-face interviews or meetings. A final way to gauge the success of employee
engagement, which about 32% of the supervisors agreed upon, was to see the success through
observing their employees. They claimed that a useful measurement of engagement is an
examiner’s attitude. When examiners seem excited and in a good mood, they are much more
engaged and motivated.
The overall theme we found in many of the responses was that about 41% of the SPEs
who responded to the open-ended survey questions view performance as the main indicator of
employee engagement. However, that is not entirely true. Indeed, performance is one of the
indicators of engagement, but it is not the most important one. An employee can perform well
and dislike his or her job at the same time, and that is not the ideal work place the USPTO is
trying to create. Therefore, it is important that the SPEs understand the other aspects of
engagement in order to enhance and maintain employee engagement at the USPTO.
4.1.5 Employee Viewpoint Survey Responses
The EVS is distributed to all federal agencies, making it a standardized assessment tool
when comparing one agency to another. The EVS encompasses seventeen categories that
questions are sorted into, and the agency is scored on. In order to make the most out of the
employee engagement questions asked of the USPTO employees, our team analyzed the results
from three different measurements.
The first measurement is the USPTO’s overall average index score for 2011. This index
score is compared to the overall average index score of the entire Department of Commerce
(DOC). The USPTO’s overall index score for 2011 was 74.1 points, which was an increase of
6.6 points from 2010. In comparison, the overall DOC index score was 67.5, which was a one
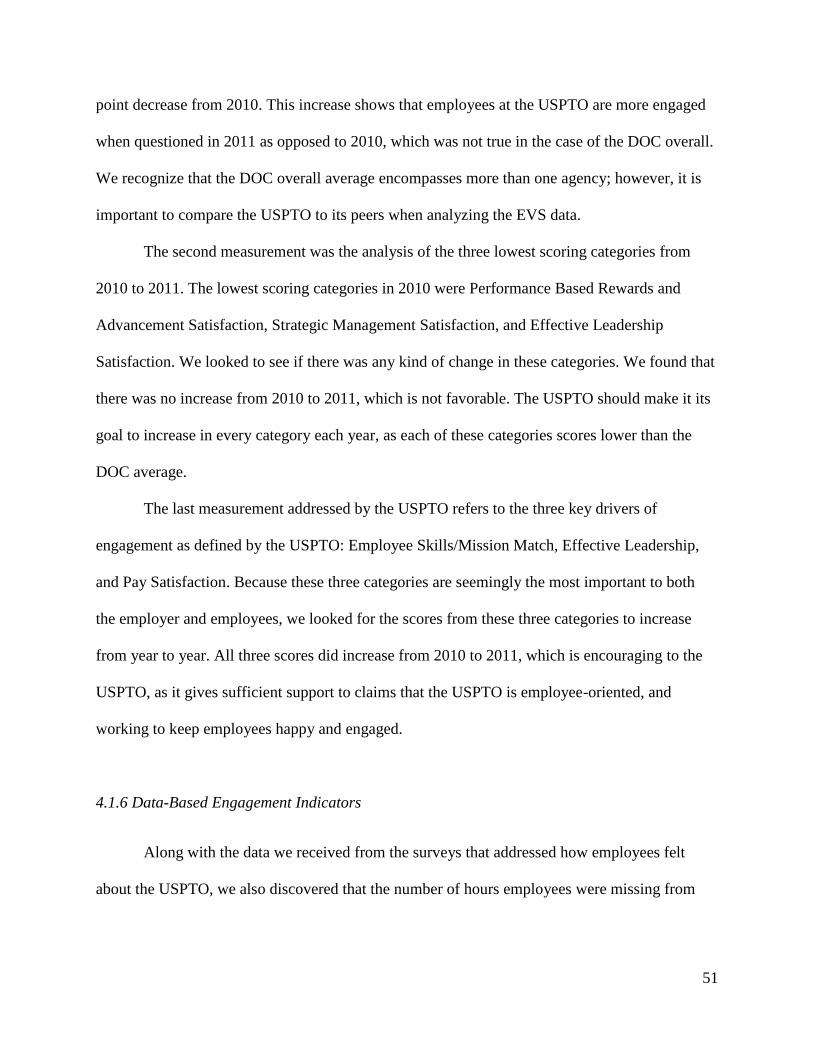
51
point decrease from 2010. This increase shows that employees at the USPTO are more engaged
when questioned in 2011 as opposed to 2010, which was not true in the case of the DOC overall.
We recognize that the DOC overall average encompasses more than one agency; however, it is
important to compare the USPTO to its peers when analyzing the EVS data.
The second measurement was the analysis of the three lowest scoring categories from
2010 to 2011. The lowest scoring categories in 2010 were Performance Based Rewards and
Advancement Satisfaction, Strategic Management Satisfaction, and Effective Leadership
Satisfaction. We looked to see if there was any kind of change in these categories. We found that
there was no increase from 2010 to 2011, which is not favorable. The USPTO should make it its
goal to increase in every category each year, as each of these categories scores lower than the
DOC average.
The last measurement addressed by the USPTO refers to the three key drivers of
engagement as defined by the USPTO: Employee Skills/Mission Match, Effective Leadership,
and Pay Satisfaction. Because these three categories are seemingly the most important to both
the employer and employees, we looked for the scores from these three categories to increase
from year to year. All three scores did increase from 2010 to 2011, which is encouraging to the
USPTO, as it gives sufficient support to claims that the USPTO is employee-oriented, and
working to keep employees happy and engaged.
4.1.6 Data-Based Engagement Indicators
Along with the data we received from the surveys that addressed how employees felt
about the USPTO, we also discovered that the number of hours employees were missing from
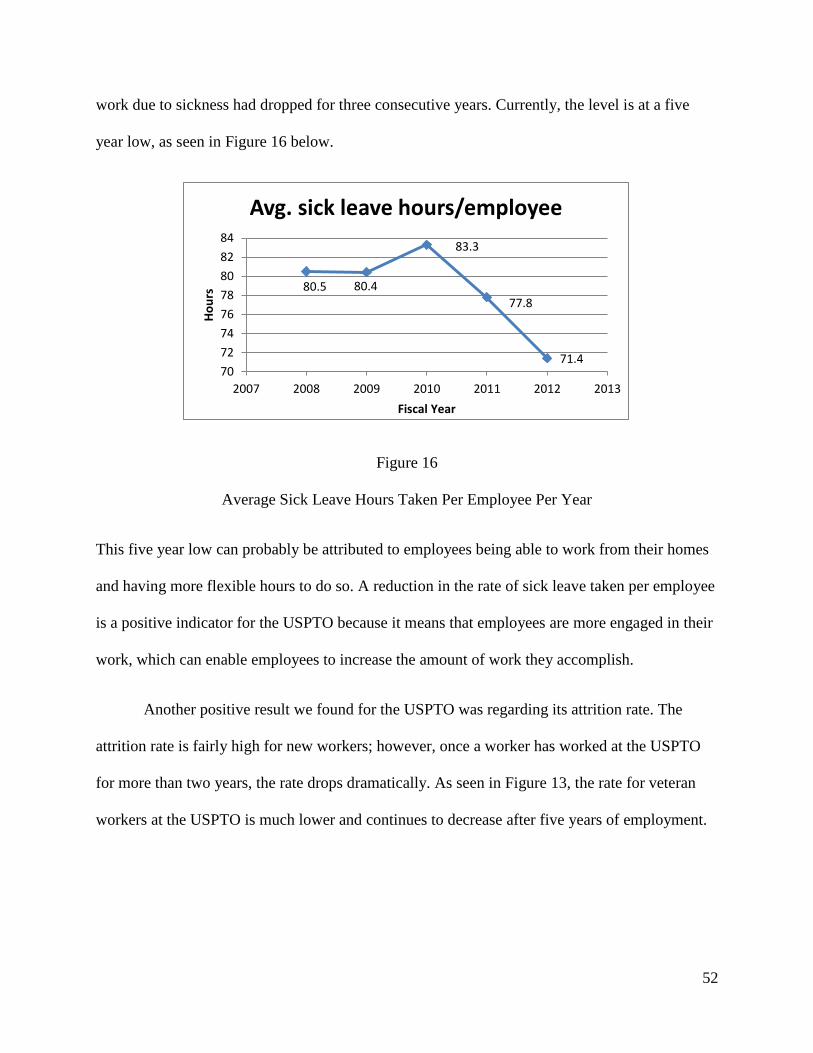
52
work due to sickness had dropped for three consecutive years. Currently, the level is at a five
year low, as seen in Figure 16 below.
Figure 16
Average Sick Leave Hours Taken Per Employee Per Year
This five year low can probably be attributed to employees being able to work from their homes
and having more flexible hours to do so. A reduction in the rate of sick leave taken per employee
is a positive indicator for the USPTO because it means that employees are more engaged in their
work, which can enable employees to increase the amount of work they accomplish.
Another positive result we found for the USPTO was regarding its attrition rate. The
attrition rate is fairly high for new workers; however, once a worker has worked at the USPTO
for more than two years, the rate drops dramatically. As seen in Figure 13, the rate for veteran
workers at the USPTO is much lower and continues to decrease after five years of employment.
80.5 80.4
83.3
77.8
71.4 70
72
74
76
78
80
82
84
2007 2008 2009 2010 2011 2012 2013
Ho
urs
Fiscal Year
Avg. sick leave hours/employee
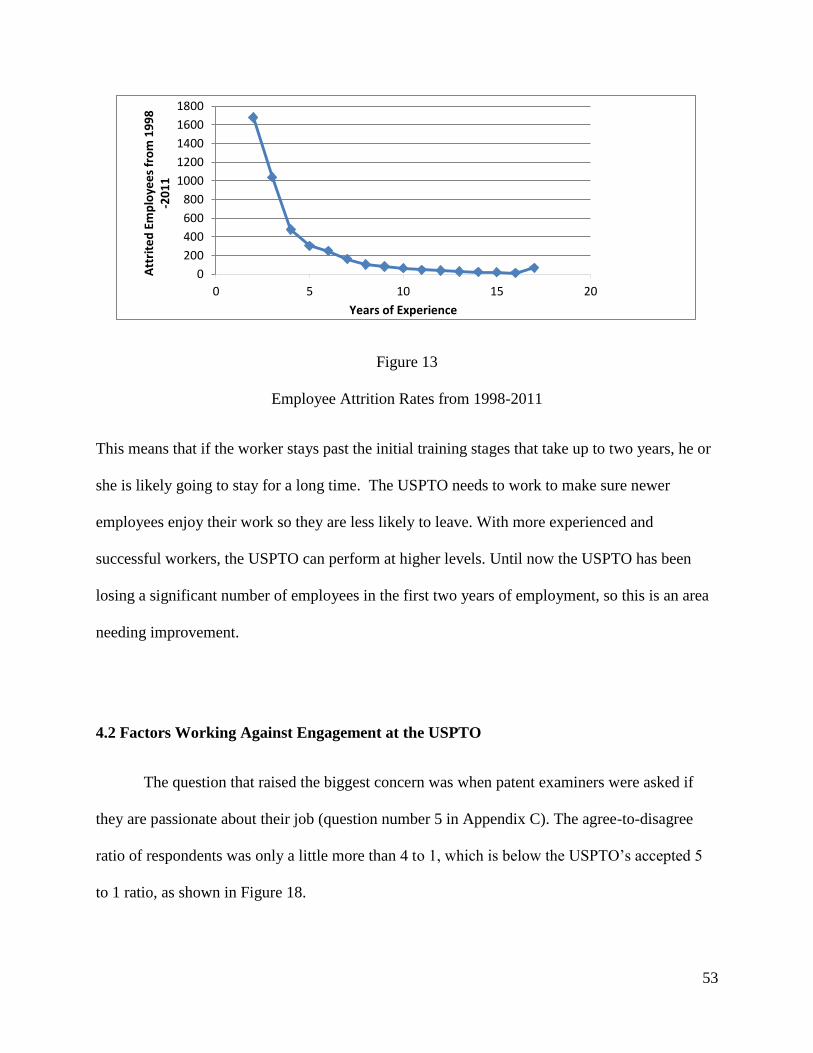
53
Figure 13
Employee Attrition Rates from 1998-2011
This means that if the worker stays past the initial training stages that take up to two years, he or
she is likely going to stay for a long time. The USPTO needs to work to make sure newer
employees enjoy their work so they are less likely to leave. With more experienced and
successful workers, the USPTO can perform at higher levels. Until now the USPTO has been
losing a significant number of employees in the first two years of employment, so this is an area
needing improvement.
4.2 Factors Working Against Engagement at the USPTO
The question that raised the biggest concern was when patent examiners were asked if
they are passionate about their job (question number 5 in Appendix C). The agree-to-disagree
ratio of respondents was only a little more than 4 to 1, which is below the USPTO’s accepted 5
to 1 ratio, as shown in Figure 18.
0
200
400
600
800
1000
1200
1400
1600
1800
0 5 10 15 20
Att
rite
d E
mp
loye
es
fro
m 1
99
8
-20
11
Years of Experience
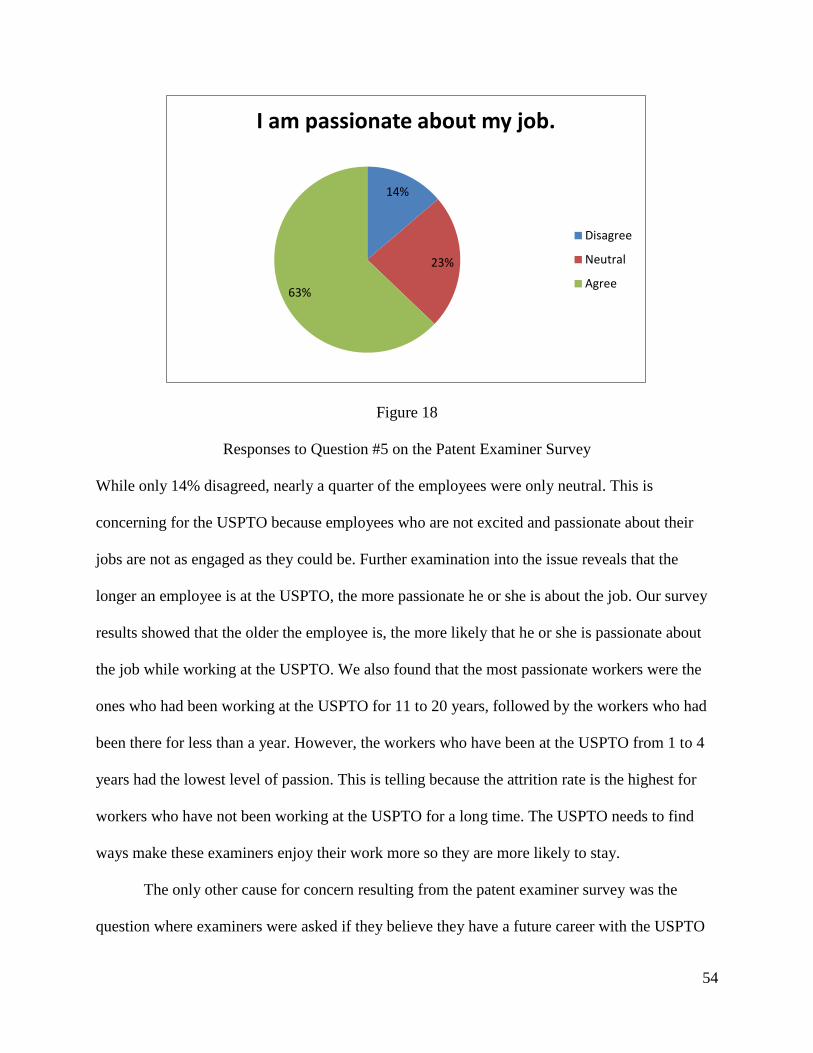
54
Figure 18
Responses to Question #5 on the Patent Examiner Survey
While only 14% disagreed, nearly a quarter of the employees were only neutral. This is
concerning for the USPTO because employees who are not excited and passionate about their
jobs are not as engaged as they could be. Further examination into the issue reveals that the
longer an employee is at the USPTO, the more passionate he or she is about the job. Our survey
results showed that the older the employee is, the more likely that he or she is passionate about
the job while working at the USPTO. We also found that the most passionate workers were the
ones who had been working at the USPTO for 11 to 20 years, followed by the workers who had
been there for less than a year. However, the workers who have been at the USPTO from 1 to 4
years had the lowest level of passion. This is telling because the attrition rate is the highest for
workers who have not been working at the USPTO for a long time. The USPTO needs to find
ways make these examiners enjoy their work more so they are more likely to stay.
The only other cause for concern resulting from the patent examiner survey was the
question where examiners were asked if they believe they have a future career with the USPTO
14%
23%
63%
I am passionate about my job.
Disagree
Neutral
Agree
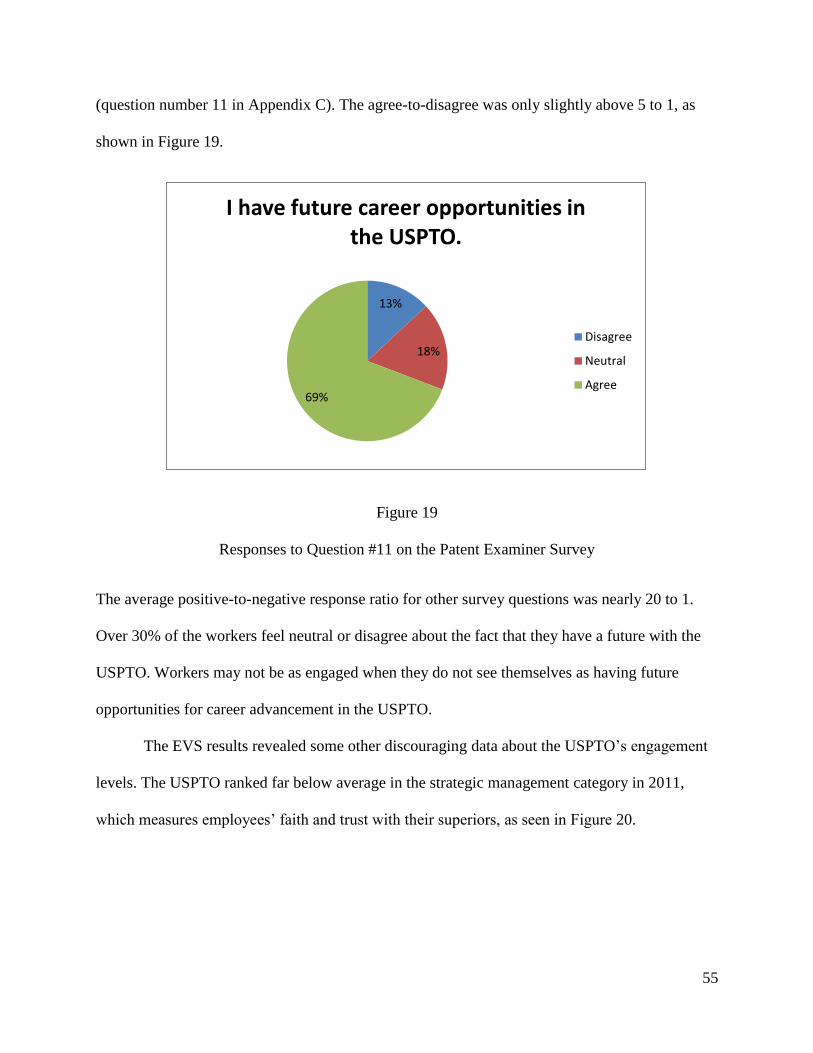
55
(question number 11 in Appendix C). The agree-to-disagree was only slightly above 5 to 1, as
shown in Figure 19.
Figure 19
Responses to Question #11 on the Patent Examiner Survey
The average positive-to-negative response ratio for other survey questions was nearly 20 to 1.
Over 30% of the workers feel neutral or disagree about the fact that they have a future with the
USPTO. Workers may not be as engaged when they do not see themselves as having future
opportunities for career advancement in the USPTO.
The EVS results revealed some other discouraging data about the USPTO’s engagement
levels. The USPTO ranked far below average in the strategic management category in 2011,
which measures employees’ faith and trust with their superiors, as seen in Figure 20.
13%
18%
69%
I have future career opportunities in the USPTO.
Disagree
Neutral
Agree
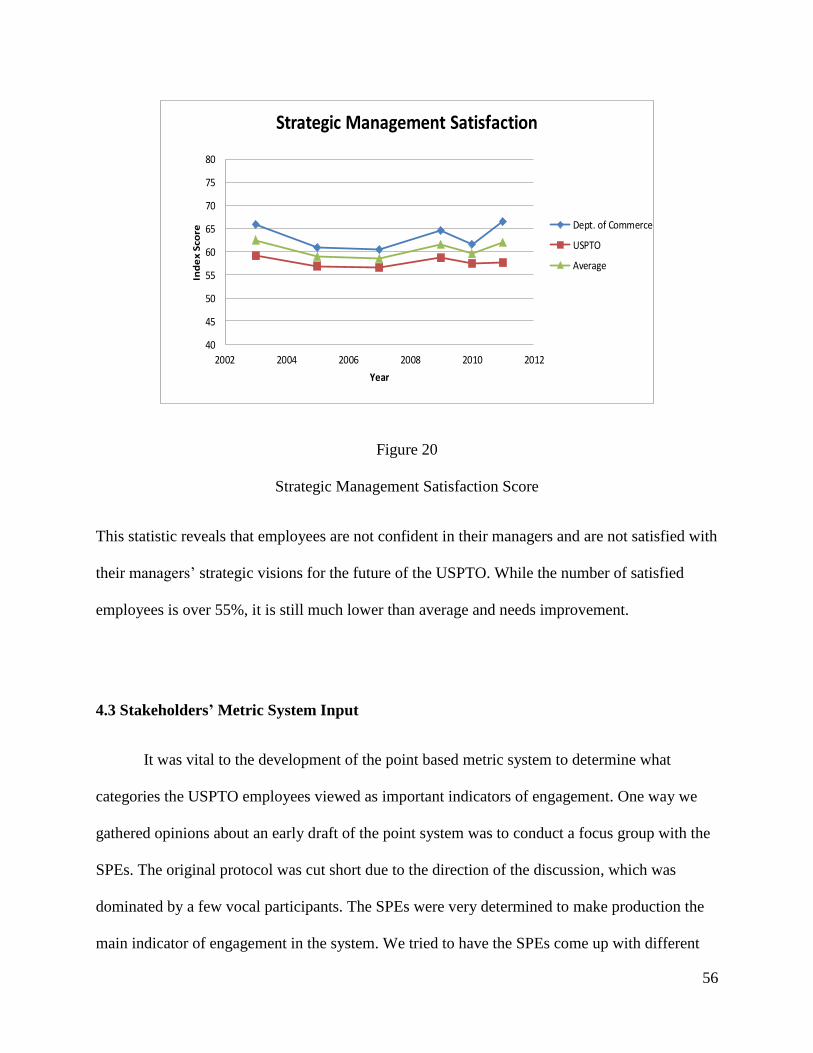
56
40
45
50
55
60
65
70
75
80
2002 2004 2006 2008 2010 2012
Ind
ex
Sco
re
Year
Strategic Management Satisfaction
Dept. of Commerce
USPTO
Average
Figure 20
Strategic Management Satisfaction Score
This statistic reveals that employees are not confident in their managers and are not satisfied with
their managers’ strategic visions for the future of the USPTO. While the number of satisfied
employees is over 55%, it is still much lower than average and needs improvement.
4.3 Stakeholders’ Metric System Input
It was vital to the development of the point based metric system to determine what
categories the USPTO employees viewed as important indicators of engagement. One way we
gathered opinions about an early draft of the point system was to conduct a focus group with the
SPEs. The original protocol was cut short due to the direction of the discussion, which was
dominated by a few vocal participants. The SPEs were very determined to make production the
main indicator of engagement in the system. We tried to have the SPEs come up with different
57
categories that could indicate engagement in our proposed system since they did not agree with
ours, but they only reiterated two of our categories, specifically recognition and performance.
When the packets mentioned in the protocol in Appendix A were collected and analyzed after the
focus group, the category weights and reasons the SPEs gave were much more comprehensive,
although production was ranked at over 50% by the majority of the eleven SPEs. The use of
surveys to gather opinions of employees was also a major contested point. The vocal SPEs did
not quite understand the need for employee opinions in an employee engagement measurement
system and in the PEET employee engagement definition, and the SPEs wished the quantitative
data to be emphasized. We determined that the dislike for obtaining employee opinions as an
indicator of engagement and the PEET definition of engagement stemmed from the emphasis the
SPEs’ jobs places on productivity.
Our liaison, Mr. Dwyer, recommended that we speak with Mr. Martin (Marty) Rater, the
statistician at the USPTO, about our metric system prototype and to gather a wider range of
opinions. While we had hoped that Mr. Rater would be able to help better define how we should
weight each engagement category, we found during our meetings (see Appendix F for meeting
notes) that Mr. Rater could offer us much more than that. During our discussions, Mr. Rater
raised the valid point that it is important that a metric system be flexible. Engagement is an
extremely fluid topic comprised of many different indicators, and the system that we create must
reflect that in order for it to be successful. In addition to raising many helpful and valid points,
Mr. Rater has created different metric systems for the USPTO before, such as one to measure
quality among approved patents, and he was able to help us identify the key pieces that should be
included as categories in our engagement metric system. He also recommended the addition of
the productivity and recognition category, which as seen in the focus group, was an extremely
58
important indicator of engagement in the eyes of the SPEs. With Mr. Rater's guidance, we were
able to create a weighting system for each category.
After reviewing the opinions presented in the focus group and interviews with Mr. Rater,
we identified a few common themes. First, the supervisory patent examiners were focused on
what they can control. The patent examiners, whom the SPEs are in charge of, are the main
contributors to production. Production leads to recognition, whether of the patent examiners or of
the SPEs who are successful managers because their subordinates are successful. We decided to
take the opinions of the SPEs into account, but not to put specific emphasis on them since the
views of the SPEs were biased by their job description and duties, which was to be expected.
Second, since Mr. Rater has helped the USPTO create a variety of metric systems, his ideas
ended up being a major contributor to the final metric system. Due to these influences from the
SPEs’ unexpectedly strong opinions, we increased the weight of production and recognition from
the first draft of the point system.
4.4 Determination of the Metric System Weights
As stated before, the USPTO’s definition of employee engagement is: “the interactive
relationship an employee has with the people and the work of the USPTO. This relationship is
the connection through which the employee feels valued, is committed, and is empowered to
perform his or her duties with a sense of purpose, satisfaction, and pride” (USPTOd, 2012, p. 8).
This definition, along with other definitions that the team came across in our research, emphasize
that engagement is based on how an employee feels. While quantitative numbers and metrics can
indicate that there is a generally positive atmosphere and that benchmarks are being met,
numerical data do not convey an employee’s opinion. Setting and meeting benchmarks is
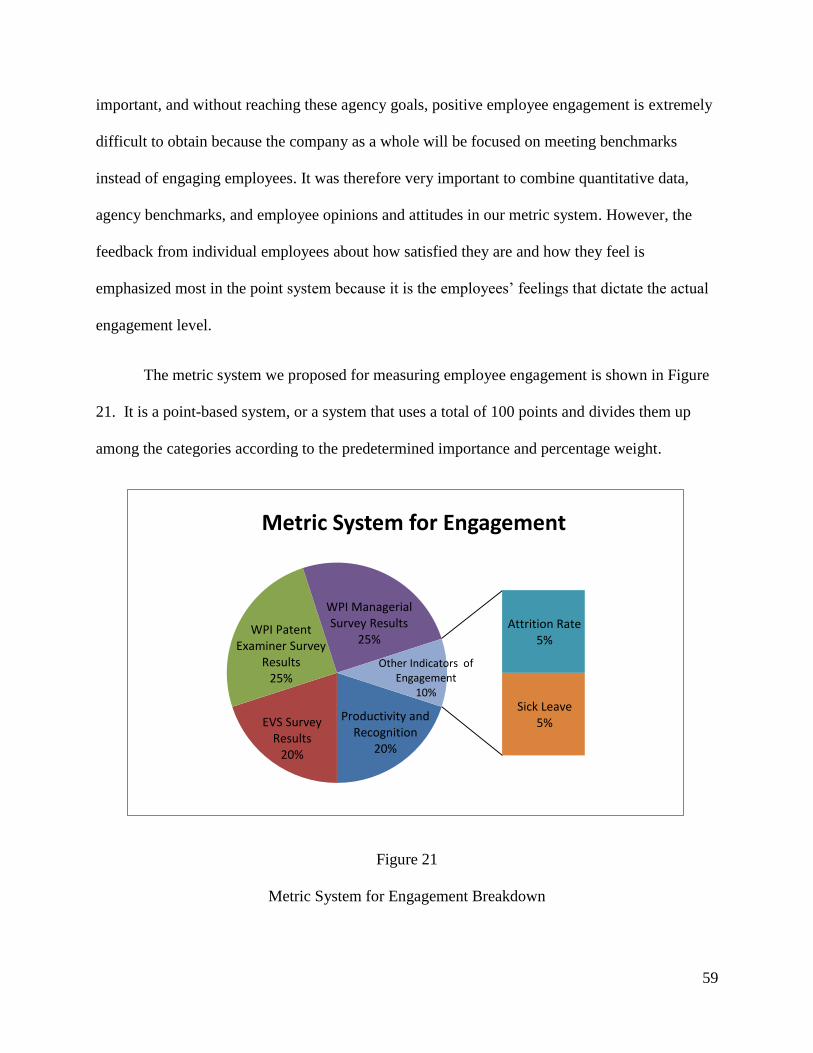
59
important, and without reaching these agency goals, positive employee engagement is extremely
difficult to obtain because the company as a whole will be focused on meeting benchmarks
instead of engaging employees. It was therefore very important to combine quantitative data,
agency benchmarks, and employee opinions and attitudes in our metric system. However, the
feedback from individual employees about how satisfied they are and how they feel is
emphasized most in the point system because it is the employees’ feelings that dictate the actual
engagement level.
The metric system we proposed for measuring employee engagement is shown in Figure
21. It is a point-based system, or a system that uses a total of 100 points and divides them up
among the categories according to the predetermined importance and percentage weight.
Figure 21
Metric System for Engagement Breakdown
Productivity and Recognition
20%
EVS Survey Results
20%
WPI Patent Examiner Survey
Results 25%
WPI Managerial Survey Results
25% Attrition Rate
5%
Sick Leave 5%
Other Indicators of Engagement
10%
Metric System for Engagement
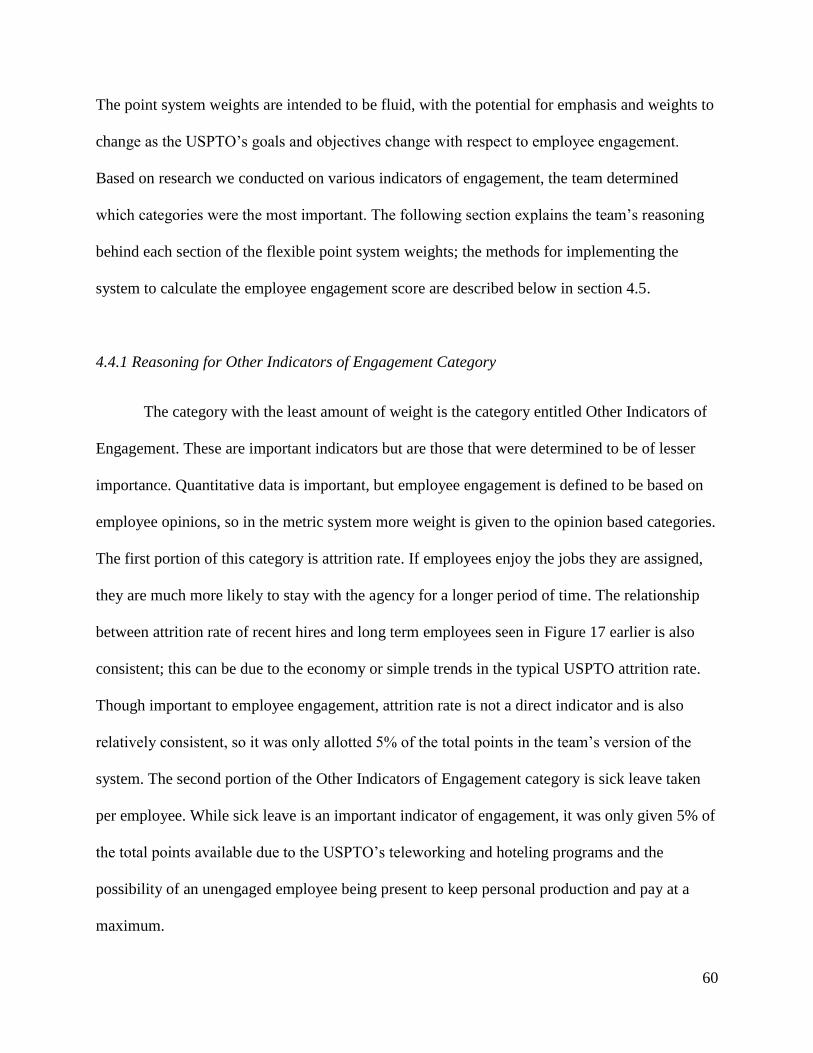
60
The point system weights are intended to be fluid, with the potential for emphasis and weights to
change as the USPTO’s goals and objectives change with respect to employee engagement.
Based on research we conducted on various indicators of engagement, the team determined
which categories were the most important. The following section explains the team’s reasoning
behind each section of the flexible point system weights; the methods for implementing the
system to calculate the employee engagement score are described below in section 4.5.
4.4.1 Reasoning for Other Indicators of Engagement Category
The category with the least amount of weight is the category entitled Other Indicators of
Engagement. These are important indicators but are those that were determined to be of lesser
importance. Quantitative data is important, but employee engagement is defined to be based on
employee opinions, so in the metric system more weight is given to the opinion based categories.
The first portion of this category is attrition rate. If employees enjoy the jobs they are assigned,
they are much more likely to stay with the agency for a longer period of time. The relationship
between attrition rate of recent hires and long term employees seen in Figure 17 earlier is also
consistent; this can be due to the economy or simple trends in the typical USPTO attrition rate.
Though important to employee engagement, attrition rate is not a direct indicator and is also
relatively consistent, so it was only allotted 5% of the total points in the team’s version of the
system. The second portion of the Other Indicators of Engagement category is sick leave taken
per employee. While sick leave is an important indicator of engagement, it was only given 5% of
the total points available due to the USPTO’s teleworking and hoteling programs and the
possibility of an unengaged employee being present to keep personal production and pay at a
maximum.
61
4.4.2 Reasoning for Production and Recognition Category
As mentioned before, productivity is very important to employees, managers, and the
USPTO as a whole. The purpose of the office is to quickly and accurately approve patents for the
general public. If this mission is not fulfilled, it is difficult to focus on employee engagement.
Discussions with managers themselves reinforced the idea that a high productivity is vital to the
office and employee engagement to an extent. Production is therefore included in the point
system. The high importance of performance to the USPTO, along with the influence on various
opinions and feelings, makes it necessary for the category to be separate from the Other
Indicators of Engagement Category. However, since production is quantitative orientated
indicator and therefore not directly based on opinions from the employee pool, it is a smaller
portion of the system when compared to the survey results categories.
Another indicator that is heavily tied to production is recognition. Employees want to be
rewarded and recognized for exceeding job expectations and achieving high productivity. A
higher rate of monetary awards and other incentives awarded to employees will help increase
overall satisfaction; it will not fix engagement, but it will definitely help engagement stay
positive. The recognition category is combined with productivity because the employees who are
the most productive are the employees who are receiving awards from the agency. However, it is
not its own section because quantitative data such as the number and amount of monetary reward
does not always indicate positive employee engagement. The two patent review completion-
based categories, recognition and productivity, combine to create 20%.
62
4.4.3 Reasoning for EVS Survey Results Category
The EVS covers a multitude of engagement factors such as employee skills/mission
match, satisfaction with leadership, satisfaction with pay, etc. It is also administered by an
outside source and analyzed by another outside source, so there are no biases in favor of the
patent office. The range of topics and being covered through an outside source places a high
importance on the EVS, but the weight for the category is capped at 20% in the team’s version of
the point system because the USPTO cannot ask questions pertaining to the agency’s specific
goals. The EVS questions also have a potential to change from year to year, which the USPTO
cannot control; this further emphasizes why the weight of the EVS Survey Results category is
capped at 20% of the point-based metric system.
4.4.4 Reasoning for the WPI Patent Examiner Survey and Managerial Survey Results Categories
One survey created for the patent office by the WPI team was the survey for patent
examiners. This survey asks questions that are directly about engagement. It also gathers
feedback specifically on the examiners opinions (v. other employees such as SPEs or support
staff). The USPTO can also edit the questions and have control over the wording for use in the
future to suit their needs. Among these strong positives for weighting the WPI Patent Examiner
Survey strongly, one potential limitation is that the USPTO will have to identify resources to
collect and analyze the data in future years after the WPI team leaves if they wish to have a third
party analyze that data. The focus on employee engagement and the ability to control the
questions leads the weight of this category to be 25%.
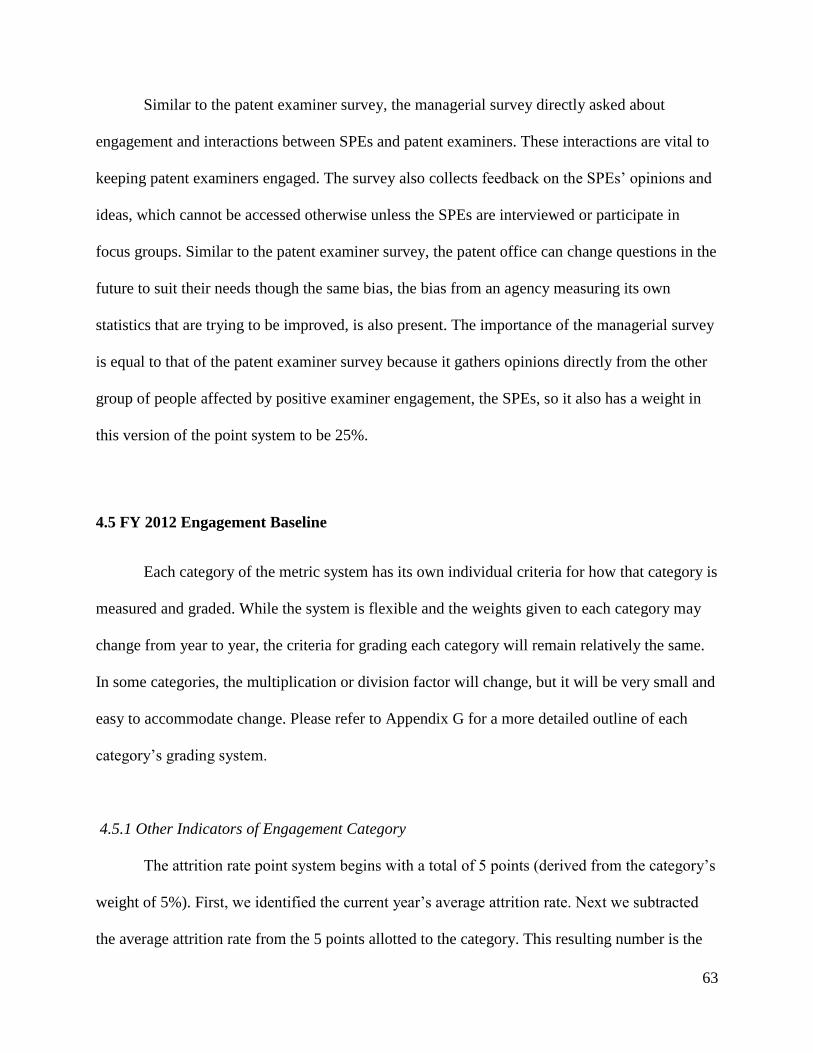
63
Similar to the patent examiner survey, the managerial survey directly asked about
engagement and interactions between SPEs and patent examiners. These interactions are vital to
keeping patent examiners engaged. The survey also collects feedback on the SPEs’ opinions and
ideas, which cannot be accessed otherwise unless the SPEs are interviewed or participate in
focus groups. Similar to the patent examiner survey, the patent office can change questions in the
future to suit their needs though the same bias, the bias from an agency measuring its own
statistics that are trying to be improved, is also present. The importance of the managerial survey
is equal to that of the patent examiner survey because it gathers opinions directly from the other
group of people affected by positive examiner engagement, the SPEs, so it also has a weight in
this version of the point system to be 25%.
4.5 FY 2012 Engagement Baseline
Each category of the metric system has its own individual criteria for how that category is
measured and graded. While the system is flexible and the weights given to each category may
change from year to year, the criteria for grading each category will remain relatively the same.
In some categories, the multiplication or division factor will change, but it will be very small and
easy to accommodate change. Please refer to Appendix G for a more detailed outline of each
category’s grading system.
4.5.1 Other Indicators of Engagement Category
The attrition rate point system begins with a total of 5 points (derived from the category’s
weight of 5%). First, we identified the current year’s average attrition rate. Next we subtracted
the average attrition rate from the 5 points allotted to the category. This resulting number is the
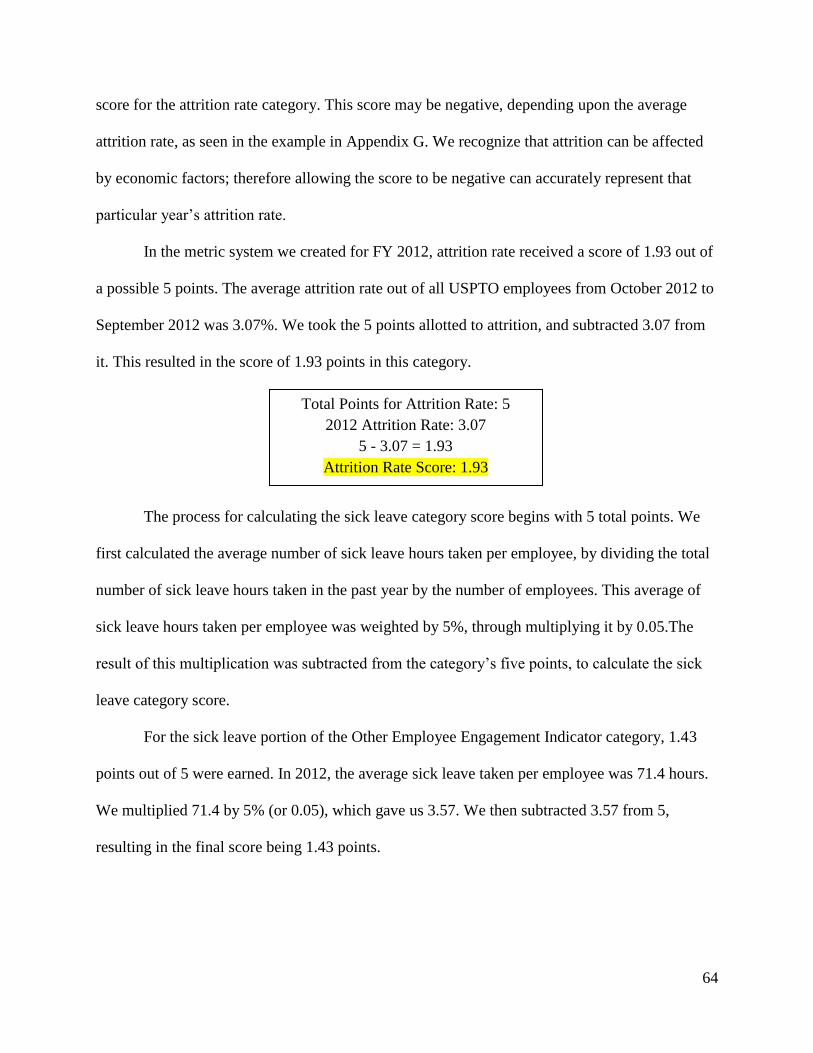
64
score for the attrition rate category. This score may be negative, depending upon the average
attrition rate, as seen in the example in Appendix G. We recognize that attrition can be affected
by economic factors; therefore allowing the score to be negative can accurately represent that
particular year’s attrition rate.
In the metric system we created for FY 2012, attrition rate received a score of 1.93 out of
a possible 5 points. The average attrition rate out of all USPTO employees from October 2012 to
September 2012 was 3.07%. We took the 5 points allotted to attrition, and subtracted 3.07 from
it. This resulted in the score of 1.93 points in this category.
The process for calculating the sick leave category score begins with 5 total points. We
first calculated the average number of sick leave hours taken per employee, by dividing the total
number of sick leave hours taken in the past year by the number of employees. This average of
sick leave hours taken per employee was weighted by 5%, through multiplying it by 0.05.The
result of this multiplication was subtracted from the category’s five points, to calculate the sick
leave category score.
For the sick leave portion of the Other Employee Engagement Indicator category, 1.43
points out of 5 were earned. In 2012, the average sick leave taken per employee was 71.4 hours.
We multiplied 71.4 by 5% (or 0.05), which gave us 3.57. We then subtracted 3.57 from 5,
resulting in the final score being 1.43 points.
Total Points for Attrition Rate: 5
2012 Attrition Rate: 3.07
5 - 3.07 = 1.93
Attrition Rate Score: 1.93
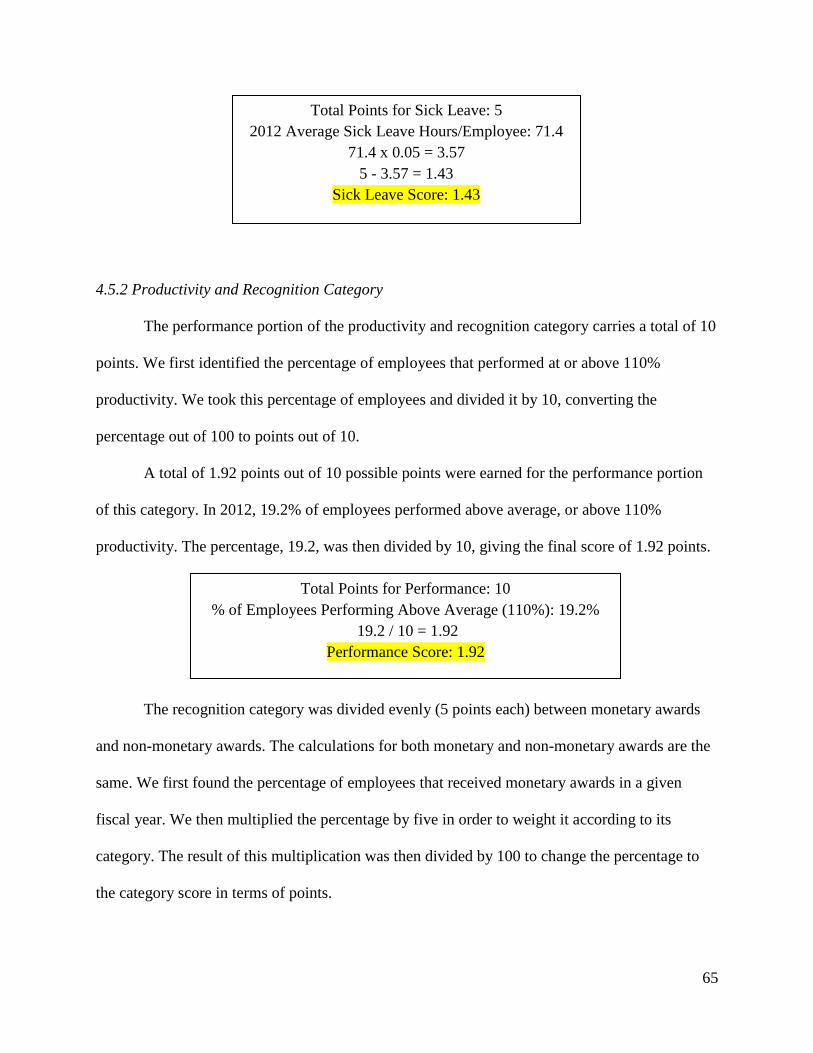
65
4.5.2 Productivity and Recognition Category
The performance portion of the productivity and recognition category carries a total of 10
points. We first identified the percentage of employees that performed at or above 110%
productivity. We took this percentage of employees and divided it by 10, converting the
percentage out of 100 to points out of 10.
A total of 1.92 points out of 10 possible points were earned for the performance portion
of this category. In 2012, 19.2% of employees performed above average, or above 110%
productivity. The percentage, 19.2, was then divided by 10, giving the final score of 1.92 points.
The recognition category was divided evenly (5 points each) between monetary awards
and non-monetary awards. The calculations for both monetary and non-monetary awards are the
same. We first found the percentage of employees that received monetary awards in a given
fiscal year. We then multiplied the percentage by five in order to weight it according to its
category. The result of this multiplication was then divided by 100 to change the percentage to
the category score in terms of points.
Total Points for Sick Leave: 5
2012 Average Sick Leave Hours/Employee: 71.4
71.4 x 0.05 = 3.57
5 - 3.57 = 1.43
Sick Leave Score: 1.43
Total Points for Performance: 10
% of Employees Performing Above Average (110%): 19.2%
19.2 / 10 = 1.92
Performance Score: 1.92
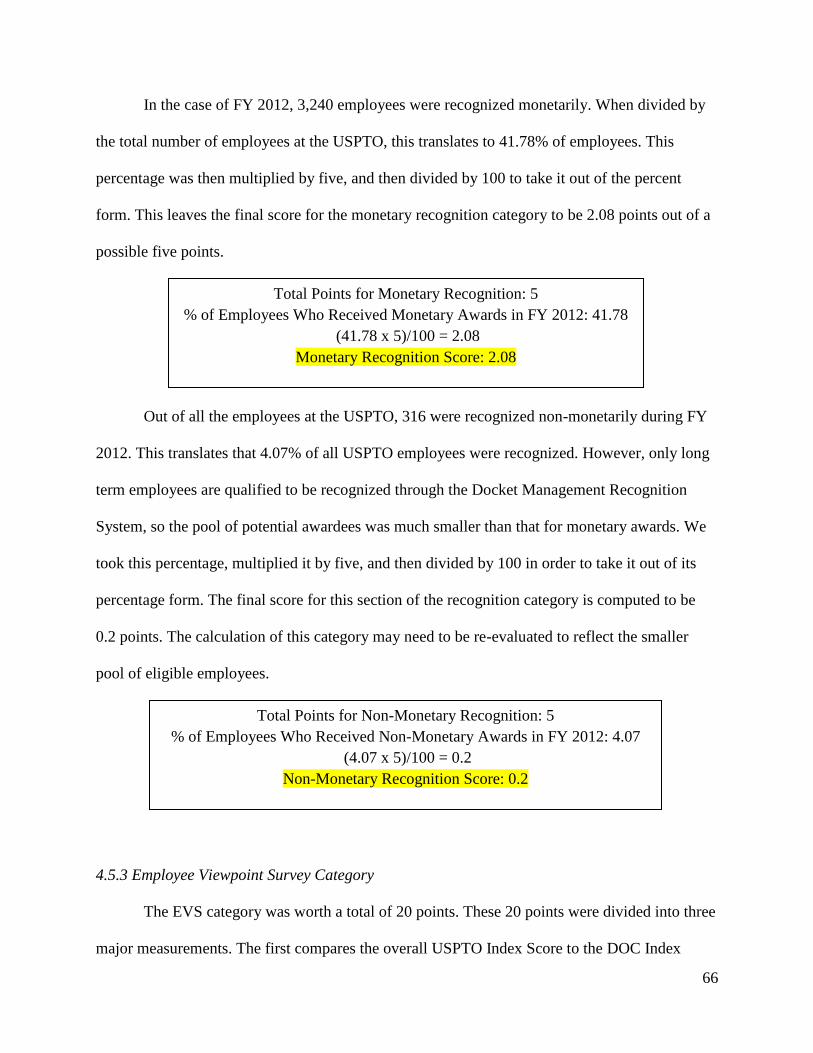
66
In the case of FY 2012, 3,240 employees were recognized monetarily. When divided by
the total number of employees at the USPTO, this translates to 41.78% of employees. This
percentage was then multiplied by five, and then divided by 100 to take it out of the percent
form. This leaves the final score for the monetary recognition category to be 2.08 points out of a
possible five points.
Out of all the employees at the USPTO, 316 were recognized non-monetarily during FY
2012. This translates that 4.07% of all USPTO employees were recognized. However, only long
term employees are qualified to be recognized through the Docket Management Recognition
System, so the pool of potential awardees was much smaller than that for monetary awards. We
took this percentage, multiplied it by five, and then divided by 100 in order to take it out of its
percentage form. The final score for this section of the recognition category is computed to be
0.2 points. The calculation of this category may need to be re-evaluated to reflect the smaller
pool of eligible employees.
4.5.3 Employee Viewpoint Survey Category
The EVS category was worth a total of 20 points. These 20 points were divided into three
major measurements. The first compares the overall USPTO Index Score to the DOC Index
Total Points for Monetary Recognition: 5
% of Employees Who Received Monetary Awards in FY 2012: 41.78
(41.78 x 5)/100 = 2.08
Monetary Recognition Score: 2.08
Total Points for Non-Monetary Recognition: 5
% of Employees Who Received Non-Monetary Awards in FY 2012: 4.07
(4.07 x 5)/100 = 0.2
Non-Monetary Recognition Score: 0.2
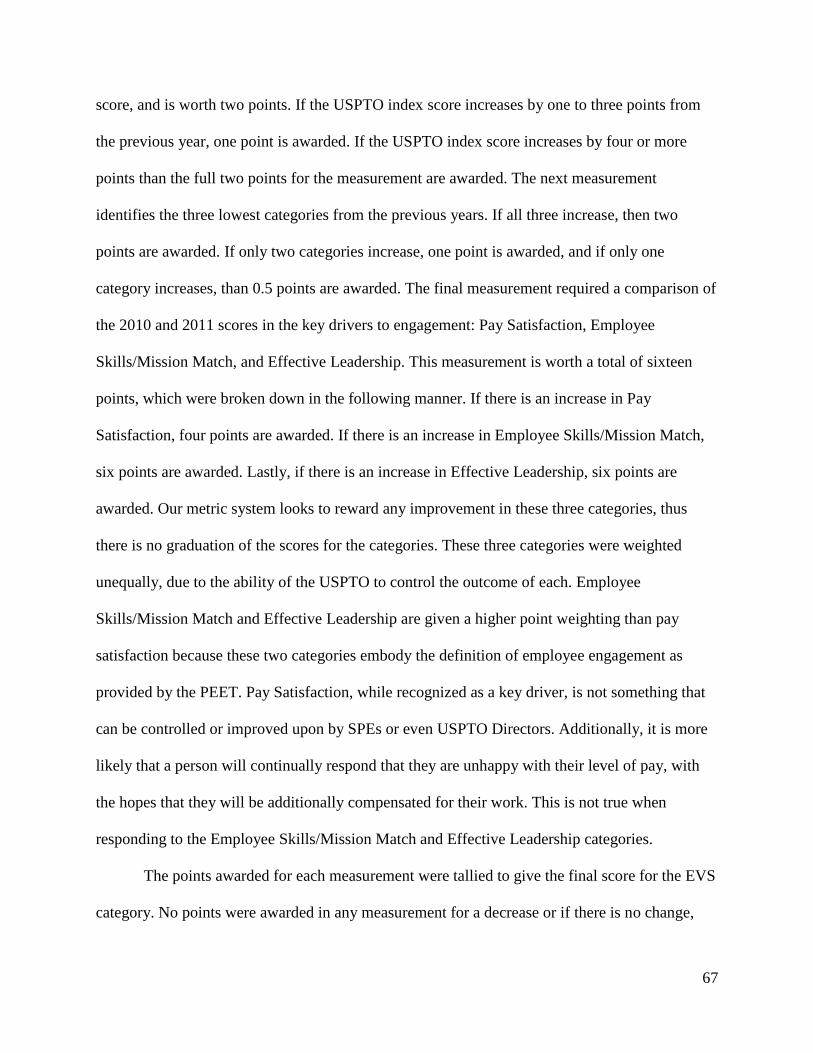
67
score, and is worth two points. If the USPTO index score increases by one to three points from
the previous year, one point is awarded. If the USPTO index score increases by four or more
points than the full two points for the measurement are awarded. The next measurement
identifies the three lowest categories from the previous years. If all three increase, then two
points are awarded. If only two categories increase, one point is awarded, and if only one
category increases, than 0.5 points are awarded. The final measurement required a comparison of
the 2010 and 2011 scores in the key drivers to engagement: Pay Satisfaction, Employee
Skills/Mission Match, and Effective Leadership. This measurement is worth a total of sixteen
points, which were broken down in the following manner. If there is an increase in Pay
Satisfaction, four points are awarded. If there is an increase in Employee Skills/Mission Match,
six points are awarded. Lastly, if there is an increase in Effective Leadership, six points are
awarded. Our metric system looks to reward any improvement in these three categories, thus
there is no graduation of the scores for the categories. These three categories were weighted
unequally, due to the ability of the USPTO to control the outcome of each. Employee
Skills/Mission Match and Effective Leadership are given a higher point weighting than pay
satisfaction because these two categories embody the definition of employee engagement as
provided by the PEET. Pay Satisfaction, while recognized as a key driver, is not something that
can be controlled or improved upon by SPEs or even USPTO Directors. Additionally, it is more
likely that a person will continually respond that they are unhappy with their level of pay, with
the hopes that they will be additionally compensated for their work. This is not true when
responding to the Employee Skills/Mission Match and Effective Leadership categories.
The points awarded for each measurement were tallied to give the final score for the EVS
category. No points were awarded in any measurement for a decrease or if there is no change,
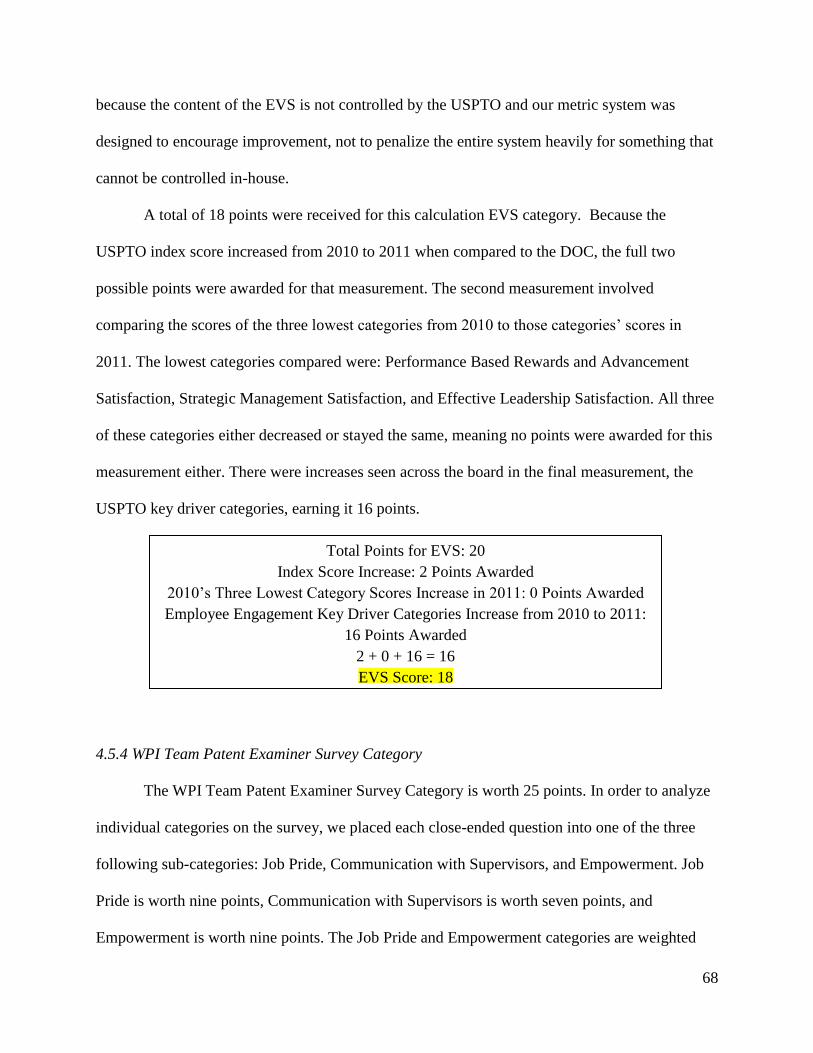
68
because the content of the EVS is not controlled by the USPTO and our metric system was
designed to encourage improvement, not to penalize the entire system heavily for something that
cannot be controlled in-house.
A total of 18 points were received for this calculation EVS category. Because the
USPTO index score increased from 2010 to 2011 when compared to the DOC, the full two
possible points were awarded for that measurement. The second measurement involved
comparing the scores of the three lowest categories from 2010 to those categories’ scores in
2011. The lowest categories compared were: Performance Based Rewards and Advancement
Satisfaction, Strategic Management Satisfaction, and Effective Leadership Satisfaction. All three
of these categories either decreased or stayed the same, meaning no points were awarded for this
measurement either. There were increases seen across the board in the final measurement, the
USPTO key driver categories, earning it 16 points.
4.5.4 WPI Team Patent Examiner Survey Category
The WPI Team Patent Examiner Survey Category is worth 25 points. In order to analyze
individual categories on the survey, we placed each close-ended question into one of the three
following sub-categories: Job Pride, Communication with Supervisors, and Empowerment. Job
Pride is worth nine points, Communication with Supervisors is worth seven points, and
Empowerment is worth nine points. The Job Pride and Empowerment categories are weighted
Total Points for EVS: 20
Index Score Increase: 2 Points Awarded
2010’s Three Lowest Category Scores Increase in 2011: 0 Points Awarded
Employee Engagement Key Driver Categories Increase from 2010 to 2011:
16 Points Awarded
2 + 0 + 16 = 16
EVS Score: 18
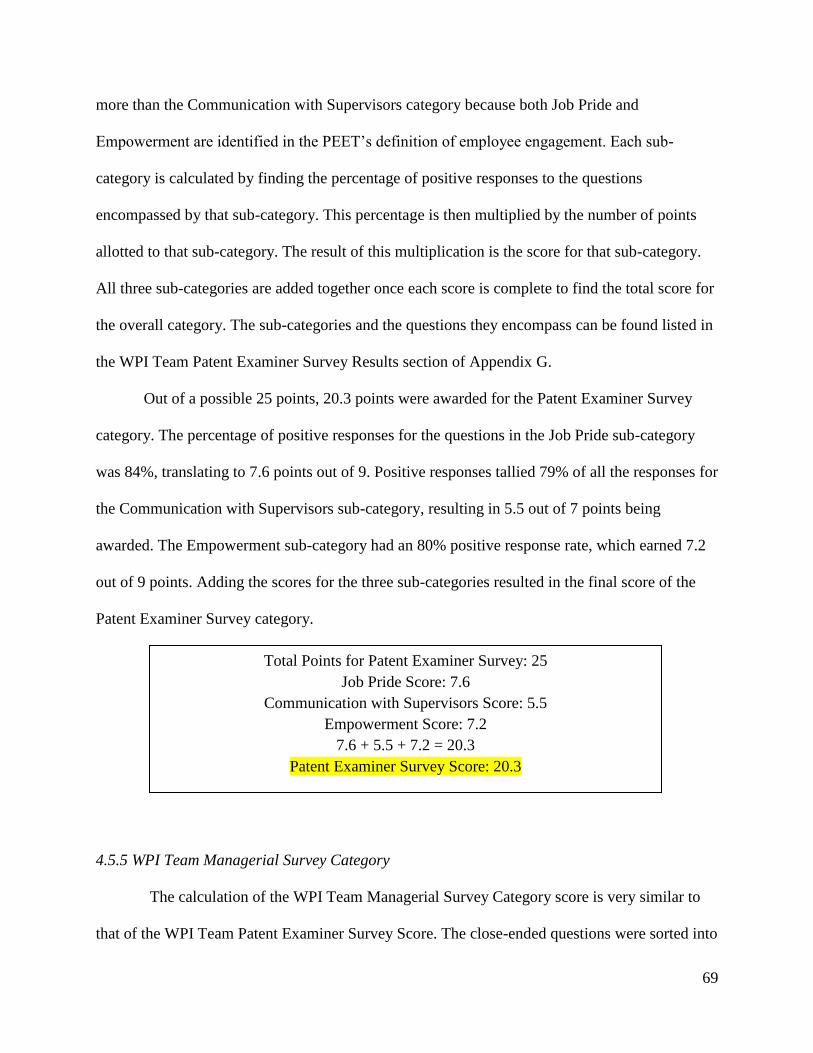
69
more than the Communication with Supervisors category because both Job Pride and
Empowerment are identified in the PEET’s definition of employee engagement. Each sub-
category is calculated by finding the percentage of positive responses to the questions
encompassed by that sub-category. This percentage is then multiplied by the number of points
allotted to that sub-category. The result of this multiplication is the score for that sub-category.
All three sub-categories are added together once each score is complete to find the total score for
the overall category. The sub-categories and the questions they encompass can be found listed in
the WPI Team Patent Examiner Survey Results section of Appendix G.
Out of a possible 25 points, 20.3 points were awarded for the Patent Examiner Survey
category. The percentage of positive responses for the questions in the Job Pride sub-category
was 84%, translating to 7.6 points out of 9. Positive responses tallied 79% of all the responses for
the Communication with Supervisors sub-category, resulting in 5.5 out of 7 points being
awarded. The Empowerment sub-category had an 80% positive response rate, which earned 7.2
out of 9 points. Adding the scores for the three sub-categories resulted in the final score of the
Patent Examiner Survey category.
4.5.5 WPI Team Managerial Survey Category
The calculation of the WPI Team Managerial Survey Category score is very similar to
that of the WPI Team Patent Examiner Survey Score. The close-ended questions were sorted into
Total Points for Patent Examiner Survey: 25
Job Pride Score: 7.6
Communication with Supervisors Score: 5.5
Empowerment Score: 7.2
7.6 + 5.5 + 7.2 = 20.3
Patent Examiner Survey Score: 20.3
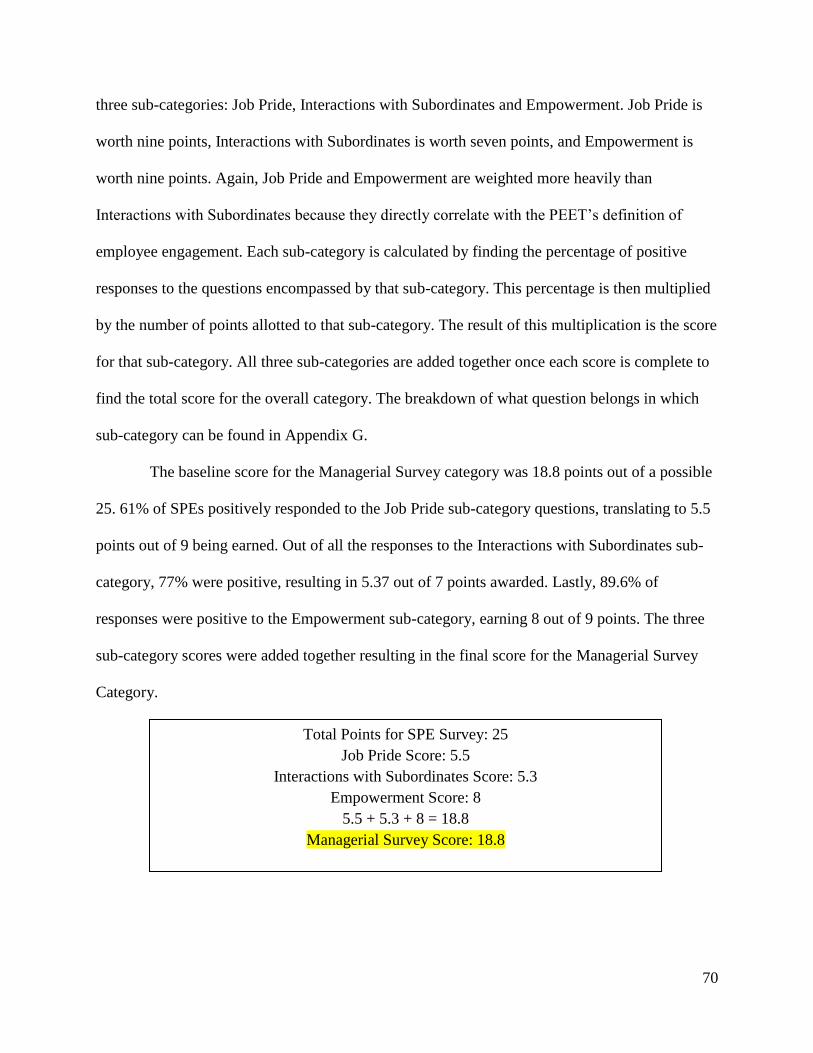
70
three sub-categories: Job Pride, Interactions with Subordinates and Empowerment. Job Pride is
worth nine points, Interactions with Subordinates is worth seven points, and Empowerment is
worth nine points. Again, Job Pride and Empowerment are weighted more heavily than
Interactions with Subordinates because they directly correlate with the PEET’s definition of
employee engagement. Each sub-category is calculated by finding the percentage of positive
responses to the questions encompassed by that sub-category. This percentage is then multiplied
by the number of points allotted to that sub-category. The result of this multiplication is the score
for that sub-category. All three sub-categories are added together once each score is complete to
find the total score for the overall category. The breakdown of what question belongs in which
sub-category can be found in Appendix G.
The baseline score for the Managerial Survey category was 18.8 points out of a possible
25. 61% of SPEs positively responded to the Job Pride sub-category questions, translating to 5.5
points out of 9 being earned. Out of all the responses to the Interactions with Subordinates sub-
category, 77% were positive, resulting in 5.37 out of 7 points awarded. Lastly, 89.6% of
responses were positive to the Empowerment sub-category, earning 8 out of 9 points. The three
sub-category scores were added together resulting in the final score for the Managerial Survey
Category.
Total Points for SPE Survey: 25
Job Pride Score: 5.5
Interactions with Subordinates Score: 5.3
Empowerment Score: 8
5.5 + 5.3 + 8 = 18.8
Managerial Survey Score: 18.8
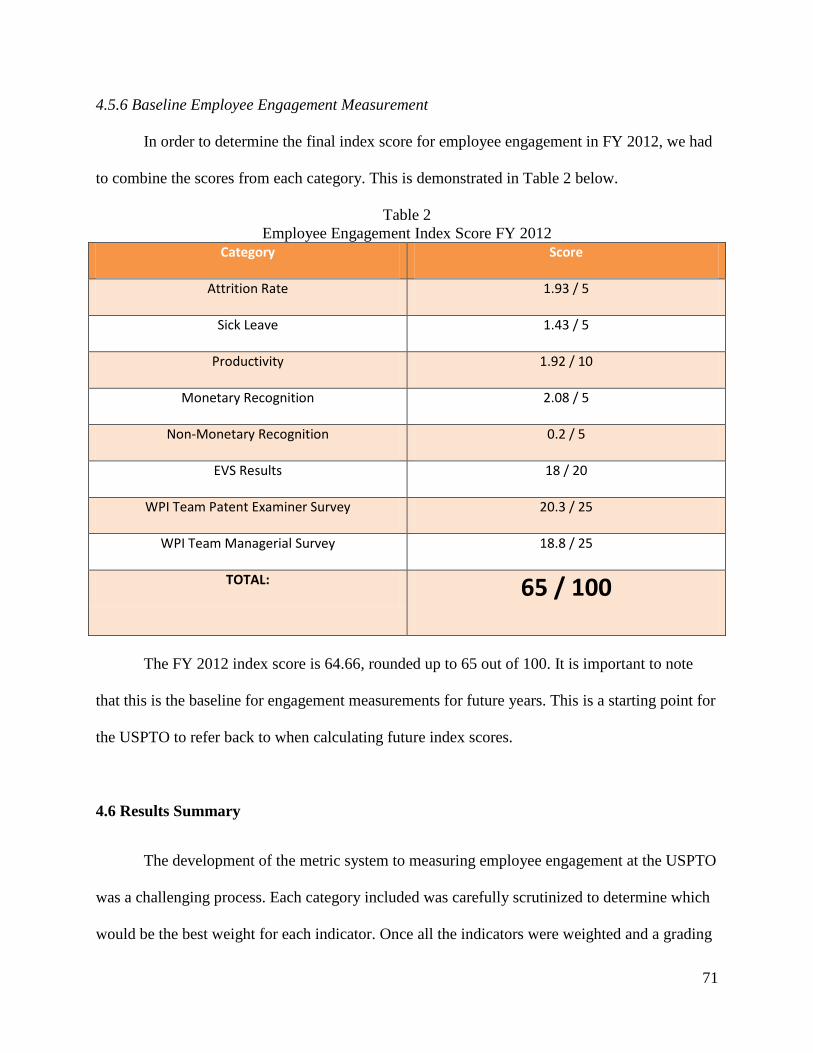
71
4.5.6 Baseline Employee Engagement Measurement
In order to determine the final index score for employee engagement in FY 2012, we had
to combine the scores from each category. This is demonstrated in Table 2 below.
Table 2
Employee Engagement Index Score FY 2012
Category Score
Attrition Rate 1.93 / 5
Sick Leave 1.43 / 5
Productivity 1.92 / 10
Monetary Recognition 2.08 / 5
Non-Monetary Recognition 0.2 / 5
EVS Results 18 / 20
WPI Team Patent Examiner Survey 20.3 / 25
WPI Team Managerial Survey 18.8 / 25
TOTAL: 65 / 100
The FY 2012 index score is 64.66, rounded up to 65 out of 100. It is important to note
that this is the baseline for engagement measurements for future years. This is a starting point for
the USPTO to refer back to when calculating future index scores.
4.6 Results Summary
The development of the metric system to measuring employee engagement at the USPTO
was a challenging process. Each category included was carefully scrutinized to determine which
would be the best weight for each indicator. Once all the indicators were weighted and a grading
72
system for each category developed, we received feedback from the USPTO statistician and
SPEs through the use of interviews and a focus group. These interviews and focus group gave
the employees at the USPTO the opportunity to make important suggestions, which were taken
into account as we finalized the metric system.
The two most heavily weighted categories, the WPI team surveys, were the main
indicators used to analyze employee opinions of engagement at the USPTO. These surveys were
reworked numerous times by our team as well as by members of the PEET in order to gather the
most meaningful data. The creation of our metric system would not have been possible without
the implementation of these two surveys.
Our metric system provides the USPTO with one final index of employee engagement at
the USPTO. By gathering the data for the FY 2012 engagement score, we are able to provide the
USPTO with a baseline measurement of employee engagement calculated with our system. This
will allow the PEET to look back on the score and see in what categories the USPTO changes
from year to year. The development of this system as a fluid model will additionally allow the
USPTO directors and supervisors to sit down at the beginning of every fiscal year and adjust the
system’s categorical weightings depending upon which aspects they consider to be important that
year. If the weightings are changed, however, the index must be recalculated with the previous
year’s category weighting so that the index results are comparable from year to year. The
following chapter will outline the main conclusions that our team came to after developing the
point-based metric system. It also contains our recommendations for the future use and
implementation of this system.
73
5.0 Conclusions and Recommendations
After developing a system of metrics for measuring employee engagement at USPTO and
utilizing it to produce an employee engagement baseline, we have identified some conclusions
and recommendations based on our developmental process as well as the feedback we have
received along the way. This chapter highlights our most important conclusions as well making
some recommendations that will help the USPTO carry the metric system into the future.
5.1 The USPTO’s Baseline Engagement Data is Encouraging
It is essential to note that our employee engagement metric is based around the idea of
improvement and for the USPTO to establish a high level of employee engagement; most
importantly, it will help the office to keep striving to improve scores from year to year. The
metric system is dynamic, as opposed to static, so focus can be placed on newly arisen weak
areas. The system can both reward the USPTO for its advances, as well as penalize it for lack of
success, thus pushing it to improve.
Since the metric is newly created and has never been implemented before, the biggest
limitation at present is that there is no way to conduct a score comparison from other years.
Some categories can be compared, such as the EVS data and sick leave information, because the
information is available. However, with half of the total score coming from the WPI Team
surveys, it is impossible to provide scores for previous years.
Another constraint the USPTO faces is the response rate from the managerial and patent
examiner surveys. Improvements can be made to the response rates we received, and the
improvement would be very beneficial to the accuracy of the point based metric system. As the
74
surveys are used more frequently, the response rate will hopefully increase, and as such will not
be as much of a constraint to the accuracy of the metric system.
We recommend implementing the use of the point based metric system for at least five
years to determine the effectiveness of the system and the degree to which engagement can be
improved. After use for multiple years, the USPTO will be able to compare its final scores to our
baseline score and see where improvements. While this year’s score of 65 out of 100 may
initially seem low, it is important to note that this gives much room for improvement.
5.2 The Point System is the First of its Kind at the USPTO
The information gathered from various sources leads us to conclude that our version of
the point system is the best it can be for this year since it is the first time the USPTO has used a
system to measure engagement. Overall, the point based metric system was able to successfully
provide a baseline employee engagement score so that employee engagement at the USPTO can
be tracked in the future. In order to continue to respond to feedback and improve the point based
metric system, we recommend that the point system be kept flexible. Flexibility allows for the
category weights to be changed. If, over time, some categories are found to be better indicators
than others, then the weights of each should change accordingly to reflect the up-to-date
findings.
Flexibility will lead to changing category weights and we recognize the change in
weights will not allow comparison to the past years’ engagement scores. We therefore
recommend that the PEET use the current year data in the FY 2012 calculation system in order to
compare the engagement score to our baseline score. All data will be present after FY 2012, so
from the baseline forward recalculation of previous years’ scores will be a relatively simple task.
75
We further recommend that an annual meeting be held by the directors and other
executives of the USPTO to determine the most accurate weights for the following fiscal year’s
point system. Annual meetings will allow all executives to have input on the direction of
employee engagement so that the main goals of the USPTO can be reached.
Lastly, we recommend that the USPTO look at the 2012 EVS results once they become
available. The current engagement score provided by the point based metric system uses 2012
data in all categories except the EVS, because the EVS data for 2012 were not published until
after the WPI Team finished their project at the USPTO. The same methods we used to analyze
the 2011 data should be applied to the 2012 EVS data: the improvement of the USPTO’s index
average compared to the DOC, the improvement of the three lowest EVS categories in 2011, and
the improvement of the key drivers of engagement will each be awarded points as described in
Appendix G. This update will allow the USPTO to have the most accurate start to measuring
employee engagement.
5.3 Teleworkers’ Engagement
Our team came to the conclusion that based upon our survey results, teleworkers are as
engaged as the on-campus patent examiners. However, our point-based metric system cannot be
used to calculate a baseline engagement score for teleworkers alone. SPEs cannot be teleworkers,
but the managerial survey is worth a quarter of the total points. In addition, the EVS survey, sick
leave, and attrition rate data we received cannot be separated into on-campus employees and
teleworker employees. We therefore recommend that the USPTO continue using the patent
examiner survey to measure employee engagement of teleworkers and to start tracking the sick
leave use and attrition rates of teleworkers so as to compare the control measurement of all sick
76
leave and attrition rate data to the rates among just teleworkers; parsing out these categories can
allow further comparison and an accurate conclusion to the level of teleworker engagement when
compared to the overall engagement of patent examiners at the USPTO.
5.4 Expanding Recognition Awards
We recommend that the USPTO creates more opportunity for lower level employees to
be recognized non-monetarily, as currently only a small population is qualified for recognition
due to seniority parameters placed on the awards. We recognize the ability of SPEs to offer “On-
The-Spot” awards for examiners who may not qualify for achievement awards but are
nonetheless outstanding in their work for the agency, and encourage the utilization of additional
informal awards such as these. Employees who are consistently recognized for their work and
have an equal opportunity to be rewarded are more likely to be engaged and continue performing
at a high level.
5.5 Annual Distribution of Surveys
We concluded that the surveys sent out to the patent examiners and supervisors were very
useful in capturing the employees’ feeling towards one another and also towards the USPTO.
The surveys were simple, short, and easy to answer, which is a reason for our strong first-time
response rate from both the supervisors and patent examiners. We concluded that the high
positive response rate we received could be because this was the first time our survey
questionnaires had been sent to employees. As a result the employees may have ended up
providing mainly normative responses to the questions.
77
We recommend that the USPTO takes the surveys used to create the baseline and send
them to the patent examiners and SPEs annually. If the USPTO finds that some of the questions
on the survey no longer apply to the organization’s mission and goals, or if it is found that some
of the questions are less important from year-to-year, the surveys can easily be changed and
updated to be more useful and representative. Distributing these surveys will allow the USPTO
to stay continuously up to date with the status of their employees’ engagement.
However, we recognize that if subordinates are sent too many surveys and do not see
changes resulting from their recommendations, they will be less likely to answer future surveys.
It is important that the managers and directors do what they can to improve areas that have been
identified as weak through the surveys and other avenues of feedback. If this is not done the
survey response rate will fall and responses may be less useful, which is counterproductive to the
process of increasing engagement. We also recommend that the USPTO send both the patent
examiner and managerial surveys because the relationship between the two is important for
engagement. Collecting opinions from both groups will help the USPTO determine the groups’
relationship; the annual survey will allow any changing relationships to be determined as well.
5.6 Increasing Annual Survey Scores
Our team has developed the following definitions for each category, allowing the USPTO
the flexibility to determine what type of initiative would be best to increase each score:
The Job Pride category measures how employees feel in relation to their work. This
emphasizes the connection an employee feels toward their work and the mission of the USPTO.
The Communications and Interactions category looks to measure the amount and quality of
communication within the office. If managers and their subordinates are having high quality
78
interactions, they will be more likely to be engaged. Lastly the Empowerment score identifies
how confident employees are in completing the tasks assigned to them with minimal to no
guidance, as well as how willing employees are to go the extra mile for a customer. This
willingness and ability to produce quality products are extremely beneficial to employee
engagement.
5.7 Conclusions and Recommendations Summary
The goal of this project was to provide the USPTO with a metric system to measure
employee engagement among both teleworkers and main campus employees. Our report
confirms that the USPTO has taken measures to improve engagement, but had not yet taken the
next step to measure the success of those initiatives by seeing an increase or decrease in the
overall level of engagement. The development of the system described in this report will be
essential to the USPTO in order to keep improving employee engagement. Without a metric
system, there would be no concrete evidence of a change in engagement.
In order for this metric system to have an impact on the USPTO community, it is
important that the system is examined and redefined each year to identify the indicators that are
most relevant to the mission of the USPTO. This system holds the USPTO directors and
supervisors responsible for the maintenance and improvement of employee engagement. The
score generated by our system will encourage a more in-depth look at the factors that play into
engagement, as well as the factors that keep employees motivated. We believe that the creation
of this metric system, if fully adopted by the USPTO, will not only enable a solid reading of the
“touchy-feely” topic that is employee engagement, but establish a precedent of attention being
paid to the factors that keep employees loyal to the company that they work for.
79
References
Allen, D. 2008. Retaining Talent. Society of Human Resources Management. Retrieved from
http://www.shrm.org/about/foundation/research/documents/retaining%20talent-
%20final.pdf
Ashley, Ken. (2012). Steve Jobs and….Workplace Design. The Commercial Tenant Resource.
Retrieved September 12, 2012. from
http://commercialtenantresource.com/2012/01/02/steve-jobs-and-workplace-design/
Bates, Steve. (2004). Getting Engaged. HR Magazine. Retrieved September 12, 2012
from
http://www.shrm.org/Publications/hrmagazine/EditorialContent/Pages/0204covstory.aspx
Baxter, J., & Eyles, J. (1997). Evaluating qualitative research in social geography:
Establishing ‘rigour’ in interview analysis. Transactions of the Institute of British
Geographers, 22(4), 505-525. Retrieved from http://docstore.ingenta.com/cgi-
bin/ds_deliver/1/u/d/ISIS/70296410.1/rgs/tibg/1997/00000022/00000004/art00006/DA5
C3750EFDA61AB13467248220BE0AC4F85ACB202.pdf?link=http://www.ingentaconn
ect.com/error/delivery%3Bjsessionid=6potcigsc8huo.alice&format=pdf.
Caillier, J. G. (2005). Factors affecting state government information technology employee
turnover intentions. The American Review of Public Administration, 35(2), 137-156.
Retrieved from http://slg.sagepub.com/content/43/2/110.full.pdf+html
Cook, S. (2008). Continuing, Measuring and Benchmarking. Essential Guide to
Employee Engagement : Better Business Performance Through Staff Satisfaction (pp.
211-216). London, GBR: Kogan Page Ltd. doi:9780749454968.
Farndale, E., Ph.D. (2012). Employee Engagement: A study of the link between
performance management and employee engagement in multinational corporations in
developed and developing economies. SHRM Foundation. Retrived from
http://www.shrm.org/about/foundation/research/Pages/SHRMFoundationFarndale.aspx
Focal Employee Engagement. (2012). Employee Engagement Definition. Retrieved
September 28, 2012, from http://www.custominsight.com/employee-engagement-
survey/employee-survey-features.asp
Frey, J. H., & Fontana, A. (1991). The group interview in social research. Social Science
Journal, 28(2), 175. Retrieved from
http://search.ebscohost.com/login.aspx?direct=true&db=buh&AN=9608296781&site=eh
ost-live
Gruman, J. A., & Saks, A. M. (2011). Performance management and employee
engagement. Human Resource Management Review, 21(2), 123-136.
doi:10.1016/j.hrmr.2010.09.004
80
Haahr, M. (2012). Random integer generator. Retrieved October 31, 2012, from
http://www.random.org/integers/
Harder, D. (2008). Microsoft programs employee engagement. Canadian HR Reporter,
21(22), 33. Retrieved from
http://search.proquest.com/docview/220810760?accountid=29120.
Hunt, J. (2012, September 13). Flexible work time in Germany: Do workers like it and how have
employers exploited it over the cycle? Retrieved from Econstor.eu:
http://www.econstor.eu/bitstream/10419/65649/1/727575538.pdf
Johnson, E. (2012). Implement a flexible employee program: worker-centric policies
contribute to engagement and profits. Success, September 7, 2012. Retrieved from
http://au4sb9ax7m.search.serialssolutions.com/?title=Success&date=2012&pages=40&is
sn=07452489&atitle=Implement%20a%20flexible%20employee%20program%3A%20w
orkercentric%20policies%20contribute%20to%20engagement%20and%20profits&spage
=40&au=Johnson%2CEmma%20&
JRA (2008). Employee Engagement: Stories of Success. Retrieved September 12,
2012. from http://www.jra.co.nz/getdocument.aspx?FileID=135
Longley, R. (2012). The President’s cabinet: the cabinet agencies and secretaries.
Retrieved September 3, 2012, from
http://usgovinfo.about.com/od/thepresidentandcabinet/a/prescabinet.htm
MacLeod, D., & Clarke, N. (2009). Engaging For Success: enhancing performance
through employee engagement. Department for Business, Innovation and Skills.
Retrieved from http://www.bis.gov.uk/files/file52215.pdf
Mateo, R., Tanco, M., & Santos, J. (2012, September 22). Less Expert Workers and Customer
Complaints: Automotive Case Study. Retrieved from Wiley Online Library:
http://au4sb9ax7m.scholar.serialssolutions.com/?sid=google&auinit=R&aulast=Mateo&a
title=Less+expert+workers+and+customer+complaints:+Automotive+case+study&id=do
i:10.1002/hfm.20396
Mayring, P. (2000). Qualitative content analysis. Forum Qualitative Sozialforschung /
Forum: Qualitative Social Research, 1(2). Retrieved from http://www.qualitative-
research.net/index.php/fqs/article/download/1089/2386
Mediratta, Bharat. (2007). The Google Way: Give Engineers Room. New York Times.
Retrieved September 12, 2012, from
http://www.nytimes.com/2007/10/21/jobs/21pre.html
81
Mitchell, T.R., Holtom, B.C., & Lee, T.W. 2001. How to keep your best employees: Developing
an effective retention policy. Academy of Management Executive, 15, 96-108. Retrieved
from<http://www.fbe.hku.hk/doc/courses/ug/2011-2012/BUSI0075A/JobMobility.pdf
North Carolina Office of State Personnel. (2008). Employee Engagement Survey.
Retrieved September 28, 2012, from
www.performanceSolutions.nc.gov/motivationInitiatives/WorkEnvironment/EmployeeE
ngagementTools/Employee%20Engagement%20Survey.doc
Partnership for Public Service. (2011a). Best places to work: About best places. Retrieved
November 8, 2012, from http://www.bestplacestowork.org/BPTW/about/index.php
Partnership for Public Service. (2011b). Best places to work: Frequently asked questions.
Retrieved November 8, 2012, from
http://www.bestplacestowork.org/BPTW/faqs/index.php\
Partnership for Public Service. (2011c) Best places to work: What the categories mean.
Retrieved from http://www.bestplacestowork.org/BPTW/faqs/dimensions.php
Partnership for Public Service. (2011d). Best places to work: Why the methodology. Retrieved
November 8, 2012, from
http://www.bestplacestowork.org/BPTW/about/methodology.php
Robinson, D, Perryman, S, and Hayday, S. (2004). The Drivers of Employee Engagement.
Institute for Employment Studies. Retrieved September 12, 2012, from
http://www.employment-studies.co.uk/pubs/summary.php?id=408
Ross, P., & Atkisson, E. (2012). USPTO Selects Central Denver Location for
Regional Satellite Office. Retrieved from http://www.uspto.gov/news/pr/2012/12-53.jsp.
Scott, D.., McMullen T., Royal, M.. (2012). Retention of Key Talent and the Role of Rewards. A
report by WorldatWork. Retrieved from<
http://www.worldatwork.org/waw/adimLink?id=62016>
Scott, H. (2012). Why are Employee Retention Strategies Important. Small Business. Retrieved
from http://smallbusiness.chron.com/employee-retention-strategies-important-1241.html
Stallard, Michael. (2012). Pixar working environment increases employee engagement.
Effective Leadership Skills Blog. Retrieved September 12, 2012, from
http:/site.successtelevision.biz/leadershipskills/index.php/human-resources/how-pixar-
powers-its-creativity-through-employee-engagement
Sundin, K. (2010). Virtual Teams: Work/Life Challenges - Keeping Remote Employees Engaged.
Retrieved October 23, 2012, from
http://www.ilr.cornell.edu/cahrs/research/whitepapers/upload/Spring10Mtng_RemoteWo
rkersEngaged.pdf
82
Ulanoff, Lance. (2009). Google's 20 Percent Time Drives Innovation. PC Magazine
Online. Retrieved September 12, 2012, from
http://go.galegroup.com/ps/i.do?action=interpret&id=GALE%7CA193242282&v=2.1&u
=mlin_c_worpoly&it=r&p=ITOF&sw=w&authCount=1
US Merit Systems Protection Board. (2008). The power of federal employee engagement.
Washington D.C.: Harper Collins.
US Office of Personnel Management. (2012a). Frequently Asked Questions - Telework: Can
managers or supervisors telework? Retrieved October 23, 2010, from
http://www.opm.gov/FAQS/QA.aspx?fid=88348d96-ddf7-40b3-9126-
66c88abe1b00&pid=2861a3a7-2c63-4f41-97bd-a3584c47b58d
US Office of Personnel Management. (2012b). Frequently Asked Questions - Telework: Do I
have to manage a teleworker differently than my in-office staff? Retrieved October 23,
2012, from http://www.opm.gov/FAQS/QA.aspx?fid=88348d96-ddf7-40b3-9126-
66c88abe1b00&pid=54c065f3-72cb-4651-aea2-77735fd7bfd3
US Office of Personnel Management. (2012c). Frequently Asked Questions - Telework: Does an
employee have a right to telework? Retrieved October 23, 2012, from
http://www.opm.gov/FAQS/QA.aspx?fid=88348d96-ddf7-40b3-9126-
66c88abe1b00&pid=6782277c-4107-490e-a757-aa5b33f6016a
US Office of Personnel Management. (2012d). Frequently Asked Questions - Telework: What is
the definition of telework? Retrieved October 23, 2012, from
http://www.opm.gov/FAQS/QA.aspx?fid=88348d96-ddf7-40b3-9126-
66c88abe1b00&pid=3e5ac2b0-3a30-42b0-85b6-00981489e8bd
USPTO. (2009). Office of Corporate Planning Performance and Accountability Report:
Fiscal Year 2009. Retrieved September 7, 2012, from
http://www.uspto.gov/about/stratplan/ar/2009/2009annualreport.pdf.
USPTO. (2010). How to Build a Mentoring Program: A Mentoring Program Toolkit.
Retrieved September 7, 2012, from
http://www.opm.gov/Wiki/uploads/docs/Wiki/OPM/training/Mentoring%20Toolkit%203
-18-10.pdf.
USPTO. (2011a). Department organization orders. Retrieved September 3, 2012, from
http://www.osec.doc.gov/opog/dmp/doos/doo30_3.html
USPTO. (2011b). Mission and Organization of the USPTO. Retrieved September 3,
2012, from http://www.uspto.gov/about/stratplan/ar/2010/mda_01.html
USPTO. (2012a). Fiscal year 2013 President’s Budget. Retrieved September 3, 2012,
from http://www.uspto.gov/about/stratplan/budget/fy13pbr.pdf
83
USPTO. (2012b). Mission. Retrieved September 3, 2012, from
http://www.uspto.gov/about/index.jsp
USPTO. (2012c). Office Organization. Retrieved September 3, 2012, from
http://www.uspto.gov/about/bios/uspto_org_chart.pdf
USPTO. (2012d). Patent Employee Engagement Team: Employee Engagement Plan.
Unpublished manuscript. Alexandria, VA: USPTO.
USPTO. (2012e). Program costs. Retrieved September 3, 2012, from
http://www.uspto.gov/about/stratplan/ar/2011/mda_06_01_04.html
USPTO. (2012f). Strategic human capital plan. Retrieved September 3, 2012, from
http://www.uspto.gov/about/stratplan/USPTO_2011-
2015_Strategic_Human_Capital_Plan.pdf
USPTO. (2012g). USPTO Careers – Why Work for the USPTO – About the USPTO. Retrieved
September 12, 2012, from http://usptocareers.gov/pages/whywork/about.aspx
Waghorn, T. (2009). How Employee Engagement Turned Around Cambell's: An interview with
Douglas Conant, CEO of Cambell Soup Co. Retrieved September, 2012, from
http://www.forbes.com/2009/06/23/employee-engagement-conant-leadership-managing-
turnaround.html
Walton, A. J. (2009). An examination of the relationship between employee engagement
and organization profitability within European manufacturing units. (Ph.D. Dissertation,
Capella University). ProQuest Dissertations and Theses. Retrieved from
http://search.proquest.com/docview/305160305?accountid=29120. (305160305).
Watson, J. O. (2008). A History of the United States Patent Office. Retrieved September 16,
2012, from http://www.historical-markers.org/usptohistory.cgi
Worcester Polytechnic Institute. (2012). Interdisciplinary and Global Studies: Interactive
Qualifying Project - WPI. Retrieved September 25, 2012, from
http://www.wpi.edu/academics/igsd/iqp.html
Zeffane, R., Ibrahim, M. E., & Al Mehairi, R. (2007, August 22). Exploring the differential
impact of job satisfaction on employee attendance and conduct: The case of a utility
company in the United Arab Emirates. Retrieved from Proquest.com:
http://search.proquest.com.ezproxy.wpi.edu/docview/235182825/fulltextPDF?accountid=
29120
84
Appendix A: Managerial (SPE) Focus Group Protocol
Interviewees: Anonymous
1) Icebreaker: the picnic name game. (5 minutes)
a. Everyone says their name, a picnic item that corresponds with the first letter of his
or her first name, and all the people that came before in the game. IE, “Hi, my
name is Sarah, and I will bring strawberries. Hi, my name is Andrew, and I will
bring apples. Sarah is bringing strawberries.”
b. If employees already know each other’s names, go around and each person say
one fun fact that members of the group do not know about them.
Present the Point System categories to the participants (5 minutes) (Make sure everything is of
equal weight so we do not bias them when we show the categories):
Attrition Rate
Absenteeism Rate using Sick Leave
Productivity
EVS Survey Results
WPI Team Patent Examiner Survey Results
WPI Managerial Survey Results
2) The metric system is a point system out of 100 points, or 100%. How would you suggest
weighting each category?
3) Why did you weight the categories in that manner (15 minutes)?
a. Is one category in particular more important than the others? Why may that be?
Present our category weights. Explain our reasoning why we gave each category the percentage
we did (5 minutes).
Attrition Rate – %
Absenteeism Rate using Sick Leave – %
Performance – %
85
EVS Survey Results – %
WPI Team Patent Examiner Survey Results – %
WPI Managerial Survey Results – %
4) How would you all suggest the final point style metric system categories be weighted (20
minutes)?
Are you comfortable being quoted in our project report? Our project report will be published.
If you wish, we will keep this interview confidential and anonymous.
Upon completion of this interview we will send you our notes to be sure that we have not
misquoted or misunderstood you in any way.
Again, thank you for your time; may we contact you again if we have additional questions?
86
Appendix B: Meeting Notes from the Focus Group with 11 Anonymous SPEs
Interviewees: 11 Anonymous SPEs
Location: Madison West Building Room 251, 1pm
Chair: Sarah Conlin
Secretary: Jeannette Gerry
Also in attendance: Mr. Bill Korzuch was present for the first five minutes to introduce the
purpose of the WPI Engagement Team; he was not present for the majority of the focus group.
Before the focus group:
o Some SPEs already know each other to varying degrees. It was decided the
icebreaker game was not needed and simple introductions with names and
technology center would suffice.
o We have a nice diversity between ethnic background and TC.
Sarah introduced herself and our IQP project.
Bill introduced himself and gave background on the Engagement Team and our project.
We went around the table and the SPEs introduced themselves and their TC
Sarah explained the consent and anonymous nature of any quotes if they feel comfortable
being quoted.
Sarah started in on the packet.
o A SPE was wondering what each section meant, so Sarah explained the different
sections of the pie chart.
o The two WPI surveys
o EVS Survey Results
o Performance
o Outcome Orientated Data
The SPEs were given time to fill in their own pie chart.
One SPE gave input about why attrition rate, absenteeism, and recognition should be in
separate categories or not at all in the metric system.
o Sarah explained why we originally included it.
o Another SPE suggested that because of the current economy, they might not be
the most accurate indicators.
Another few SPEs gave some feedback on the packet
o Include breakdown of what each is in the packet so that they know what they are
looking at
Sarah made the executive decision about changing the way the group will run
Start by putting a list on the whiteboard of what they think we should include
o Performance
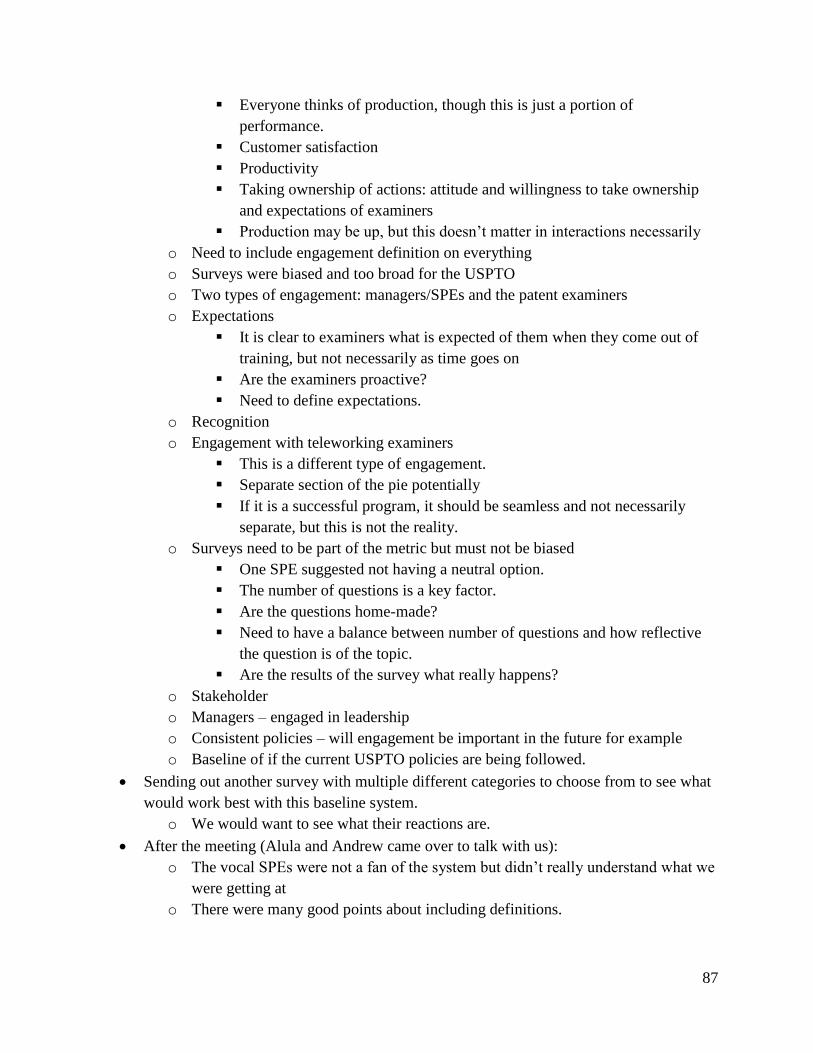
87
Everyone thinks of production, though this is just a portion of
performance.
Customer satisfaction
Productivity
Taking ownership of actions: attitude and willingness to take ownership
and expectations of examiners
Production may be up, but this doesn’t matter in interactions necessarily
o Need to include engagement definition on everything
o Surveys were biased and too broad for the USPTO
o Two types of engagement: managers/SPEs and the patent examiners
o Expectations
It is clear to examiners what is expected of them when they come out of
training, but not necessarily as time goes on
Are the examiners proactive?
Need to define expectations.
o Recognition
o Engagement with teleworking examiners
This is a different type of engagement.
Separate section of the pie potentially
If it is a successful program, it should be seamless and not necessarily
separate, but this is not the reality.
o Surveys need to be part of the metric but must not be biased
One SPE suggested not having a neutral option.
The number of questions is a key factor.
Are the questions home-made?
Need to have a balance between number of questions and how reflective
the question is of the topic.
Are the results of the survey what really happens?
o Stakeholder
o Managers – engaged in leadership
o Consistent policies – will engagement be important in the future for example
o Baseline of if the current USPTO policies are being followed.
Sending out another survey with multiple different categories to choose from to see what
would work best with this baseline system.
o We would want to see what their reactions are.
After the meeting (Alula and Andrew came over to talk with us):
o The vocal SPEs were not a fan of the system but didn’t really understand what we
were getting at
o There were many good points about including definitions.
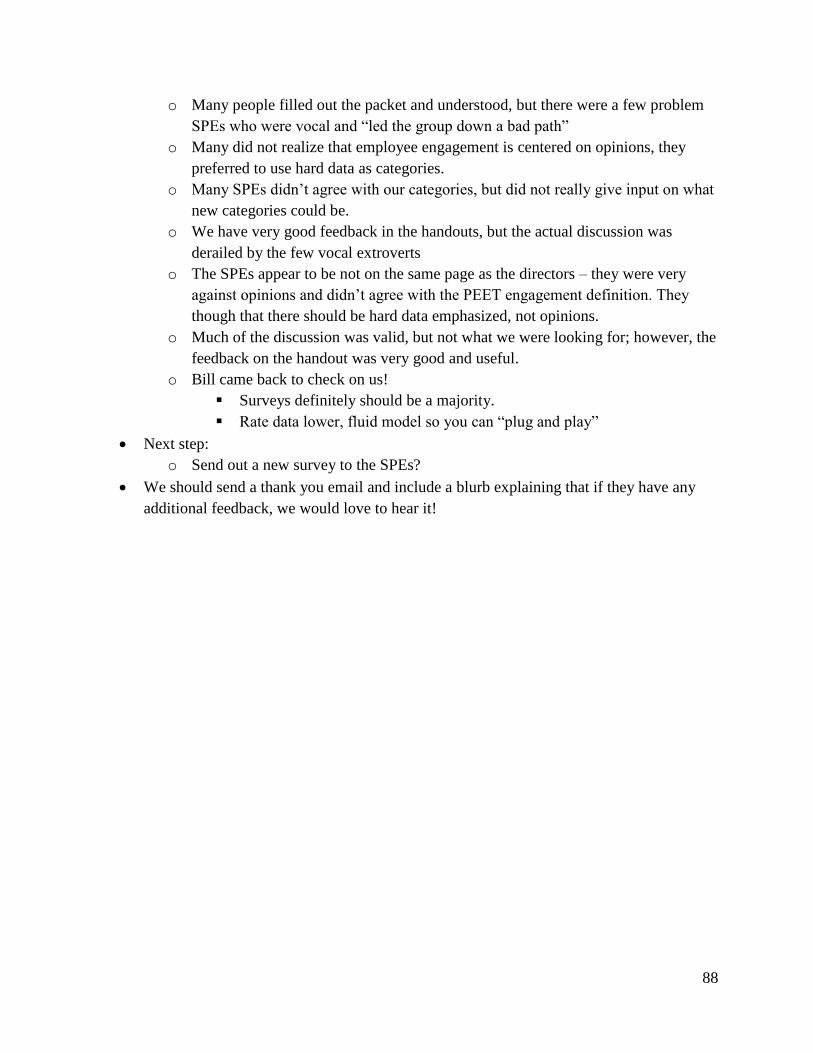
88
o Many people filled out the packet and understood, but there were a few problem
SPEs who were vocal and “led the group down a bad path”
o Many did not realize that employee engagement is centered on opinions, they
preferred to use hard data as categories.
o Many SPEs didn’t agree with our categories, but did not really give input on what
new categories could be.
o We have very good feedback in the handouts, but the actual discussion was
derailed by the few vocal extroverts
o The SPEs appear to be not on the same page as the directors – they were very
against opinions and didn’t agree with the PEET engagement definition. They
though that there should be hard data emphasized, not opinions.
o Much of the discussion was valid, but not what we were looking for; however, the
feedback on the handout was very good and useful.
o Bill came back to check on us!
Surveys definitely should be a majority.
Rate data lower, fluid model so you can “plug and play”
Next step:
o Send out a new survey to the SPEs?
We should send a thank you email and include a blurb explaining that if they have any
additional feedback, we would love to hear it!
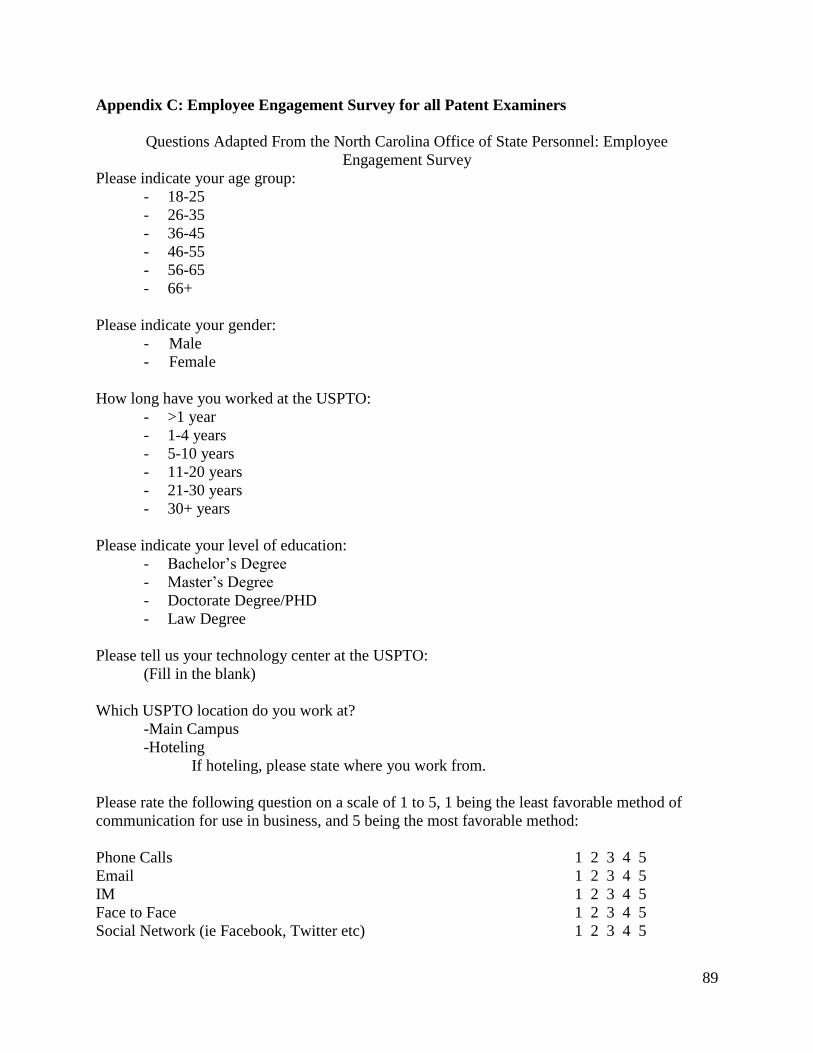
89
Appendix C: Employee Engagement Survey for all Patent Examiners
Questions Adapted From the North Carolina Office of State Personnel: Employee
Engagement Survey
Please indicate your age group:
- 18-25
- 26-35
- 36-45
- 46-55
- 56-65
- 66+
Please indicate your gender:
- Male
- Female
How long have you worked at the USPTO:
- >1 year
- 1-4 years
- 5-10 years
- 11-20 years
- 21-30 years
- 30+ years
Please indicate your level of education:
- Bachelor’s Degree
- Master’s Degree
- Doctorate Degree/PHD
- Law Degree
Please tell us your technology center at the USPTO:
(Fill in the blank)
Which USPTO location do you work at?
-Main Campus
-Hoteling
If hoteling, please state where you work from.
Please rate the following question on a scale of 1 to 5, 1 being the least favorable method of
communication for use in business, and 5 being the most favorable method:
Phone Calls 1 2 3 4 5
Email 1 2 3 4 5
IM 1 2 3 4 5
Face to Face 1 2 3 4 5
Social Network (ie Facebook, Twitter etc) 1 2 3 4 5
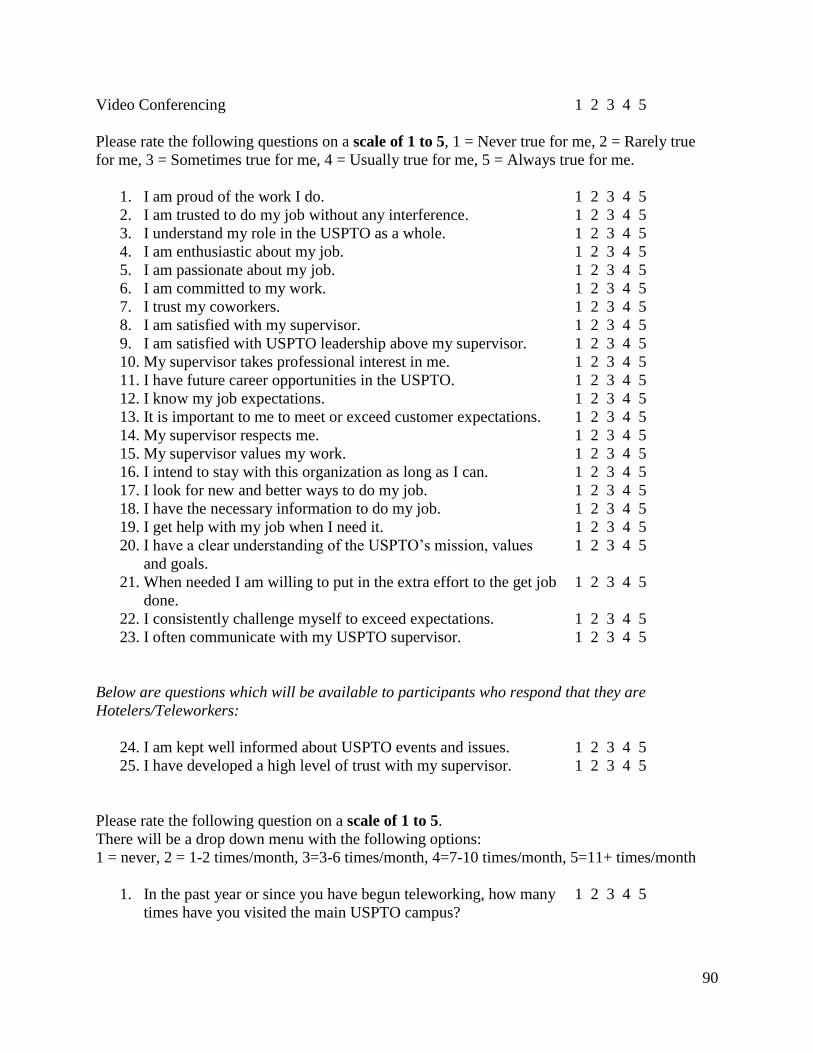
90
Video Conferencing 1 2 3 4 5
Please rate the following questions on a scale of 1 to 5, 1 = Never true for me, 2 = Rarely true
for me, 3 = Sometimes true for me, 4 = Usually true for me, 5 = Always true for me.
1. I am proud of the work I do. 1 2 3 4 5
2. I am trusted to do my job without any interference. 1 2 3 4 5
3. I understand my role in the USPTO as a whole. 1 2 3 4 5
4. I am enthusiastic about my job. 1 2 3 4 5
5. I am passionate about my job. 1 2 3 4 5
6. I am committed to my work. 1 2 3 4 5
7. I trust my coworkers. 1 2 3 4 5
8. I am satisfied with my supervisor. 1 2 3 4 5
9. I am satisfied with USPTO leadership above my supervisor. 1 2 3 4 5
10. My supervisor takes professional interest in me. 1 2 3 4 5
11. I have future career opportunities in the USPTO. 1 2 3 4 5
12. I know my job expectations. 1 2 3 4 5
13. It is important to me to meet or exceed customer expectations. 1 2 3 4 5
14. My supervisor respects me. 1 2 3 4 5
15. My supervisor values my work. 1 2 3 4 5
16. I intend to stay with this organization as long as I can. 1 2 3 4 5
17. I look for new and better ways to do my job. 1 2 3 4 5
18. I have the necessary information to do my job. 1 2 3 4 5
19. I get help with my job when I need it. 1 2 3 4 5
20. I have a clear understanding of the USPTO’s mission, values 1 2 3 4 5
and goals.
21. When needed I am willing to put in the extra effort to the get job 1 2 3 4 5
done.
22. I consistently challenge myself to exceed expectations. 1 2 3 4 5
23. I often communicate with my USPTO supervisor. 1 2 3 4 5
Below are questions which will be available to participants who respond that they are
Hotelers/Teleworkers:
24. I am kept well informed about USPTO events and issues. 1 2 3 4 5
25. I have developed a high level of trust with my supervisor. 1 2 3 4 5
Please rate the following question on a scale of 1 to 5.
There will be a drop down menu with the following options:
1 = never, 2 = 1-2 times/month, 3=3-6 times/month, 4=7-10 times/month, 5=11+ times/month
1. In the past year or since you have begun teleworking, how many 1 2 3 4 5
times have you visited the main USPTO campus?
91
Please rate the following question on a scale of 1 to 5.
There will be a drop down menu with the following options:
1= 0-5 times/week, 2= 6-10 times/week, 3= 11-15 times/week, 4= 16-20 times/week, 5= 21+
times/week.
1. Approximately how often are you in contact with other USPTO 1 2 3 4 5
employees?
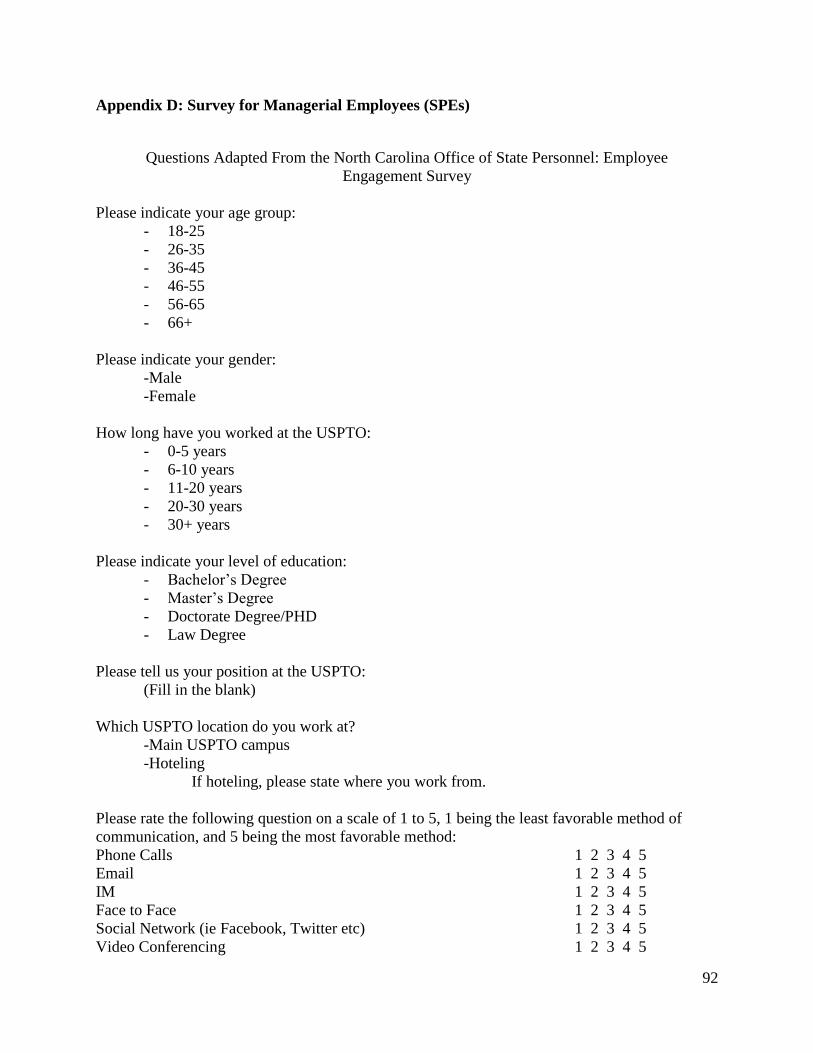
92
Appendix D: Survey for Managerial Employees (SPEs)
Questions Adapted From the North Carolina Office of State Personnel: Employee
Engagement Survey
Please indicate your age group:
- 18-25
- 26-35
- 36-45
- 46-55
- 56-65
- 66+
Please indicate your gender:
-Male
-Female
How long have you worked at the USPTO:
- 0-5 years
- 6-10 years
- 11-20 years
- 20-30 years
- 30+ years
Please indicate your level of education:
- Bachelor’s Degree
- Master’s Degree
- Doctorate Degree/PHD
- Law Degree
Please tell us your position at the USPTO:
(Fill in the blank)
Which USPTO location do you work at?
-Main USPTO campus
-Hoteling
If hoteling, please state where you work from.
Please rate the following question on a scale of 1 to 5, 1 being the least favorable method of
communication, and 5 being the most favorable method:
Phone Calls 1 2 3 4 5
Email 1 2 3 4 5
IM 1 2 3 4 5
Face to Face 1 2 3 4 5
Social Network (ie Facebook, Twitter etc) 1 2 3 4 5
Video Conferencing 1 2 3 4 5
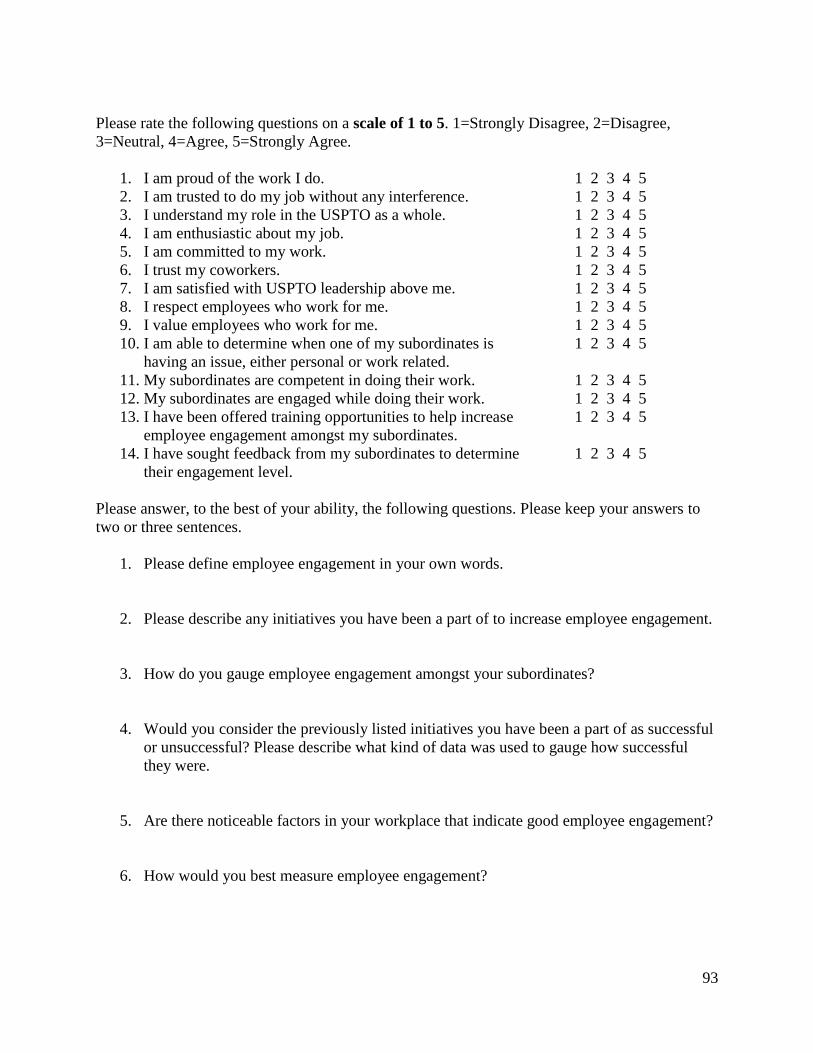
93
Please rate the following questions on a scale of 1 to 5. 1=Strongly Disagree, 2=Disagree,
3=Neutral, 4=Agree, 5=Strongly Agree.
1. I am proud of the work I do. 1 2 3 4 5
2. I am trusted to do my job without any interference. 1 2 3 4 5
3. I understand my role in the USPTO as a whole. 1 2 3 4 5
4. I am enthusiastic about my job. 1 2 3 4 5
5. I am committed to my work. 1 2 3 4 5
6. I trust my coworkers. 1 2 3 4 5
7. I am satisfied with USPTO leadership above me. 1 2 3 4 5
8. I respect employees who work for me. 1 2 3 4 5
9. I value employees who work for me. 1 2 3 4 5
10. I am able to determine when one of my subordinates is 1 2 3 4 5
having an issue, either personal or work related.
11. My subordinates are competent in doing their work. 1 2 3 4 5
12. My subordinates are engaged while doing their work. 1 2 3 4 5
13. I have been offered training opportunities to help increase 1 2 3 4 5
employee engagement amongst my subordinates.
14. I have sought feedback from my subordinates to determine 1 2 3 4 5
their engagement level.
Please answer, to the best of your ability, the following questions. Please keep your answers to
two or three sentences.
1. Please define employee engagement in your own words.
2. Please describe any initiatives you have been a part of to increase employee engagement.
3. How do you gauge employee engagement amongst your subordinates?
4. Would you consider the previously listed initiatives you have been a part of as successful
or unsuccessful? Please describe what kind of data was used to gauge how successful
they were.
5. Are there noticeable factors in your workplace that indicate good employee engagement?
6. How would you best measure employee engagement?
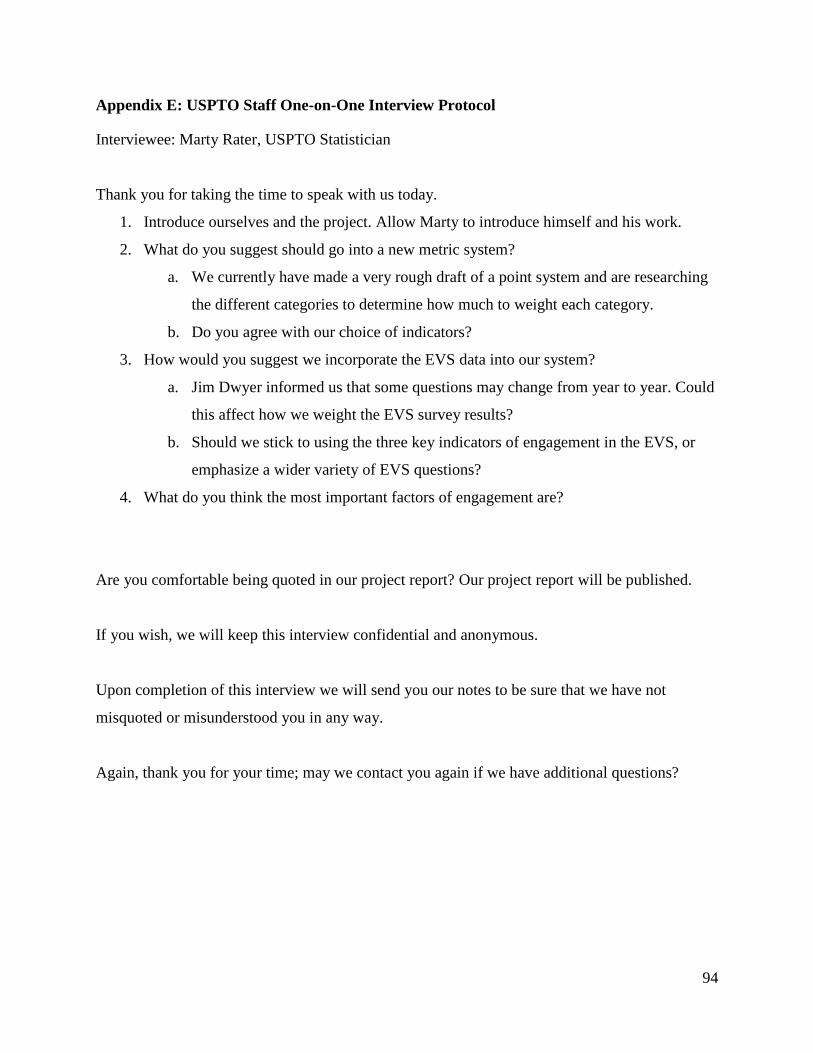
94
Appendix E: USPTO Staff One-on-One Interview Protocol
Interviewee: Marty Rater, USPTO Statistician
Thank you for taking the time to speak with us today.
1. Introduce ourselves and the project. Allow Marty to introduce himself and his work.
2. What do you suggest should go into a new metric system?
a. We currently have made a very rough draft of a point system and are researching
the different categories to determine how much to weight each category.
b. Do you agree with our choice of indicators?
3. How would you suggest we incorporate the EVS data into our system?
a. Jim Dwyer informed us that some questions may change from year to year. Could
this affect how we weight the EVS survey results?
b. Should we stick to using the three key indicators of engagement in the EVS, or
emphasize a wider variety of EVS questions?
4. What do you think the most important factors of engagement are?
Are you comfortable being quoted in our project report? Our project report will be published.
If you wish, we will keep this interview confidential and anonymous.
Upon completion of this interview we will send you our notes to be sure that we have not
misquoted or misunderstood you in any way.
Again, thank you for your time; may we contact you again if we have additional questions?
95
Appendix F: Meeting Notes from Formal Interviews with Mr. Marty Rater
Interview 1: November 8, 2012
Interviewee: Mr. Marty Rater, USPTO Statistician
Location: Madison West Building 4B87, 2pm
Chair: Sarah Conlin
Secretary: Jeannette Gerry
Also in attendance: Mr. Marty Rater, Andrew Sinkewicz, and Alula Shiferaw
The team explained that we were the WPI team working on employee engagement.
o Mr. Dwyer had strongly suggested that we meet with Marty.
We asked Marty what he thought about our point style metric system
o We determined with Marty that we are looking at the outcome: does the USPTO
have good employee engagement?
o Marty explained that in the past, engagement has been measured in pieces.
o Marty gave us feedback about our point system.
It is good that we have included productivity.
Attrition rate is also good, though it has recently flat lined due to the
economy. It needs to be included though because of the potential for the
rate to change regularly in the future.
We clarified that absenteeism is defined by sick leave in our system.
Marty agreed that it is a good thing to include in our system.
He liked that we put emphasis on the surveys.
They focus on engagement as a whole and are short and to the
point.
SPEs are a tough group to survey, so the fact that we have so many
responses already is awesome.
The EVS portion
All questions within the EVS are fair game, so it’s good that we
have it as a whole, not a portion of the EVS
Do we have weight on the drivers of engagement?
o The drivers we have listed now may not be drivers in the
future due to the various population of the USPTO. We
have to keep it flexible.
We may want to include the Gallup survey.
The Gallup survey is either a Q10 or Q12 (the number of questions
in the survey) and is a streamlined survey; it has been tested by the
Gallup organization over many years and the few questions asked
96
are determined to be direct indicators of general employee
engagement at organizations.
It may not cover the specifics we need in our surveys, but we
should check it out to make sure.
One topic of questions in the EVS deals with employee (in the USPTO’s
case, patent examiner) involvement in company decisions. It is a category
that typically scores low due to the nature of the USPTO’s decision
making processes and how much time the examiners need to spend on
reviewing patents
Pay and enough compensation are extremely important to examiners and
other employees at the patent office.
Most people will say they are underpaid and overworked
We can’t outright ask employees about the pay, has to be indirect.
It is all relative with pay: Marty suggested comparing the average
pay of the examiners to other engineers within federal agencies
because most patent examiners have their background in
engineering.
We may want to look at the satisfaction with the tools the office uses to
communicate, but this may be included in the EVS. We also have some
questions about communication in our surveys.
o The only thing that we really would possibly need to add to the point system as a
category is the Gallup surveys.
If we include pay, we need to look at the raw numbers and keep it
objective.
We have a very good start in terms of coverage, especially since the EVS
is so comprehensive.
We should not include quality coverage as part of engagement. It is a
separate “beast” and the USPTO already measures that.
We asked Marty for further help on including the EVS in our system.
o The office cannot be 100% sure who responds to the survey and has no control
over questions asked in the EVS. They cannot know if the EVS results are biased
by demographic either.
o 20% is a good number for the EVS, it’s weighted more than productivity.
o It’s really good that half of our system is from data that the USPTO can have
control over in the form of our surveys.
o Marty suggested we group these into one encompassing category:
Absenteeism/Sick Leave
Attrition
Pay
97
This grouping will help solve the issue of having a number as small as 5%
that can change a lot but not have an effect on the number representing
good engagement.
o Marty explained that he is a fan of the theme that covers how likely an employee
is to recommend the USPTO to a friend as a workplace.
This may not be a key driver, but is a good indicator.
This may be covered by a Gallup Q12.
It is good that we have a business portion, an employee portion, a generating patents
portion, and a replacing employee portion for our system as these are all very important.
o Very good to have 50% of the system as variables that the USPTO can control,
meaning they can control the questions asked in a survey.
o We have designated a good portion for the EVS; the EVS contains a lot of
important information that should be included in our point system, but the
USPTO has no control over the survey, which brings down how much we would
weight it.
o The variables such as absenteeism/sick leave, attrition rate, and productivity are
outcome orientated variables. It is good to have these not as weighted as the
others.
o In general, it is still arbitrary though.
Can we break down our system by demographic?
o The EVS does not break down by demographic.
o In our survey though, we have it broken down by demographic.
o Keeping the EVS as a portion of the system that cannot be separated by
demographic is a good constant.
Our breakdown is very similar to the USPTO’s breakdown of the quality compliance
metric.
Marty asked as a few questions about our surveys.
o He suggested as a survey to ask people how they would rank importance in our
point system. The format that we would use if we made a survey like this is check
boxes.
o When presenting our system breakdown to people, make sure to have each
category as an equal percentage for them to take away from or add to. This will
help our questioning be unbiased.
o We want to be aware of the stakeholder impact.
The final topic was more feedback about the point system that we are proposing.
o He suggested making four or five categories.
o One category would include absenteeism and attrition rate and potentially pay.
Within this overarching category, the weights of each number can be changed
from year to year according to USPTO objectives.
98
o He strongly suggested for us to assign weights to each category this year, but have
in our protocol for it that we have given a model but that the USPTO will
determine the weights at the beginning of each year.
This meeting to prioritize is essential.
Marty will be sending us the Gallup overview document and quality composite
presentation.
o He gave us permission to borrow ideas from the quality composite metric.
o He is extremely willing to help us, especially when it comes to summarizing the
data we gather from SurveyMonkey.
Marty has software that works better at analyzing the data than
SurveyMonkey.
Andrew volunteered after the meeting to work with Marty on using his
software to analyze the data once we get it.
It was found after the meeting when we looked at the Gallup overview document that
while the Gallup survey is extremely well done and useful, it is too broad for our use
since we are looking at specific areas of engagement.
Interview 2: November 13, 2012
Interviewee: Mr. Marty Rater, USPTO Statistician
Location: Madison West Building 4B87, 2pm
Chair: Sarah Conlin
Secretary: Jeannette Gerry
Also in attendance: Mr. Marty Rater, Andrew Sinkewicz, and Alula Shiferaw
We reviewed our new breakdown of the point system.
o Sarah explained the focus group results.
o Marty gave a potential explanation of why the SPEs were focused on
productivity.
They are essentially “making productivity” and are rated based on
productivity.
The SPEs can control performance so they are partial to that category.
They are engineers, so naturally they like to quantify data
o The SPEs put all of the surveys down to 5% for the most part and leaned toward
raw numbers
o Marty shared that the USPTO measures performance a great deal already.
99
For example, in 2000, the office looked at the USPTO’s productivity
versus employee satisfaction and found that there was no nexus.
If anything, engagement increases productivity.
Not all employees have productivity ratings. For example, Marty himself
is a statistician and does not have a productivity rating and he works with
about 60 other employees that do not have a productivity rating.
o Marty liked the flexibility of our ‘Object Orientated Outcomes’ category.
He also wants us to keep this category because it is good for comparison
across the board with other Department of Commerce or federal agencies
since the benchmarks can be common in all agencies.
o Marty briefly went back to discussing the focus group and the SPEs opinions.
The focus on productivity has to do with the comfort level of the SPEs.
They may have been worried it had the potential to be focused in on their
one ART unit instead of the patent examiner core as a whole.
He again emphasized to take the SPE input with a grain of salt. We, the
WPI team, are acting as the consultants in the situation.
We went over the open ended responses to the Managerial survey.
o The answers from the SPEs in this were along the lines of what we had tried to
get at because they had our definition of engagement when they went through the
closed ended questions.
o There were some of the same type of productivity focused responses as in the
focus group, but we have several good themes to work from.
o The spreadsheets Marty helped us with have filters built in. We can use these in
many ways, one of with is to find a quote to represent a category or theme of the
open ended questions.
o For the numbers, bar graphs and such are very useful! But not as much for the
open ended questions.
o Marty suggested we talk to Bill Korzuch so we can look at the Virtual ART Pilot
program report he worked on; it has a very good format for reporting the data.
o We broke the data up into demographics, but Marty pointed out that there is not
much variation in the data by demographic.
o Marty mentioned that the cool charts we see were just made in Excel or
PowerPoint, there’s no special software the office uses.
We went over the status of the patent examiner survey.
o While we don’t want bias, we can look at the data a few days before it closes so
we can get an idea of how we want to start analyzing it all.
o We may want a reminder email about the survey sent out to examiners if we need
more data.
100
o A good idea Marty brought up is to combine the “disagree” and “strongly
disagree” categories, and then the same for the two agreeing categories, so we
only graph three things. It will be clearer what we are trying to convey.
We came up with a new way to potentially look at the “grading” of each category in our
point system
o We may want to look at ratios of satisfied to unsatisfied employees for our index.
o Percents can bounce around, but in the long run we want to have more positive
than negative responses.
o A good ratio that the USPTO likes to have is 5 positive responses to 1 negative
It can balance 5 negative ‘rumors’ started by 1 unsatisfied person to the
one or two positive ‘rumors’ started by five satisfied people.
o The first step for an unsatisfied employee is to move to the neutral category, so
ratios can help show just the decrease in unsatisfied people.
o Ratios can show changes quicker.
o We can use ratios in the results for:
The SPE/Managerial Survey
The Patent Examiner Survey
The EVS Survey
o It is key to look at healthy ratios!
101
Appendix G: The Point Based Metric System for Measuring Employee Engagement
TOTAL SCORING SUMMARY:
Other Employee Engagement Indicators – 10%
o Attrition Rate – 5%
o Sick Leave – 5%
Productivity and Recognition – 20%
EVS Survey Results – 20%
WPI Patent Examiner Survey Results – 25%
WPI Managerial Survey Results – 25%
CATEGORY GRADING:
ATTRITION RATE- 5%
o Subtract the attrition rate from the category’s 5%
o Example:
In 2011, the attrition rate was 2.96
5-2.96=2.04
The overall score for this category would be 2.04
o Example for if the attrition rate was negative:
In the year 2024, the attrition rate was 5.37
5-5.37= -0.37
The overall score for the category would be -0.37
SICK LEAVE - 5%
o Multiply the current year’s sick leave average per employee by 5%, or 0.05;
subtract this product from the category’s 5%
o Example:
In 2012, the average sick leave taken per employee was 71.4
71.4 x 0.05 = 3.57
5 – 3.57 = 1.43
The overall score for the absenteeism category is 1.43
PRODUCTIVITY AND RECOGNITION – 20%
o Performance-10%
In order to determine performance, look at the percentage of the
employees that performed above average. Above average performance is
110% or higher.
102
For example:
30% of patent examiners had a performance rate that is at or more
than 110%
30/10 =3
The overall score in performance will be 3/10
o Recognition - 10%
Monetary awards (bonuses) - 5%
First find the percentage of employees that received monetary
award in a given fiscal year. Then weight the result in 5%
For example:
o 85% of patent examiners received monetary award in FY
2011
o (85*5)/100=4.25
o The overall score in monetary awards will be 4.25/5
Non-monetary awards (silver medals and bronze medals etc.) - 5%
First find the percentage of employees that received non-monetary
award in a given fiscal year. Then weight the result in 5%
For example:
o 30% of patent examiners received non-monetary award in
FY11
o (30*5)/100=1.5
o The overall score in non-monetary awards will be 1.5/5
o The overall score for the performance and recognition section will be:
o 3+4.25+1.5= 8.75/20
EVS RESULTS- 20%
o 2 points for overall USPTO average increase within Dept. of Commerce
o 2 point for increase in the three lowest categories from the previous year
1 points if 2 categories increased
0.5 points if only one category increased
o Key driver categories:
No points for the following if decrease
4 points for an increase in pay satisfaction
6 points for an increase in employee skill/mission match
6 points for an increase in effective leadership
WPI TEAM PATENT EXAMINER SURVEY RESULTS - 25%
o Each of the closed answer questions are sorted into three categories, whose points
are distributed as follows:
Job Pride – 9 Points
103
Communication with Supervisors – 7 Points
Empowerment – 9 Points
o Multiply the percentage of positive (4 or 5) responses to the questions in each
category by that category’s weight to determine the overall score for the category.
o The following lists the question numbers encompassed in each category:
Job Pride: Questions 1, 4, 5, 11, 12, 15, 16, 20, 21
Communications with Supervisors: Questions 7, 8, 9, 13, 14, 18, 22, 23,
24
Empowerment: Questions 2, 3, 6, 10, 17, 19
o Example:
75% of responses were positive for the Job Pride Category
9 x 0.75 = 6.75
The overall score for the Job Pride category example is 18.75
Job Pride Score + Communication with Supervisors Score +
Empowerment Score = WPI Team Patent Examiner Survey Results Score
WPI TEAM MANAGERIAL SURVEY RESULTS - 25%
o Each of the closed answer questions are sorted into three categories, whose points
are distributed as follows:
Job Pride – 9 Points
Interactions with Subordinates – 7 Points
Empowerment – 9 Points
o Multiply the percentage of positive (4 or 5) responses to the questions in each
category by that category’s weight to determine the overall score for the category.
o The following lists the question numbers encompassed in each category:
Job Pride: Questions 1, 4, 5
Interactions with Subordinates: Questions 8, 9, 10, 11, 12, 13, 14
Empowerment: Questions 2, 3, 6, 7
o Example:
75% of responses were positive for the Job Pride Category
9 x 0.75 = 6.75
The overall score for the Job Pride category example is 18.75
Job Pride Score + Interactions with Subordinates Score + Empowerment
Score = WPI Team Managerial Survey Results Score
104
Appendix H: Sponsor Description
The U.S. Constitution put the Executive Branch in charge of providing an entity to,
“promote the progress of science and the useful arts by securing for limited times to inventors the
exclusive right to their respective discoveries” (U.S. Const. art. I, § 8, cl. 8). This is what became
the United States Patent and Trademark Office. The main mission of the USPTO (2012g) is “to
foster innovation and competitiveness providing high quality and timely examination of patent
and trademark applications, guiding domestic and international intellectual property policy, and
delivering intellectual property information and education worldwide” (¶ 3).
The first Patent Act was signed by President George Washington on April 10, 1790,
creating the issuance of patents as part of the Secretary of State’s job (USPTO, 2012f). Not long
afterwards, the Patent act of 1793 was passed (Watson, 2008). This act created the Patent Board,
consisting of the Secretary of State, Attorney General, and Secretary of War. Two-thirds of the
Board needed to vote in favor of a patent’s approval. A large backlog of pending patent
applications gradually developed since the Board members were preoccupied by other primary
duties. To fix this, the Patent Act of 1836 was signed into law. Under this legislation the
Secretary of State and the other board members no longer approved patent applications;
however, the Department of State still oversaw the patent approval process. Patents were also
now required by law to be distributed to libraries to reduce lawsuits from patent owners against
other inventors who violated the rights guaranteed by the patent.
The USPTO (2012f) receives the most patent applications compared to foreign patent
offices, such as Germany and Japan. Most of the patent applications the USPTO received came
from utility inventors. In 2011 alone the USPTO received 535,188 applications from the U.S and
foreign applicants. Out of the total applications received, 503,482 were utility patents, 30,467
105
design patents and 1,139 plant patent applications. However, only 247,713 patent applications in
total were granted in the year 2011.
The goal of the USPTO (2011b) is to approve patents. The agency focuses on managing
their resources in an efficient and responsible way so that their main goal can be attained: the
“quality examination of patent and trademark applications” (¶ 1). The USPTO (2012a) does not
rely on taxes for funding and is able to have zero net discretionary spending as they are funded
by user-fees, or the fees citizens pay to have a patent or trademark approved.
For 2013, the USPTO (2012a) plans on having a budget of $2.822 billion and hopes to
make $2.953 billion from all of the various patent applications. The USPTO is currently not
financed adequately, which has prevented previous plans implemented to speed up the patent
approval process from being successful. Due to this shortage of funding, the USPTO will be
forced to increase the price of all patent applications by fifteen percent in 2013 to continue
running efficiently and effectively.
The USPTO (2012a) is an agency within the Department of Commerce, led by the Under
Secretary of Commerce for Intellectual Property and Director of the USPTO. As of the end of
FY 2011 the USPTO has 10,210 employees. Within the USPTO there are nine departments, as
seen in Figure A-1 below. However, the two main departments in the USPTO are The Patent
Office and the Trademarks Office. The main portion of workers at the USPTO is made up of
patent examiners, while trademark examiners and other staff make up a much smaller portion of
the employee pool. The USPTO trademark examiners are required to hold a degree in law, while
patent examiners do not.
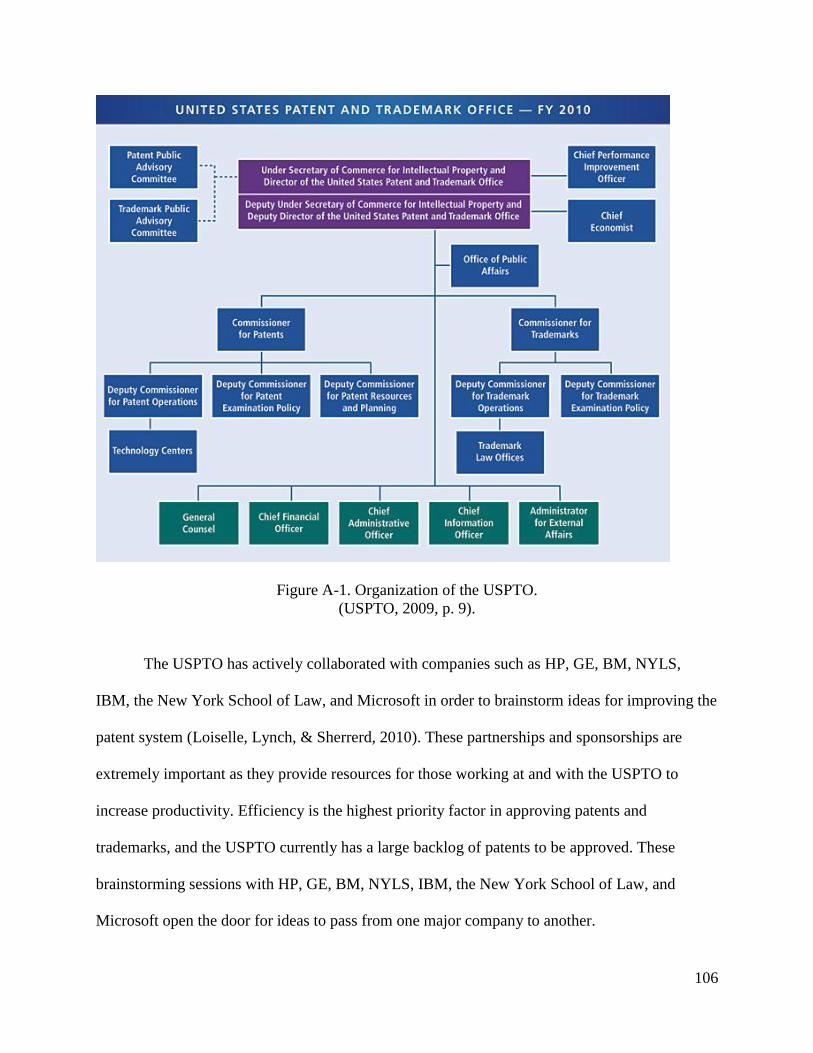
106
Figure A-1. Organization of the USPTO.
(USPTO, 2009, p. 9).
The USPTO has actively collaborated with companies such as HP, GE, BM, NYLS,
IBM, the New York School of Law, and Microsoft in order to brainstorm ideas for improving the
patent system (Loiselle, Lynch, & Sherrerd, 2010). These partnerships and sponsorships are
extremely important as they provide resources for those working at and with the USPTO to
increase productivity. Efficiency is the highest priority factor in approving patents and
trademarks, and the USPTO currently has a large backlog of patents to be approved. These
brainstorming sessions with HP, GE, BM, NYLS, IBM, the New York School of Law, and
Microsoft open the door for ideas to pass from one major company to another.