under process 117,405,280 92,039,182 finished goods 47,409,735 58,114,672 302,336,458 246,278,293...
TRANSCRIPT
1
2

3

4

5

6

7
8

9

10
11

12
B A L A N C E S H E E T
Schedule As at Mar. 31, 2010 As at Mar. 31, 2009 Reference Rupees Rupees Rupees Rupees
Sources of FundsSHAREHOLDERS’ FUNDShare Capital 1 52,878,150 52,878,150Reserves and Surplus 2 336,166,762 214,427,035
389,044,912 267,305,185LOAN FUNDS Secured Loans — —Unsecured Loans 3 122,705,000 87,888,000
122,705,000 87,888,000DEFERRED TAX – NET LIABILITY 4 9,169,209 7,986,505
TOTAL 520,919,121 363,179,690
Application of FundsFIXED ASSETSGross Block 5 376,678,323 348,262,558Less: Depreciation 219,451,851 204,453,347
Net Block 157,226,472 143,809,211Capital Work-in-Progress 11,797,968 7,761,736
169,024,440 151,570,947INVESTMENTS 6 1,025,000 1,025,000
CURRENT ASSETS, LOANS & ADVANCESInventories 7 311,538,594 254,723,617Sundry Debtors 8 280,332,080 260,061,116Cash and Bank Balances 9 394,116,276 143,713,404Loans and Advances 10 55,386,410 53,462,094
1,041,373,360 711,960,231
Less:CURRENT LIABILITIES & PROVISIONSLiabilities 11 422,499,910 346,932,828Provisions 12 268,003,769 154,443,660
690,503,679 501,376,488
NET CURRENT ASSETS 350,869,681 210,583,743
TOTAL 520,919,121 363,179,690
Schedules 1 to 12 and Notes in Schedule 16 form part of this Balance Sheet
In terms of our Report attached For DELOITTE HASKINS & SELLS Chartered Accountants
R. K. HiranandaniPartner
Mumbai: May 29, 2010
Brahm Vasudeva S. Dutta Choudhury B. K. Khare S. K. Diwanji Chairman Vice-Chairman & Director Director Chief Executive Officer
Gen. V. N. Sharma (Retd.) J. M. Mukhi M. A. Teckchandani Hutoxi Bhesania Director Director Director Company Secretary
Accounts-Hawkins-2010.indd 12 6/30/2010 10:18:22 AM

13
P R O F I T & L O S S A C C O U N T
Schedule For the year ended For the year endedReference Mar. 31, 2010 Mar. 31, 2009
Rupees Rupees Rupees Rupees
INCOME
Sales including Excise Duty 2,954,142,420 2,546,577,465
Less: Excise duty on Sales 98,479,864 131,828,894
Sales Net of Excise Duty 2,855,662,556 2,414,748,571
Income from other sources 13 37,080,715 41,460,829
2,892,743,271 2,456,209,400
EXPENDITURE
Materials 14 1,064,078,121 1,081,956,947
Expenses 15 1,252,974,041 1,064,152,693
Depreciation 16,926,479 16,592,330
2,333,978,641 2,162,701,970
PROFIT BEFORE TAXATION 558,764,630 293,507,430
Provision for Taxation
– For the year
Current Tax 189,200,000 99,500,000
Deferred Tax (net) 1,182,704 99,012
Total for the year 190,382,704 99,599,012
– Fringe Benefits Tax — 2,750,000
190,382,704 102,349,012
PROFIT AFTER TAXATION 368,381,926 191,158,418
Balance brought forward from last year 89,471,864 67,043,030
AMOUNT AVAILABLE FOR APPROPRIATION 457,853,790 258,201,448
APPROPRIATIONS
Proposed Dividend 211,512,600 105,756,300
Tax on Proposed Dividend 35,129,599 17,973,284
Transfer to General Reserve 50,000,000 45,000,000
Balance carried to Balance Sheet 161,211,591 89,471,864
TOTAL 457,853,790 258,201,448
Earnings per share (face value Rs. 10) – basic and diluted (Rs.) (Note 11) 69.67 36.15
Schedules 13 to 15 and Notes in Schedule 16 also form part of this Profit & Loss Account.
In terms of our Report attached For DELOITTE HASKINS & SELLS
Chartered Accountants
R. K. HiranandaniPartner
Mumbai: May 29, 2010
S. K. Diwanji B. K. Khare S. Dutta Choudhury Brahm VasudevaDirector Director Vice-Chairman & Chairman Chief Executive Officer
Hutoxi Bhesania M. A. Teckchandani J. M. Mukhi Gen. V. N. Sharma (Retd.) Company Secretary Director Director Director
Accounts-Hawkins-2010.indd 13 6/30/2010 10:18:23 AM
14
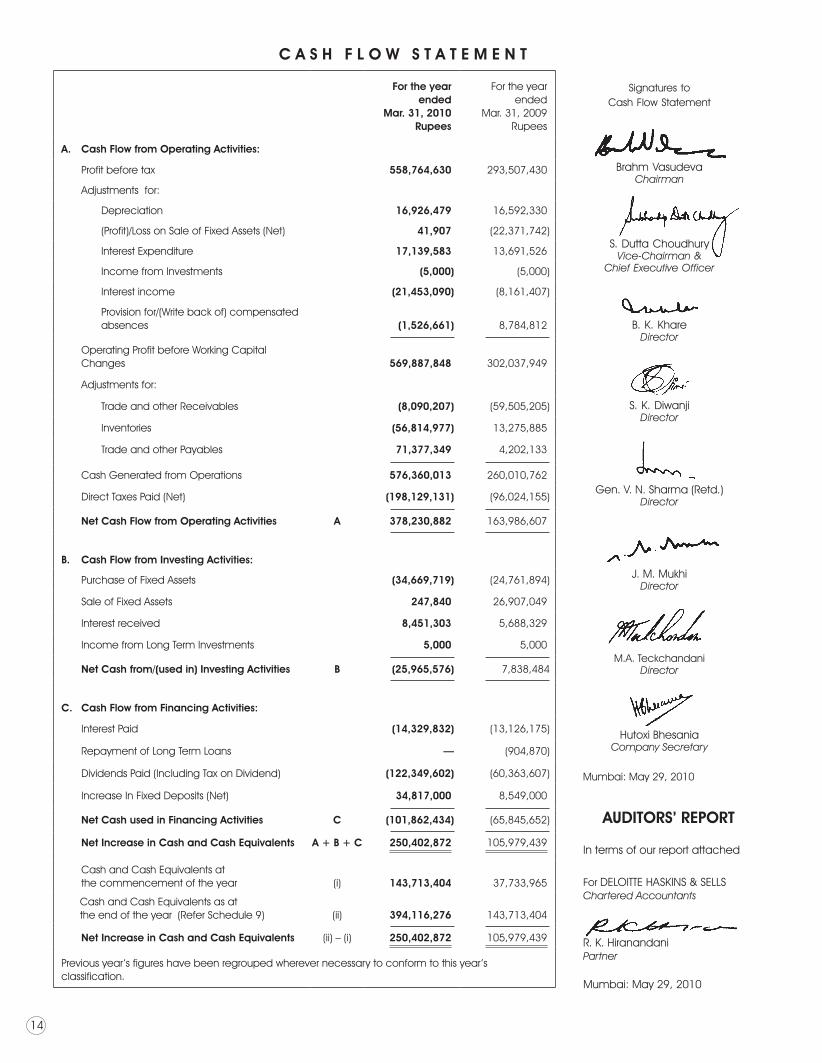
C A S H F L O W S T A T E M E N T
For the year ended
Mar. 31, 2010 Rupees
For the year ended
Mar. 31, 2009 Rupees
A. Cash Flow from Operating Activities:
Profit before tax 558,764,630 293,507,430
Adjustments for:
Depreciation 16,926,479 16,592,330
(Profit)/Loss on Sale of Fixed Assets (Net) 41,907 (22,371,742)
Interest Expenditure 17,139,583 13,691,526
Income from Investments (5,000) (5,000)
Interest income (21,453,090) (8,161,407)
Provision for/(Write back of) compensated absences (1,526,661) 8,784,812
Operating Profit before Working Capital Changes 569,887,848 302,037,949
Adjustments for:
Trade and other Receivables (8,090,207) (59,505,205)
Inventories (56,814,977) 13,275,885
Trade and other Payables 71,377,349 4,202,133
Cash Generated from Operations 576,360,013 260,010,762
Direct Taxes Paid (Net) (198,129,131) (96,024,155)
Net Cash Flow from Operating Activities A 378,230,882 163,986,607
B. Cash Flow from Investing Activities:
Purchase of Fixed Assets (34,669,719) (24,761,894)
Sale of Fixed Assets 247,840 26,907,049
Interest received 8,451,303 5,688,329
Income from Long Term Investments 5,000 5,000
Net Cash from/(used in) Investing Activities B (25,965,576) 7,838,484
C. Cash Flow from Financing Activities:
Interest Paid (14,329,832) (13,126,175)
Repayment of Long Term Loans — (904,870)
Dividends Paid (Including Tax on Dividend) (122,349,602) (60,363,607)
Increase In Fixed Deposits (Net) 34,817,000 8,549,000
Net Cash used in Financing Activities C (101,862,434) (65,845,652)
Net Increase in Cash and Cash Equivalents A + B + C 250,402,872 105,979,439 Cash and Cash Equivalents at
the commencement of the year (i) 143,713,404 37,733,965
Cash and Cash Equivalents as at the end of the year (Refer Schedule 9) (ii) 394,116,276 143,713,404
Net Increase in Cash and Cash Equivalents (ii) – (i) 250,402,872 105,979,439
Previous year’s figures have been regrouped wherever necessary to conform to this year’s classification.
Signatures toCash Flow Statement
Brahm VasudevaChairman
S. Dutta ChoudhuryVice-Chairman &
Chief Executive Officer
B. K. KhareDirector
S. K. DiwanjiDirector
Gen. V. N. Sharma (Retd.)Director
J. M. MukhiDirector
M.A. TeckchandaniDirector
Hutoxi BhesaniaCompany Secretary
Mumbai: May 29, 2010
AUDITORS’ REPORT
In terms of our report attached
For DELOITTE HASKINS & SELLSChartered Accountants
R. K. HiranandaniPartner
Mumbai: May 29, 2010
Accounts-Hawkins-2010.indd 14 6/30/2010 10:18:24 AM

15
S C H E D U L E S
SCHEDULE 1As at Mar. 31, 2010 As at Mar. 31, 2009
Share Capital
AUTHORISED
10,000,000 Equity Shares of Rs. 10 each (previous year: 10,000,000)
ISSUED AND SUBSCRIBED
5,287,815 Equity Shares of Rs. 10 each, fully paid-up,(previous year: 5,287,815) of which 3,332,600 shareswere allotted as fully paid-up Bonus Shares by capitalisation of General Reserve, Share Premium Account, Capital Reserve-Central Subsidy Accountand Export Reserve Account (previous year: 3,332,600)
Rupees Rupees
100,000,000 100,000,000
100,000,000 100,000,000
52,878,150 52,878,150
52,878,150 52,878,150
SCHEDULE 2As at Mar. 31, 2010 As at Mar. 31, 2009
Reserves and Surplus Rupees Rupees Rupees Rupees
GENERAL RESERVEAs per last Balance Sheet 100,030,634 55,030,634 Add: Transfer from Profit & Loss Account 50,000,000 45,000,000
150,030,634 100,030,634
SHARE PREMIUM ACCOUNT 24,924,537 24,924,537
PROFIT & LOSS ACCOUNT — BALANCE 161,211,591 89,471,864
336,166,762 214,427,035
SCHEDULE 3As at Mar. 31, 2010 As at Mar. 31, 2009
Unsecured Loans Rupees Rupees
FIXED DEPOSITS
From Directors 37,413,000 29,763,000
From Shareholders & Others 85,292,000 58,125,000
122,705,000 87,888,000
Accounts-Hawkins-2010.indd 15 6/30/2010 10:18:24 AM

16
SCHEDULES (continued)
SCHEDULE 4 As at Mar. 31, 2010 As at Mar. 31, 2009
Deferred Tax – Net Liability Rupees Rupees Rupees Rupees
Deferred Tax LiabilitiesOn fiscal allowances on Fixed Assets 21,248,519 20,344,389 On other timing differences — 50,985
21,248,519 20,395,374 Less: Deferred Tax Assets
On employee separation and retirement 9,063,419 10,770,357 On provision for debts considered uncertain
of recovery 39,703 39,703 On other timing differences 2,976,188 1,598,809
12,079,310 12,408,869
Net Liability 9,169,209 7,986,505
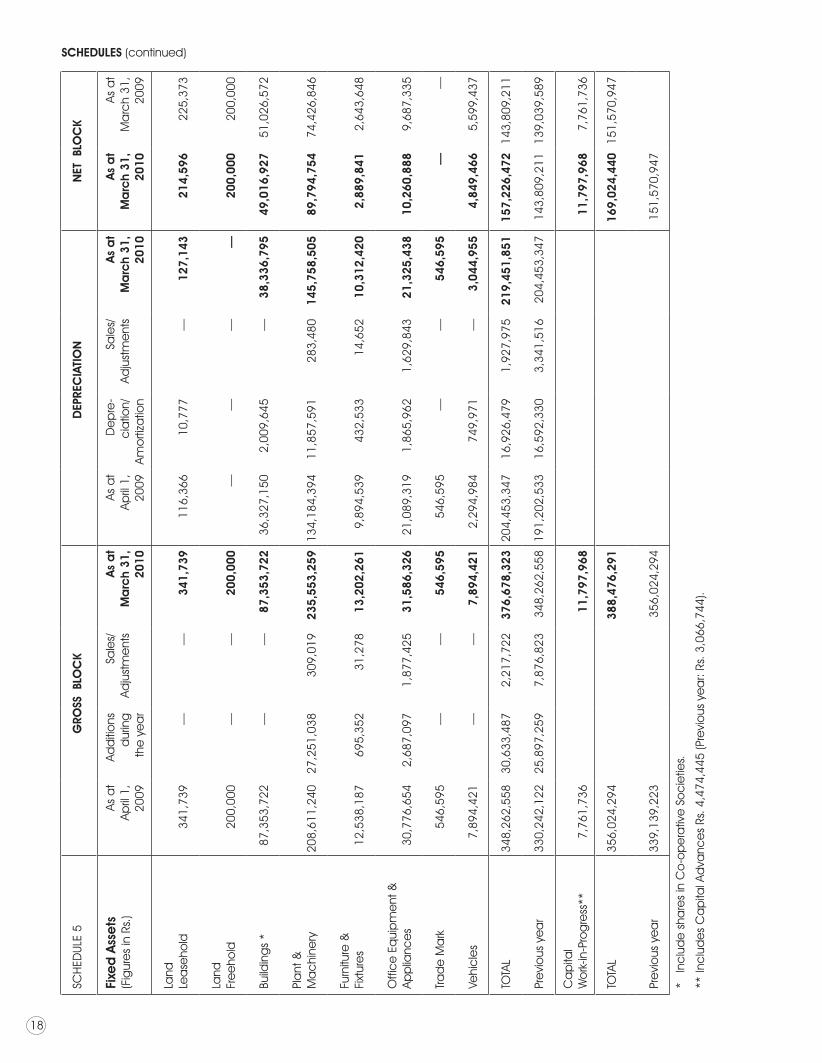
SCHEDULE 5 Fixed Assets AT PAGE 18
SCHEDULE 6 As at Mar. 31, 2010 As at Mar. 31, 2009
Investments (Long Term, at Cost) Rupees Rupees
Unquoted and Non-Trade
2,500 Shares of Rs. 10 each in Saraswat Co-op Bank Ltd. 25,000 25,000
100,000 Shares of Rs. 10 each in Janakalyan Sahakari Bank Ltd. 1,000,000 1,000,000
1,025,000 1,025,000
SCHEDULE 7As at Mar. 31, 2010 As at Mar. 31, 2009
Inventories (at lower of cost and realisable value) Rupees Rupees
(i) Stores, Spares and Tools 4,195,400 4,272,124 (ii) Raw Materials 137,521,443 96,124,439 (iii) Packing Materials 5,006,736 4,173,200 (iv) Finished Goods 47,409,735 58,114,672 (v) Stock under process 117,405,280 92,039,182
311,538,594 254,723,617
SCHEDULE 8As at Mar. 31, 2010 As at Mar. 31, 2009
Sundry Debtors Rupees Rupees(Unsecured)Debts outstanding for a period exceeding six months:
Considered good 1,320,215 2,336,452 Considered uncertain of recovery 116,808 116,808
1,437,023 2,453,260 Other Debts: Considered good 279,011,865 257,724,664
280,448,888 260,177,924 Less: Provision for debts considered uncertain of recovery 116,808 116,808
280,332,080 260,061,116
Accounts-Hawkins-2010.indd 16 6/30/2010 10:18:24 AM

17
SCHEDULES (continued)
SCHEDULE 9As at Mar. 31, 2010 As at Mar. 31, 2009
Cash and Bank Balances Rupees Rupees
(i) Cash on hand 579,846 893,953
(ii) Bank Balances with scheduled banks – on current accounts 27,171,430 20,601,667
– on deposit accounts 366,365,000 122,217,784
394,116,276 143,713,404
SCHEDULE 10As at Mar. 31, 2010 As at Mar. 31, 2009
Loans And Advances Rupees Rupees(Unsecured & considered good)
Advances recoverable in cash or in kind orfor value to be received 51,677,157 50,852,919
Taxation payments (net of provision) 3,674,758 2,571,472
Balance with Central Excise (where payable on demand) 34,495 37,703
55,386,410 53,462,094
SCHEDULE 11As at Mar. 31, 2010 As at Mar. 31, 2009
Current Liabilities Rupees Rupees Rupees Rupees
Sundry Creditors:
Total outstanding dues of Micro Enterprises and Small Enterprises (Note 8) 1,071,650 825,478
Total outstanding dues of creditors other thanMicro Enterprises and Small Enterprises 387,436,624 318,065,717
388,508,274 318,891,195
Unclaimed dividend * 4,176,137 2,796,155
Security Deposits & Earnest Money Deposits 22,406,675 20,560,200
Interest accrued but not due 7,408,824 4,685,278
422,499,910 346,932,828
* There is no amount due and outstanding as at Balance Sheet date to be credited to Investor Education and Protection Fund
SCHEDULE 12As at Mar. 31, 2010 As at Mar. 31, 2009
Provisions Rupees Rupees
Provision for Income Tax (net of payments) — 7,825,845
Proposed Dividend 211,512,600 105,756,300
Provision for tax on Proposed Dividend 35,129,599 17,973,284
Provision for compensated absences 21,361,570 22,888,231
268,003,769 154,443,660
Accounts-Hawkins-2010.indd 17 6/30/2010 10:18:25 AM
18
SCH
EDUL
E 5
G
ROSS
BLO
CK
D
EPRE
CIA
TIO
NN
ET B
LOC
K
Fixe
d A
sse
ts
(Fig
ure
s in
Rs.
)As
at
April
1,
2009
Add
itio
nsd
urin
gth
e y
ea
r
Sale
s/Ad
just
me
nts
As
at
Ma
rch
31,
2010
As a
tAp
ril 1
, 20
09
De
pre
-c
iatio
n/Am
orti
zatio
n
Sale
s/Ad
just
me
nts
As
at
Ma
rch
31,
2010
As
at
Ma
rch
31,
2010
As a
tM
arc
h 31
,20
09
Land
Le
ase
hold
341,
739
——
341,
739
116,
366
10,7
77—
127,
143
214,
596
225,
373
Land
Fr
ee
hold
200,
000
——
200,
000
——
——
200,
000
200,
000
Build
ing
s *
87,3
53,7
22—
—87
,353
,722
36,3
27,1
502,
009,
645
—38
,336
,795
49,0
16,9
2751
,026
,572
Pla
nt &
M
ac
hine
ry20
8,61
1,24
027
,251
,038
309,
019
235,
553,
259
134,
184,
394
11,8
57,5
9128
3,48
014
5,75
8,50
589
,794
,754
74,4
26,8
46
Furn
iture
&Fi
xtur
es
12,5
38,1
8769
5,35
231
,278
13,2
02,2
619,
894,
539
432,
533
14,6
5210
,312
,420
2,88
9,84
12,
643,
648
Offi
ce
Eq
uip
me
nt &
App
lianc
es
30,7
76,6
542,
687,
097
1,87
7,42
531
,586
,326
21,0
89,3
191,
865,
962
1,62
9,84
321
,325
,438
10,2
60,8
889,
687,
335
Trad
e M
ark
546,
595
——
546,
595
546,
595
——
546,
595
——
Vehi
cle
s7,
894,
421
——
7,89
4,42
12,
294,
984
749,
971
—3,
044,
955
4,84
9,46
65,
599,
437
TOTA
L34
8,26
2,55
830
,633
,487
2,21
7,72
237
6,67
8,32
320
4,45
3,34
716
,926
,479
1,92
7,97
521
9,45
1,85
115
7,22
6,47
214
3,80
9,21
1
Pre
vio
us y
ea
r33
0,24
2,12
225
,897
,259
7,87
6,82
334
8,26
2,55
819
1,20
2,53
316
,592
,330
3,34
1,51
620
4,45
3,34
714
3,80
9,21
113
9,03
9,58
9
Ca
pita
l W
ork
-in-P
rog
ress
**7,
761,
736
11,7
97,9
6811
,797
,968
7,76
1,73
6
TOTA
L35
6,02
4,29
438
8,47
6,29
116
9,02
4,44
015
1,57
0,94
7
Pre
vio
us y
ea
r33
9,13
9,22
335
6,02
4,29
415
1,57
0,94
7
* In
clu
de
sha
res
in C
o-o
pe
rativ
e S
oc
ietie
s.
** In
clu
de
s C
ap
ital A
dva
nce
s Rs
. 4,4
74,4
45 (P
revi
ous
ye
ar:
Rs. 3
,066
,744
).
SCHEDULES (continued)
Accounts-Hawkins-2010.indd 18 6/30/2010 10:18:25 AM
19
SCHEDULES (continued)
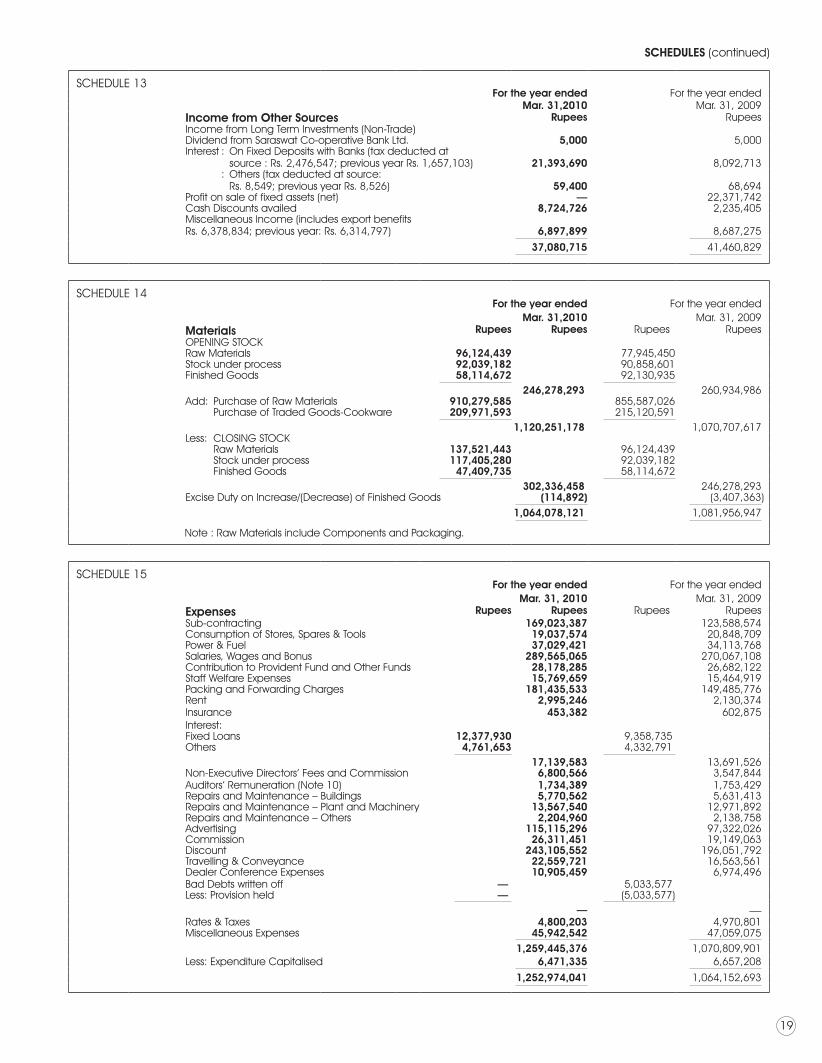
SCHEDULE 13For the year ended For the year ended
Mar. 31,2010 Mar. 31, 2009Income from Other Sources Rupees RupeesIncome from Long Term Investments (Non-Trade)Dividend from Saraswat Co-operative Bank Ltd. 5,000 5,000Interest : On Fixed Deposits with Banks (tax deducted at source : Rs. 2,476,547; previous year Rs. 1,657,103) 21,393,690 8,092,713 : Others (tax deducted at source: Rs. 8,549; previous year Rs. 8,526) 59,400 68,694 Profit on sale of fixed assets (net) — 22,371,742 Cash Discounts availed 8,724,726 2,235,405 Miscellaneous Income (includes export benefitsRs. 6,378,834; previous year: Rs. 6,314,797) 6,897,899 8,687,275
37,080,715 41,460,829
SCHEDULE 14For the year ended For the year ended
Mar. 31,2010 Mar. 31, 2009Materials Rupees Rupees Rupees RupeesOPENING STOCKRaw Materials 96,124,439 77,945,450 Stock under process 92,039,182 90,858,601 Finished Goods 58,114,672 92,130,935
246,278,293 260,934,986 Add: Purchase of Raw Materials 910,279,585 855,587,026 Purchase of Traded Goods-Cookware 209,971,593 215,120,591
1,120,251,178 1,070,707,617 Less: CLOSING STOCK Raw Materials 137,521,443 96,124,439 Stock under process 117,405,280 92,039,182 Finished Goods 47,409,735 58,114,672
302,336,458 246,278,293 Excise Duty on Increase/(Decrease) of Finished Goods (114,892) (3,407,363)
1,064,078,121 1,081,956,947
Note : Raw Materials include Components and Packaging.
SCHEDULE 15For the year ended For the year ended
Mar. 31, 2010 Mar. 31, 2009Expenses Rupees Rupees Rupees RupeesSub-contracting 169,023,387 123,588,574 Consumption of Stores, Spares & Tools 19,037,574 20,848,709 Power & Fuel 37,029,421 34,113,768 Salaries, Wages and Bonus 289,565,065 270,067,108 Contribution to Provident Fund and Other Funds 28,178,285 26,682,122 Staff Welfare Expenses 15,769,659 15,464,919 Packing and Forwarding Charges 181,435,533 149,485,776 Rent 2,995,246 2,130,374 Insurance 453,382 602,875 Interest: Fixed Loans 12,377,930 9,358,735 Others 4,761,653 4,332,791
17,139,583 13,691,526Non-Executive Directors’ Fees and Commission 6,800,566 3,547,844 Auditors’ Remuneration (Note 10) 1,734,389 1,753,429 Repairs and Maintenance – Buildings 5,770,562 5,631,413 Repairs and Maintenance – Plant and Machinery 13,567,540 12,971,892 Repairs and Maintenance – Others 2,204,960 2,138,758 Advertising 115,115,296 97,322,026 Commission 26,311,451 19,149,063 Discount 243,105,552 196,051,792 Travelling & Conveyance 22,559,721 16,563,561 Dealer Conference Expenses 10,905,459 6,974,496 Bad Debts written off — 5,033,577Less: Provision held — (5,033,577)
— —Rates & Taxes 4,800,203 4,970,801 Miscellaneous Expenses 45,942,542 47,059,075
1,259,445,376 1,070,809,901 Less: Expenditure Capitalised 6,471,335 6,657,208
1,252,974,041 1,064,152,693
Accounts-Hawkins-2010.indd 19 6/30/2010 10:18:25 AM
SCHEDULES (continued)
20
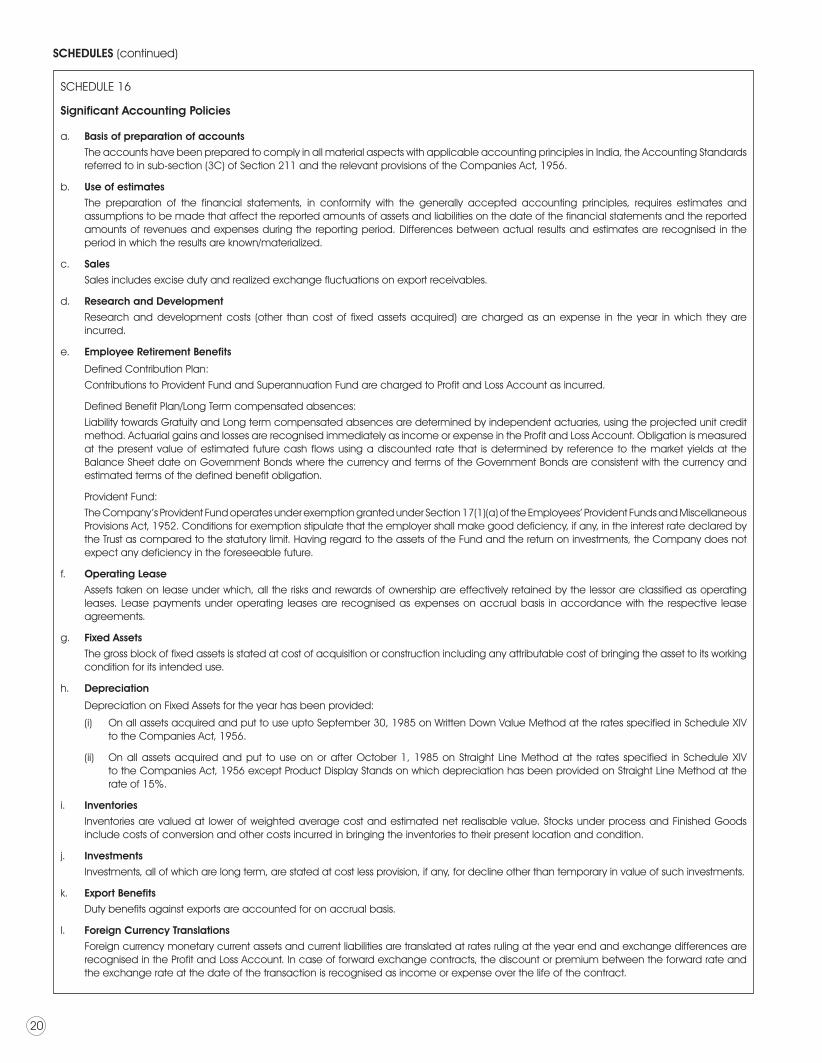
SCHEDULE 16
Significant Accounting Policies
a. Basis of preparation of accounts
The accounts have been prepared to comply in all material aspects with applicable accounting principles in India, the Accounting Standards referred to in sub-section (3C) of Section 211 and the relevant provisions of the Companies Act, 1956.
b. Use of estimates
The preparation of the financial statements, in conformity with the generally accepted accounting principles, requires estimates and assumptions to be made that affect the reported amounts of assets and liabilities on the date of the financial statements and the reported amounts of revenues and expenses during the reporting period. Differences between actual results and estimates are recognised in the period in which the results are known/materialized.
c. Sales
Sales includes excise duty and realized exchange fluctuations on export receivables.
d. Research and Development
Research and development costs (other than cost of fixed assets acquired) are charged as an expense in the year in which they are incurred.
e. Employee Retirement Benefits
Defined Contribution Plan:
Contributions to Provident Fund and Superannuation Fund are charged to Profit and Loss Account as incurred.
Defined Benefit Plan/Long Term compensated absences:
Liability towards Gratuity and Long term compensated absences are determined by independent actuaries, using the projected unit credit method. Actuarial gains and losses are recognised immediately as income or expense in the Profit and Loss Account. Obligation is measured at the present value of estimated future cash flows using a discounted rate that is determined by reference to the market yields at the Balance Sheet date on Government Bonds where the currency and terms of the Government Bonds are consistent with the currency and estimated terms of the defined benefit obligation.
Provident Fund:
The Company’s Provident Fund operates under exemption granted under Section 17(1)(a) of the Employees’ Provident Funds and Miscellaneous Provisions Act, 1952. Conditions for exemption stipulate that the employer shall make good deficiency, if any, in the interest rate declared by the Trust as compared to the statutory limit. Having regard to the assets of the Fund and the return on investments, the Company does not expect any deficiency in the foreseeable future.
f. Operating Lease
Assets taken on lease under which, all the risks and rewards of ownership are effectively retained by the lessor are classified as operating leases. Lease payments under operating leases are recognised as expenses on accrual basis in accordance with the respective lease agreements.
g. Fixed Assets
The gross block of fixed assets is stated at cost of acquisition or construction including any attributable cost of bringing the asset to its working condition for its intended use.
h. Depreciation
Depreciation on Fixed Assets for the year has been provided:
(i) On all assets acquired and put to use upto September 30, 1985 on Written Down Value Method at the rates specified in Schedule XIV to the Companies Act, 1956.
(ii) On all assets acquired and put to use on or after October 1, 1985 on Straight Line Method at the rates specified in Schedule XIV to the Companies Act, 1956 except Product Display Stands on which depreciation has been provided on Straight Line Method at the rate of 15%.
i. Inventories
Inventories are valued at lower of weighted average cost and estimated net realisable value. Stocks under process and Finished Goods include costs of conversion and other costs incurred in bringing the inventories to their present location and condition.
j. Investments
Investments, all of which are long term, are stated at cost less provision, if any, for decline other than temporary in value of such investments.
k. Export Benefits
Duty benefits against exports are accounted for on accrual basis.
l. Foreign Currency Translations
Foreign currency monetary current assets and current liabilities are translated at rates ruling at the year end and exchange differences are recognised in the Profit and Loss Account. In case of forward exchange contracts, the discount or premium between the forward rate and the exchange rate at the date of the transaction is recognised as income or expense over the life of the contract.
Notes.indd 20 6/30/2010 10:17:38 AM

SCHEDULES (continued)
21
SCHEDULE 16 (continued)
m. Taxes on Income
Current tax is determined as the amount of tax payable in respect of taxable income for the period. Deferred tax is recognised, subject to the consideration of prudence, on timing differences, being the difference between taxable income and accounting income, that originate in one period and are capable of reversal in one or more subsequent periods. Deferred tax assets are not recognised on unabsorbed depreciation and carry forward of losses unless there is a virtual certainty that sufficient future taxable income will be available against which such deferred tax assets can be realised.
n. Contingent Liabilities
Contingent Liabilities are disclosed in the notes on accounts. Provision is made in the accounts if it becomes probable that an outflow of resources embodying economic benefits will be required to settle the obligation.
Notes forming part of the Accounts
1. Estimated amount of contracts remaining to be executed on capital account not provided for is Rs. 12,765,293 (previous year: Rs. 5,447,934).
2. The possession of 20 acres of land has been given to the Company by the Government of Punjab, as per the agreement, the conveyance of which has yet to be finalised.
3. Claims against the Company not acknowledged as debts are gross Rs.12,152,446 (previous year: Rs.13,739,498), net of tax Rs. 8,643,998 (previous year: Rs. 11,342,101). These comprise:
(a) Excise Duty, Sales Tax and Indirect Taxes claims disputed by the Company relating to issues of applicability and classification aggregating gross Rs. 10,204,778 (previous year: Rs. 12,892,166), net of tax Rs. 7,678,704 (previous year: Rs. 10,494,769).
(b) Income Tax claims disputed by the Company relating to allowability of certain expenses aggregating gross Rs. 965,924 (previous year: Rs. 847,332), net of tax Rs. 965,924 (previous year: Rs. 847,332).
(c) Bills Discounted Rs. 981,744 (previous year: Rs. Nil)
4. Salaries, Wages and Bonus include Directors’ remuneration consisting of Salary and Allowances of Rs. 3,983,000 (previous year: Rs. 5,708,004) and Commission of Rs. 14,895,605 (previous year: Rs. 10,107,453), Company’s contribution to Provident Fund is Rs.465,000 (previous year: Rs. 672,000) and Superannuation/Gratuity Fund is Rs. 767,548 (previous year: Rs. 1,109,231). Reimbursement of medical expenses is Rs. 73,535 (previous year: Rs. 115,903) and value of other perquisites is Rs. 158,142 (previous year: Rs. 200,394). In addition, Rs. 121,089 (previous year: Rs. 85,119) has been incurred on benefits provided to the Non-Executive Chairman of the Company, as Advisor.
5. Computation of Net Profit in accordance with Section 309(5) of the Companies Act, 1956 for the year ended March 31, 2010
For the year endedMar. 31, 2010
For the year endedMar. 31, 2009
Rupees Rupees Rupees Rupees
Profit Before Taxation as per Profit and Loss Account 558,764,630 293,507,430
Add:
Directors’ Remuneration including Directors’ Fees 27,143,396 21,460,829
Depreciation charged in the Accounts 16,926,479 16,592,330
44,069,875 38,053,159
Less:
Depreciation as per Section 350 of the Companies Act, 1956 16,738,289 16,404,140
Capital profit on sale of Fixed Assets 39,644 21,338,500
Debts written off against provision for debts considered uncertain of recovery
— 5,033,577
16,777,933 42,776,217
27,291,942 (4,723,058)
Net Profit as per Section 309(5) 586,056,572 288,784,372
Commission payable to Executive Directors 14,895,605 10,107,453
Commission payable to Non-Executive Directors 5,860,566 2,887,844
6. The net difference on account of foreign exchange translations credited to the Profit and Loss Account is Rs. 241,646 (previous year: debited Rs. 1,712,630).
7. The Company operates in a single segment, manufacture, trading and sale of Kitchenware.
Notes.indd 21 6/30/2010 10:17:38 AM
SCHEDULES (continued)
22
SCHEDULE 16 (continued)
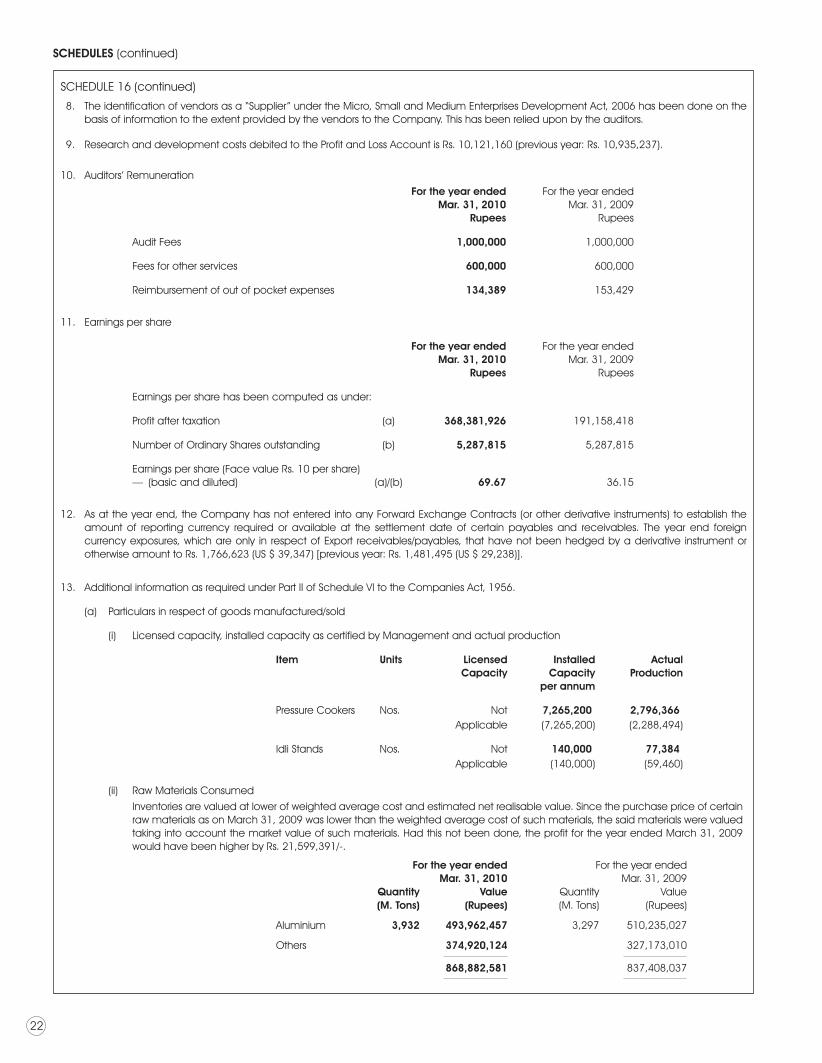
8. The identification of vendors as a “Supplier” under the Micro, Small and Medium Enterprises Development Act, 2006 has been done on the basis of information to the extent provided by the vendors to the Company. This has been relied upon by the auditors.
9. Research and development costs debited to the Profit and Loss Account is Rs. 10,121,160 (previous year: Rs. 10,935,237).
10. Auditors’ Remuneration
For the year endedMar. 31, 2010
Rupees
For the year endedMar. 31, 2009
Rupees
Audit Fees 1,000,000 1,000,000
Fees for other services 600,000 600,000
Reimbursement of out of pocket expenses 134,389 153,429
11. Earnings per share
For the year endedMar. 31, 2010
Rupees
For the year endedMar. 31, 2009
Rupees
Earnings per share has been computed as under:
Profit after taxation (a) 368,381,926 191,158,418
Number of Ordinary Shares outstanding (b) 5,287,815 5,287,815
Earnings per share (Face value Rs. 10 per share) — (basic and diluted) (a)/(b) 69.67 36.15
12. As at the year end, the Company has not entered into any Forward Exchange Contracts (or other derivative instruments) to establish the amount of reporting currency required or available at the settlement date of certain payables and receivables. The year end foreign currency exposures, which are only in respect of Export receivables/payables, that have not been hedged by a derivative instrument or otherwise amount to Rs. 1,766,623 (US $ 39,347) [previous year: Rs. 1,481,495 (US $ 29,238)].
13. Additional information as required under Part II of Schedule VI to the Companies Act, 1956.
(a) Particulars in respect of goods manufactured/sold
(i) Licensed capacity, installed capacity as certified by Management and actual production
Item Units LicensedCapacity
InstalledCapacity
per annum
ActualProduction
Pressure Cookers Nos. Not 7,265,200 2,796,366Applicable (7,265,200) (2,288,494)
Idli Stands Nos. Not 140,000 77,384Applicable (140,000) (59,460)
(ii) Raw Materials Consumed
Inventories are valued at lower of weighted average cost and estimated net realisable value. Since the purchase price of certain raw materials as on March 31, 2009 was lower than the weighted average cost of such materials, the said materials were valued taking into account the market value of such materials. Had this not been done, the profit for the year ended March 31, 2009 would have been higher by Rs. 21,599,391/-.
For the year endedMar. 31, 2010
For the year endedMar. 31, 2009
Quantity Value Quantity Value(M. Tons) (Rupees) (M. Tons) (Rupees)
Aluminium 3,932 493,962,457 3,297 510,235,027
Others 374,920,124 327,173,010
868,882,581 837,408,037
Notes.indd 22 6/30/2010 10:17:39 AM
SCHEDULES (continued)
23
SCHEDULE 16 (continued)
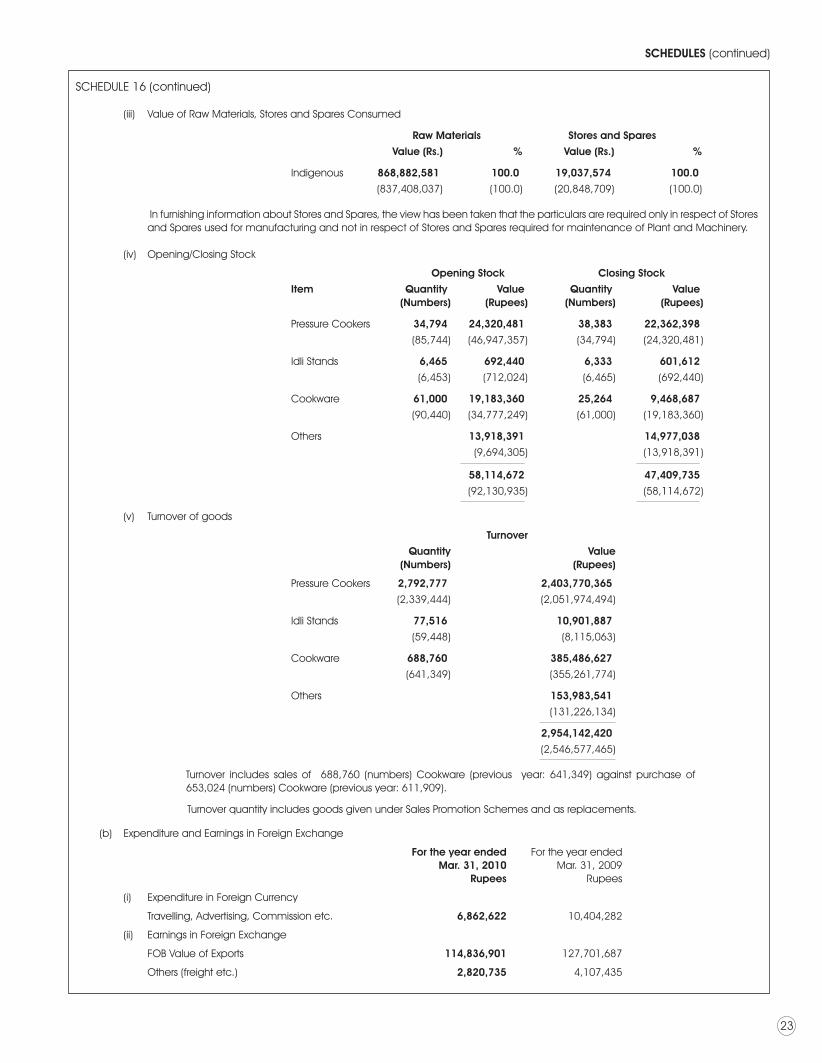
(iii) Value of Raw Materials, Stores and Spares Consumed
Raw Materials Stores and Spares
Value (Rs.) % Value (Rs.) %
Indigenous 868,882,581 100.0 19,037,574 100.0
(837,408,037) (100.0) (20,848,709) (100.0)
In furnishing information about Stores and Spares, the view has been taken that the particulars are required only in respect of Stores and Spares used for manufacturing and not in respect of Stores and Spares required for maintenance of Plant and Machinery.
(iv) Opening/Closing Stock
Opening Stock Closing Stock
Item Quantity Value Quantity Value(Numbers) (Rupees) (Numbers) (Rupees)
Pressure Cookers 34,794 24,320,481 38,383 22,362,398
(85,744) (46,947,357) (34,794) (24,320,481)
Idli Stands 6,465 692,440 6,333 601,612
(6,453) (712,024) (6,465) (692,440)
Cookware 61,000 19,183,360 25,264 9,468,687
(90,440) (34,777,249) (61,000) (19,183,360)
Others 13,918,391 14,977,038
(9,694,305) (13,918,391)
58,114,672 47,409,735
(92,130,935) (58,114,672)
(v) Turnover of goods
Turnover
Quantity Value(Numbers) (Rupees)
Pressure Cookers 2,792,777 2,403,770,365
(2,339,444) (2,051,974,494)
Idli Stands 77,516 10,901,887
(59,448) (8,115,063)
Cookware 688,760 385,486,627
(641,349) (355,261,774)
Others 153,983,541
(131,226,134)
2,954,142,420
(2,546,577,465)
Turnover includes sales of 688,760 (numbers) Cookware (previous year: 641,349) against purchase of 653,024 (numbers) Cookware (previous year: 611,909).
Turnover quantity includes goods given under Sales Promotion Schemes and as replacements.
(b) Expenditure and Earnings in Foreign Exchange
For the year endedMar. 31, 2010
Rupees
For the year endedMar. 31, 2009
Rupees
(i) Expenditure in Foreign Currency
Travelling, Advertising, Commission etc. 6,862,622 10,404,282
(ii) Earnings in Foreign Exchange
FOB Value of Exports 114,836,901 127,701,687
Others (freight etc.) 2,820,735 4,107,435
Notes.indd 23 6/30/2010 10:17:39 AM

SCHEDULES (continued)
24
SCHEDULE 16 (continued) (c) Remittance in Foreign Currency on account of Dividends to Non-resident shareholders
For the year endedMar. 31, 2010
For the year endedMar. 31, 2009
— Number of shareholders 3 3 — Number of Equity shares 1,800 1,800 — Amount remitted (Rupees) 36,000 18,000 — Dividend in respect of year ended March 31 2009 2008
14. Related Party Disclosures:
1. Related Parties
(a) Individual having control and relatives:
Mr. Brahm Vasudeva Chairman
and relatives: Mr. Neil Vasudeva Mr. Nikhil Vasudeva Ms. Anuradha S. Khandelwal Ms. Gitanjali V. Nevatia Ms. Gayatri S. Yadav
(b) Key Management Personnel and their relatives:
Mr. S. Dutta Choudhury Vice-Chairman & Chief Executive Officer Mr. K. Sundararaghavan Wholetime Director (up to April 15, 2009) Mr. M. A. Teckchandani Wholetime Director Mrs. Sonya Dutta Choudhury Relative Mrs. S. M. Teckchandani Relative Mrs. Prabha Raghavan Relative (up to April 15, 2009)
2. Disclosure of transactions between the Company and Related Parties and the Status of outstanding balances as at March 31, 2010.
Individual having control and relatives Key Management Personnel and relatives
Mr. BrahmVasudeva
Mr. NeilVasudeva
Mr. NikhilVasudeva
Others Mr. S. DuttaChoudhury
Mr. M. A.Teckchandani
Others
Rupees Rupees Rupees Rupees Rupees Rupees Rupees
(a) Remuneration — 1,374,313 — — 11,553,966 8,380,734 408,130 (—) (2,297,160) (—) (—) (7,064,896) (5,433,524) (5,414,565)
(b) Directors' Fees and Commission 1,141,761 — — — — — —(561,307) (—) (—) (—) (—) (—) (—)
(c) Benefits provided to the Non-Executive Chairman, as Advisor 121,089 — — — — — —
(85,119) (—) (—) (—) (—) (—) (—)
(d) Dividend paid 36,668,640 7,600,640 7,600,640 7,300,480 1,000 24,680 2,000 (18,337,320) (3,800,320) (3,800,320) (3,650,240) (500) (12,340) (1,500)
(e) Fixed deposits repaid — — — — — — —(—) (—) (—) (—) (—) (—) (—)
(f) Fixed deposits accepted — 1,000,000 — — 3,000,000 2,950,000 700,000 (—) (—) (—) (—) (—) (—) (—)
(g) Interest paid on Fixed deposits 3,205,621 623,854 — 25,020 189,094 203,764 80,962 (3,177,583) (565,858) (—) (22,707) (—) (—) (—)
(h) Rent received — — — — — — —(22,222) (—) (—) (—) (—) (—) (—)
(i) Security deposit refunded — — — — — — —(8,000,000) (—) (—) (—) (—) (—) (—)
(j) Proceeds from sale of Fixed Assets — — — — — — —
(26,420,000) (—) (—) (—) (—) (—) (—)
Balance as at March 31, 2010
Fixed deposits 29,763,000 5,550,000 — 200,000 3,000,000 2,950,000 700,000 (29,763,000) (4,550,000) (—) (200,000) (—) (—) (—)
Notes.indd 24 6/30/2010 10:17:39 AM

SCHEDULES (continued)
25
SCHEDULE 16 (continued)
15. Employee Defined Benefits:
Defined benefit plan – as per Actuarial valuation
Gratuity (Funded)
Mar. 31, 2010 Mar. 31, 2009
I. Expense recognised in the Statement of Profit and Loss Account for the year ended
1. Current Service Cost 3,723,245 3,626,575
2. Interest 7,916,318 7,459,402
3. Expected Return on plan assets (8,628,786) (7,797,286)
4. Actuarial (Gain)/Loss 2,787,797 (2,700,852)
5. Total expense 5,798,574 587,839
II. Net Asset/(Liability) recognised in the Balance Sheet Mar. 31, 2008
1. Present Value of Defined Benefit Obligation as at year end 105,925,634 98,953,970 93,242,526
2. Fair value of plan assets as at year end 100,622,248 90,155,362 75,880,260
3. Funded status Surplus/(Deficit) (5,303,386) (8,798,608) (17,362,266)
4. Net Asset/(Liability) as at year end (5,303,386) (8,798,608) (17,362,266)
III. Change in the obligation during the year ended
1. Present Value of Defined Benefit Obligation at the beginning of the year 98,953,970 93,242,526
2. Current Service Cost 3,723,245 3,626,575
3. Interest 7,916,318 7,459,402
4. Actuarial (Gain)/Loss 2,787,797 (2,700,852)
5. Benefit payments (7,455,696) (2,673,681)
6. Present Value of Defined Benefit Obligation at the end of the year 105,925,634 98,953,970
IV. Change in Fair Value of Assets during the year ended
1. Fair value of plan assets at the beginning of the year 90,155,362 75,880,260
2. Expected Return on plan assets 8,628,786 7,797,286
3. Contributions by employer 9,293,796 9,151,497
4. Actual benefits paid (7,455,696) (2,673,681)
5. Fair value of plan assets at the end of the year 100,622,248 90,155,362
6. Actual return on plan assets 8,628,786 7,797,286
V. The major categories of plan assets as a percentage of total plan
Funded with Life Insurance Corporation of India (LIC) 100% 100%
VI. Actuarial assumptions
1. Discount Rate 8% 8%
2. Expected rate of return on plan assets 9.40% 9.40%
3. In-service mortality LIC (1994-96) ultimate
LIC (1994-96) ultimate
4. Turnover rate 1% to 3% as per age 1% to 3% as per age
5. Salary Escalation 4% 4%
The expected rate of return is based on expectation of the average long term rate of return expected on investment of the fund, during the estimated term of obligation.
The estimate of future salary increase considered in the actuarial valuation takes into account historical trends, future expectations, inflation, seniority, promotion and other relevant factors. The details of experience adjustments arising on account of planned assets/liabilities as required by paragraph 120(n)(ii) of AS15 are not available in the valuation statement received from LIC and hence are not furnished.
16. Previous year’s figures have been regrouped wherever necessary to conform to this year’s classification.
17. Previous year’s figures wherever applicable are written in brackets.
Notes.indd 25 6/30/2010 10:17:39 AM
SCHEDULES (continued)
26
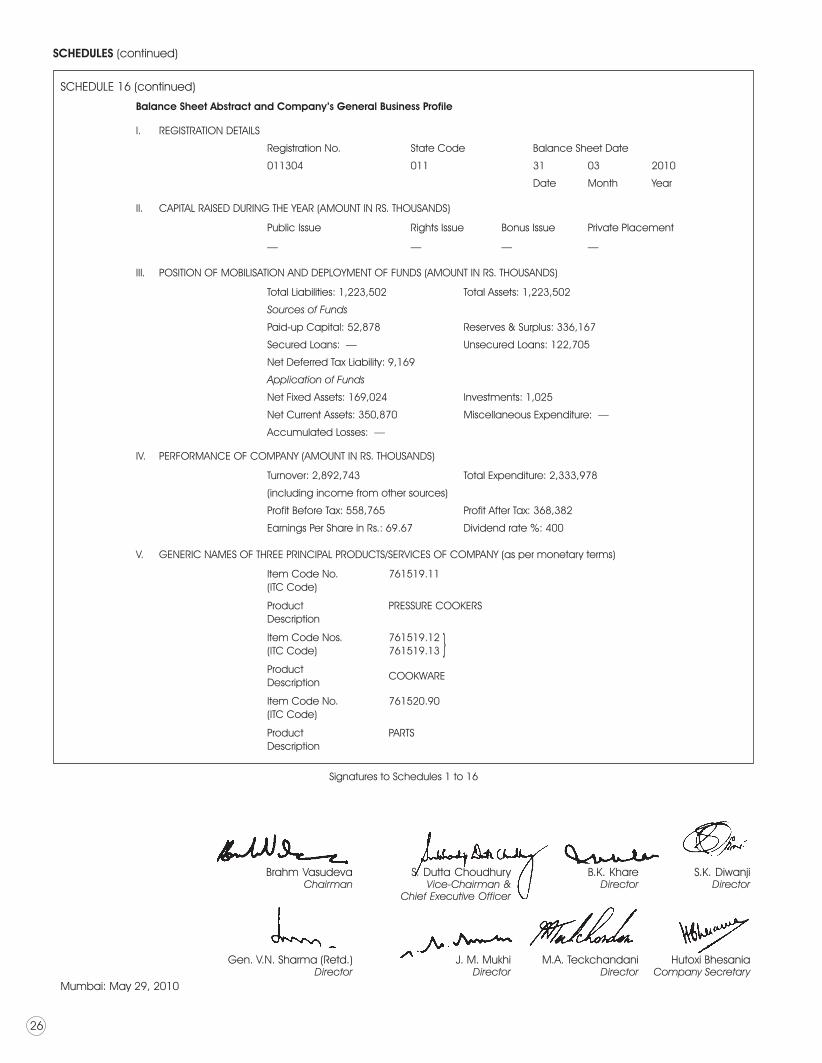
Balance Sheet Abstract and Company’s General Business Profile
I. REGISTRATION DETAILS
Registration No. State Code Balance Sheet Date
011304 011 31 03 2010
Date Month Year
II. CAPITAL RAISED DURING THE YEAR (AMOUNT IN RS. THOUSANDS)
Public Issue Rights Issue Bonus Issue Private Placement
— — — —
III. POSITION OF MOBILISATION AND DEPLOYMENT OF FUNDS (AMOUNT IN RS. THOUSANDS)
Total Liabilities: 1,223,502 Total Assets: 1,223,502
Sources of Funds
Paid-up Capital: 52,878 Reserves & Surplus: 336,167
Secured Loans: — Unsecured Loans: 122,705
Net Deferred Tax Liability: 9,169
Application of Funds
Net Fixed Assets: 169,024 Investments: 1,025
Net Current Assets: 350,870 Miscellaneous Expenditure: —
Accumulated Losses: —
IV. PERFORMANCE OF COMPANY (AMOUNT IN RS. THOUSANDS)
Turnover: 2,892,743 Total Expenditure: 2,333,978
(including income from other sources)
Profit Before Tax: 558,765 Profit After Tax: 368,382
Earnings Per Share in Rs.: 69.67 Dividend rate %: 400
V. GENERIC NAMES OF THREE PRINCIPAL PRODUCTS/SERVICES OF COMPANY (as per monetary terms)
Item Code No. (ITC Code)
761519.11
Product Description
PRESSURE COOKERS
Item Code Nos. (ITC Code)
761519.12 761519.13
Product Description
COOKWARE
Item Code No. (ITC Code)
761520.90
Product Description
PARTS
Signatures to Schedules 1 to 16
SCHEDULE 16 (continued)
}
Mumbai: May 29, 2010
Brahm Vasudeva S. Dutta Choudhury B.K. Khare S.K. Diwanji Chairman Vice-Chairman & Director Director Chief Executive Officer
Gen. V.N. Sharma (Retd.) J. M. Mukhi M.A. Teckchandani Hutoxi Bhesania Director Director Director Company Secretary
Notes.indd 26 6/30/2010 10:17:40 AM