uncovering indonesia’s ethnic diversity indonesia’s ethnic diversity: the national, provincial,...
TRANSCRIPT

Uncovering Indonesia’s Ethnic Diversity: The National, Provincial, and District Levels
Evi Nurvidya Arifin
Aris Ananta
Dwi Retno Wilujeng Wahyu Utami
Presented at an ISEAS’s public seminar. Singapore: 18 November 2014

Outline
• Why Ethnicity in Indonesia?
• Continuation of Previous Studies
• Objective of the Study and Presentation
• Collaborative Research between
ISEAS and BPS- Statistics Indonesia
• Concept, Data and Measurements
• Ethnic Homogeneity- Heterogeneity
• Ethnic Fractionalization
• Ethnic Polarization
• Geographical Distribution of the 5 Largest Ethnic Groups and Chinese in Indonesia
• Concluding Remarks
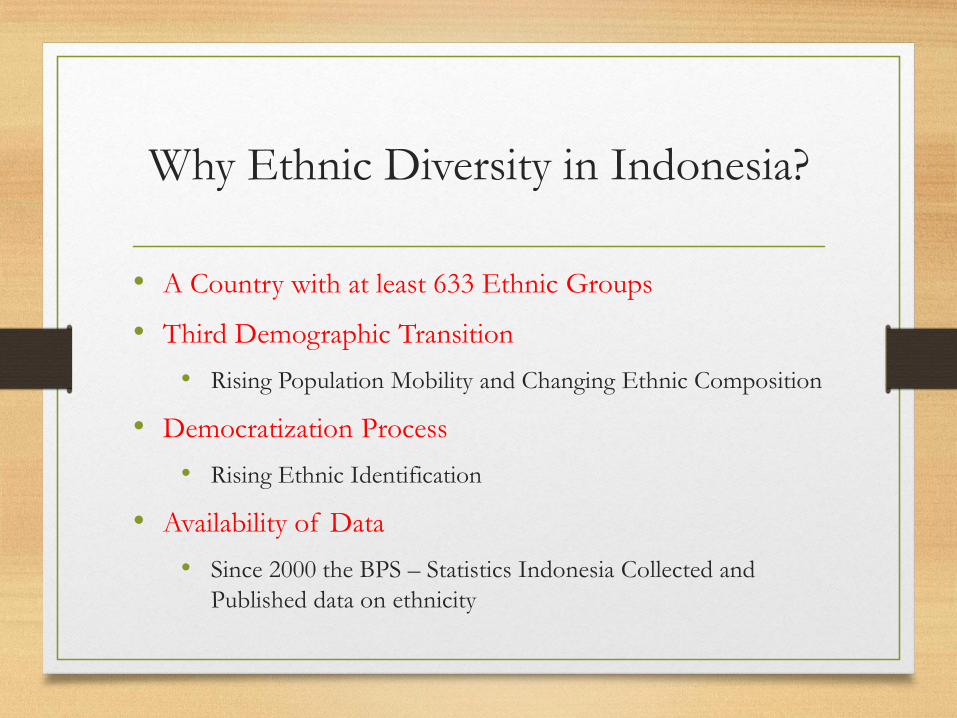
Why Ethnic Diversity in Indonesia?
• A Country with at least 633 Ethnic Groups
• Third Demographic Transition
• Rising Population Mobility and Changing Ethnic Composition
• Democratization Process
• Rising Ethnic Identification
• Availability of Data
• Since 2000 the BPS – Statistics Indonesia Collected and
Published data on ethnicity

Continuation of Past Research (1)
• Indonesia’s Population. Ethnicity and Religion in
Changing Political Landscape. By Leo Suryadinata, Evi
Nurvidya Arifin, and Aris Ananta, 2003. This book
utilized the results of the 2000 population census at
national and provincial levels
• Indonesian Electoral Behaviour. A Statistical Perspective.
By Aris Ananta, Evi Nurvidya Arifin, and Leo
Suryadinata, 2004. This book used the results of the 2000
population census at the district level.

Continuation of Past Research (2)
• “Ethnicity and Ageing in Indonesia, 2000-2050”, Asian Population Studies, vol.1, no. 2, July 2005, by Aris Ananta, Evi Nurvidya Arifin, and Bakhtiar. This paper examines and projects ageing population by five largest ethnic groups in Indonesia. Used raw data set from the 2000 population census.
• “Chinese Indonesian in Indonesia and the Province of Riau Archipelago”, by Aris Ananta, Evi Nurvidya Arifin, and Bakhtiar. In Ethnic Chinese in Contemporary Indonesia. Edited by Leo Suryadinata. Singapore: ISEAS, 2008.
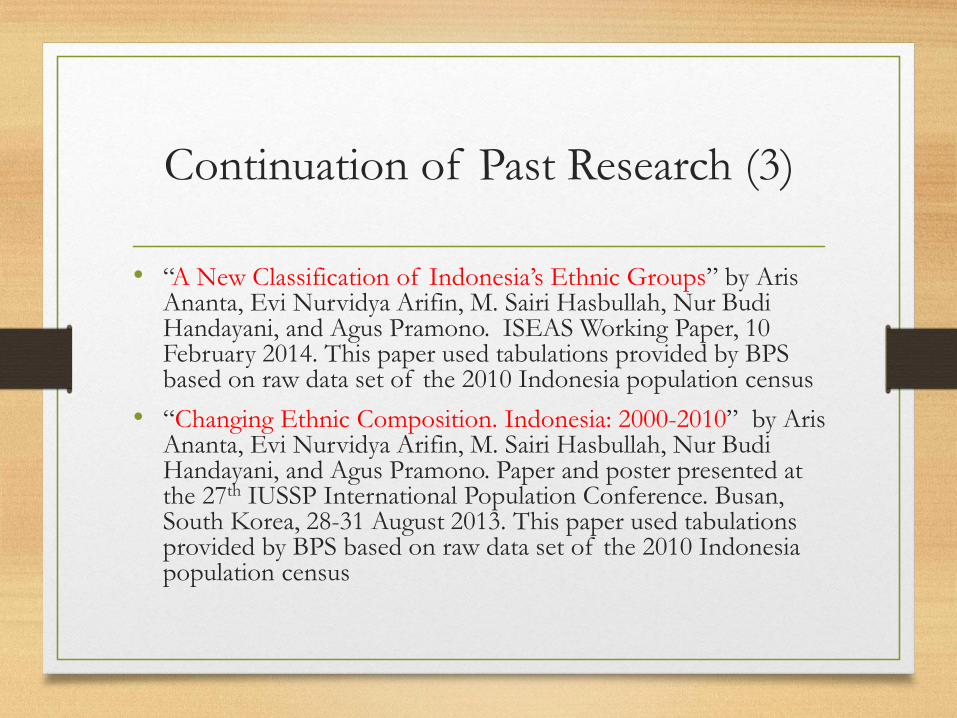
Continuation of Past Research (3)
• “A New Classification of Indonesia’s Ethnic Groups” by Aris Ananta, Evi Nurvidya Arifin, M. Sairi Hasbullah, Nur Budi Handayani, and Agus Pramono. ISEAS Working Paper, 10 February 2014. This paper used tabulations provided by BPS based on raw data set of the 2010 Indonesia population census
• “Changing Ethnic Composition. Indonesia: 2000-2010” by Aris Ananta, Evi Nurvidya Arifin, M. Sairi Hasbullah, Nur Budi Handayani, and Agus Pramono. Paper and poster presented at the 27th IUSSP International Population Conference. Busan, South Korea, 28-31 August 2013. This paper used tabulations provided by BPS based on raw data set of the 2010 Indonesia population census

Objective of the Presentation
• To present a quantitative picture of Indonesia’s ethnic
diversity at national, provincial, and district levels.
• This is the first quantitative picture of Indonesia’s ethnic
diversity.
• This is also the first time presented to the public
• It is a demographic study on ethnicity.

Collaborative Research between
ISEAS and BPS – Statistics Indonesia
• Evi Nurvidya Arifin
• Aris Ananta
• Dwi Retno Wilujeng Wahyu Utami
• Nur Budi Handayani
• Agus Pramono
• Ari Purbowati
• M. Sairi Hasbullah

CONCEPT OF ETHNICITY
Self-Identity,
One respondent, one ethnic group
Ethnic identity may be fluid, not static over time.

CLASSIFICATION OF ETHNIC GROUPS
We use the “New Classification” of ethnic groups created by Ananta, Arifin, Hasbullah, Handayani, and Pramono(2014).
From 1,333 ethnic categories, they classified the categories into at least 633 ethnic groups, based on the 2010 population census data and some sociological-anthropological studies
DATA
Tabulation Provided by BPS – Statistics Indonesia based on raw, complete, data set of the 2010 Indonesia’s Population Census
A very large data set from a very large area.

Province: Kepulauan Riau
There are about 1,499 islands (Podes
2014) and inhabited by 338 ethnic
categories (2010 PC)
Kepulauan
Natuna
Kepulauan
Anambas
Pulau BintanBatam
Pulau Lingga
Pulau Singkep
Karimun

Batam City:There are about 354 islands
(Podes 2014), and inhabited
by 311 ethnic categories
(2010 PC)

MEASUREMENT OF ETHNIC DIVERSITY
Percentage of the Largest Votes
Ethnic Fragmentation Index (EFI)
Ethnic Polarization Index (EPOI)
Geographical Mapping

PERCENTAGE OF THE LARGEST ETHNIC GROUP
The Larger (lower) the Percentage,
the More Homogeneous (Heterogeneous) is a Region
(province, city, or regency)
Homogeneous: >= 95%
Almost homogeneous: 80% – 94%
Less homogeneous: 60%-79%
Less heterogeneous: 40%-59%
Almost heterogeneous: 20%-39%
Heterogeneous: < 20%

ETHNIC FRACTIONALIZATION INDEX (EFI)
Between 0 and 1
The Higher the Index,
the More Ethnically Fractionalized is a Region
(province, city, or regency)
𝐸𝐹𝐼𝑗 = 1 −
𝑖=1
𝑁
𝑠𝑖𝑗2
Si is the percentage of ethnic group i (1… N)
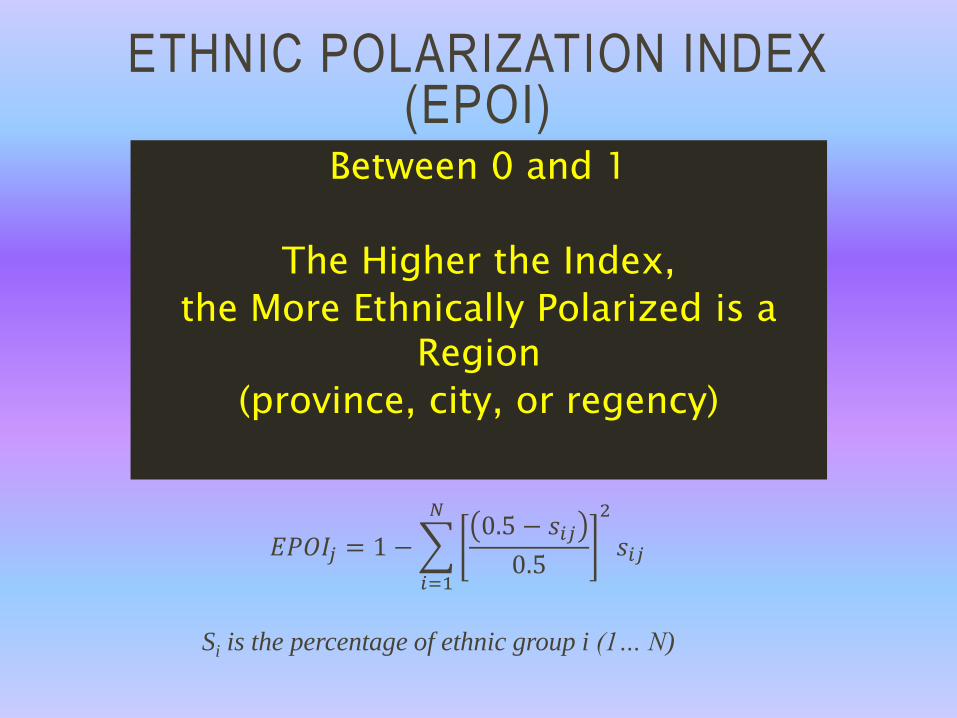
ETHNIC POLARIZATION INDEX (EPOI)
Between 0 and 1
The Higher the Index,
the More Ethnically Polarized is a Region
(province, city, or regency)
𝐸𝑃𝑂𝐼𝑗 = 1 −
𝑖=1
𝑁0.5 − 𝑠𝑖𝑗
0.5
2
𝑠𝑖𝑗
Si is the percentage of ethnic group i (1… N)

ETHNIC DIVERSITY AT
NATIONAL LEVEL
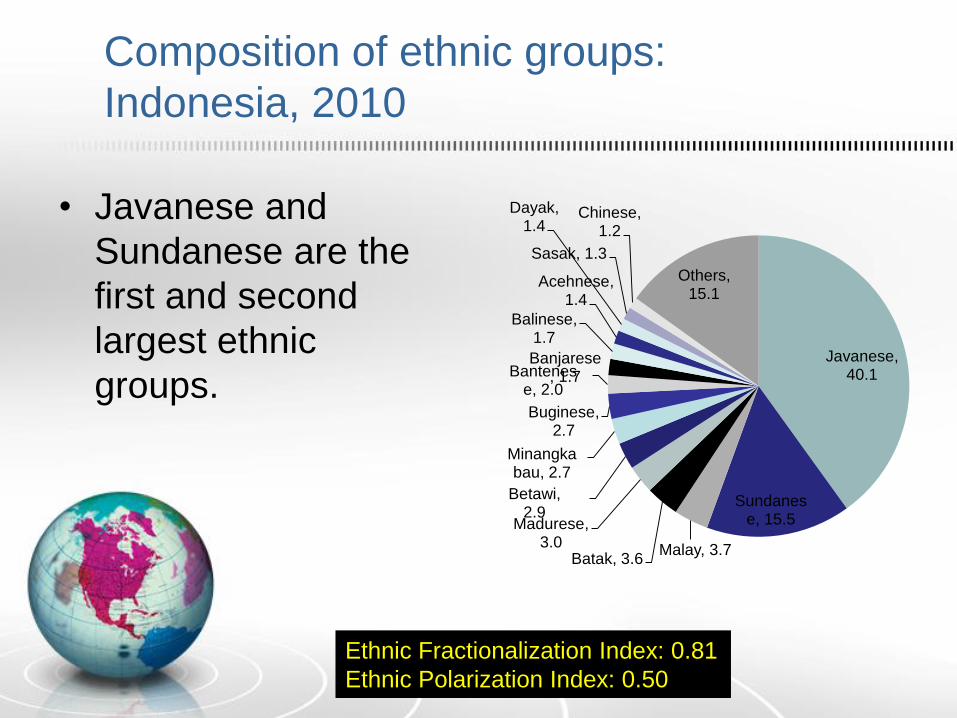
Composition of ethnic groups:
Indonesia, 2010
Javanese, 40.1
Sundanese, 15.5
Malay, 3.7Batak, 3.6
Madurese, 3.0
Betawi, 2.9
Minangkabau, 2.7
Buginese, 2.7
Bantenese, 2.0
Banjarese, 1.7
Balinese, 1.7
Acehnese, 1.4
Dayak, 1.4
Sasak, 1.3
Chinese, 1.2
Others, 15.1
• Javanese and
Sundanese are the
first and second
largest ethnic
groups.
Ethnic Fractionalization Index: 0.81
Ethnic Polarization Index: 0.50

Javanese
Sundanese
Dayak
Provinces of Ethnic Origins

ETHNIC DIVERSITY AT
PROVINCIAL AND DISTRICT LEVELS
Javanese
Javanese
Sundanese
Dayak
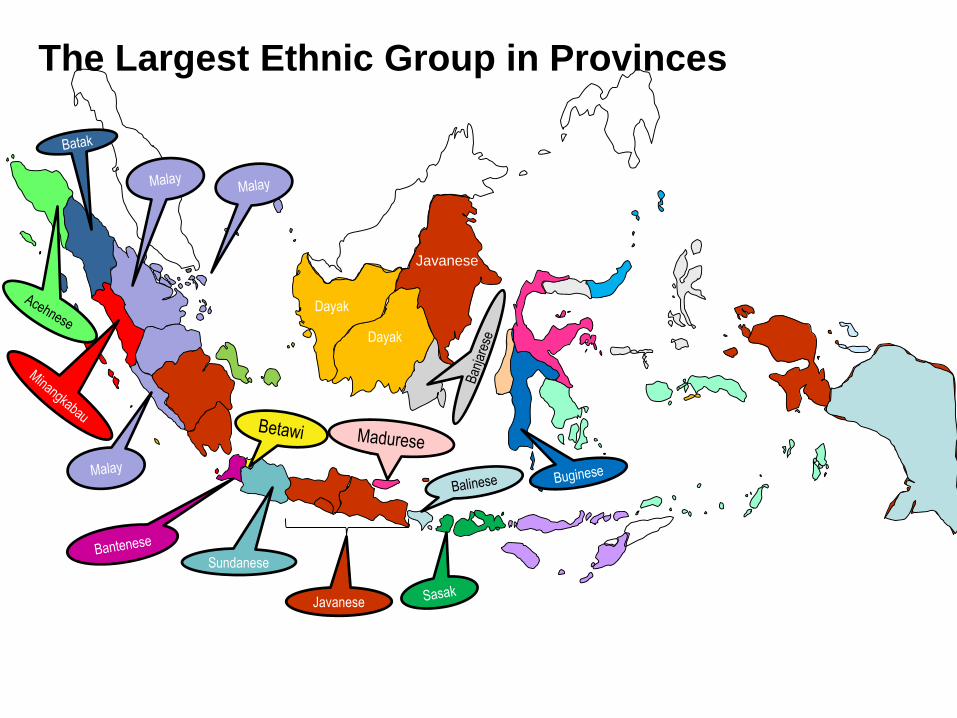
The Largest Ethnic Group in Provinces
Dayak
Percentage of the Largest
Ethnic Group
Homogeneity - Heterogeneity
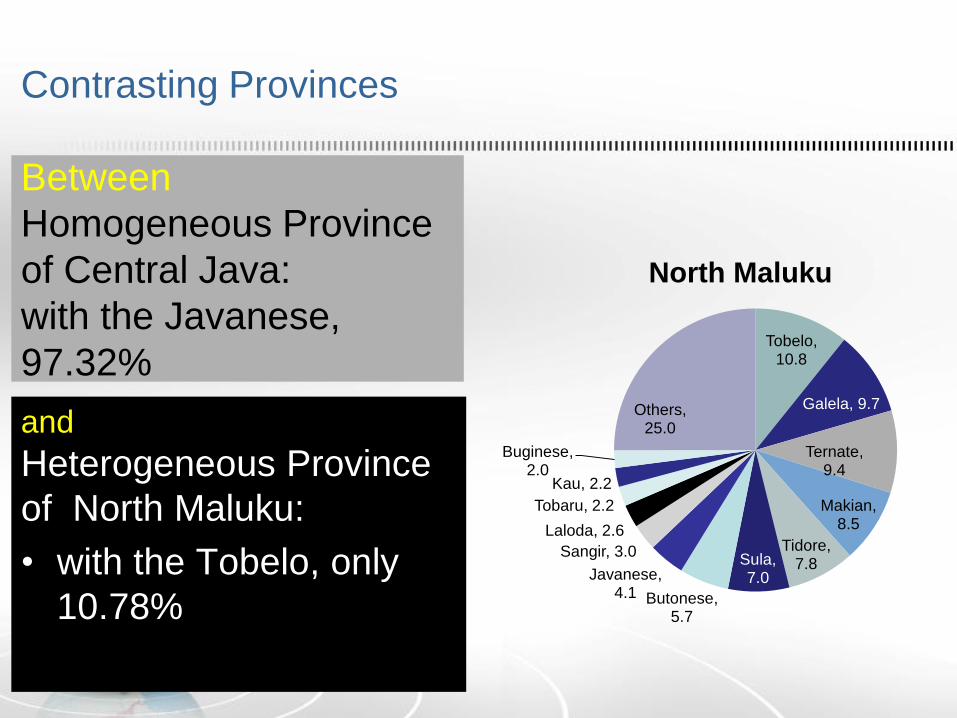
Contrasting Provinces
Between
Homogeneous Province
of Central Java:
with the Javanese,
97.32%
and
Heterogeneous Province
of North Maluku:
• with the Tobelo, only
10.78%
Tobelo, 10.8
Galela, 9.7
Ternate, 9.4
Makian, 8.5
Tidore, 7.8Sula,
7.0
Butonese, 5.7
Javanese, 4.1
Sangir, 3.0
Laloda, 2.6
Tobaru, 2.2
Kau, 2.2
Buginese, 2.0
Others, 25.0
North Maluku

Largest Percentage
Grobogan is
The most homogeneous
and
Mimika is
the most heterogenous
119
106
8793
83
9
0
20
40
60
80
100
120
140
Distribution of Districts by the share of its largest ethnic group
A Wide Interval of the Largest Ethnic Group:
From 12.9% (Mimika, Papua) to 99.7%
(Grobogan, Central Java)
Ethnic Diversity among
497 Districts

The most homogeneous district: Regency of Grobogan
Grobogan is located in the most homogeneous Province of Central Java,
where almost all districts are predominantly Javanese
Exclusively Javanese
(99.72%)Central Java

Homogenous Districts:
The Javanese mostly accounted for
the largest ethnic group
District Province Largest Ethnic Group
West Nias North Sumatra Nias (99.6%)
Pidie Jaya Aceh Acehnese (99.3%)
Solok West Sumatra Minangkabau (98.7%)
Garut West Java Sundanese (99.1%)
Soppeng Sulawesi Buginese(98.8%)
Southwest Sumba West Nusa Tenggara Humba (98.8%)
Some Non-Javanese Homogeneous Regencies:

The most heterogeneous district:
Regency of Mimika
The Regency of Mimika is
located in the Province of
Papua, one of the
heterogeneous provinces,
with Dani as the largest ethnic
group (23.32%)
The Mimika accounted for
12.95%, living with the
ethnic migrants:
Javanese (12.85%);
Buginese (10.71%)

Only 9 Most Heterogeneous Districts:
all are in Eastern Indonesia
Regency/City Province Largest Ethnic Group %
1 Central Maluku Maluku Ambon 19.42
2 City of Jayapura Papua Javanese 19.17
3 Reg of Jayapura Papua Sentani 18.15
4 West Halmahera Maluku Tobaru 17.80
5 Morowali Central Sulawesi Buginese 17.73
6 Kaimana West Papua Irahutu/Irarutu 15.50
7 Sarmi Papua Biga/Sobei 14.56
8 City of Sorong West Papua Javanese 13.79
9 MimikaPapua
Mimika/Nefarpi/Kamoro/
Lakahia/Mukamuga 12.95
The Largest Ethnic Groups are not Always Local Groups
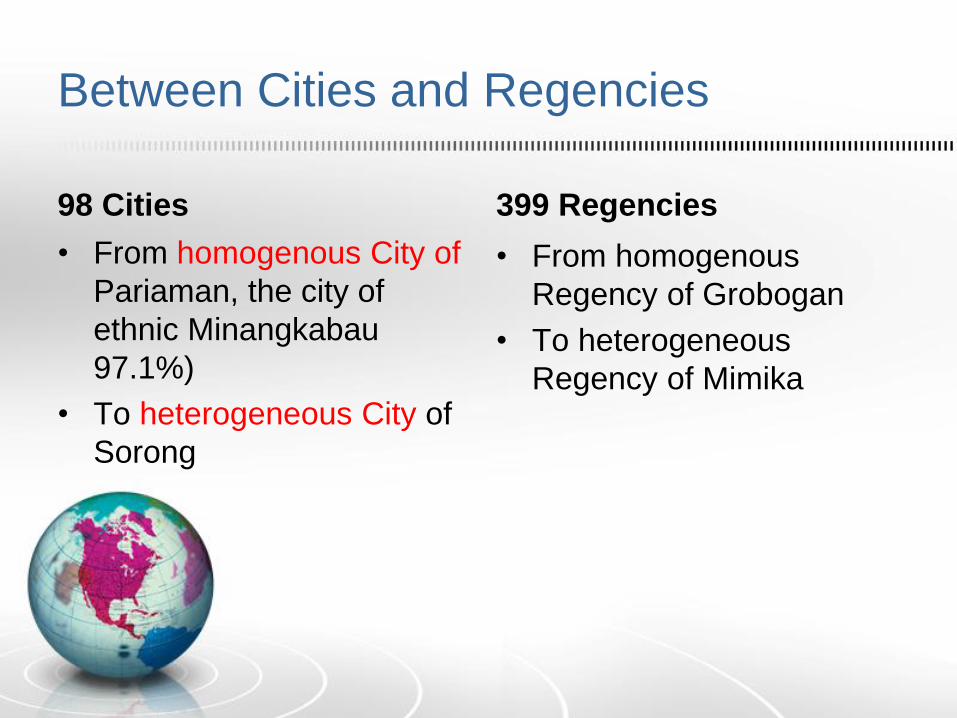
Between Cities and Regencies
98 Cities
• From homogenous City of
Pariaman, the city of
ethnic Minangkabau
97.1%)
• To heterogeneous City of
Sorong
399 Regencies
• From homogenous
Regency of Grobogan
• To heterogeneous
Regency of Mimika

The Largest Ethnic Group by District:
Indonesia, 2010
Origin means the first ethnic group is a local
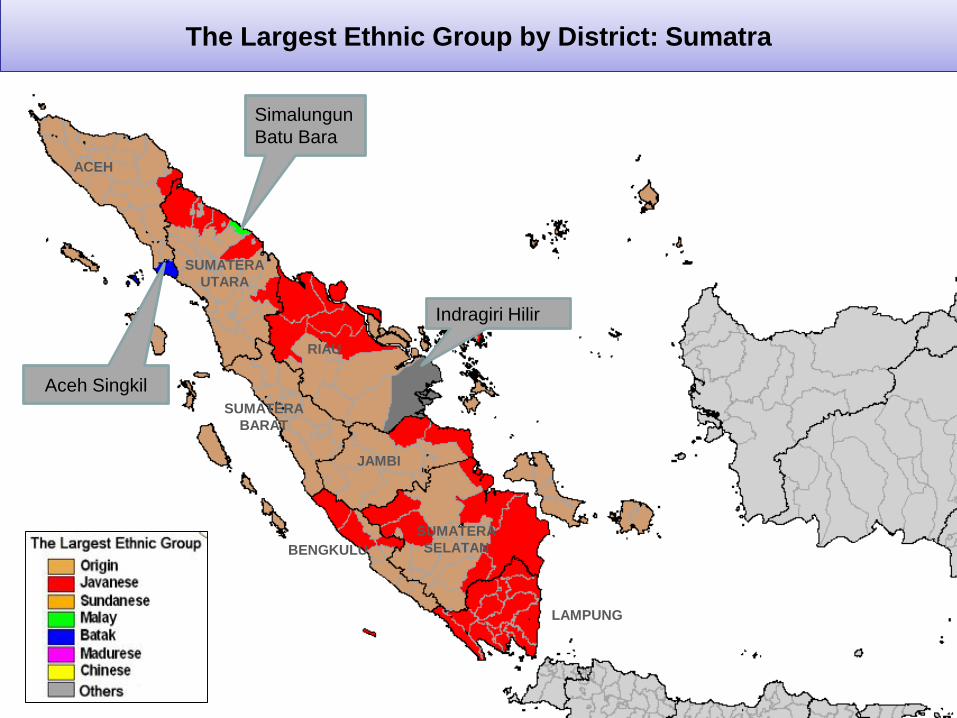
The Largest Ethnic Group by District: Sumatra
Aceh Singkil
Simalungun
Batu Bara
Indragiri Hilir
ACEH
SUMATERA
UTARA
RIAU
SUMATERA
BARAT
JAMBI
SUMATERA
SELATANBENGKULU
LAMPUNG

The Largest Ethnic Group by District: Java
Depok
Kota Bekasi
Kab BekasiIndramayu
Kab Tangerang
Kota
Tangerang
Jakarta Utara
Jakarta Barat
Bondowoso
SitubondoBANTEN JAWA BARAT
JAWA TENGAH
DIY
JAWA TIMUR
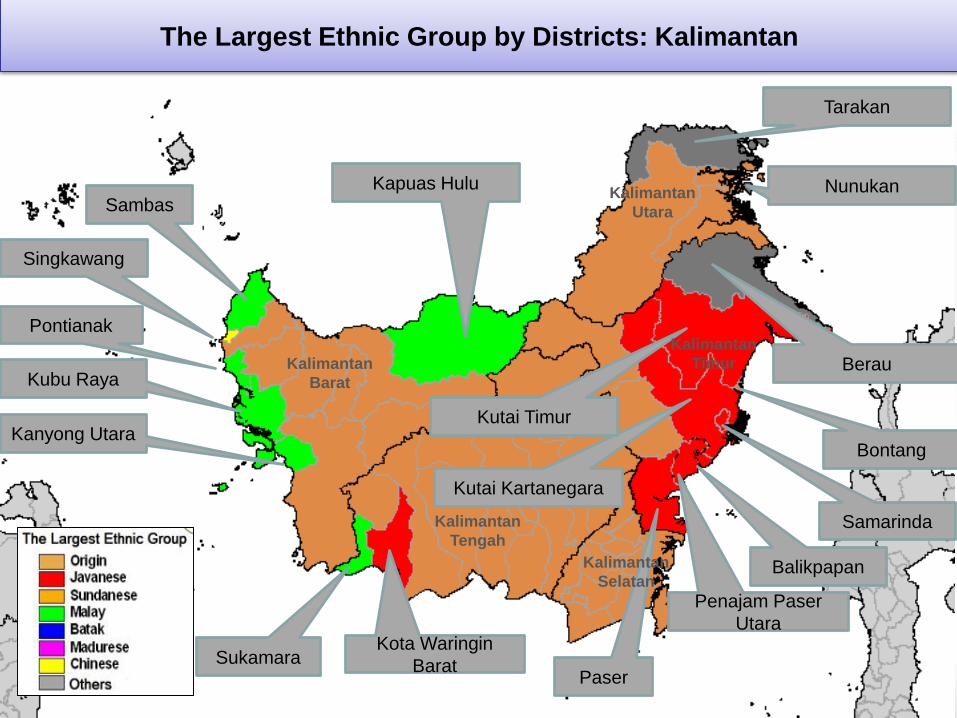
Sambas
Singkawang
Pontianak
Kubu Raya
Kanyong Utara
SukamaraKota Waringin
BaratPaser
Penajam Paser
Utara
Balikpapan
Samarinda
Bontang
Kutai Kartanegara
Kutai Timur
Berau
Tarakan
NunukanKapuas Hulu
Kalimantan
Barat
Kalimantan
Tengah
Kalimantan
Selatan
Kalimantan
Timur
Kalimantan
Utara
The Largest Ethnic Group by Districts: Kalimantan
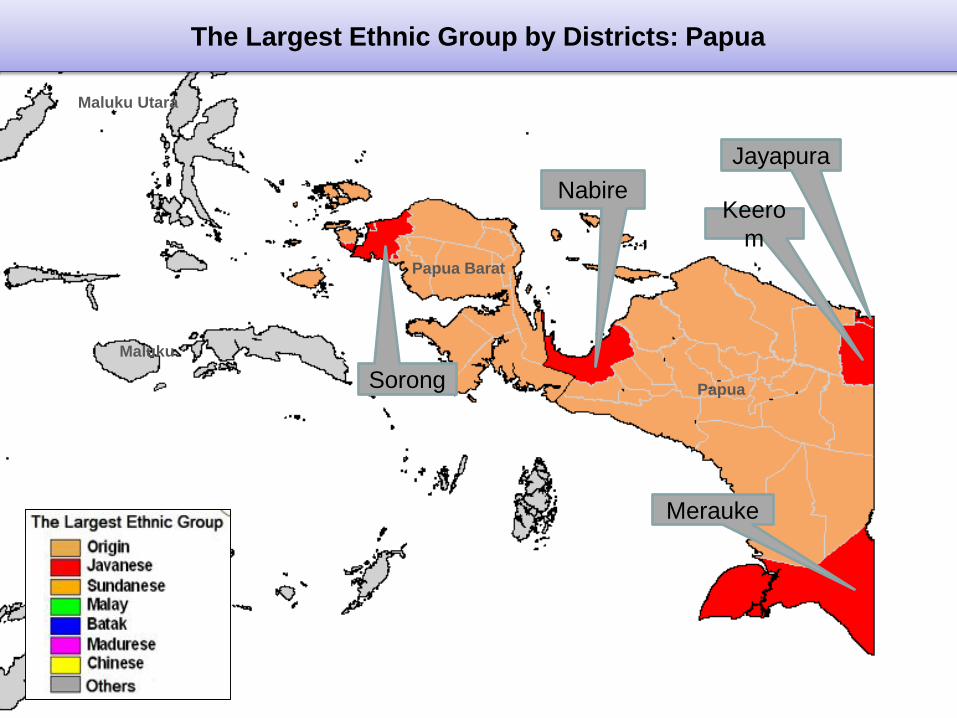
Merauke
Keero
m
Jayapura
Nabire
Sorong
Maluku
Maluku Utara
Papua Barat
Papua
The Largest Ethnic Group by Districts: Papua

497 districts in 2010• There are 102 ethnic groups as the
largest groups at district level
52 ethnic groups (including
Chinese) account for the
largest group in ONE district
only.
Chinese is the largest group in
Singkawang (36.5%), Province
of West Kalimantan.
Other 50 ethnic groups are the
largest ones in more than one
district.
Districts
No Ethnic Group Number %
1 Javanese 132 26.56
2 Malay 34 6.84
3 Buginese 22 4.43
4 Dayak 22 4.43
5 Batak 21 4.23
6 Sundanese 21 4.23
7 Minangkabau 19 3.82
8 Acehnese 15 3.02
9 Banjarese 15 3.02
10 Balinese 9 1.81
11 Gorontalo 7 1.41
12 Dani/Ndani/Lani 6 1.21
13 Madurese 6 1.21
14 Minahasa 6 1.21
15 Bangka 5 1.01
16 Bantenese 5 1.01
17 Betawi 5 1.01
18 Buton/Walio 5 1.01
19 Makassarese 5 1.01
20 Nias 5 1.01
21 Sasak 5 1.01

Ethnic Fractionalization Index
Indonesia EFI = 0.81
Between the least fractionalized Central Java and
the most fractionalized West Papua

EFI among Provinces(between Central Java and West Papua)
0.95
0.68
0.04
0 0.2 0.4 0.6 0.8 1
West PapuaNorth Maluku
MalukuCentral Sulawesi
PapuaEast Nusa Tenggara
South SumatraSoutheast Sulawesi
East KalimantanRiau Archipelago
BengkuluRiau
JakartaWest Sulawesi
JambiBanten
West KalimantanNorth SulawesiSouth Sulawesi
Central KalimantanNorth Sumatra
Bangka BelitungLampung
West Nusa TenggaraAceh
West JavaSouth Kalimantan
East JavaBali
West SumatraGorontalo
YogyakartaCentral Java
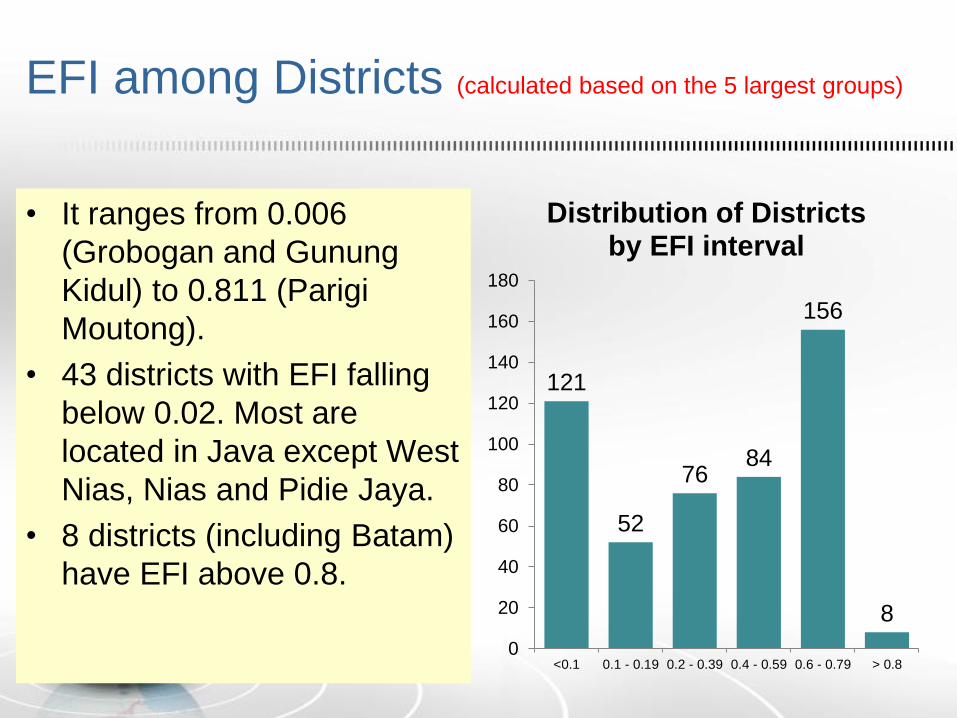
EFI among Districts (calculated based on the 5 largest groups)
• It ranges from 0.006
(Grobogan and Gunung
Kidul) to 0.811 (Parigi
Moutong).
• 43 districts with EFI falling
below 0.02. Most are
located in Java except West
Nias, Nias and Pidie Jaya.
• 8 districts (including Batam)
have EFI above 0.8.
121
52
7684
156
8
0
20
40
60
80
100
120
140
160
180
<0.1 0.1 - 0.19 0.2 - 0.39 0.4 - 0.59 0.6 - 0.79 > 0.8
Distribution of Districts by EFI interval

EFI interval (Cities vs Regencies)
• No different between cities
and regencies
• Thus, there are ethnically
fractionalized cities and
regencies, as well as
ethnically homogenous
cities and regencies
0.06
0.81
0.01
0.81
0.0
0.1
0.2
0.3
0.4
0.5
0.6
0.7
0.8
0.9Cities Regencies
Ethnic Polarization IndexEPOI Indonesia = 0.50
Between the least polarized Yogyakarta and Central
Java on one hand
and the most polarized North Sumatra on the other

EPOI (between Central Java and North Sumatra)
0.780.76
0.09
0 0.2 0.4 0.6 0.8 1
North SumatraCentral Kalimantan
South SulawesiWest Kalimantan
LampungBantenJambi
West Nusa TenggaraBangka BelitungNorth Sulawesi
RiauJakarta
West JavaSouth Kalimantan
AcehEast JavaBengkulu
West SulawesiRiau Archipelago
Southeast SulawesiEast Kalimantan
South SumatraBali
West SumatraEast Nusa Tenggara
GorontaloCentral Sulawesi
PapuaMaluku
North MalukuWest PapuaYogyakarta
Central Java

The Most Polarized Provinces: North Sumatra and West Kalimantan
• North Sumatra (EPOI=0.78)
• Polarised between Batak
(44.75%) and Javanese (33.40%)
• The percentages of Batak and
Javanese are close to each other.
• Central Kalimantan (EPOI=0.76)
• Polarised between Dayak (46.6%)
and Javanese (21.7%)

EPOI among districts (calculated based on the 5 largest groups)
• It ranges from 0.011
(Grobogan) to 0.969
(Simalungun)
• More than 50% of the districts
have EPOI above 0.6 with 40
districts have EPOI above 0.8.
These 40 districts are located
in outside Java, except one
(Jember). 82
4556 54
220
40
0
50
100
150
200
250
<0.1 0.1 - 0.19 0.2 - 0.39 0.4 - 0.59 0.6 - 0.79 > 0.8
Distribution of Districts by EPOI interval

Polarized Districts
Jember (EPOI=0.937)
• Polarised between
Javanese (61.4%) and
Madurese (37.7%)
Simalungun (EPOI=0.969).
• Polarised between Batak
(51.9%) and Javanese,
migrant ethnic group,
(45.3%)
South Labuhan Batu
(EPOI=0.952).
• Polarised between
Javanese (49.2%) and
Batak (45.9%)
Maros (EPOI=0.930)
• Polarised between
Buginese (55.1%) and
Makassaese (39.8%)

EPOI interval
• EPOI in regencies has a
wider range than that in
cities.
• Thus, there are some
regencies with more
polarized ethnically and
some with less polarized.
0.11
0.87
0.01
0.97
0.0
0.2
0.4
0.6
0.8
1.0
Cities
Regencies

Provincial and District Distribution of 5
Largest Ethnic Group and Chinese in
Indonesia
Javanese, Sundanese, Malay, Batak, Madurese,
and Chinese
Javanese
The Largest Ethnic Group in Indonesia

Javanese: a ubiquitous ethnic group
• It’s the largest group in 132 districts
• 53 of them are located in outside Java:
• 2 districts in West Papua (Reg of Sorong, City of Sorong)
• 4 districts in Papua (Merauke, Nabire, Keerom, Jayapura)
• 1 district in West Kalimantan (West Kotawaringin)
• 7 districts in East Kalimantan
• 39 districts in provinces of Sumatra
• None in Sulawesi, Bali, Nusa Tenggara, and Maluku

The Percentage of Javanese in Each District

Sundanese
• the second largest ethnic group in Indonesia

The Percentage of Sundanese in Each District

LAHA T
KE BUM EN
BA TA NG
PE MA LANG
PURW ORE JO
WONOS OB O
LAM PUN G UTARA
LAM PUN G BA RAT
TA NGGAM US
PE SA WA RA N
LAM PUN G TE NGAH
LAM PUN G SE LATA N
LAM PUN G SE LATA N
SE RANGTA NGER ANG
BE KA SIKA RAW AN G
SUB ANG
BOGOR
SUK AB UMI
CIAN JUR
GA RUT
BA NDUNG
BA NDUNG B ARA T
PURW A KA RTA
SUM EDA NG
MAJA LEN GK A
KUNINGAN
MAJA LEN GK A
TA SIKM ALA YA
CIAM IS
CILA CAP
BRE BE S
CIRE BONLEB AK
DISTRICT WITH HIGH PERCENTAGE OF SUNDANESE IN SUMATERA AND JAVA
Malay
• The third largest group in Indonesia

The Percentage of Malay in Each District

LANGKAT
BATU BARA
ROKAN HILIR
DUMAI
BENGKALIS
ROKAN HULU
SIAK
KAMPAR
KUANTAN SINGINGIPELALAWAN
INDRAGIRI HULU
TEBOBUNGO
MERANGIN
SAROLANGUN
KEPULAUAN MERANTI
KARIMUNBATAM
BINTAN
TANJUNG JABUNG B
TANJUNG JABUNG T
BATANG HARI MUARO JAMBI BANYU ASIN
OGAN KOMERING ILIR
SELUMA
OGAN KOMERING ULU SELATAN
BENGKULU SELATAN
LAHAT
EMPAT LAWANG
LAHAT
MUARA ENIM
DISTRICT WITH HIGH PERCENTAGE OF MALAY IN SUMATERA

Batak
• The fourth largest ethnic group in Indonesia

batakThe Percentage of Batak in Each District

DISTRICT WITH HIGH PERCENTAGE OF BATAK IN NORTH SUMATERA

Madurese
• The fifth largest ethnic group in Indonesia
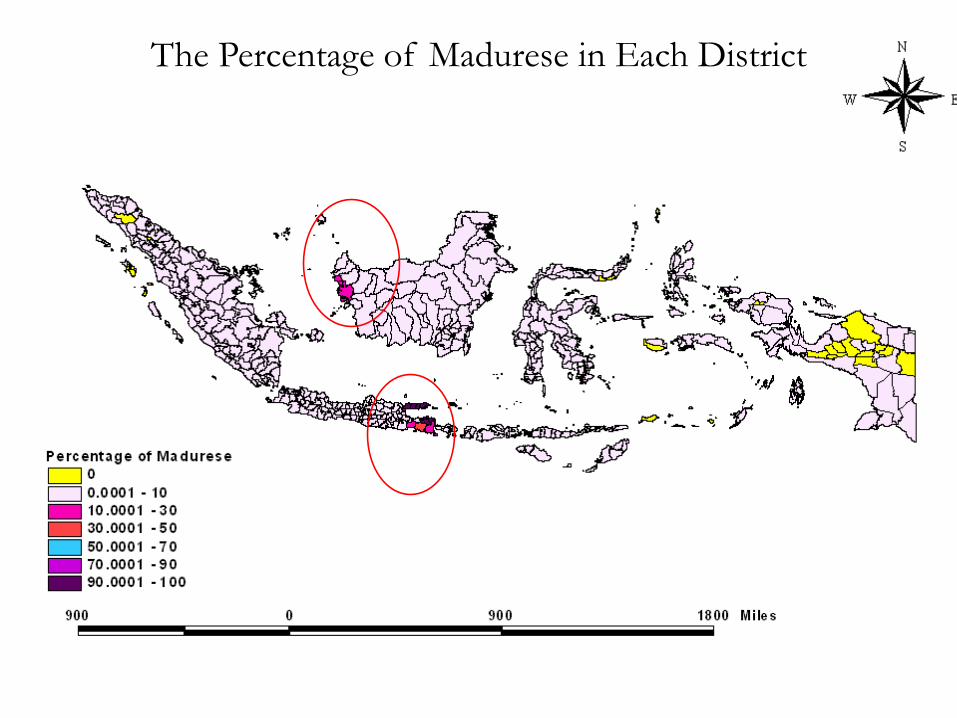
maduraThe Percentage of Madurese in Each District

DISTRICT WITH HIGH PERCENTAGE OF MADURA IN KALIMANTAN
AND JAVA (2)
Chinese
The Fifteenth Largest Ethnic Group in Indonesia

maduraThe Percentage of Chinese in Each District

DISTRICT WITH HIGH PERCENTAGE OF CHINESE IN SUMATERA AND
KALIMANTAN

DISTRICT WITH HIGH PERCENTAGE OF CHINESE IN JAKARTA, WEST
JAVA and BANTEN PROVINCES

CONCLUDING REMARKS
FIRST STATISTICS ON INDONESIA’S ETHNIC DIVERSITY
• This is the first-ever produced statistics on Indonesia’s ethnic diversity at national, provincial, and district levels based on complete data of population census and the “New Classification” of ethnic groups
• This is also the first time released to the public.

ETHNICALLY DIVERSE, BUT LESS POLARIZED INDONESIA
• Indonesia as a whole has a relatively high ethnic fractionalization index, at 0.81, meaning that there is a great number of different ethnic groups in Indonesia.
• However, Indonesia is not highly polarized, with the ethnic polarization index at only 0.50, as there is no two almost same-sized ethnic groups.
•The Javanese contributed 40.06%,
• The second largest ethnic group, Sundanese, contributed only 15.51 %

DIFFERENT PICTURES AT PROVINCIAL LEVEL
• Most homogeneous Province of Central Java, where more than 95% of the population is Javanese. The least fractionalized province at the very low level of EFI, at 0.01. Also the least polarized one at the very low level of EPOI, a 0.01
•Most heterogeneous Province of North Maluku, with the Tobelo, as the largest ethnic group, contributing only 10.78%. North Maluku is highly fractionalized, at 0.94 but not polarized at 0.21.
MUCH LARGER VARIATIONS AT DISTRICT LEVEL (1)
• Most of the homogeneous and the least fractionalized districts were located in the Island of Java, especially in the three home provinces of the Javanese. They were also the least polarized districts.
• Exceptions were Regencies of West Nias in North Sumatra, Pidie Jaya in Aceh, Solok in West Sumatra, Garut in West Java, Soppeng in South Sulawesi, and North West Sumba in West Nusa Tenggara.

MUCH LARGER VARIATIONS AT DISTRICT LEVEL (2)
•Most of the fractionalized, less polarized districts were in the Eastern Indonesia, especially the Islands of Maluku and the Island of Papua.
•Few districts were highly polarized, such as Simalungun in North Sumatra, between the Javanese and Batak, and Maros in South Sulawesi between Makassarese and Buginese.
WHICH INDONESIA?
• It is difficult to say “Indonesia”
• Indonesia is a giant archipelagic country, with so many different ethnic groups and administrative units, especially the more than 500 districts
•Each region (province, city, and regency) has its own ethnic characteristics

Indonesia is a multi ethnic country with
high degree of fragmentation but less
polarization

Thank You
Welcome to the
Indonesia’s
Diversity