contributions in heterogeneous communities: evidence from ... · indonesia’s national motto,...
TRANSCRIPT

Contributions in Heterogeneous Communities: Evidence from Indonesia
Cagla Okten Department of Economics
Louisiana State University Baton Rouge, LA 70803-6306
Una Okonkwo Osili Department of Economics Indiana University-Purdue University at Indianapolis 425 University Blvd Indianapolis, IN 46202
[email protected] Corresponding authot, Department of Economics, IUPUI, 425 University Boulevard, Indianapolis, IN 46202, U.S.A. Phone: (317) 274-4755, Fax: (317) 274-0097, Email: [email protected] The authors would like to thank RAND and Lembaga Demografi of the University of Indonesia for making the data available. We would also like to thank Victoria Beard and Chris Peterson at RAND for their assistance. We have also benefited greatly from discussions with Partha Deb, Kevin Hasker, Kay Ikranagara, Ifeanyi Osili, Richard Steinberg, Mark Wilhelm, and seminar participants at IUPUI, the 2000 NEUDC conference, RAND and LSU. Yi Wang, Yang Wang and Ara Stepian provided valuable research assistance. Financial support from the Indiana University Center on Philanthropy is grateful acknowledged.
Abstract
This paper investigates the determinants, including ethnic diversity and central governmenttransfers of monetary and time contributions to community organizations using household-level data from Indonesia. Community organizations in developing countries can play acentral role in providing public goods and services, redistributing income and organizingeconomic production among its members where formal markets are not well developed. Wepresent a framework in which ethnic diversity affects contributions through three channels:(1) diversity of preferences (2) transaction costs, and (3) interhousehold preferences in theform of altruism towards one’s ethnic group. Our empirical findings provide evidence thatethnic diversity has a negative and significant effect on contributions, and the prevalence ofcommunity organizations. In addition, households are more likely to contribute time when alarger share of their ethnic community receives benefits from the community organization.We find evidence that government spending crowds out private monetary contributions,with a less robust effect on time contributions.

1. Introduction
Community organizations can play a central role in the development process. Wheremarkets and states face limitations, community-based institutions provide public goodsand services, organize economic production, and income redistribution. Although there isa great deal of interest in the determinants of collective action in developing countries, verylittle is known about the transfer of resources to community-based institutions. In thispaper, we investigate monetary and time contributions to community organizations usinghousehold-level data from Indonesia.
This paper makes three important contributions: First, this study advances existingknowledge on private transfer flows to community organizations in developing countries.This remains a relatively understudied area within the private transfer literature. Muchof the existing work on income transfers in developing regions focuses on transfers amongfamily members (Ravallion and Dearden, 1988; Cox and Jimenez, 1992; 1990). However,community-level institutions are of considerable importance in consumption smoothing andrisk sharing in low-income environments (Alderman and Paxson, 1992).
Second, we investigate the effect of ethnic diversity on private transfers to communityorganizations. Many developing countries are composed of diverse ethnic, cultural andreligious groups. With the trend towards a greater reliance on local institutions and sub-national governments to provide local goods and services, the challenge remains to betterunderstand how ethnic diversity and other forms of heterogeneity affect contribution pat-terns. This paper joins a growing number of studies that examine the link between ethnicdiversity and economic outcomes (Alesina, Baqir and Easterly, 1999; Alesina and LaFerrara;Collier, 2000; Easterly and Levine, 1997; Miguel, 2000). In addition, we explore a relatedquestion: How does ethnic diversity affect the prevalence of community organizations?
Finally, the results from this study can inform broad debates on the effect of governmentexpenditure on private transfers to community-level institutions. Do government transferscrowd out private contributions? The developing country setting used in this paper offersa unique opportunity to revisit this question in an environment where public transfers tendto be limited in scope, and where few tax-related incentives for transfer behavior exist.Previous studies rely on data obtained mainly from developed countries (See Clotfelter,1985; Kingma, 1989; Rose Ackerman, 1996; Weisbrod, 1988). There is very limited evidenceon the relationship between government transfers and private resource flows in developingcountries.1
Why do households contribute to community organizations? Economic theory providesa framework for understanding transfer patterns at the community level. The existingliterature emphasizes two classes of models that can explain contributions of money andtime: altruism and exchange. With altruism, households care about other members of thecommunity. Under exchange, households transfer resources because they benefit directlyfrom their contributions, and enjoy the goods and services produced by community organi-zations. Actual motivations for giving may be quite complex. For example, “warm glow”
1To our knowledge, this is the first study to examine crowding out issues for transfers to community orga-nizations in a developing country context using household-level data. Wong et. al (1998) use organization-level data from Singapore to study transfers to community organizations. The authors find some evidencethat government transfers crowd out private contributions.
2

motives (Andreoni, 1989, 1990), civic pride and the desire to enhance one’s standing withinthe community (Glazer and Konrad, 1996) may also affect the household’s decision to giveto a community organization.
Within altruism and exchange-based models, community-level variables can influencethe household’s transfer decision. We develop a model in which ethnic diversity can affectcontributions to community organizations through three channels. The first channel canbe summarized as the “diverse preferences” argument (Alesina et al, 1999). It may bedifficult to define objectives towards the financing of local public goods where the communitymembers have diverse preferences due to ethnic diversity, and other forms of heterogeneity.Second, ethnic diversity may increase the transaction costs of community-level production.If trust, social sanctions and reciprocity norms are cultivated at the group level, these areless likely to be effective in diverse environments. Ethnic diversity may also be relatedto the absence of social cohesion, and in some extreme cases, civil violence, which makesit difficult to organize contributions at the community-level. Finally, ethnic diversity canaffect contributions if households belonging to the same ethnic community are altruistically-linked (Becker, 1981; Grimard, 1997; Luttmer, 2001).
Our model explores how ethnic diversity can have a negative impact on contributions.It is important to recognize that heterogeneity at the community level may also be positivelyassociated with contributions. Within ethnically diverse settings, community organizationsprovide public goods when governments and markets fail to satisfy the heterogenous needsof consumers. Weisbrod (1988) advances this view as a dominant explanation for differencesin the size of the nonprofit sector across countries.2
The main empirical findings from Indonesia provide support for an exchange-basedmodel of community transfers. Households transfer resources in a manner that reflectsthe benefits they receive from the community organization. The results suggest thatcommunity-specific variables are of considerable importance. We find that ethnic diversityhas negative effect on both monetary and time contributions, as well as on the prevalence ofcommunity-based organizations. In addition, the data allow us to explore potential mecha-nisms through which ethnic diversity influences contributions. For monetary contributions,diverse preferences and transaction costs emerge as important explanations for the negativeeffect of ethnic diversity. However, results on time contributions are consistent with inter-household preferences. Households are more likely to contribute time when a larger shareof their ethnic community receives benefits from the community organization. Results ongovernment spending yield important insights. Government transfers appears to crowd-outprivate monetary contributions, with less convincing evidence on time contributions.
Indonesia provides a rich setting in which to explore transfers to community organiza-tions. Many of the communities in this data set have developed important traditions ofcommunity participation. In addition, Indonesia’s population of close to 200 million ex-hibits tremendous cultural and ethnic diversity. There are relevant lessons for other large
2 In 1982, private contributions to the non-profit sector were ten times higher in the United States thanin Japan. These differences cannot be explained by per capita income differentials. Instead, it is likely thatthe nonprofit sector in the United States plays an important role in satisfying demand for collective goods,which the government may not be able to provide within heterogeneous environments. Diverse preferenceslead to a wide range of opinions on what type of public goods to provide, and within democratic systems ofgovernment, the supply of public goods reflect the preferences of the median voter only. Weisbrod (1988:27)
3
countries with diverse ethnic and cultural groups, including the United States, Russia, Indiaand Nigeria.
The rest of the paper is organized as follows: Section 2 provides a description of thesetting. In Sections 3 and 4, we present the theoretical model and its implications. Section5 discusses the data sources. Section 6 outlines the empirical framework. In Sections 7 and8, we present the results and conclusions.
2. The Setting: Community Organizations in Indonesia
Indonesia’s national motto, “Unity in Diversity” makes reference to its heterogeneous lin-guistic and ethnic composition. The country’s official language is Bahasa Indonesia. How-ever, more than 668 other languages and dialects are also spoken. The major languagesspoken often belong to distinct ethnic groups. These languages include Javanese (45 per-cent of the population), Sudanese (14 percent), Madurese (7.5 percent), coastal Malays(7.5 percent), others (26 percent). In addition, about 2 million inhabitants also speak sev-eral Chinese dialects. An independent country, since August 17th 1945, Indonesia’s ethnicgroups inhabit diverse ecological environments. The country is made up of over 13,000islands, ranging in size, population density and resource endowments.
An early observer notes the importance of ethnicity in the Indonesian context: “Re-gardless of the political settlement effected in Indonesia in the near future, the social andethnic differences of its population will continue to constitute a major problem in the po-litical and economic development of the area” (Van Der Kroef, 1950:450). Until recently,rates of regional migration in Indonesia were relatively low (Hugo, 1982). Geographicalbarriers make transportation between regions very difficult. In addition, land markets arenot well-developed in many areas. Since the early 1990s, however, there has been a risingtrend in mobility.3 Investments in road networks and other transport infrastructure haveimproved the ease of movement across regions. Consequently, ethnic groups with distinctlanguages, customs and traditions (adat) have moved towards greater economic and socialinteraction.
The scope of government involvement in communities has also grown since independence.The “Oil Boom” of the 1970’s induced large increases in central government revenue. Un-der the INPRES Desa (Village Development Program), the central government transferredover 20 percent of its development budget to communities for the construction of schools,health clinics, roads, irrigation and public works. Official government literature duringthis period emphasizes gotong royong, or community participation as a central part of a na-tional development strategy (Bowen, 1986). Communities, in turn, were expected to providevolunteer labor, building materials and money for use with central government transfers.
One controversial aspect of government policy during this period was the promotion ofa uniform system of community organization. This system allows us to study patterns ofcontributions because organizations are comparable across regions. In our data, householdsmay contribute time, money or materials to an irrigation association (subuk), a neighbor-hood security arrangement, rice co-operatives and neighborhood health posts (posyandu)
3The government has also been involved in relocating families through its Transmigration Program fromthe highly populated islands of Java, Bali, and Madura to less populated islands. Between 1969 to 1989,some 730,000 families were relocated under the Transmigration program.
4

- all these groups can be classified as community-level organizations. A notable example,posyandu relies on salaried government staff and volunteer workers to deliver key healthservices to the community (Frankenberg and Thomas, 2001).
It is also important to note that there is tremendous variation in the effectiveness andfunctioning of organizations across communities. One explanation for this variation is thatdifferent ethnic groups have evolved various systems of organizing community life. Bowen(1986) and Warren (1993) argue that historical traditions of community organization amongvarious ethnic groups in Indonesia affect time and monetary contributions towards theprovision of community-level services. In addition, household variables, the distribution ofbenefits across social and economic groups, and the quality of community leadership emergeas important factors that affect contributions.
3. Model
In this section, we model the household’s decision to contribute to a community orga-nization. The model has three main features: First, it allows both self-interested andinter-household preferences to affect the household’s contribution decision. Second, it pro-vides a framework to analyze the impact of diversity on contributions. Third, it enablesus to investigate the effects of government involvement on private contributions, at thecommunity-level.
Consider a household i that makes a transfer, ti to a community organization. Weassume that there are N households in the village, such that i ∈ {1, ...,N}. Communityorganizations provide services that can be enjoyed by all households.4 The services receivedby household i are modelled as a local public good.
The utility to household i, Ui is given by
Ui = UiS + UiA (3.1)
where UiS is the utility from self-interest and UiA is the utility from altruism towards others.The utility of household i from self interest is given by
UiS = Sα (1− li) + cβi (3.2)
where S denotes the amount of services obtained from the community organization, li is thepreference distance between household i0s most desired type of services and actual servicesreceived, and ci is private consumption. We assume that utility is concave in services,and in the consumption good such that α,β ∈ (0, 1) .5 The framework for the diversity ofpreferences here draws upon the model presented in Alesina et. al (1999).
Household i may also care about the utility of others. Such interpersonal effects canmanifest themselves as altruism, including the utility of others in the household’s objectivefunction. The utility of household i from altruism is given by
UiA =Xj 6=iwij (Xi,Xj)UjS (3.3)
4Neighborhood security, neighborhood improvement are examples of such services. Community organi-zations may also provide excludable services such as health care and access to credit.
5 In addition, we assume that income of the median voter is not too large so that at equilibrium, she willnot be the sole contributor towards the public good.
5

where wij (Xi, Xj) ≥ 0 denotes the weight that household i places on the utility (fromself-interest) of household j and UjS is household j
0s utility from self-interest.The consumption of the private good, ci is equal to income, yi less transfers to the
community organization, ti:ci = yi − ti (3.4)
The timing is as follows: (1) Households make their contributions to the communityorganization, and (2) The community organization produces services.
We assume that the community organization produces the type of services that are mostpreferred by the median voter. This assumption is reasonable in our environment becauseleaders of community organizations decide on the type of services provided. Organizationleaders are selected by community members, and this selection process is likely to reflectthe median voter’s preferences.6
The services produced by the community organization depend on total amount of con-tributions in the community, government involvement, and costs of production. We modelthe production of services as follows:
S =
(f³PN
j=1 tj ,G´
if θ <PNj=1 tj
0 otherwise
)(3.5)
where tj denotes the contribution of household j to the organization, G denotes the levelof government involvement through monetary transfers and the provision of infrastructure,and θ represents the transaction costs of organization formation at the community-level. Weassume that services are increasing in the level of household contributions and governmenttransfers (f1 > 0, f2 > 0). In addition, the production function is assumed to be concavein household transfers.
The presence of transaction costs, θ in the production of community-level services allowus to explore the formation and continued existence of community organizations. Lowlevels of trust, the absence of a village co-operation, ethnic conflict and communicationdifficulties arising from ethno-linguistic diversity in a given community may impose hightransaction costs.
We now solve the model using backward induction. For any positive amount of services,S, the type of services produced by the community organization is determined by the medianvoter. Household i chooses its level of contributions based on this assumption and solvesthe following problem:
maxtiUi = S
α³1− bli´+ (yi − ti)β +X
j 6=iwij (Xi,Xj)
hSα³1− blj´+ (yj − tj)βi (3.6)
where bli is the distance of the household i from the ideal type of the median voter. Thehousehold’s first order condition with respect to ti is given byh
αSα−1f1³1− bli´− β (yi − ti)β−1
i+Xj 6=iwij (Xi, Xj)αS
α−1f1³1− blj´ = 0 (3.7)
6One potential criticism of this assumption is that “one person-one vote” rule may not apply wherecontributions are concerned. It is possible that households who contribute larger amounts may be moreinfluential in determining the types of services.
6
The first term between brackets reflects direct self-interest, while the second term reflectsinterpersonal effects.
4. Implications of the Model
4.1. The Effects of Ethnic Diversity on Giving
Ethnic diversity can affect contributions through the diversity of preferences, transactioncosts of organizing and interpersonal considerations, in the form of altruism towards one’sown ethnic community.
Diverse Preferences: Comparative statics of the household would imply
sign∂ti
∂bli = sign³−αSα−1f1
´(4.1)
Hence ∂ti∂bli < 0. A possible source for the polarization of preferences is ethnic (language)
composition of the community. As the ethnic diversity of the community increases, a largerfraction of people will have high bli. Thus, when the preferences are polarized, a largerfraction of people will find the type of services offered by the community organizationundesirable. This has a negative effect on the probability and level of the transfers to thecommunity organization.
Transaction Costs: With high transaction costs in a community, the formation ofcommunity-level organizations becomes more difficult. Community-level production dependson trust and communication among groups. Ethnically diverse communities may have lowlevels of trust and reciprocity norms, if these attributes are cultivated within ethnic groups.Furthermore, it may be more costly to produce services in the presence of communicationbarriers arising from ethno-linguistic diversity. High transaction costs will have a negativeeffect on the probability of giving and organization existence.
Interhousehold Preferences: The extent to which altruistic preferences lead to varia-tions in the level of support for community services depends on differences across householdsin the correlation between the weight that household i places on the utility of householdj and the marginal benefit of i0s contribution to j. In particular, support for communityservices and hence the level of contributions is higher among individuals for whom thiscorrelation is larger. Ethnic diversity may influence contributions if the weight that house-hold i places on the utility of household j is higher when j belongs to i0s ethnic group.The marginal benefit of i0s contribution to household j is positive if j receives communityservices. Thus, we expect that household i will increase its contributions as the number ofsimilar households who benefit from the services of the organizations increase. For timecontributions, interpersonal effects may affect the transfer decision if households prefer in-teractions with others who are similar to themselves in terms of income and ethnicity asmodelled by Alesina and LaFerrara (2000).
Hence, both the probability and level of transfers that a household makes will increaseas the number of similar households in the community increases. Altruism towards similarhouseholds may also result in lower levels of contributions in ethnically diverse communities,where the household’s ethnic group is less likely to benefit from the household’s contribution.
7

4.2. The Effects of transfers from central government
The comparative statics of the household imply
sign∂ti∂G
= sign³α (α− 1)Sα−2f1f2 + αSα−1f12
´(4.2)
If household transfers and government expenditure are substitutes in the production ofcommunity services (f12 < 0) , then government involvement will crowd out contributions,∂ti∂G < 0. If household contributions and government involvement are complements (f12 > 0) ,then the sign of ∂ti
∂G is ambiguous.
5. Data
We test the implications of our model using data from Indonesia. The data is based on thesecond wave of the Indonesia Family Life Surveys (IFLS2), conducted by RAND and theUniversity of Indonesia in 1997/98, and represents 83 percent of the Indonesia population.7
The second wave is composed of about 7500 households. In addition, we use a separateCommunity and Facility Survey, which measures infrastructure, availability of services andother community characteristics for about 314 communities where households reside. Table1 provides an overview of the household and community variables used in our analysis.
The IFLS2 data is particularly well-suited for the study of transfers to community or-ganizations. To our knowledge, there are no comparable data sets (from developed ordeveloping countries) that provide household-level evidence on transfers to community orga-nizations and benefits received from a representative national sample of households. Table2 presents the transfer patterns to particular organizations. In our data, households cancontribute cash, materials and time to a given community organization. Table 2 presentsthe ten major types of community organizations in our sample. These organizations arelargely economic in orientation. In this way, our focus differs from other studies that haveexamined participation in social, religious and political groups.8
Over 40 percent of households contributed money or materials to a community orga-nization. The mean total monetary contribution in the survey year for households isabout 21150 rupiah, about 3 percent of total annual household expenditure (standard devi-ation=93435 rupiah). Time contributions are widespread in our sample - about 80 percentof households contributed time to an organization in the community. It is important tonote that surveys in developed countries have found that households are more likely tocontribute money to community organizations (rather than time contributions, as we have
7See Frankenberg and Thomas (1999) for a detailed description of the IFLS surveys. The first waveof the survey (IFLS1), which was conducted in 1993/94 is not fully appropriate for our study of transfersto community organizations for two reasons. First, the first wave does not contain information on theethno-linguistic identity of the household. Second, IFLS does not provide any information on the types ofcommunity organizations that receive transfers from households.
8Alesina and LaFarrera (2000) and LaFarrera (2001) examine participation in social and religious groups.Although these may be of considerable importance in our sample, the IFLS data do not provide informationon religious and social contributions.
8

found). Table 2 presents summary statistics on benefits received from the community orga-nization. About 30 percent of households report that they received benefits from communityorganizations.
The IFLS2 data allow us to investigate the extent to which giving and receipt patternsvary across households. From the onset, it is important to note that it may be difficult tomeasure all the benefits that households receive from organizations in an accurate mannerClotfelter (1992). Benefits may not be tangible goods and services that can be observed bythe researcher (such as membership rights and a sense of belonging in the community), andmay be realized over a long-term horizon.
5.1. Ethnicity Variables
Following our theoretical model, we set out to examine the impact of ethnicity on the house-hold’s decision to contribute to the community organization.9 To capture ethnic diversityat the community level, we construct an Ethnolinguistic Diversity Index (EDI):
EDIk = 1−Xi
(share of ethnolinguistic group i in community k)2 (5.1)
The Ethnolinguistic Diversity index is constructed using household level data.10 Thisindex of ethnic diversity captures the probability that two randomly selected householdsbelong to different ethnic groups. This measure of ethnic diversity has been used widelyin the existing literature (Alesina et. al, 1999; Easterly and Levine, 1997; Miguel, 2000).When this index is close to zero, it indicates that most households belong to the sameethnic group. In contrast, when the index approaches 1, it means that households in agiven community belong to many different ethnic groups. The ethnic diversity index is usedin our analysis to measure the effects of diverse preferences towards community services,and transactions costs of community-level production on contributions.11
The share of village population from household i0s ethno-linguistic group that receivesbenefits from community organizations is an important variable in our analysis. Thisvariable allows us to test whether inter-household preferences in the form of altruism towardsone’s own ethnic group are relevant in our environment. Although the share of ethnic groupi with benefits reflects the distribution of benefits in a given community, it is essentially ahousehold-specific variable in the sense that its value will vary across households within thesame community. This variable is constructed as follows:
9 It would also be interesting to study the effect of religious heterogeneity on contributions. Unfortunately,the IFLS instruments contain only limited information on religion.
10The IFLS2 data contains direct questions on the main language spoken at home. Appendix A detailsthe linguistic groups in our data. We used this variable to construct various ethno-linguistic categories.More detailed information on ethnic affiliation is not available for Indonesia, as questions on ethnicity havebeen excluded from the national census.
11We check the reliability of our household-based measure of ethnic diversity against limited data on ethniccomposition available in the Community survey. The community-based ethnicity variable is highly andstatistically significantly correlated with our household-based measure (correlation coefficient=0.67). Thiscommunity-based measure of ethnicity relies on information obtained from village leaders on the populationshare of the three largest ethnic groups in the community.
9

Share of the ethnic group i with benefits=# of households from group i with benefits
Total number of households in community k(5.2)
In addition, we consider the share of household i’s ethnic group in total population, andthe population share of the largest ethnic group in a particular community (a measure ofethnic dominance) as alternative measures of ethnic composition.
5.2. Other Community Variables
Community characteristics used in our analysis include government involvement in thecommunity, the supply of community services, village infrastructure and share of householdsin village which receive benefits. Our measure of government involvement is per capitaexpenditure (measured in rupiah) from the central government. This data is available atthe municipality (kabupaten) level and was obtained from theVillage Government FinancialStatistics 1998, a report published by the Indonesian Central Bureau of Statistics (BadanPusat Statistik or BPS).
The supply of community services is defined as the number of social activities andservices that exist in a village. The supply of community services is constructed using theCommunity-Facility Survey. These services are mostly non-economic in nature, and differfrom the community organizations in our sample of households. To account for regionalvariation, we construct province dummies.
Province dummies reflect ethno-linguistic variation and capture the level of urbaniza-tion, population density and other differences across regions. For most of the sample,we observe high rates of giving where ethnic diversity is low. Table 3 summarizes someof this information. For example, the highest rate of giving is observed in Yogyakarta,(about 74 percent of households report making a monetary contribution to a communityorganization). Yogyakarta, a province where Javanese is the main language spoken alsohas a relatively low ethnic diversity score (0.15). In contrast, North Sumatra and SouthSumatra represent greater ethno-linguistic variation, and also display low levels of givingto community organizations. Jakarta (the capital city of Indonesia) on the other hand hashigh levels of giving behavior, although it represents tremendous ethno-linguistic variation.About 60 percent of households report making a transfer to a community organization inJakarta. Our data on the availability of community services also indicates that Jakartadiffers in important ways from the rest of Indonesia. For this reason, we exclude Jakartafrom our empirical analysis.
5.3. Household Variables
The existing literature on private transfers emphasizes the role of household variables. Weinclude variables that capture the socio-economic circumstances of the household includingage, years of schooling, marital status, religion (Muslim=1), household size, number ofchildren, per capita household expenditure and an indicator variable for receipt of benefits(received benefits from community organization=1).
10

5.4. Organization Variables
We also include organization indicators in organization-level regressions to control for unob-served organization-specific attributes (such as leadership and years of existence). In addi-tion, households provide reports on whether a given organization occurred in the communityor not. This occurrence variable admittedly captures not just organization existence, butalso households’ knowledge of its existence.
6. Empirical Specification and Methods
6.1. Contributions to Community Organizations
This section presents an empirical model of the household’s decision to contribute money,materials and time to a specific organization in its community. Let i index households,j index community organizations, and k index communities. We assume that the “la-tent variable” measuring the net expected utility to household i, from contributing to acommunity organization j in community k, can be written as:
Y ∗ijk = α+ βHi + γVk + φOj + εijk (6.1)
where Hi represents a vector of household characteristics including head’s age, sex, maritalstatus, religion, years of schooling, household size, number of children in the householdand per capita household expenditure; Vk is a vector of community characteristics (ethnicdiversity, transfers from central government as well as other community characteristics).Oj denotes organization j0s characteristics, and εijk is the error term.
We do not observe the “latent” variable Y ∗ijk but only the choice made by the household,which takes value 1 if household contributes to the community organization (i.e. Y ∗ijk ispositive), and 0 otherwise.
Pijk = 1 if Y ∗ijk > 0 (6.2)
= 0 if Y ∗ijk ≤ 0We have data on the transfers made to community organizations, but it is important torecognize that transfers realized do not represent Y ∗ijk. Economic theory suggests that theconsumer makes a marginal benefit-marginal cost calculation when deciding on the level oftransfers, and hence Y ∗ijk represents the difference between marginal benefits and marginalcosts.
In our empirical specifications, we include a rich set of household, community and or-ganization variables. However, there are important sources of unobserved heterogeneityacross households. For example, when we observe that a household receives benefits fromthe community organization, this may proxy for unmeasured household attributes such ascivic pride and social networks, and would lead to a spurious link between benefits re-ceived and contributions to community organizations. To address this possible problemwith endogeneity, we instrument for household’s receipt status in some specifications.
It may also be difficult to fully capture all the community variables that affect monetaryand time contributions. Village characteristics such as civic traditions, quality of leadershipand costs of producing services, which may be unobserved can also affect transfer patterns.
11
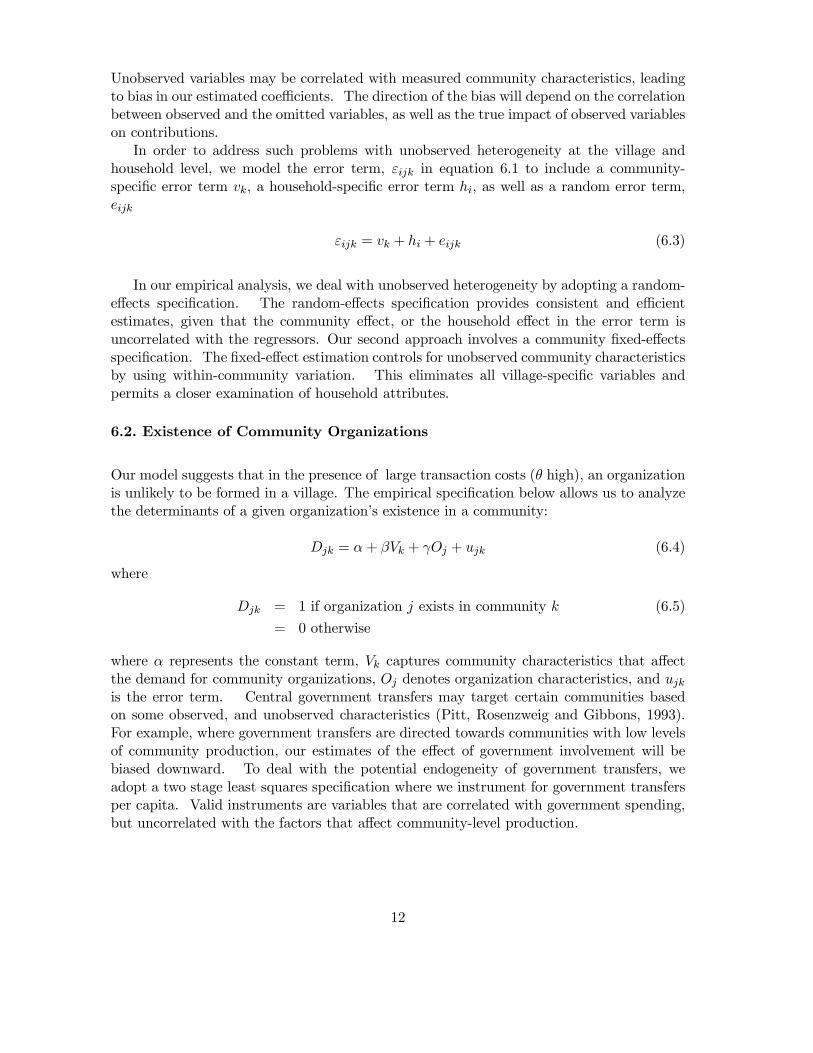
Unobserved variables may be correlated with measured community characteristics, leadingto bias in our estimated coefficients. The direction of the bias will depend on the correlationbetween observed and the omitted variables, as well as the true impact of observed variableson contributions.
In order to address such problems with unobserved heterogeneity at the village andhousehold level, we model the error term, εijk in equation 6.1 to include a community-specific error term vk, a household-specific error term hi, as well as a random error term,eijk
εijk = vk + hi + eijk (6.3)
In our empirical analysis, we deal with unobserved heterogeneity by adopting a random-effects specification. The random-effects specification provides consistent and efficientestimates, given that the community effect, or the household effect in the error term isuncorrelated with the regressors. Our second approach involves a community fixed-effectsspecification. The fixed-effect estimation controls for unobserved community characteristicsby using within-community variation. This eliminates all village-specific variables andpermits a closer examination of household attributes.
6.2. Existence of Community Organizations
Our model suggests that in the presence of large transaction costs (θ high), an organizationis unlikely to be formed in a village. The empirical specification below allows us to analyzethe determinants of a given organization’s existence in a community:
Djk = α+ βVk + γOj + ujk (6.4)
where
Djk = 1 if organization j exists in community k (6.5)
= 0 otherwise
where α represents the constant term, Vk captures community characteristics that affectthe demand for community organizations, Oj denotes organization characteristics, and ujkis the error term. Central government transfers may target certain communities basedon some observed, and unobserved characteristics (Pitt, Rosenzweig and Gibbons, 1993).For example, where government transfers are directed towards communities with low levelsof community production, our estimates of the effect of government involvement will bebiased downward. To deal with the potential endogeneity of government transfers, weadopt a two stage least squares specification where we instrument for government transfersper capita. Valid instruments are variables that are correlated with government spending,but uncorrelated with the factors that affect community-level production.
12

7. Results
7.1. Aggregate Regressions
The results presented in this section capture the probability that the household contributesto at least one organization, as a function of household and community characteristics.In section 7.3, we examine the household decision to contribute by organization type, whichallows us to address unobserved heterogeneity across households and organizations.
7.1.1. Contributions of Money and Materials to Community Organizations
Table 4 presents reduced form logit estimates. The dependent variable is equal to one if thehousehold contributes money or materials to at least one organization in the community.
From our results, a clear picture of the household-level determinants of monetary con-tributions emerges. Higher income households (measured by per capita expenditure) aremore likely to contribute to community organizations (column 1). However, in contrastto studies from developed countries, a household’s economic position has a relatively smallimpact on the probability of giving. A ten percent increase in household’s per capita ex-penditure in rupiah increases the probability of giving by about 0.6 percent. Educationalattainment is positively associated with the incidence of a monetary transfer to the commu-nity organization and statistically significant. Male headship and household size are alsopositively associated with monetary contributions. The presence of young children (under14) in the household has a negative and statistically significant impact on the probabilityof giving. We also find that urban households are significantly more likely to contributemoney (starting at the mean, the probability of giving is about 6 percentage points higherfor urban households). Age does not have a statistically significant effect on monetarycontributions. Marginal effects are shown in Table 6.12
The household’s receipt of benefits from the community organization is found to havea positive and statistically significant impact on giving. We argue that this result providessupport for an exchange based model of transfer behavior, with households contributingwhen they receive benefits from the community organization. This effect is substantial- a change in a household’s receipt status (as reported by the household) increases theprobability of giving by about 40 percent.
How does ethnic diversity affect monetary contributions? Consistent with our model,the ethnic diversity index has a negative and statistically significant effect on the probabilityof giving (Table 4, column 1). A move from complete ethnic homogeneity to completeheterogeneity in a community, (which represents an increase from 0 to 1 in the ethnicdiversity index) decreases the probability of giving by 11 percentage points. We find theresults on ethnic diversity to be sizeable, when compared to other significant determinantsof contributions. Starting at the mean, a ten percent increase in the ethnic diversity indexdecreases the probability of giving by about 0.4 percentage points.
Results on the ethnic diversity index are robust across specifications. In particular, thecoefficient on the ethnic diversity index remains negative and statistically significant whenwe include community random-effects (column 2). In column 3, we explore the possibility
12Marginal effects are evaluated at the sample means for continuous variables, and reflect a change from0 to 1 for discrete variables.
13

that the household’s report on the receipt of benefits may be correlated with unobservedcommunity attributes such as leadership and traditions of community co-operation. Toaddress the potential endogeneity of the household’s receipt status, we adopt a two-stageleast squares specification. Our instrument for receipt status is the number of family-related sources from which the household reported receiving economic support. We arguethat this is a valid instrument for the receipt status of the household because it is likelyto be correlated with receiving benefits from the community organization, but uncorrelatedwith unmeasured community attributes that affect contributions. According to our first-stage regression results (adjusted R-squared = 0.07), the number of family-related sourcesof economic support is positively associated with receiving benefits from the communityorganization in the survey year. When the predicted value of receipt status is included in ourregressions, the coefficient on the ethnic diversity index remains negative and statisticallysignificant (column 3).
The results presented above suggest that households have a lower probability of con-tributing to community organizations within ethnically diverse environments. However,the negative effect of ethnic diversity on monetary contributions can be explained by thehigh transaction costs of community level production and the diverse preferences for publicgoods in heterogeneous communities. It may not be possible to distinguish between thesetwo potential explanations in our data.
Theory also suggests that ethnic diversity can affect contributions through interhouse-hold preferences. We examine closely the impact of the share of the household’s ethniccommunity that receives benefits from the community organization on contributions. Acrossspecifications (columns 4-7), we do not find evidence that the share of the household’s ownethnic group receiving benefits significantly affects monetary contributions.13
We now turn to discuss other community characteristics that can affect the probabilityof giving. Results on the effect on government transfers provide some direction towardsunderstanding the role of the public expenditure in low-income settings.14 From our re-sults, the probability that a household contributes money or materials to the communityorganization, is negatively and significantly associated with transfers per capita from thecentral government. This lends support to a crowding-out model of government spend-ing. Starting from the mean, a ten percent increase in government spending per capitadecreases the probability of giving by 0.9 percentage points. To further demonstrate theimpact of government spending, an increase from the minimum to maximum value of govern-ment spending per capita in our sample reduces the probability of giving by 20 percentagepoints.15 However, the coefficient on government expenditure declines in magnitude, andlevel of statistical significance when we include the share of households receiving benefits
13We also examine two additional measures of ethnicity: the size of the household’s ethnic community,and the size of the largest ethnic group in the community (ethnic dominance). Both variables are positivelyassociated with monetary contributions, but not statistically significant. The inclusion of community-levelmeasures of migration prevalence do not affect our results on ethncity.
14Local government expenditure in Indonesia depends heavily on transfers from the center (about 67percent of local government spending). There are two main types of central government transfers: (i) Blockgrants (INPRES)-which fund specific development expenditures on roads, primary schools, public healthcenters and reforestation (ii) transfers for local government personnel expenses
15The maximum level of central government spending in our sample is 19.13 rupiah per capita, while theminimum level is 2.457 rupiah per capita.
14

from the community organizations in our regressions. In our sample, we find that govern-ment transfers (per capita) tend to be higher where reported benefits (measured at thecommunity-level) are lower. Thus, central government spending may be directed towardscommunities with low levels of community-level production.16
One might argue that ethnic diversity reflects other types of heterogeneity, such as in-come inequality within a community. The existing literature suggests that income or wealthinequality can affect incentives to contribute to the community organization (LaFerrara,2001). To rule out this interpretation of our results, we control for income heterogeneity atthe community-level using the gini coefficient index.17 We find that income inequality isnegatively associated with the probability of giving and statistically significant. The effectof income inequality on contributions is robust across all specifications.
Community resources affect household preferences, as well the nature of services pro-vided by the community organization and therefore, may influence the household’s deci-sion to contribute. We find that average community income is positively associated withmonetary contributions and statistically significant. In particular, a 10 percent increasein average community expenditure increases the likelihood of monetary contributions byabout 2 percentage points. Log population is negatively associated with contributions atthe community-level, but not statistically significant. The supply of community programshas a positive, but insignificant effect on monetary contributions.
Estimation includes province dummies to capture regional economic and environmentalfactors, as well as pre-existing traditions of community organization. Province dummiesalso control for some of the variation in ethnic diversity across villages. When we excludeprovince dummies from our estimation procedure (not shown) the coefficient on the ethnicdiversity index has a larger negative effect on the probability of giving. Results also showthat the coefficient on ethnic diversity is more negative in urban environments.
7.1.2. Time Transfers to Community Organizations
Table 5 presents general reduced form logit estimates with dependent variable equal to oneif the household contributes time to at least one organization in the community. We notethat at the aggregate level, there is less variation in the dependent variable (time), as about80% of households report time contributions.
We find some common patterns on the effects of household attributes across monetaryand time contributions. The household’s receipt status, per capita household expenditure,male headship, household size, head’s marital status and religion (Muslim=1) are positivelyassociated with the incidence of a time transfer, while the presence of young children (lessthan 14 years old) in the household has a negative and significant impact.
There are also noteworthy differences across the determinants of monetary and time con-tributions. Age squared (of the household head) has a negative and statistically significantfor time contributions, but was not shown to have a significant effect on the probability of
16The reduction in the level of significance of the coefficient on government transfers may be attributedto multicollinearity (there is a negative and significant correlation between government transfers and shareof the community receiving benefits), rather than the endogeneity of government spending to the individualtransfer decision.
17Our gini coefficient index was constructed using expenditure data at the kecamatan (district) level.
15

monetary contributions. In addition, educational attainment has a negative, but insignifi-cant effect on likelihood of time contributions (while years of schooling was shown to havea positive impact on monetary contributions). The marginal effects are shown in Table 6.
Turning our attention to community characteristics, we find that the coefficient onthe ethnic diversity index is negative, but statistically insignificant for time contributions(columns 1-3). However, the ethnic composition of the community appears to affect timecontributions through interhousehold preferences. We find that the share of the household’sethnic community with benefits has a positive and significant effect on time contributions.Starting at the mean, a ten percent increase in this variable leads to a 0.5 percentagepoint increase in the probability that a household will contribute time to the communityorganization. This result appears to be quite robust: When we control for unobservedheterogeneity at the village level, using a community random-effects specification (column5) and community-fixed effects specification (column 6), and the instrumental variable ap-proach (column 7), the coefficient on share of the household’s ethnic community receivingbenefits is still positive and statistically significant. Thus, we find that the size of the house-hold’s ethnic community with benefits does have an important effect on time contributions(although this variable was not shown to have a statistically significant effect on monetarycontributions).
Government spending per capita appears to have a negative and statistically signifi-cant effect on time contributions (columns 1- 7) which lends support to the crowding-outhypothesis. However, the magnitude of this effect is small relative to our findings formonetary contributions. A ten percent increase in government spending is found to reducethe probability of giving time by about 0.2 percent points. Furthermore, the magnitudeand level of significance of this “crowding-out” effect appears to decline when we introducemeasures of benefits received at the community-level due to reasons stated in the previoussection. Income inequality does not appear to have a significant effect on time transferpatterns, while it had a large negative and significant effect on the likelihood of monetarytransfers. Consistent with our results on monetary contributions, average community ex-penditure has a positive and significant effect on time contributions. However, communityresources may be less influential for time contributions (a 10 percent increase in averagecommunity expenditure per capita increases the likelihood of time contributions by about.07 percentage points). The availability of community programs remains positive and sta-tistically significant, although it was not significant in monetary regressions. This result isnot surprising since the presence of complementary inputs may be of greater relevance fortime contributions.
When we omit the province dummy variables from our analysis, the ethnic diversityindex becomes statistically significant. The coefficient on the ethnic diversity index is morenegative in urban areas.18 Thus, for both time and monetary contributions the effect ofethnic diversity index appears to be of considerable importance in urban areas.
7.2. Transfer amounts
In this section, we present results with the household’s total monetary transfer (in rupiah),and the total time contribution (in hours) to community organizations as the dependent
18Results though not shown here are available upon request.
16

variables. It is important to recognize that households’ reports on transfer levels maybe more prone to measurement error, when compared to measures of whether householdsgave to the community organization or not. With this caveat in mind, we present resultsfrom tobit maximum likelihood estimation and median regressions in table 7. Results onhousehold variables appear comparable to earlier results shown in tables 4 and 5.
In the tobit specification (table 7, column 1), where we investigate the levels of mone-tary contributions, the signs on the community-level variables are consistent with our earlierfindings. However, these community-specific variables exhibit reduced levels of statisticalsignificance. Ethnic diversity is negatively associated with monetary contributions, but notstatistically significant. Income inequality has a negative, but statistically insignificanteffect on monetary contributions. Community population and average expenditure are notshown to have a statistically significant effect on the amount transferred. Government in-volvement in the community (measured by per capita transfers) remains negative, althoughstatistically insignificant. We find that the presence of community activities does have apositive and statistically significant effect on the total amount contributed.
In the median regression (column 2) we find that ethnic diversity index and incomeinequality index both have a negative and significant effect on the level of money transfers.Average expenditure is shown to have a positive and significant effect.19
Results for the total time contributions are discussed below. In both the Tobit spec-ification and the median regression (columns 4 and 5), ethnic diversity is shown to havea negative and statistically significant impact on levels of time transferred. Governmentspending is negatively associated with time contributions, and significant in the tobit spec-ification (although not significant in the median regression). The number of communityprograms is positively associated with the amount of time transferred and significant. How-ever, community population, income inequality and average community expenditure arenot statistically significant in explaining the level of time transferred to the communityorganizations.
7.3. Panel regressions
In this section, we examine the probability that a household contributes to a specific com-munity organization using a random-effects probit specification. The results presentedhere represent an improvement on our earlier estimates because we are better able to dealwith unobserved heterogeneity across households, communities, and organizations. Sincewe have multiple observations for each household, we construct a panel such that the de-pendent variable is 1 if a household in a given village contributes to a specific type oforganization, and 0 otherwise. This enables us to exploit the detailed information oncontribution patterns available in the data. Household and community variables are thesame measures used in the general framework. In addition, we introduce controls for orga-nization characteristics (including dummies for organization type). There are ten types ofcommunity organizations in our sample
Tables 8a and 8b present results for two different samples. Sample 1 includes all obser-
19The measures of fit for the transfer levels suggest that the tobit model does not perform well. Themedian regression does better and we find that quantile regressions (at higher than the median), whichreduce the impact of outliers tend to further improve the fit of the transfer level regressions.
17
vations in our data. Sample 2 limits the sample to communities where the organizationsin question occurred during the survey year. With sample 2, our goal is to analyze thedeterminants of contributions to a specific organization given that this organization existsin the community.20
Table 8a presents the determinants of monetary contributions with household random-effects and community random-effects specifications. We discuss results for both sam-ples. Results on household-specific variables are similar to those in the general regressions.Marginal effects for sample 2 are presented in Table 8c.
Some important insights emerge when we examine community-specific variables. Ethnicdiversity retains a negative and significant association with monetary contributions in thehousehold random-effects specification. However, the ethnic diversity index, as well asother community-specific variables decline in their levels of statistical significance when therandom village-effects specification is used (columns 3 and 7). The coefficient on the ethnicdiversity index is significant at 11 percent for sample 2 (column 7), but its significance islower for sample 1 (column 3). While the coefficient on the share of households from thehousehold’s own ethnic group is positive, it is not found to be a significant determinant ofmonetary contributions.
The effect of government transfers on contributions deserves close attention. For mon-etary contributions, the coefficient on government transfers has a negative and statisticallysignificant effect on giving in the random household-effects specification for sample 2 (col-umn 7). However, the coefficient on government spending is not significant in sample1 regressions.21 Again, its level of significance is reduced when we include the share ofhouseholds with benefits in our regressions. As we have argued earlier, government trans-fers may be directed towards communities where the provision of local public goods andservices is low. We also find that households are more likely to contribute money whereaverage village income is relatively high (although this effect is small in magnitude), incomeis more equally distributed and the number of community programs is high.
Turning our attention to time contributions, in Table 8b, results on household variablesare similar to those presented in Table 5. However, the coefficient on per capita householdexpenditure is no longer significant, which can be attributed to higher opportunity cost oftime with rising income.
Our results on time contributions also highlight the importance of ethnic diversity. Wefind that ethnic diversity has a negative effect on time contributions. The coefficient onthe ethnic diversity index is statistically significant in the household random-effects specifi-cation, but declines in statistical significance when we introduce community random-effects(significant at 11 percent in column 7). We also find that the share of the household’sethnic community receiving benefits has a positive and significant effect on time contribu-tions. Consistent with aggregate results, this coefficient remains positive and significantacross random household-effects and community-effects specifications for both samples.
20We do not have information on organization existence from the Community-Facility surveys. Thus, weassume that if at least one household head in our sample is aware of an organization’s existence than thisorganization exists in this village during the survey period.21To further explore the role of the government, we have also constructed a subjective index of govern-
ment support for organizations in our sample. It is interesting to note that the coefficient on governmentinvolvement (measured at the organization level) is negative. These results are available upon request.
18
Government transfers are not found to have a significant effect on time contributionsin our panel data analysis, while they had a negative and significant impact in the gen-eral framework. Results at the organization-level may be more convincing because theyovercome aggregation problems present in the general framework. Thus, we find thatcentral government transfers, while important for monetary contributions may be less rele-vant for time contributions. This result provides some evidence that government spendingand households’ time contributions may be more complementary in nature. It is also in-teresting to note that average community income is not a significant determinant of timecontributions.
In summary, results from our panel analysis confirm theoretical predictions. Ethnicdiversity appears to be the only community variable that remains significant for both mon-etary and time contributions. Our findings also suggest that ethnic diversity may affectmonetary and time contributions through different channels. Households are more likelyto contribute time when the share of recipients from their own ethnic group rises, while thisvariable was not shown to have a significant monetary contributions. Thus, results on timecontributions provide more convincing evidence for a model of interhousehold preferences.
7.4. Existence of Community Organizations
Table 9 presents results on the prevalence of community organizations at the community-level. Theory suggests that ethnic diversity can also affect the existence of communityorganizations. We construct a measure of prevalence of community organizations fromhousehold reports on whether or not a specific organization exists in the community. Us-ing multiple observations on each community, we adopt a random-effects specification. Incolumns 1 and 2, the dependent variable is the mean household report on the existence oforganizations at the community-level. Column 3 shows results from a probit specification,with occurrence as a dichotomous variable (occur is equal to 1, if community organizationexists and zero, otherwise).
From our results, ethnic diversity index does have a negative, and statistically significanteffect on the supply of organizations. This negative result persists across all specifications(columns 1-3). The robustness of this result may appear surprising, given that others (no-tably, Weisbrod, 1988) have argued that ethnic diversity may exert a positive influence onthe existence of community organizations. In Weisbrod’s view, community organizationssupply public goods in heterogenous communities as a response to market and state failure.However, the prevalence of community organizations may also depend on emergence oforganization leaders or “social entrepreneurs” (James, 1987), who create community orga-nizations to meet diverse needs of ethnic, religious and income groups in the community.We note that within more restrictive political environments, the incentives for, and thescope of community-level activity may be reduced.
Other community-specific variables appear to have a less robust effect on the preva-lence of community organizations. Government involvement in the community (governmenttransfers per capita) has a negative, but statistically insignificant effect on the prevalenceof a given organization. As government programs may not be randomly allocated acrosscommunities in Indonesia, we instrument for government transfers using two variables: theincidence of mass immunization in the community since 1980 (immunize=1) and the village
19

electricity index (which measures the years of electricity supply in the village). When weinstrument for government transfers, the coefficient on government spending remains neg-ative, although only statistically significant at the 11 percent level (column 2). Averagecommunity expenditure (per capita) and average years of education are positively associatedwith the prevalence of community organizations.
8. Conclusion
This paper represents an important contribution to existing knowledge on monetary andtime contributions in low-income environments. Our theoretical model provides a role forcommunity-level variables. In particular, ethnic diversity and government involvement canaffect the household’s transfer decision. We test the implications of our model using thesecond wave of the Indonesia Family Life Surveys (IFLS2).
The results in this paper reinforce the need for careful study of community-level deter-minants of private contributions. Community organizations rely on monetary, as well astime contributions. We find that ethnic diversity has negative effect on both monetaryand time contributions, as well as on the prevalence of community-based organizations.Our results are also suggestive of potential mechanisms through which ethnic diversity caninfluence contributions. For monetary contributions, diverse preferences and transactioncosts emerge as important explanations for the negative effect of ethnic diversity. However,results on time contributions provide support for interhousehold preferences. Householdsare more likely to contribute time when a larger share of their ethnic community receivesbenefits from the community organization. Our results on the effect of central govern-ment transfers provide some interesting insights. Empirical results support a crowdingout model for monetary contributions, with less convincing evidence on time contributions.Further research may be needed to investigate what role governments can play in supportingcommunity institutions across various settings.
Beyond providing public goods and services, and organizing redistribution, communityorganizations may be linked to social capital formation and economic growth (Putnam, 1993;Knack and Keefer, 1997). Thus, the results in this paper provide micro-level evidence onhousehold and community variables that affect the prevalence and functioning of communityorganizations, which may be related to understanding trust, civic engagement and welfareoutcomes in low-income environments.
20

References
[1] Alderman, Harold and Christina H. Paxson. 1992. “Do the Poor Insure?: A Synthesisof the Literature on Risk and Consumption in Developing Countries” Washington, DC: World Bank.
[2] Alesina A., Easterly William, Baqir Reza. 1999. “Public Goods and Ethnic Divisions,”Quarterly Journal of Economics. 114(4):1243-84.
[3] Alesina A., and Eliana LaFerrara. 2000. “Participation in Heterogeneous Communi-ties,” Quarterly Journal of Economics. 115(3):847-904
[4] Andreoni, James 1989. “Giving with Impure Altruism: Applications to Charity andRicardian Equivalence,” Journal of Political Economy, 97(6):1447-58.
[5] Andreoni, James 1990. “Impure Altruism and Donations to Public Goods: A Theoryof Warm Glow Giving,” Economic Journal, 100(401):464-77.
[6] Becker, Gary S. 1981. Treatise on the Family Cambridge: Harvard University Press.
[7] Bowen, John 1986. “On the Political Construction of Tradition: Gotong Royong inIndonesia,” Journal of Asian Studies 45(3):545-561
[8] Clotfelter, Charles T. 1992. ed. Who Benefits from the Non Profit Sector? Universityof Chicago Press, Chicago, IL and London.
[9] _______________ 1985. Federal Tax Policy and Charitable Giving Chicago:University of Chicago Pres
[10] Collier, Paul. 2000. “Implications of Ethnic Diversity” World Bank and CEPR mimeo.
[11] Cox, Donald and Emmanuel Jiminez. 1992. ”Social Security and Private Transfersin Developing Countries: The Case of Peru,” The World Bank Economic Review,6(1):155-169.
[12] _________________________. 1990 “Achieving Social Objectivesthrough Private Transfers: A Review,” World Bank Research Observer ; 5(2):205-18.
[13] Easterly, William and Ross Levine, 1997. “Africa’s Growth Tragedy,” Quarterly Jour-nal of Economics. 112(4):1203-50.
[14] Frankenberg, Elizabeth and Duncan Thomas 2001. “Women’s Health and PregnancyOutcomes: Do Services Make a Difference?” Demography 38(2):253-265
[15] Frankenberg, Elizabeth and Duncan Thomas 1999. The Indonesian Family Life Survey1997. Survey Description and Key Results. RAND mimeo
[16] Glazer, Amihai and Kai A. Konrad 1996. “A Signaling Explanation for Charity,” Amer-ican Economic Review, 86(4):1019-28.
21

[17] Grimard Franque 1997. “Household Consumption Smoothing Through Ethnic Ties:Evidence from Cote D’Ivoire,” Journal of Development Economics Vol. 53:391-422.
[18] Badan Pusat Statistik, 1998/1999 Statistik Keungan Desa (Village Government Finan-cial Statistics) Jakarta, Indonesia
[19] Hugo, Grame 1982. “Circular Migration in Indonesia,” Population and DevelopmentReview 8(1):59-83
[20] James, Estelle 1987. “The Nonprofit Sector in Comparative Perspective” in W.W.Powell (ed.), The Nonprofit Sector: A Research Handbook, New Haven: Yale UniversityPress.
[21] Knack, Stephen and Philip Keefer, 1997. “Does Social Capital Have an EconomicPayoff? A Cross-Country Investigation,” Quarterly Journal of Economics: 112(4):1251-88.
[22] Kingma, Bruce, 1989 “An Accurate Measurement of the Crowd-Out Effect, IncomeEffect, and Price Effect for Charitable Contributions,” Journal of Political Economy,97(5):1197-1207.
[23] LaFerrara, Eliana 2001. “Inequality and Group Participation: Theory and Evidencefrom Rural Tanzania,” Journal of Public Economics forthcoming
[24] Luttmer, Erzo F.P. 2001. “Group Loyalty and the Taste for Redistribution,” Journalof Political Economy 109(3): 500-529
[25] Miguel, Edward 2000. “Ethnic Diversity and School Funding in Kenya,” Center forInternational and Development Economics Research Working Paper No. C01-119 Uni-versity of California, Berkeley.
[26] Pitt, Mark M., Mark R. Rosenzweig and Donna M. Gibbons, 1993. “The Determinantsand Consequences of the Placement of Government Programs in Indonesia,” WorldBank Economic Review, (7)3:319-348.
[27] Putnam, Robert 1993. Making Democracy Work: Civic Traditions in Modern ItalyPrinceton: Princeton University Press
[28] Ravallion, Martin and Lorraine Dearden 1988. “Social Security in a Moral Economy:An Empirical Analysis for Java,” Review of Economics and Statistics, 70(1):36-44.
[29] Rose-Ackerman Susan, 1996 “Altruism, Nonprofits and Economic Theory,” Journal ofEconomic Literature, 34(2):701-728.
[30] Van Der Kroef, Justus M. “Social Conflict and Minority Aspirations in Indonesia,”American Journal of Sociology, 55(5):450-463.
[31] Weisbrod, Burton A., 1988. The Nonprofit Economy. Cambridge, MA: Harvard Uni-versity Press,
22
[32] Warren, Carol 1993. Adat and Dinas: Balinese Communities in the Indonesian StateSouth Asian Social Science Monograph, New York: Oxford University Press.
[33] Wong, Chung-Ming, Vincent C.H. Chua and S. Vasoo, 1998 “Contributions to Chari-table Organizations in a Developing Country: The Case of Singapore,” InternationalJournal Of Social Economics, 25(1): 25-42
23
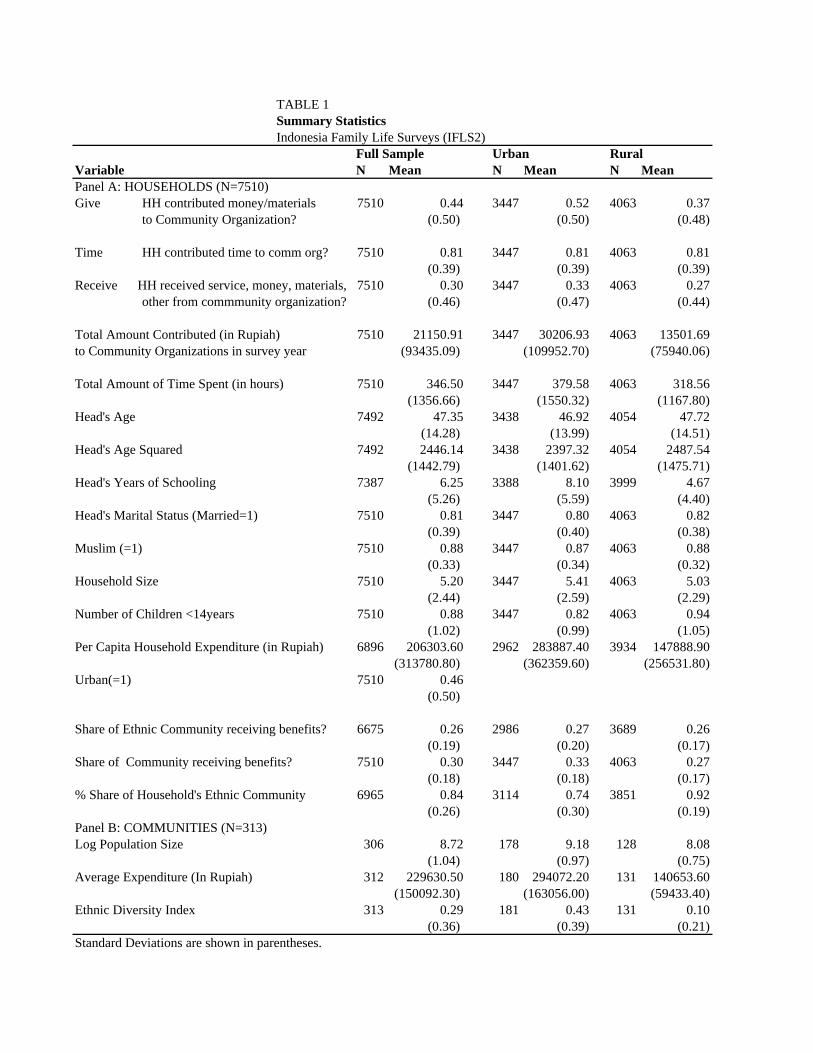
TABLE 1 Summary StatisticsIndonesia Family Life Surveys (IFLS2)
Full Sample Urban Rural Variable N Mean N Mean N MeanPanel A: HOUSEHOLDS (N=7510)Give HH contributed money/materials 7510 0.44 3447 0.52 4063 0.37
to Community Organization? (0.50) (0.50) (0.48)
Time HH contributed time to comm org? 7510 0.81 3447 0.81 4063 0.81(0.39) (0.39) (0.39)
Receive HH received service, money, materials, 7510 0.30 3447 0.33 4063 0.27other from commmunity organization? (0.46) (0.47) (0.44)
Total Amount Contributed (in Rupiah) 7510 21150.91 3447 30206.93 4063 13501.69to Community Organizations in survey year (93435.09) (109952.70) (75940.06)
Total Amount of Time Spent (in hours) 7510 346.50 3447 379.58 4063 318.56(1356.66) (1550.32) (1167.80)
Head's Age 7492 47.35 3438 46.92 4054 47.72(14.28) (13.99) (14.51)
Head's Age Squared 7492 2446.14 3438 2397.32 4054 2487.54(1442.79) (1401.62) (1475.71)
Head's Years of Schooling 7387 6.25 3388 8.10 3999 4.67(5.26) (5.59) (4.40)
Head's Marital Status (Married=1) 7510 0.81 3447 0.80 4063 0.82(0.39) (0.40) (0.38)
Muslim (=1) 7510 0.88 3447 0.87 4063 0.88(0.33) (0.34) (0.32)
Household Size 7510 5.20 3447 5.41 4063 5.03(2.44) (2.59) (2.29)
Number of Children <14years 7510 0.88 3447 0.82 4063 0.94(1.02) (0.99) (1.05)
Per Capita Household Expenditure (in Rupiah) 6896 206303.60 2962 283887.40 3934 147888.90(313780.80) (362359.60) (256531.80)
Urban(=1) 7510 0.46(0.50)
Share of Ethnic Community receiving benefits? 6675 0.26 2986 0.27 3689 0.26(0.19) (0.20) (0.17)
Share of Community receiving benefits? 7510 0.30 3447 0.33 4063 0.27(0.18) (0.18) (0.17)
% Share of Household's Ethnic Community 6965 0.84 3114 0.74 3851 0.92(0.26) (0.30) (0.19)
Panel B: COMMUNITIES (N=313)Log Population Size 306 8.72 178 9.18 128 8.08
(1.04) (0.97) (0.75)Average Expenditure (In Rupiah) 312 229630.50 180 294072.20 131 140653.60
(150092.30) (163056.00) (59433.40)Ethnic Diversity Index 313 0.29 181 0.43 131 0.10
(0.36) (0.39) (0.21)Standard Deviations are shown in parentheses.

TABLE 1 (Continued)Summary StatisticsIndonesia Family Life Surveys (IFLS2)
Full Sample Urban Rural Variable N Mean N Mean N Mean
Panel B: COMMUNITIES (N=313)
Ethnic Dominance (Share of Largest Ethnic Group) 303 84.15 172 76.59 130 90.52(19.20) (22.60) (22.60)
Gini Coefficient 313 0.54 181 0.54 131 0.54(0.04) (0.05) (0.04)
Average Years of Schooling 313 6.41 181 7.89 131 4.34(2.99) (2.85) (1.67)
Received Underdeveloped Village Grant? 314 0.21 181 0.14 131 0.29(0.41) (0.35) (0.46)
Number of Community Programs 298 14.05 171 14.58 127 13.35(4.22) (4.46) (3.77)
Number of Community Health Posts (Posyandu ) 304 7.93 177 10.05 127 4.98(6.40) (7.14) (3.48)
Central Government Expenditure Per Capita 313 2.65 181 1.93 131 3.66(in Rupiah) (2.39) (1.68) (2.83)Community Electricity Index 305 4.13 177 5.13 128 2.76
(1.79) (1.61) (0.87)Mass Immunization since 1980 (immunize=1) 310 0.38 181 0.38 128 0.37
(0.48) (0.49) (0.49)Panel C: ORGANIZATIONS (N=10)Level of Government Involvement(1=low; 5=high) 10 3.55 10 3.53 10 3.58
(1.82) (1.62) (1.60)Occur 10 0.20 10 0.21 10 0.41
(0.40) (1.96) (0.40)Standard Deviations are shown in parentheses.

TABLE 2Contributions to Community Organizations by Type
N=7510 householdsType of Organization % of HH % of HH Average Transfer % of HH Average
that report that contribute (Money or Materials) that contribute Time Transferoccurrence Money (in Rupiah) Time (in Hours)
or Materials
A Community Meeting 0.46 0.18 4530.15 0.46 22.30(0.50) (0.39) (47517.36) (0.50) (107.49)
B Co-operative 0.12 0.03 1133.14 0.06 2.88(0.32) (0.17) (20861.26) (0.24) (57.47)
C Volunteer Labor 0.46 0.15 3040.59 0.54 52.55(0.50) (0.35) (27591.72) (0.50) (217.96)
D Neigborhood Improvement 0.25 0.16 5880.73 0.27 26.38(0.43) (0.37) (33917.32) (0.44) (232.17)
E Neigborhood Security 0.35 0.08 2019.77 0.34 97.40(0.48) (0.28) (13687.59) (0.47) (405.88)
F Drinking Water 0.04 0.02 1272.05 0.03 46.27(0.20) (0.14) (14886.94) (0.16) (652.76)
G Washing Water 0.04 0.01 565.82 0.02 45.00(0.19) (0.09) (16617.64) (0.15) (707.94)
H Garbage Collection 0.06 0.06 1545.14 0.02 11.88(0.25) (0.24) (10631.35) (0.15) (287.88)
I Women's Groups 0.07 0.07 991.56 0.16 8.15(0.25) (0.25) (11423.09) (0.37) (66.61)
J Community Health Posts 0.10 0.05 351.30 0.28 10.06(0.30) (0.21) (4818.09) (0.45) (55.34)
Benefits Received From Community Organizations(by Class of Benefits received)
Class of Benefit Received N Mean Std Dev
Did HH receive any class of benefits? 7510 0.30 0.46 (1=Yes, 0=No)
1. Received Service from Organization 7510 0.13 0.342. Received Materials 7510 0.02 0.153. Received Money 7510 0.08 0.274. Received Other 7510 0.11 0.315. Received Information 7510 0.31 0.466. Received Infrastructure 7510 0.34 0.47

TABLE 3Province Level Variation in Give, Receive and EthnicIndonesia Family Life Surveys (IFLS2)
N=7510 householdsProvince Name N Give Receive Ethnic Diversity Index
Mean Std Dev. Mean Std. Dev. Mean Std. Dev.
North Summatra 528 0.20 0.40 0.20 0.40 0.47 0.38
West Sumatra 369 0.43 0.50 0.32 0.47 0.18 0.28
South Sumatra 359 0.36 0.48 0.18 0.38 0.44 0.30
Lampung 284 0.21 0.41 0.20 0.40 0.36 0.38
Jakarta 642 0.60 0.49 0.31 0.46 0.94 0.05
West Java 1241 0.50 0.50 0.30 0.46 0.35 0.37
Central Java 979 0.55 0.50 0.32 0.47 0.11 0.27
Yogyakarta 483 0.74 0.44 0.39 0.49 0.15 0.27
East Java 1103 0.39 0.49 0.27 0.44 0.14 0.26
Bali 358 0.21 0.41 0.46 0.50 0.22 0.35
W. Nusa Tenggara (NTB) 442 0.42 0.49 0.30 0.46 0.20 0.30
South Kalimantan 334 0.42 0.49 0.27 0.45 0.27 0.31
South Sulawesi 388 0.30 0.46 0.32 0.47 0.22 0.28
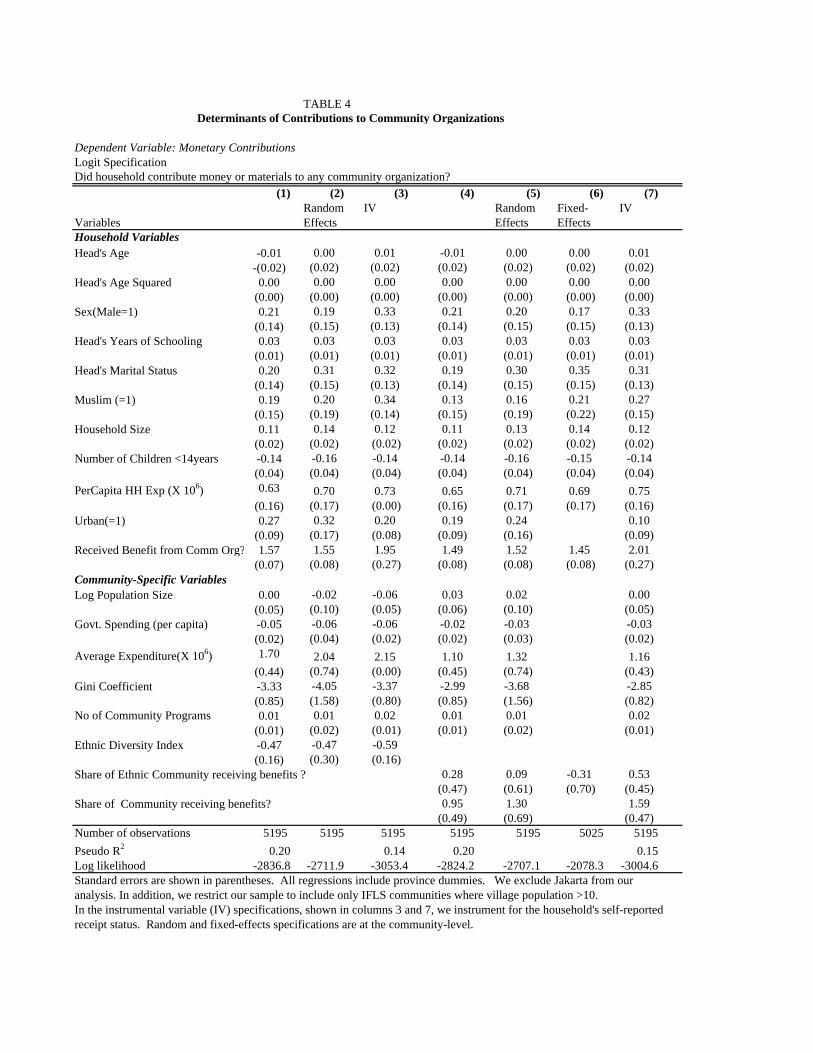
TABLE 4Determinants of Contributions to Community Organizations
Dependent Variable: Monetary Contributions Logit SpecificationDid household contribute money or materials to any community organization?
(1) (2) (3) (4) (5) (6) (7)Random IV Random Fixed- IV
Variables Effects Effects EffectsHousehold VariablesHead's Age -0.01 0.00 0.01 -0.01 0.00 0.00 0.01
-(0.02) (0.02) (0.02) (0.02) (0.02) (0.02) (0.02)Head's Age Squared 0.00 0.00 0.00 0.00 0.00 0.00 0.00
(0.00) (0.00) (0.00) (0.00) (0.00) (0.00) (0.00)Sex(Male=1) 0.21 0.19 0.33 0.21 0.20 0.17 0.33
(0.14) (0.15) (0.13) (0.14) (0.15) (0.15) (0.13)Head's Years of Schooling 0.03 0.03 0.03 0.03 0.03 0.03 0.03
(0.01) (0.01) (0.01) (0.01) (0.01) (0.01) (0.01)Head's Marital Status 0.20 0.31 0.32 0.19 0.30 0.35 0.31
(0.14) (0.15) (0.13) (0.14) (0.15) (0.15) (0.13)Muslim (=1) 0.19 0.20 0.34 0.13 0.16 0.21 0.27
(0.15) (0.19) (0.14) (0.15) (0.19) (0.22) (0.15)Household Size 0.11 0.14 0.12 0.11 0.13 0.14 0.12
(0.02) (0.02) (0.02) (0.02) (0.02) (0.02) (0.02)Number of Children <14years -0.14 -0.16 -0.14 -0.14 -0.16 -0.15 -0.14
(0.04) (0.04) (0.04) (0.04) (0.04) (0.04) (0.04)PerCapita HH Exp (X 106) 0.63 0.70 0.73 0.65 0.71 0.69 0.75
(0.16) (0.17) (0.00) (0.16) (0.17) (0.17) (0.16)Urban(=1) 0.27 0.32 0.20 0.19 0.24 0.10
(0.09) (0.17) (0.08) (0.09) (0.16) (0.09)Received Benefit from Comm Org? 1.57 1.55 1.95 1.49 1.52 1.45 2.01
(0.07) (0.08) (0.27) (0.08) (0.08) (0.08) (0.27)Community-Specific VariablesLog Population Size 0.00 -0.02 -0.06 0.03 0.02 0.00
(0.05) (0.10) (0.05) (0.06) (0.10) (0.05)Govt. Spending (per capita) -0.05 -0.06 -0.06 -0.02 -0.03 -0.03
(0.02) (0.04) (0.02) (0.02) (0.03) (0.02)Average Expenditure(X 106) 1.70 2.04 2.15 1.10 1.32 1.16
(0.44) (0.74) (0.00) (0.45) (0.74) (0.43)Gini Coefficient -3.33 -4.05 -3.37 -2.99 -3.68 -2.85
(0.85) (1.58) (0.80) (0.85) (1.56) (0.82)No of Community Programs 0.01 0.01 0.02 0.01 0.01 0.02
(0.01) (0.02) (0.01) (0.01) (0.02) (0.01)Ethnic Diversity Index -0.47 -0.47 -0.59
(0.16) (0.30) (0.16)Share of Ethnic Community receiving benefits ? 0.28 0.09 -0.31 0.53
(0.47) (0.61) (0.70) (0.45)Share of Community receiving benefits? 0.95 1.30 1.59
(0.49) (0.69) (0.47)Number of observations 5195 5195 5195 5195 5195 5025 5195Pseudo R2 0.20 0.14 0.20 0.15Log likelihood -2836.8 -2711.9 -3053.4 -2824.2 -2707.1 -2078.3 -3004.6Standard errors are shown in parentheses. All regressions include province dummies. We exclude Jakarta from our analysis. In addition, we restrict our sample to include only IFLS communities where village population >10. In the instrumental variable (IV) specifications, shown in columns 3 and 7, we instrument for the household's self-reportedreceipt status. Random and fixed-effects specifications are at the community-level.
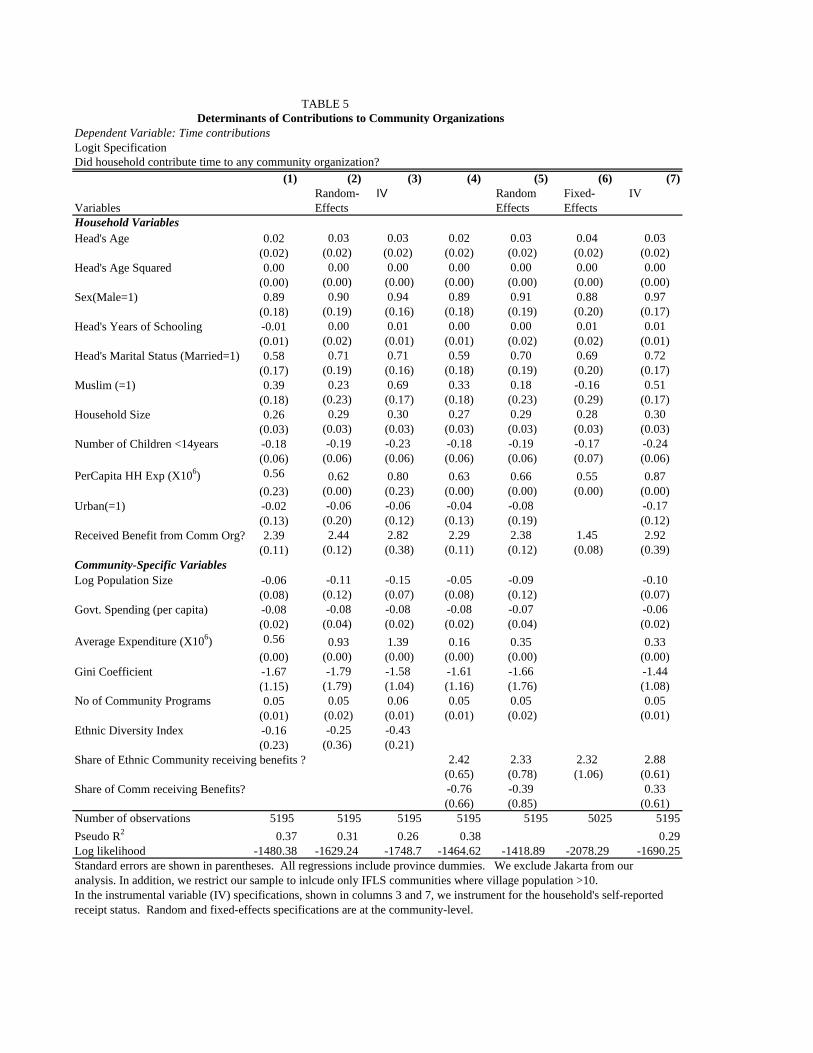
TABLE 5Determinants of Contributions to Community Organizations
Dependent Variable: Time contributionsLogit SpecificationDid household contribute time to any community organization?
(1) (2) (3) (4) (5) (6) (7)Random- IV Random Fixed- IV
Variables Effects Effects EffectsHousehold VariablesHead's Age 0.02 0.03 0.03 0.02 0.03 0.04 0.03
(0.02) (0.02) (0.02) (0.02) (0.02) (0.02) (0.02)Head's Age Squared 0.00 0.00 0.00 0.00 0.00 0.00 0.00
(0.00) (0.00) (0.00) (0.00) (0.00) (0.00) (0.00)Sex(Male=1) 0.89 0.90 0.94 0.89 0.91 0.88 0.97
(0.18) (0.19) (0.16) (0.18) (0.19) (0.20) (0.17)Head's Years of Schooling -0.01 0.00 0.01 0.00 0.00 0.01 0.01
(0.01) (0.02) (0.01) (0.01) (0.02) (0.02) (0.01)Head's Marital Status (Married=1) 0.58 0.71 0.71 0.59 0.70 0.69 0.72
(0.17) (0.19) (0.16) (0.18) (0.19) (0.20) (0.17)Muslim (=1) 0.39 0.23 0.69 0.33 0.18 -0.16 0.51
(0.18) (0.23) (0.17) (0.18) (0.23) (0.29) (0.17)Household Size 0.26 0.29 0.30 0.27 0.29 0.28 0.30
(0.03) (0.03) (0.03) (0.03) (0.03) (0.03) (0.03)Number of Children <14years -0.18 -0.19 -0.23 -0.18 -0.19 -0.17 -0.24
(0.06) (0.06) (0.06) (0.06) (0.06) (0.07) (0.06)PerCapita HH Exp (X106) 0.56 0.62 0.80 0.63 0.66 0.55 0.87
(0.23) (0.00) (0.23) (0.00) (0.00) (0.00) (0.00)Urban(=1) -0.02 -0.06 -0.06 -0.04 -0.08 -0.17
(0.13) (0.20) (0.12) (0.13) (0.19) (0.12)Received Benefit from Comm Org? 2.39 2.44 2.82 2.29 2.38 1.45 2.92
(0.11) (0.12) (0.38) (0.11) (0.12) (0.08) (0.39)Community-Specific VariablesLog Population Size -0.06 -0.11 -0.15 -0.05 -0.09 -0.10
(0.08) (0.12) (0.07) (0.08) (0.12) (0.07)Govt. Spending (per capita) -0.08 -0.08 -0.08 -0.08 -0.07 -0.06
(0.02) (0.04) (0.02) (0.02) (0.04) (0.02)Average Expenditure (X106) 0.56 0.93 1.39 0.16 0.35 0.33
(0.00) (0.00) (0.00) (0.00) (0.00) (0.00)Gini Coefficient -1.67 -1.79 -1.58 -1.61 -1.66 -1.44
(1.15) (1.79) (1.04) (1.16) (1.76) (1.08)No of Community Programs 0.05 0.05 0.06 0.05 0.05 0.05
(0.01) (0.02) (0.01) (0.01) (0.02) (0.01)Ethnic Diversity Index -0.16 -0.25 -0.43
(0.23) (0.36) (0.21)Share of Ethnic Community receiving benefits ? 2.42 2.33 2.32 2.88
(0.65) (0.78) (1.06) (0.61)Share of Comm receiving Benefits? -0.76 -0.39 0.33
(0.66) (0.85) (0.61)Number of observations 5195 5195 5195 5195 5195 5025 5195Pseudo R2 0.37 0.31 0.26 0.38 0.29Log likelihood -1480.38 -1629.24 -1748.7 -1464.62 -1418.89 -2078.29 -1690.25Standard errors are shown in parentheses. All regressions include province dummies. We exclude Jakarta from our analysis. In addition, we restrict our sample to inlcude only IFLS communities where village population >10. In the instrumental variable (IV) specifications, shown in columns 3 and 7, we instrument for the household's self-reportedreceipt status. Random and fixed-effects specifications are at the community-level.

TABLE 6Determinants of Contributions to Community OrganizationsMarginal Effect of Changes in independent variables
Dependent Variable: Monetary Dependent Variable: Time Contribution
Did household contribute to any community organization?Logit Specification
(1) (2) (3) (4)VariableHousehold VariablesHead's Age -0.0035 -0.0032 0.0015 0.0015
Head's Age Squared 0.00003 0.00002 -0.00003 ** -0.00003 **
Sex(Male=1) 0.0505 0.0510 0.0586 *** 0.0570 ***
Head's Years of Schooling 0.0068 *** 0.0068 *** -0.0004 -0.0002
Head's Marital Status (Married=1) 0.0476 0.0463 0.0381 *** 0.0379 ***
Muslim (=1) 0.0461 *** 0.0322 0.0255 ** 0.0212 *
Household Size 0.0277 *** 0.0275 *** 0.0173 *** 0.0173 ***
Number of Children <14years -0.0331 *** -0.0341 *** -0.0120 *** -0.0117 ***
PerCapita HH Exp(X 106) 0.1510 *** 0.1550 *** 0.0369 ** 0.0402 **
Urban(=1) 0.0641 *** 0.0458 ** -0.0015 -0.0024
Received Benefit from Comm Org? 0.3784 *** 0.3587 *** 0.1581 *** 0.1468 ***Community-Specific VariablesLog Population Size -0.0003 0.0082 -0.0042 -0.0031
Government Spending (per capita) -0.0114 ** -0.0059 -0.0054 *** -0.0051 ***
Per Capita Average Expenditure 0.4100 *** 0.2640 ** 0.0367 0.0104 ***(X 106)Gini Coefficient -0.8023 *** -0.7188 *** -0.1100 -0.1034
No of Community Programs 0.0025 0.0021 0.0031 *** 0.0030 ***
Ethnic Diversity Index -0.1139 *** -0.0103
Share of Ethnic Community receiving benefits ? 0.0671 0.1552 ***
Share of Community receiving benefits? 0.2293 ** -0.0487Number of observations 5195 5195 5195 5195Pseudo R2 0.20 0.20 0.38 0.38Log likelihood -2836.82 -28240.24 -14800.38 -14640.62Marginal Effects are evaluated at the sample means for continuous variables. Standard errors are shown in parentheses. All regressions include province dummies , excluding Jakarta. In addition, we restrict our sample to IFLS communities where village population>10. * denotes significance at the 10 percent level of significance, ** at the 5 percent level and, *** at the 1 percent level. In the instrumental variable (IV) specifications, shown in columns 3 and 7, we instrument for the household's self-reportedreceipt status. Random and fixed-effects specifications are at the community-level.

TABLE 7
Determinants of Transfers to Community OrganizationsDependent Variable: Amount Contributed
Total Amount Transferred (in Rupiah) Total Time Spent (in hours)Tobit Specification mean=21150.91 std. dev.=93435.09 mean=346.50 std. Dev=1356.66
(1) (2) (3) (4) (5) (6)Median Median
Variables Tobit Regression Tobit Tobit Regression TobitHousehold VariablesHead's Age -89.66 -18.39 -47.46 38.98 *** 2.49 *** 39.08 ***
(1153.64) (15.05) (1153.24) (11.82) (0.72) (11.84)Head's Age Squared -1.07 0.19 -1.86 -0.45 *** -0.03 *** -0.45 ***
(11.10) (0.15) (11.09) (0.11) (0.01) (0.11)Sex(Male=1) 23141.66 ** 205.45 *** 23398.73 ** 280.98 *** 28.21 *** 281.11 ***
(9622.48) (83.80) (9603.73) (97.04) (5.97) (97.12)Head's Years of Schooling 1926.61 *** 27.27 *** 1895.39 *** -4.31 0.70 * -4.47
(598.91) (8.56) (599.02) (6.16) (0.39) (6.18)Head's Marital Status (Married=1) -418.54 -56.22 -612.94 164.56 * -0.96 161.89 *
(9942.48) (143.76) (9925.33) (100.01) (6.14) (100.10)Muslim (=1) 20058.79 ** 200.30 20039.04 ** 214.84 ** 5.78 190.10 *
(10154.33) (144.40) (10110.90) (101.77) (6.14) (100.83)Household Size 6018.09 *** 91.06 *** 6036.01 *** 75.92 *** 4.22 *** 75.56 ***
(1160.37) (17.55) (1158.00) (11.96) (0.75) (11.96)Number of Children <14years -6538.66 ** -80.44 ** -6661.31 ** -86.41 *** -3.02 * -87.42 ***
(2656.27) (40.10) (2652.68) (26.88) (1.71) (26.90)Per Capita HH Exp (X 106)
72084.20 *** 2947.60 *** 72526.80***
35.60 4.72 36.60(8761.90) (146.00) (8748.40) (97.70) (6.15) (97.80)
Urban(=1) 10317.14 * 321.18 *** 7379.08 -62.99 6.39 -81.18(6205.51) (93.44) (6185.41) (62.86) (3.98) (62.60)
Received Benefit from Comm Org? 94920.35 *** 1295.36 *** 88803.68 *** 781.91 *** 53.33 *** 776.91 ***(5588.14) (75.39) (5673.72) (51.86) (3.21) (53.13)
Community-Specific VariablesLog Population Size 3088.36 9.42 5204.59 30.36 5.25 ** 34.90
(3842.52) (57.12) (3854.30) (38.90) (2.43) (39.13)Govt. Spending (per capita) -2001.77 -6.25 -1436.37 -50.96 *** -0.67 -43.62 ***
(1346.07) (18.49) (1305.79) (13.40) (0.79) (12.93)Average Expenditure (X 106) 22694.20 2756.40 *** 10220.10 146.30 -19.50 37.70
(27429.00) (436.10) (27819.20) (291.40) (18.50) (296.10)Gini Coefficient -68070.26 -3312.86 *** -45438.61 63.37 -42.18 120.57
(57759.43) (884.10) (57936.14) (614.34) (37.61) (616.81)No of Community Programs 1166.17 * -5.75 842.96 31.50 *** 1.50 *** 32.31 ***
(703.06) (10.51) (701.39) (7.13) (0.45) (7.13)Ethnic Diversity Index -4291.03 -895.51 *** -203.79 * -36.23 ***
(11622.09) (169.60) (114.59) (7.19)Share of Ethnic Community that received benefits ? -1140.70 105.98
(31890.15) (331.38)Share of Community receiving Benefits? 79979.19 ** 19.95
(33640.08) (348.02)Number of observations 5195 5195 5195 5195 5195 5195Log likelihood -30733.45 -30719.14 -37020.51 -37021.72Pseudo R2 0.02 0.01 0.02 0.01 0.05 0.01Standard errors are shown in parentheses. All regressions include province dummies. We exclude Jakarta from our analysis. In addition, we restrict our sample to include only IFLS communities where village population >10. * denotes significance at the 10 percent level of significance, ** at the 5 percent level and, *** at the 1 percent level
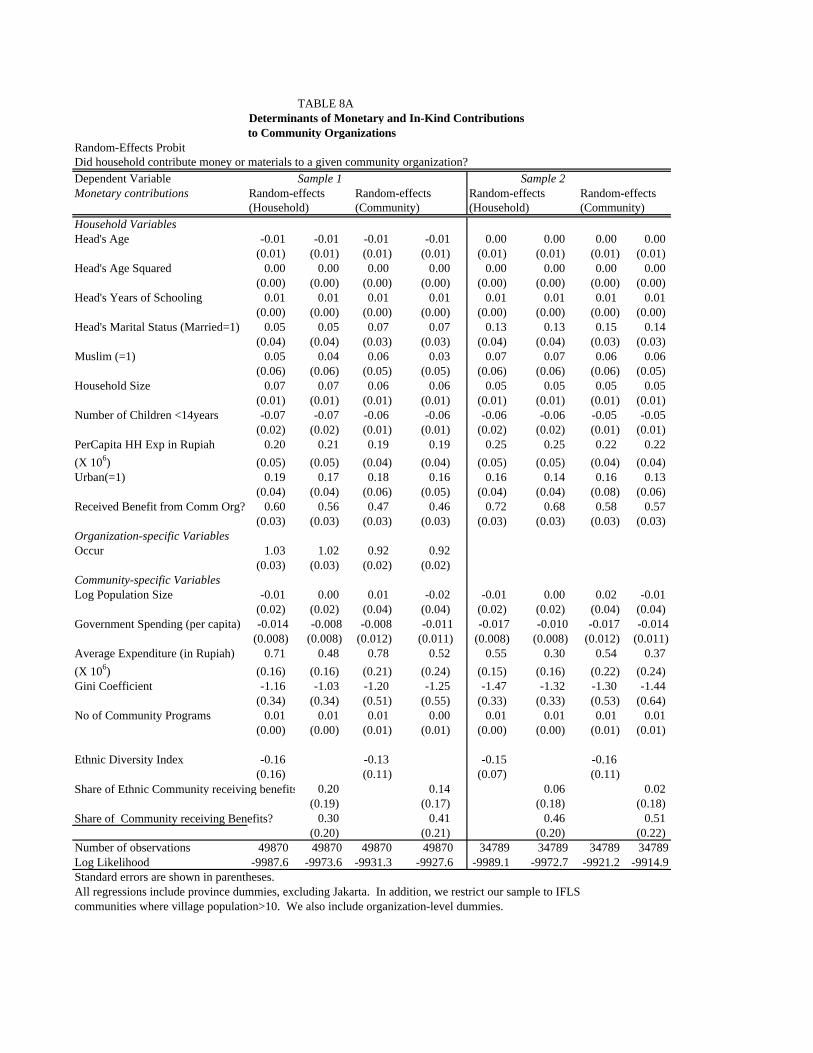
TABLE 8ADeterminants of Monetary and In-Kind Contributionsto Community Organizations
Random-Effects ProbitDid household contribute money or materials to a given community organization?Dependent Variable Sample 1 Sample 2Monetary contributions Random-effects Random-effects Random-effects Random-effects
(Household) (Community) (Household) (Community)Household VariablesHead's Age -0.01 -0.01 -0.01 -0.01 0.00 0.00 0.00 0.00
(0.01) (0.01) (0.01) (0.01) (0.01) (0.01) (0.01) (0.01) Head's Age Squared 0.00 0.00 0.00 0.00 0.00 0.00 0.00 0.00
(0.00) (0.00) (0.00) (0.00) (0.00) (0.00) (0.00) (0.00) Head's Years of Schooling 0.01 0.01 0.01 0.01 0.01 0.01 0.01 0.01
(0.00) (0.00) (0.00) (0.00) (0.00) (0.00) (0.00) (0.00) Head's Marital Status (Married=1) 0.05 0.05 0.07 0.07 0.13 0.13 0.15 0.14
(0.04) (0.04) (0.03) (0.03) (0.04) (0.04) (0.03) (0.03) Muslim (=1) 0.05 0.04 0.06 0.03 0.07 0.07 0.06 0.06
(0.06) (0.06) (0.05) (0.05) (0.06) (0.06) (0.06) (0.05) Household Size 0.07 0.07 0.06 0.06 0.05 0.05 0.05 0.05
(0.01) (0.01) (0.01) (0.01) (0.01) (0.01) (0.01) (0.01) Number of Children <14years -0.07 -0.07 -0.06 -0.06 -0.06 -0.06 -0.05 -0.05
(0.02) (0.02) (0.01) (0.01) (0.02) (0.02) (0.01) (0.01) PerCapita HH Exp in Rupiah 0.20 0.21 0.19 0.19 0.25 0.25 0.22 0.22(X 106) (0.05) (0.05) (0.04) (0.04) (0.05) (0.05) (0.04) (0.04) Urban(=1) 0.19 0.17 0.18 0.16 0.16 0.14 0.16 0.13
(0.04) (0.04) (0.06) (0.05) (0.04) (0.04) (0.08) (0.06) Received Benefit from Comm Org? 0.60 0.56 0.47 0.46 0.72 0.68 0.58 0.57
(0.03) (0.03) (0.03) (0.03) (0.03) (0.03) (0.03) (0.03) Organization-specific VariablesOccur 1.03 1.02 0.92 0.92
(0.03) (0.03) (0.02) (0.02) Community-specific VariablesLog Population Size -0.01 0.00 0.01 -0.02 -0.01 0.00 0.02 -0.01
(0.02) (0.02) (0.04) (0.04) (0.02) (0.02) (0.04) (0.04) Government Spending (per capita) -0.014 -0.008 -0.008 -0.011 -0.017 -0.010 -0.017 -0.014
(0.008) (0.008) (0.012) (0.011) (0.008) (0.008) (0.012) (0.011)Average Expenditure (in Rupiah) 0.71 0.48 0.78 0.52 0.55 0.30 0.54 0.37(X 106) (0.16) (0.16) (0.21) (0.24) (0.15) (0.16) (0.22) (0.24) Gini Coefficient -1.16 -1.03 -1.20 -1.25 -1.47 -1.32 -1.30 -1.44
(0.34) (0.34) (0.51) (0.55) (0.33) (0.33) (0.53) (0.64) No of Community Programs 0.01 0.01 0.01 0.00 0.01 0.01 0.01 0.01
(0.00) (0.00) (0.01) (0.01) (0.00) (0.00) (0.01) (0.01)
Ethnic Diversity Index -0.16 -0.13 -0.15 -0.16(0.16) (0.11) (0.07) (0.11)
Share of Ethnic Community receiving benefits ? 0.20 0.14 0.06 0.02(0.19) (0.17) (0.18) (0.18)
Share of Community receiving Benefits? 0.30 0.41 0.46 0.51(0.20) (0.21) (0.20) (0.22)
Number of observations 49870 49870 49870 49870 34789 34789 34789 34789Log Likelihood -9987.6 -9973.6 -9931.3 -9927.6 -9989.1 -9972.7 -9921.2 -9914.9Standard errors are shown in parentheses. All regressions include province dummies, excluding Jakarta. In addition, we restrict our sample to IFLS communities where village population>10. We also include organization-level dummies.

TABLE 8BDeterminants of Time Contributionsto Community Organizations (IFLS2)
Random-effects ProbitDid household contribute time to a given community organization?Dependent Variable Sample 1 Sample 2Time Contributions Random-effects Random-effects Random-effects Random-effects
(Household) (Community) (Household) (Community)Household VariablesHead's Age 0.00 0.00 0.00 0.00 0.02 0.02 0.02 0.02
(0.01) (0.01) (0.00) (0.00) (0.01) (0.01) (0.00) (0.00) Head's Age Squared 0.00 0.00 0.00 0.00 0.00 0.00 0.00 0.00
(0.00) (0.00) (0.00) (0.00) (0.00) (0.00) (0.00) (0.00) Head's Years of Schooling 0.01 0.01 0.01 0.01 0.01 0.01 0.01 0.01
(0.00) (0.00) (0.00) (0.00) (0.00) (0.00) (0.00) (0.00) Head's Marital Status (Married=1) 0.32 0.32 0.28 0.28 0.39 0.39 0.36 0.36
(0.03) (0.03) (0.03) (0.03) (0.03) (0.03) (0.02) (0.02) Muslim (=1) 0.18 0.18 0.18 0.18 0.16 0.16 0.17 0.16
(0.05) (0.05) (0.05) (0.05) (0.05) (0.04) (0.04) (0.05) Household Size 0.11 0.11 0.10 0.10 0.07 0.07 0.07 0.07
(0.01) (0.01) (0.00) (0.00) (0.01) (0.01) (0.00) (0.00) Number of Children <14years -0.09 -0.09 -0.08 -0.08 -0.05 -0.06 -0.05 -0.05
(0.01) (0.01) (0.01) (0.01) (0.01) (0.01) (0.01) (0.01) PerCapita HH Exp in Rupiah 0.03 0.03 0.03 0.03 0.07 0.07 0.07 0.07(X 106) (0.04) (0.04) (0.03) (0.03) (0.04) (0.04) (0.03) (0.03) Urban(=1) -0.01 -0.03 -0.02 -0.03 0.00 -0.02 -0.02 -0.04
(0.03) (0.03) (0.04) (0.04) (0.03) (0.03) (0.04) (0.04) Received Benefit from Comm Org? 0.61 0.58 0.55 0.54 0.74 0.70 0.66 0.64
(0.02) (0.03) (0.02) (0.02) (0.02) (0.02) Organization-specific VariablesOccur 1.68 1.67 1.55 1.55
(0.02) (0.02) (0.02) (0.02) Community-specific VariablesLog Population Size -0.04 -0.02 -0.03 -0.02 -0.03 -0.01 -0.02 0.00
(0.02) (0.02) (0.03) (0.03) (0.02) (0.02) (0.03) (0.03) Government Spending (per capita) 0.001 0.005 -0.001 0.003 -0.003 0.002 -0.003 0.000
(0.006) (0.006) (0.009) (0.008) (0.006) (0.006) (0.009) (0.009)Average Expenditure (in Rupiah) 0.10 -0.11 0.11 -0.09 0.04 -0.19 0.06 -0.15(X 106) (0.13) (0.13) (0.17) (0.18) (0.12) (0.12) (0.18) (0.18) Gini Coefficient 0.01 0.09 0.09 0.13 -0.22 -0.11 -0.21 -0.09
(0.29) (0.29) (0.41) (0.40) (0.27) (0.27) (0.42) (0.41) No of Community Programs 0.02 0.02 0.02 0.02 0.02 0.01 0.02 0.02
(0.00) (0.00) (0.00) (0.00) (0.00) (0.00) (0.00) (0.00) Ethnic Diversity Index -0.13 -0.11 -0.14 -0.13
(0.05) (0.08) (0.05) (0.08)Share of Ethnic Community receiving benefits ? 0.59 0.70 0.50 0.59
(0.15) (0.15) (0.15) (0.15) Share of Community receiving benefits? -0.05 -0.17 0.05 -0.04
(0.16) (0.17) (0.15) (0.17) Number of observations 49940 49870 49940 49870 34837 34789 34837 34789Log Likelihood -14558.8 -14505.8 -14577.2 -14532.4 -16397.1 -16341.1 -16341.2 -16300.5 Standard errors are shown in parentheses. All regressions include province dummies, excluding Jakarta. In addition, we restrict our sample to IFLS communities where village population>10. We also include organization-level dummies.

TABLE 8C
Determinants of Contributions to Community OrganizationsMarginal Effect of Changes in independent variables
Did household contribute to a given community organization?Dependent Variable: Monetary Dependent Variable: Time
ContributionCommunity Random-Effects Probit Specification
(1) (2) (3) (4)VariableHousehold VariablesHead's Age 0.000 0.000 0.006 *** 0.006 ***Head's Age Squared 0.000 0.000 0.000 *** 0.000 ***Sex (Male=1)Head's Years of Schooling 0.001 *** 0.001 *** 0.003 *** 0.003 ***Head's Marital Status (Married=1) 0.018 *** 0.018 *** 0.110 *** 0.111 ***Muslim (=1) 0.008 0.007 0.051 *** 0.049 ***Household Size 0.006 *** 0.006 *** 0.021 *** 0.021 ***Number of Children <14years -0.006 *** -0.006 *** -0.016 *** -0.016 ***PerCapita HH Exp (X 106) 0.028 *** 0.028 *** 0.022 ** 0.023 **Urban(=1) 0.020 ** 0.016 ** -0.005 -0.012Received Benefit from Comm Org? 0.072 *** 0.070 *** 0.201 *** 0.197 ***
Community-Specific VariablesLog Population Size 0.002 -0.001 -0.006 -0.001Government Spending (per capita) -0.002 -0.002 -0.001 0.000Per Capita Average Expenditure 0.068 *** 0.046 0.019 -0.045(X 106)Gini Coefficient -0.163 *** -0.177 ** -0.063 -0.026No of Community Programs 0.001 0.001 0.006 *** 0.005 ***Ethnic Diversity Index -0.020 -0.040 &
Share of Ethnic Community receiving benefits ? 0.002 0.181 ***Share of Community receiving Benefits? 0.062 ** -0.012Number of observations 34789 34789 34837 34789
Log likelihood -9921.23 -9914.87 -16341.18 -16300.53Marginal Effects are evaluated at the sample means for continuous variables. Standard errors are shown in parentheses. All regressions include province dummies , excluding Jakarta. In addition, we restrict our sample to IFLS communities where village population>10. * denotes significance at the 10 percent level of significance, ** at the 5 percent level, *** at the 1 percent level, & denotes significance at the 11 percent level. Results shown here are based only on communities where organizations are in existence (Sample 2)

TABLE 9
Understanding the Prevalenceof Community Organizations
Dependent Variable: occur(1) (2) (3)
Variable OLS IV ProbitMarginal CoefficientEffect
Community-Specific VariablesEthnic -0.05 * -0.11 *** -0.08 -0.23 *
(0.02) (0.05) (0.12)
Average Expenditure in Rupiah (X 106) 0.09 * 0.05 0.17 0.48 *(0.05) (0.06) (0.29)
Government Spending (per capita) -0.003 -0.03 -0.003 -0.01(0.002) (0.02) (0.01)
Average Years of Schooling 0.01 *** 0.01 *** 0.01 0.02(0.003) (0.003) (0.015)
Gini Coefficient -0.11 -0.04 0.33 0.95(0.11) (0.14) (0.61)
Number of obs = 2700 2690 2700Adjusted R-squared 0.06Wald chi2-Statistic = 159.83 139.16 76.43RANDOM EFFECTS (community-level) YES YES YESMarginal Effects are calculated at the mean. Standard errors are shown in parentheses. All regressions include province dummies. We exclude Jakarta from our analysis. In addition, we restrict our sample to IFLS communities where village population>10. * denotes significance at the 10 percent level of significance, ** at the 5 percent level and, *** at the 1 percent levelResults also includes controls for log population and urbanization. Constant term is not shown.In the instrumental variable specification (column 2), we instrument for government spending.

Appendix A
Ethno-Linguistic Groups in the Indonesia Family Life Surveys 1997/98 (IFLS2)
Main Language Spoken at Home Percentage of Sample
1 Bahasa Indonesia 132 Javanese 40.193 Sundanese 11.24 Balinese 4.125 Batak 2.866 Bugis 3.397 Chinese 0.758 Maduranese 3.489 Sasak 3.54
10 Minang 4.8911 Banjar 3.5512 Bima 1.4613 Makassar 0.9714 Nias 0.3615 Palembang 0.9516 Sumbawa 0.7917 Toraja 0.5118 Lahat 0.4619 Oth SumSel 1.8720 Betawi 0.3721 Lampung 0.4122 Other 0.89