unclassified ad 40053 - defense technical … of the operation of a centrifugal compressor wheel, s....
TRANSCRIPT

UNCLASSIFIED
AD_ 40053
ARMED SERVICES TECHiNICAL INFORMATION AGENCYARLINGTON HALL STATIONARLINGTON 12,, VIRGINIA
UNCLASSIFIED

NOTICE: When government or other drawings, speci-fications or other dsta a.-e used for any purposeother than in connection vith a definitely relatedgovernment procurement operation, the U. S.Government thereby incurs no responsibility, nor anyobligation whatsoever; and the fact that the Govern-ment may have formulated, furnished, or in any waysuppl~ed the said drawings, specifications, or otherdata is not to be regarded by implication or other-wise as in any manner licensing the holder or anyother person or corporation, or conveying any rightsor permission to manufacture, use or sell anypatented invention that may in any way be relatedthereto.

FTD-TTf 2-181 6
TRANSLATION
POWER MACHINE CONSTRUCTION( SELECTED ARTICLES )
LLJ
i FOREIGN TECHNOLOGY
DIDVISION
AIR FORCE SYSTEMS COMMAND
WRIGHT-PATTERSON AIR FORCE BASE
OHIO

FTD-1T-62-1816-±+21-
UNEDITED ROUGH DRAFT TRANSLATION
POWER MACHINE CONSTRUCTION (SELECTED ARTICLES)
English Pages: 80
Source: Russian Periodical, Energomashinostroyeniye,No. 221, 1962, pp. 5-16, 17-31, 32-46, 103-109.
SC-1708-17iiSOV/563-62-0-221
THIS TRANSLATION IS A RENDITION OF THE ORIGI-NAL FOREIGN TEXT WITHOUT ANY ANALYTICAL OREDITORIAL COMMENT. STATEMENTS OR THEORIES PREPARED BYmADVOCATED OR IMPLIED ARE THOSE OF THE SOURCEAND DO NOT NECESSARILY REFLECT THE POSITION TRANSLATION SERVICES BRANCHOR OPINION OF THE FOREIGN TECHNOLOGY DI- FOREIGN TECHNOLOGY DIVISIONVISION. WP.APD, OHIO.
HFD1-T-62-18:16-i+2+4 Date 4 March 19 63

TABEL OF CONTENTS
Page
Study of the Operation of a Centrifugal Compressor Wheel,S. A. A sio ... .. .. . .. ... .. .. ..... *.... 0*.... ... ..
The Influence of the Number of Vanes on the Efficiency of theCentrifugal Wheel with a Single-Stage Cascade, S. A. Anisimov.... 20
Study of the Efficiency of Centrifugal Compressor Wheels witha Two-Stage Vane Cascade, M. I. Kalinina..........................44
Calculation of Variable Regimes of Cascade Flow. V. A.Zysin.................................................. ........... 69
PTD-TT-62-1816/1+2+4

STUDY OF THE OPERATION OF A CENTRIFUGAL COMPRESSOR WHEEL*
S. A. Anisimov
The problem of creating highly efficient centrifugal compressors,
at the modern level of the development of the theory of these machines,
when theoretical methods alone do not assure sufficiently reliable
results, can be successfully solved only by means of appropriate
experimental work. Of great significance along these lines are
experimental studies of centrifugal compressor wheels; when evaluating
the efficiency of operation of the wheels it is necessary to take into
account not only the basic characteristics of the wheel itself, but
also the effect that the wheel has on the operation of the fixed
elements, mainly on the diffusor. In other words, the operational
efficiency of a wheel should be Judged not only on the basis of its
characteristics, but also on the basis of the structure of the flow
behind the wheel.
The studies were made on the ETsK-1 stand at the Compressor
Laboratory of the Kalinin Leningrad Polytechnic Institute [i]. In
all, we studied 10 double-shrouded wheels with single-stage cascades;
* Docent K. P. Seleznev and Senior Engineer F. S. Rekstinparticipated in the work.
nD-TT-62-i8i6-1+2+4 -i-
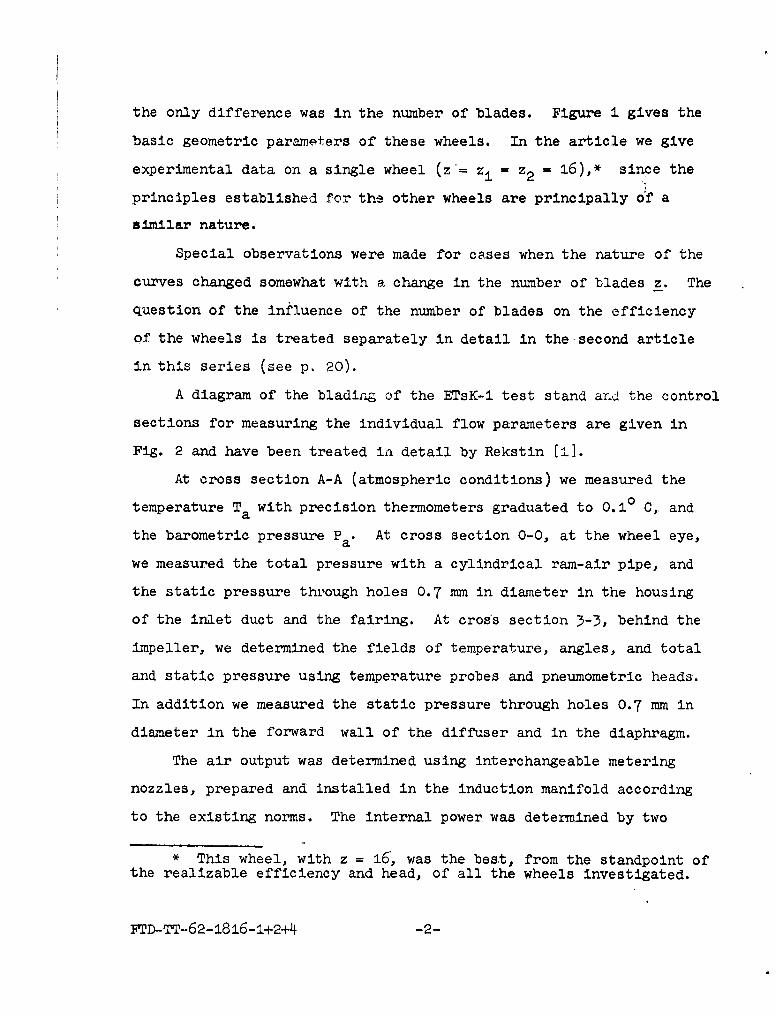
the only difference was in the number of blades. Figure I gives the
basic geometric parameters of these wheels. In the article we give
experimental data on a single wheel (z z1 = z 2 = 16),* since the
principles established fo- the other wheels are principally of a
similar nature.
Special observations were made for cases when the nature of the
curves changed somewhat with a change in the number of blades z. The
question of the influence of the number of blades on the efficiency
of the wheels is treated separately in detail in the-second article
in this series (see p. 20).
A diagram of the bladin-g of the ETsK-i test stand and the control
sections for measuring the individual flow parameters are given in
Fig. 2 and have been treated in detail by Rekstin [11.
At cross section A-A (atmospheric conditions) we measured the
temperature Ta with precision thermometers graduated to 0.10 C, and
the barometric pressure P a At cross section 0-0, at the wheel eye,
we measured the total pressure with a cylindrical ram-air pipe, and
the static pressure through holes 0.7 mm in diameter in the housing
of the inlet duct and the fairing. At cross section 3-3, behind the
impeller, we determined the fields of temperature, angles, and total
and static pressure using temperature probes and pneumometric heads.
In addition we measured the static pressure through holes 0.7 mm in
diameter in the forward wall of the diffuser and in the diaphragm.
The air output was determined using interchangeable metering
nozzles, prepared and installed in the induction manifold according
to the existing norms. The internal power was determined by two
* This wheel, with z = 16, was the best, from the standpoint ofthe realizable efficiency and head, of all the wheels investigated.
FTD-TT-62-i8i6-i+2+4 -2-

methods: by the drop in total pressure and by the reactive moment in
the housing of the electric rotor with a pivoting stator.
The number of revolutions of the shaft of the experimental stage
was measured from the readings of an electrical tachometer and a
total revolution counter.
The wheels were tested for a constant number of revolutions,
n = 14,900 rpm (u 2 = 214.5 m/sec).
To evaluate the efficiency of the wheels we used the following
criterional parameters: the adiabatic efficiency, by the total para-
meters 7 and its relative value a; the head coefficients t*, I,
and T; the degrees of reaction Q and p; the coefficients of relative
nonuniformity of flow ka, kG, %a and kh i; the absolute nonuniformity
of flow Aa; and the M and Re numbers. As the independent determining
parameter we selected the flow factor T (sometimes p) and the
angle of attack i. which is practically always associated with it.*
In our studies the Re number was arbitrarily determined, as is
often done in the theory of centrifugal compressors, according to the
formulaRe : -,, zoog
6and was within the limits (3.1-3.6) x 10
The parameters were averaged in various ways. The average values
of the parameters P0, P, and Ta were determined as the arithmetic
means. The average values of the parameters • and haý were found
* The arbitrary designations used in the article, with few excep-tions, are the same as the generally-accepted ones [2]. If not,explanations are given in the text.
The subscript of the parameters indicates the number of thecontrol section to which the parameters pertain. The parametersbehind the wheel, in cross section 3-3, are written without a sub-script.
F3'D-TT-62-1816-I+2+4 --

fo previously averaged values of P0 P, and T The average values
aaof the parameters 'r, •r*, q, a, h•, hi, and &2 were round by averag-
ing their local values with respect to the flow. The average flow
values 0 and rp were determined by measuring with a planimetei-.
i. Results oir the Investigationandpf -* ( ),
1. Figure 3 shows the dependences j* = f(O) fP
where
•,= = __N '-G:. h"_a (2)
-"a (2')
k--!
h kam I PTR (3)h, =""( T * -To);
,. -' . (5)
For the value of qPo when n max and a we used, respectively,pmax lmaxthe designations qPoOPt and 1PoCr.
The curve f(c ) has an extreme value. The drop in effi-
ciency to the. left and to the right of the extreme value is explained
by the large positive and negative angles of attack which cause a
deterioration in the aerodynamics of the flow in the wheel, and by
the appearance of developed separation zones.
The experimental data on 7a6 obtained by various methods - accord-
ing to temperatures (ha T) and using a pendulum-motor (ra pm) - are
in good agreement. The maximum value of the efficiency attained for
the given wheel • T max = 0.9.
The nature of the curve = f(( ) depends on the number of
blades. With a decrease in z the maximum efficiency is weakly
-4-

expressed, while when z -5 6 it is generally not expressed at all.
2. The head coefficients shown in Fig. 3 were determined from
the following formulas:
(6)1P* :-
2U 2
I'll (7)had).
2g (8)Cu
U,2where h°=
kRTo-O-k (9)
The curves of the head coefficients *, ?P, and 9 have an extreme
value.
In the optimum regime (at n* max) these coefficients were t*
= 1.28, o = 0.82, and @ = 0.695. For the regime iI = 0 we obtained
= 1.15, P = 0.75, and q) = 0.615.
The decrease in the head coefficients 4,* and q) with increased
flow in the region qPo > "POcr can be explained from an examination
of the Stodola formula for the coefficient T2 (considering that the
ratio /9 is, for all intents and purposes, approximately constant):r pa 2 p 0
-" -. I - x sin -pP. cot P,. sin P,, - 'PP cot pe, .p. (0O)
and on the basis of the connection between the coefficients q and ?P*:
=2(p'(1 +' %P + mP.,) Y1a8. (ii)
Formula (1i) was obtained after transformations from Formulas
(2) and (6), taking into account the relations2." (12)
-5-hr + Pp),
-5-

where, strictly speaking, by ** and 9 in Formula (11) we should under-
stand * and q2 "
In addition, a drop in ** and 9 for large 9P0 (i1 < 0) is condi-
tioned by a deterioration in the flow structure (the development of
separation zones in the wheel channels).
The decrease in the head coefficients for low flow-rates (w <p0
< 90pcr) is explained by the sharp deterioration of the flow structure
in the wheel with large positive angles of attack. In this region
Formula (10) cannot be used.
The curves ** = f(qp ) and q) = f(cp ) have approximately coin-p0 p0
cident maxima, while the curve ** = f(qpO) has great curvature. This
can be explained by the structure of Formula (ii), since the term
(I + np + mp ) * which characterizes the hydraulic energy losses
is always less than unity, and in the investigated regime range is
practically greater than 0.5.
The curvature of the curves 9 = f(qp ) and 4* = f(qp ) dependsp0 p0
on the number of blades. With decreasing z the curves become more
sloping, so that at small z the maximum of the head coefficients is
weakly expressed, while when z as 6 it is practically nonexistent.
3. The degrees of reaction n and p were determined from the
following formulas:
hr hr.'
h.' h'a-ha ha 'P.
where
2Ug
Formulas (14) and (15), after appropriate transformations, can be
reduced to the following approximate form which is convenient for
analysis:
-6-

2 2
/= - - , (45')
21 (I +P .,+p)rn 9,0 2 (1 + Pnp + ,,p)"1',
since, for all practical purposes, 2 >> q2 -_ p2 , and therefore the
difference (qP - •2 ) in these formulas can be disregarded.• P0
S The curves a = f(9O ) and p = f(p ) throughout the entire flow
range, except for the region of large (PO, are of identical nature.
In this case, in the region of operating regimes (when pO > qcr)P 0 p 0 cr
with increasing T the value of S continually increases, while the00
value of p first increases and then (at large _P ) begins to decrease
somewhat. This latter fact can be explained by the influence of
energy losses. Quantitatively, n and p differ little from one another,
except for the region of large 9 •P0
The nature of the change in the degree of reaction with a change
in flow rate can be explained using Formulas (14f) and (15'). Since
(p2 2 0)<< T 2 , and it changes relatively insignificantly, we can
conclude that the nature of the change in n will be approximately
the reverse of the change in the value of p. The value of p, as can
be seen from Formula (15'), also depends on the energy losses; there-
fore its relation with T will not be quite so simple. Since the
value of (i + np + mp) n*ý is always less than unity in all operat-
ing regimes, and since the adiabatic efficiency takes into account,
in addition to leakage and web losses, losses in the blading of the
wheel, it follows from Formulas (141) and (15') that n > p. This is
also confirmed by experimental data: in the optimum regime n = 0.68
and p - 0.64, while in the regime i i = 0 we obtained S1 = 0.75 and
p - 0.68.
4. The curve qp = c u 2 = f( po) has a dependence which is

close to linear, with a slight downward convexity (Fig. 3). In
principle, this curve should pass through the coordinate origin.
Quantitatively, cp and P0 differ little from one another, but in
this case for all operating regimes we have the inequality qP".< (P0"
Their relation in the general case is defined as follows:
T__P = c, C" G Fo P-•O C•' 0 F0 V
Analysis of the obtained experimental data shows that for the
given wheel the ratio p const.
5. The angle of attack when the flow enters the blades of the
wheel is determined from the formula
i, = - = - (p, '. D__ (17)F, D,
In this formula the inflow angle 1i was determined without taking
into account leakage through the packing on the covering disk and
blockage of the channel; in addition, it was assumed that y0 - yI.
The curve iI = f(o) ) has slight downward convexity. With
increasing P the algebraic value of ii continually decreases, which
also follows from Formula (17).
The maximum efficiency was reached at ii = +70. The location
of the optimum regime in the region of positive angles of attack can
be explaired, physically, by the fact that for normally backward bent
vanes having negative angles of curvature of the radial cascade pro-
file e = 92 - Pg2np'* positive iI decrease the fluid deflection in
* g2np is the geometric angle at which the vanes come from the
wheel, in which case for the given radial cascade we have rectilinearvanes. The values of this angle for vanes along the peripheral arc isdetermined from the formula cos Pg2np = cos ý /g(D2 /D1 ). Since in
contrifugal compressors D2 //D > 1, then Pg2np > Pgi" If D2/DI = 1,
we have, approximately, p 2np = P in the axial cascade, and conse-
quently the angle e -g*
g1 g1

the radial cascade = - 2nP + i*. (where P2 = arc tan '2p/i - (2),
which evidently has a favorable effect on the aerodynamics of the flow
in the wheel channels. For the given wheel Pg 2 np - 63057' and, conse-
quently, 0 = 490 - 63°57. = -14°571-
The regime q* max has the corresponding angle P - 30' and,
consequently, e = 37 030' - 63057t + 70 - -19 27'. Figure 3 shows the
dependences s = f(qp0) and P2 = f(po) Experimental data show that
for the investigated series of wheels the nature and position of the
curves e = f(p ) and P = f(qp ) are practically independent of thep0 0
number of vanes. For all the investigated wheels there is a sharp
increase in the angle P2 for low flow-rates, right up to ( O- 3,'"
while the minimum values of the absolute magnitudes of the angles s
are in the region Po = 0.18-0.23, close to q)Po°pt. We should mention
that for the exam'ined wheel with z = 16 which, as we have already
stated, was optimum from the standpoint of efficiency, the minimum
value of the absolute magnitude of s (jeminI - 170) was the smallest
of all the investigated wheels.
6. The general expression for determining the coefficients of
the relative nonuniformity of flow according to the angle ka, the flow
rate kG, and the absolute and internal heads k and k. shown in
Fig. 3, had the form
"kit = I "Irm..i- n (18)
where II is a measureable parameter, averaged over the width of the
channel; and Tmax and 1min are the maximum and minimum values of the
* For an axial cascade (i.e., when Pg2np p ) Pgi = p1 + i,
and.P P2 - 1gpg
** For other z's in the region o > 0.3 the intensity of the
increase in P2 also decreases, but not quite so strongly as was the
case with the given wheel.
-9-

parameter H over the width of the channel.
The larger the coefficient kn, the greater the relative nonuniform-
ity.
The relative nonuniformity of flow with respect to energy,
characterized by the coefficients 19 and kh respectively as aA6 i
function of the regime, changed but little. The absolute values of
the relative nonuniformity of the flow with respect to energy are
very small (the coefficients k , and kh are close ta zero). Aaý i
certain increase in kh* and kh is observed for negative i. (large
9 PO), and a very insignificant one is observed in the region of posi-
tive i, (small 9p.). Such an increase in the coefficients of relative
nonuniformity is evidently a result of the deterioration of the flow
structure of the impeller for rather large positive and negative
angles of attack.
The relative nonuniformity of flow with respect to flow-rate and
angle, characterized by the coefficients kG and ka, for angles of
attack i1 = 0 and regimes close to optimum, i.e., when * max is
slight acmpared with other regimes (k. - k . 0.25-0.4). For large
positive angles of attack the coefficients of nonuniformity kG and ka
greatly inerease, reaching a comparatively high value (kG - k, - -4.5).
The sharp increase in the coefficients kG and kc for low flow-rates
is explained not only by the deterioration in the flow structure, but
also by the decrease in the absolute average values of G and a. For
negative angles of attack with increasing •Po the relative nonuniform-
ity with respect to angle and flow rate increase insignificantly.
When analyzing the operation of the stage with the vaned diffuser,
a great role is played by the numerical values of the deviations of
the angle from the average angle. Figure 3 shows the dependences of
-i0-

a W f(pO ) and the absolute nonuniformity with respect to the anglep 0
Aa m asax - amin = f(Ppo). The graphs show that d, with a change in
flow rate, changes within broad limits and continually increases with
increasing P0. The curve La = f(ppO) has a minimum for regimes
corresponding approximately to r5 max and 0 0. The increase in
Aa in the region of large positive and negative angles of attack is
explained by the deterioration of the flow structure within the
impeller due to nonoptimal flow past the vaned apparatus and the
influence of bending of the flow at the wheel inlet.
In the region of the investigated regimes, the maximum value of
the absolute nonuniformity of flow with respect to the angle Aa reached
200, while for the regimes q max and i1 = 0 it was within limits of
070
7. The curves =p f(X) (Fig. 4) show that for average Po, the
maximum flow rate (maximum p ) occurs near the forward wall of the
vaneless diffuser, while for large (Po it occurs at the rear wall.
Thus, with increasing gas flow through the wheel there is a displace-
me-t of the flow naximum from the forward to the rear wall. In addi-
tion, the nature of the curves cp = f(X) attests to the fact that
neaz': -the forward wall of the diffuser the gas flow across the section,
for the majority of regimes, changes more sharply than at the rear
wall. For low flow rates, reciprocal flows are noted at the walls.
The redistribution of the flow in the meridional cross section
of the channel with increasing P can evidently be explained by thep 0
gradual development of separation behind the bend at the inlet to the
inner surfaoe of the oovering disk due to inoreased diffusivity in
-ii-

this zone with increasing c .*
8. The nature of the curves a - f(X) shown in Fig. 4 is basically
the same as that of the curves •p = f(X).
9. The curve 9 = f(X), for average and high flow rates, qualita-
tively has a shape which is approximately the opposite of that of the
curve Tp = f(X), which also follows from Formula (10). FOr low flow
rates, however, this connection is not noted, which attests to the
inapplicability of the Stodola formula when CP0 < "Pocr*
10. The curves W* f f(X) have basically the same nature as the
curves p f M).
Ii. The drop in temperature AT* characterizes, for all practical
purposes, the head hi and, consequently, to a certain extent (without
taking into account disk and slit energy losses) the coefficient p.
The nature of the change in the curves AT* = f(X) and p = f(X)
should therefore be approximately analogous, which is verified by
the derived experimental curves. Maximum deviation between the nature
of these curves is noted for low flow rates due to the relative increase
in the leakage of gas at the covering disk and disk losses, which also
follows from the theoretical relation
AT A U 0 + P . = C(0 + A + y, (19)CP p 7'
where c = (A/cp) (U2/g) = const.
12. The nature of the change in the numbers MW, M'I and Mco
and also Mco, as a function of the wheel regime is shown in Fig. 5.
These M numbers were determined as follows (Fig. 6):
* It is evident that the flow structure behind the wheel willalso be a function of the shape of the meridional cross section ofthe wheel. We can also assume that the nature of the change in thecurves cp = f(X), a = f(X), c = f(X), ?P* = f(X) and AT* = f(X) can beinfluenced by the leakage near the covering disk and through thediaphragm packing; however, this question requires special study.
-12-

M . (20)
vW.2"1J/gRT 1 'kgRT(
/ , F, sin
(22)
where
• = W, sin -, + fill sin (23)
m e •(2 4)
With increased gas flow, i.e., q•Po, the numbers Mco, Mwi and
particularly N" increase. This also follows from an analysis of
Formulas (20)-(23).
The number M. depends little on the flow rate. In an optimal
regime 0 0.17, Mw:1 0.37, Mc = 0.435, M 0.5. In the regime
11 0, M^ = 0.22, Mw = 0.4, M. = 0.415 and M" = 0.66.S•o wlAt the inlet to the impeller cascade with low flow rates (i. > 0)
there is diffusivity (Fig. 6), i.e., X /MwI < i. With increasing
flow rate the diffusivity decreases to zero and then, especially at
i± < 0, effusivity rapidly increases, i.e., M > i
The influence of the flow rate and the geometric parameters of
the wheel on the velocity w" and the number M" is evident fromth helonte eo Ityw wl
Formulas (23) and (22). The ratio sin pI/.i sin Pgi defined by the angle
of attack ii, since i1 - f(P,' g1 ), and by the restriction of the
• The superscript (1) for the parameter indicates that thegiven parameter is selected taking into account restriction of theflow by the vanes, while the superscript (") indicates, in addition,that account is taken of the bending of the flow at the inlet to anangle P . The value w" is calculated somewhat more simply, without
taking into account the change in the peometric parameters from crosssection B-B to section A-A (see Fig. 6). In the formulas it has beenassumed that TO Ti f T" andci ca
0-1 r 3 i
-13-

flow at the inlet -r, characterizes the diffusivity
(sin P1/'r 1 sin Pgi < i) or effusivity (sin P1/ ir sin Pgi > i) on entry
into the inter-vane channels of the wheel. With increasing gas flow
rate and, consequently, increasing velocitiesaz0 and Cr,, the numbers
Me PM , MM" will increase, as can be seen from Formulas (20), (21),0 1 W1
and (22). But the intensity of the increase in M~ , compared with
Mw, in this case will be greater, since the ,ratio sin P1 /sin P will
also increase due to an increase in the angle p,. Therefore with
increasing flow rate the diffusivity at the inlet to the inter-vane
channels should decrease. Theoretically, it follows from Formulas
(21), (22), and (23) that with abnormally high restriction (very low
:)., when the ratio sin Pi/r 1 sin P > I and, consequently, 11 > 1W,
the diffuser zone will generally be absent at the inlet, even with
large positive angles of attack.
The point of transition from a diffuser zone to an effuser one
is determined by the condition
sin__ = (25)x,• sin E
or, after transformation,
PP.M / , sin , F,V, D, (26)
where ±p0M is the value of the flow factor CP0 for which w- I .
The point of intersection of the curves Mwa andM (Fig. 5),± 1.1 ' ' o r
strictly speaking, is determined by the condition Mi w*
sin P, ./77
The ratio VT /T when = is approximately equal to unity,.
which was assumed to be the case during the calculations. Therefore
the point of intersection of the curves Iwl and I is treated as the-1i
-III-

point of transition from a diffuser zone to an effuser one. This
transition point is always in the region ii > 0, since T i < i, and,
consequently, w = wit only when sin P./sin P < i, i.e., Pi <
and ii > 0. The transition point can be found when i1 = 0 only
theoretically - in the absence of restriction, when T= I.
Conclusions
i. Investigation has made it possible to obtain a more complete
understanding of the efficiency of operation of the wheel of a centri-
fugal compressor and to quantitatively associate individual experi-
mental data with the -esults of theoretical analysis.
2. The attained efficiency ra = 0. 9 is maximum for wheels with
geometric parameters similar to the investigated wheels. For other
geometric parameters, in particular the angles Pg2 and Pg , other
peripheral velocities u2 , etc., the efficiency level may change. For
example, the transition to a two-stage cascade, as experimental data
have shown (see p. 44), makes it possible to raise the efficiency of
the wheel. A similar statement relative to the dependence of the
obtained experimental data (mainly quantitative) on the initial geo-
metry of the investigated wheels may be made for the other criterional
parameters.
3. The experiments were conducted using wheels made according
to the generally-accepted recommendations for -typical wheels of sta-
tionary centrifugal compressors of limited performance. Therefore
the obtained data on the values of the various criterional parameters
of the wheel can be used directly mainly in designing the indicated
compressors.
-15-

Direction of rotation
Fig. i. Investigated wheels: 0 92 9 0
0g=33 0 21; D2 =275 mm; D I = 145mmi;
flout :144A mm; D 0 = 65 mm; b 2 = 15 =m; b1 I- 28 mm; 6 =5 mm; Ro 171. =a; R1, = 226.5 MM;
z z. z2 4-I28.
Fig. 2. Diagram of the bladingof the ETsK-1. stand.
-16-

U,2 ;Ir deaf4
Fig 04Caaceitiso
the whe za6
X XT~26
-'ac-

I
.4"
208
I - IZ 12
op -f - - - 4 0 2 tX7
4• ---r- -354
43 ---- f----!A -0--0-o I
42 2 -2 50 .mm
4 8 4i 86M 1 to --
S,!4354 IANI
26 475
737730tO --t&•7 • - -I'
•'i I 't',, A- \ i i I I i
4 8 12 t6f XmM4 !2 15.)vx
Fig. 4. Flow structure behind the wheel.
-'18-

Ii _- - - -1 I- -
-- L-o 4 -- ..-
Fig. 5. Characteristics Fig. 6. Inl~et velocityof te whel ccoringtriangles of a centrifugalto nmbe M((. =Z 2 6). wheel with and without
taking into account therestriction and bendingof the flow.
REFERENCES
i. F. S. Rekstin. Stend ETsK-1 laboratorii kompressornykhmashin LPI im. M.=I Kalinina. Nauchno-tekhnichesk±y informatsionnyy'byulletent, LPI, 1959, No. 6.
2. Yu. S. Podobyyev and K. P. Seleznev. Teoriya ± raschetosevykh iý tsentrobezhnykh kompressorov. Ma-sligiz, 1957.
3. S. P. Livshits. 0 vliyanhi zakarutki potoka i uglov atakipri vkhode v raboche-ye iroleso tsentrobezhnogo, kompressora. Energo-mashinostroyeniye, 1958, No. 12.
-±9-

THE INFLUENCE OF TIM NUMBER OF VANES ON THE EFFICIENCY
OF THE CENTRIFUGAL WHEEL WITH A SINGLE-STAGE CASCADE
S. A. Anisimov, F. S. Rekstin, and K. P. Seleznev
The operating efficiency of a wheel depends on the type, the
relative dimensions, and the operating regime of the wheel. In addi-
tion to the M and Re numbers and the angle of attack i, (or po) for
a given medium with a specific heat ratio k, the basic parameters
which define the operation of the wheel are the geometric character-
istics Pg, b 2 /D 2 ' Z2 1 Pg , D1 /D 2 , DID2 , F/F 0 , the shape of the
vane profile, and others.*
In this article we analyze the results of an experimental study
of the influence of the number of vanes of a centrifugal wheel on its
characteristics and on the flow structure behind it. The work was
conducted on the ETsK-i test stand at the Compressor Machine Labora-
tory of the Kalinin Leningrad Polytechnic Institute.
The diagram of the blading of the stand is shown in Fig. 2 on
p. 16.
The tests were conducted using ten shrouded wheels with entirely
* The arbitrary designations used in this article are, with veryfew exceptions, the generally-accepted ones.
-20-

milled vanes having an angle Pg2 = 49o. The wheels differed only in
the number of vanes: z - z. = z2 = 4, 6, 8, 10, 12, 14, 16, 20, 24,
and 28. The basic geometric parameters of these wheels have been
given in a previous article [I]. The diffusivity of the channels and
the wheel F2/Fi, Ff/F 1' and F2"/F' the relative pitch of the equivalent
straight cascade t/l, the coefficients of flow restriction by the
vanes, and the angles of exposure of the inter-vane channels in the
plane of rotation at the inlet T and v., and at the outlet T2 and v2,
for a series of test wheels are given in Fig. i. Here,
F :0 Db- z1b , 6,
""'v b s 1n - 8D1 sinW (,)
F; , rt - z.b, I -- T- (2
" sin, ( 2 )
2--(.-%. sn sn + Nt 2 (3)z --- D.D1
F; F,,, nl F; 2 s_.( )=_~g ; iL~. (4f)
7-1 3 in F si n
$V, Cos5
V"M 1 - cos ., (6)
where
R= 2-
2= (R. -co coR , C ,.)'
From the graphs in Fig. I it follows that when z = 4-28 the
coefficients T. = 0.91-0.39 and T2 = 0.97-0.78 (when z = 16, Ti = 0.66
and T2 = 0.87). As can be seen from these numbers, the investigated
wheels had great restriction, which is characteristic of limited-per-
formance centrifugal wheels. For comparison, we give the values of
T for the same type of wheel on two machines of the Neva Machine-
Construction Factory: the K-100-61-1; T1 I 0.73, T2 - 0.87, and
K-500-6i-i; r. -v 0.73-0.76, '2 =- 0.89.
-21-

i. The Problem
In solving the problem of selection of the best number of vanes
for the wheel we are usually guided by the following concepts. As is
known [3, 4f, 5%, the theoretical head hT whioh the gas attains in the
wheel channels when c = 0 is determined from the formulaU 1
cn~tk(7)
where p2 = 0 u2/ 2 .
Using as our basis the Stodola formula, which is often used in
the theory of stationary centrifugal compressors to calculate the
influence of finite number of vanes, we get
-2- sin (8)Z$ US
From this it follows that with increasing z2 there is an increase
in 92 and, consequently, in hT. In deriving Formula (8) we took into
account only the effect of the relative eddy on the velocity value cu2
because of the finite number of vanes.
However, with the flow of a real gas in a centrifugal wheel with
a finite number of vanes, in addition to the action of the relative
eddy, there are a number of other factors which influence the velocity
triangle and, consequently, the value of '2"
With a considerable reduction in z the load on each vane increases,
the pressure and velocity gradients are raised on the surface of the
vane, and the intensity of the diffuser zone on the profile increases.
There is a simultaneous increase in the angle of exposure of the
inter-vane channel and local values of the Mach number. These all
result in the appearance and development of separation zones which
disrupt flow in the channel, cause a decrease in the head due to
-22-

decreased lifting force and, as a result, additional deviations in
the flow at the outlet, and also lead to decreased efficiency. The
separation zones restrict the outlet cross section, increase the flow
velocity, and, consequently, decrease the coefficient 92 according to
Formula (8). From what has been said it is clear that with a small
number of blades the head will decrease more sharply than follows
from theoretical relations (7) and (8).
On the other hand, with an increased number of blades their sur-
face greatly increases, i.e., frictional losses increase, which results
in a drop in the useful head and the efficiency of the wheel. There
is simultaneously increased diffusivity of the wheel channel (see
Fig. i) and a great increase in the gas velocity at the inlet to the
channel due to sharp restriction of the flow (small ¶i values). These
factors also cause the development of separation zones and, as a
result, a decrease in the theoretical and useful heads.
From what has been said it is clear that the head and the effi-
ciency of the wheel should be maximum for some average number of vanes.
Another important parameter which determines the efficiency of
the wheel is the width of the operating zone of the characteristic.
Let us examine this question for the case of the flow of an
ideal gas. Theoretical investigations have shown 13, 4S that under
specific conditions (an inviscid gas, unstressed entry, low output)
the gas velocity w on the working side of the blade (the side facing
the flow), because of the influence of the relative- eddy, can drop
to zero or even become negative. This latter will indicate the appear-
anoe of inverse flows on the acting surface of the vane and, conse-
quently, unstable gas motion. Such flow motion causes the appearance
S 7"= c--r -
-23-

acting surface of the blade decreases to zero determines the boundary
of stable wheel operation and is called the critical output. This
output is associated with the optimum output VI by the followingopt
relation [41:
V In sin (9)
where • is the width of the vane channel in the wheel revolution plane.
From this formula it follows, in particular, that with an increased
number of vanes c f/Vopt decreases, i.e., the acting zone of the
characteristic increases. However, the flow structure of an ideal
gas in a wheel in a design and nondesign regime, as experimental
studies have shown, differs considerably from the theoretical structure
[3, 4]. This is manifested, in particular, by the fact that inverse
flow does not occur along the acting side of the vane, even with very
low outputs. And, conversely, on the nonacting side of the vane there
is always breakaway, which is the more noticeable the lower the out-
put. These facts make it necessary to use with care those conclusions
from Formula (9) dealing with the influence of the number of vanes
on the value of the acting zone of the characteristic. The difference
between the actual flow pattern and that of an ideal gas is explained
by the appearance of separation in the boundary layer on the diffuser
segments of the nonacting surface of the vanes and by their develop-
ment, which results in increased average relative velocity w.
Finally, an increase in z obviously complicates the design and
construction of the wheels, i.e., it increases their cost.
The relation between the actual flow structure in the wheel
channels and the number of vanes, as is clear from the preceding, is
extremely complex and, at least at present, has not been precisely
-24-

determined theoretically. Thus the problem of selecting the number
of vanes should be solved by taking into account theoretical and
experimental data. For practical purposes, the number of vanes should
be selected depending on which wheel characteristics are used as the
determining ones, viz., efficiency, head, width of acting zone of the
characteristic, flow structure behind the wheel, reliability, feasi-
bility, etc. This latter results from the fact that at present it
is actually impossible to create a wheel to satisfy simultaneously
all these various requirements. In other words, a wheel may be
optimum only with respect to certain characteristics. This is the
difficulty in selecting the number of vanes and; in general, the
arbitrary nature of this concept.
In stationary centrifugal compressors in the past, the wheels
were made with a relatively large number of vanes (z 2 28). At
present, fewer vanes are used. For example, at the Neva Machine-Con-
struction Factory, for typical "compressor" (Pg2 = 450 and c r 2/u 2 =
= 0.24) and "pump" (Pg2 = 200 and cr 2/u 2 = 0.12) wheels, 18 and 8 vanes,
respectively, are used [6].
Various analytical dependences are used in the literature to
select the appropriate number of vanes. These dependences, and also
the results of using them to calculate the recommended number of
vanes for the wheels we investigated, are given in the table. As can
be seen from the table, the recommended number of vanes varies within
a rather broad range - from 8 to 23 - depending on which formulas
were used in the calculations.
The experimental data in Soviet and foreign literature on the
influence of the number of vanes of a centrifugal wheel on its charac-
teristics are incomplete and pertain to studies of wheels which are
-25-

not typical for stationary centrifugal compressors [7, 14], or to
determination of the total characteristics of centrifugal stages with
wheels having various z [15]. The literature contains no detailed
data on the influence of the number of vanes on the flow structure
behind the impeller.
2. Research Methods
The method of investigating the influence of the number of vanes
of a wheel on the efficiency of its operation is based mainly on the
method of investigating the operation of individual wheels given in
previous papers [i, 21. The main difference is that if when investi-
gating individual wheels, as an independent parameter we use 0 or X,
then when investigating the influence of the number of vanes it is
natural to use, as the independent parameter, the number of vanes and
also the coefficient -i, the relative pitch t/l, and the angle of
exposure of the vane channel v,, uniquely associated with z for the
investigated wheels and giving a more complete idea of the conditions
of flow entry into the wheel channels. In addition to the previously
used criterional parameters (see the footnote on p. 3) a, 4*, p, n,
p, kG, ka, etc., to investigate the influence of the number of vanes
on the width of the acting zone of the characteristic of the wheel
we introduced the auxiliary criterional parameter, the coefficient ky:
r = - r, (10)
where 9 p0 cr and cp 0opt are the gas flow factors o for ?Pax and
*max' respectively.
When k increases there will be expansion of the acting zone of
the wheel characteristic.
-26-

3. Investigation Results
i. The curve n a shown in Fig. 2, is smooth for a broad
range of z (z - 8-20).
When z < 8 there is a noticeable drop in the efficiency due to
deterioration of the flow structure in the wheel channels, associated
with separation phenomena. With such a small number of vanes the load
evidently increases greatly on the vane, and the exposure angle of
the vane channel increases considerably, which results in the vigorous
development of separation phenomena. In this case, in the vane chan-
nels there occur local pressure and velocity gradients.
When z > 20 there is a certain decrease in the efficiency due to
the strong restriction of the flow at the inlet (the velocity w" and
the number ) an increase in the diffusivity of the channels and
the wheel (FI/F', F2/F{, and F"/F" increase), and the influence of
friction.
The maximum j is in the region z = 10-18. In this case the
angles of attack are within the limits i Ift 3-7°
The numerical value of the angle of attack depends on the shape
of the leading edge of the profile. The angle of attack is calculated
from the angle D which is determined by the direction of the camber
line at radius R,, while the leading edge of the blade is practically
symmetrical. Depending on the shape of the leading edge, optimum
flow can occur for several values of i,. For example, with tapering
of the leading edge of comparatively thick completely-milled vanes
from the concave side, unstressed flow will be attained at ii > 0.
In addition, we should bear in mind the influence on the true
value of the angle of attack of leakages near the covering disk,
although their influence is quite insignificant and is, on the average,
-27-

for the examined wheels (radial gap of 0.25-0.35 m) in optimal
regimes Aii A 30-40'. The leakages decrease the aIlebraic value of
the angle of attack.
The above phenomena have remained practically unstudied; there-
fore it is very difficult to estimate the actual extent of the influ-
ence of these factors. Special experimental and theoretical operations
are required to solve these problems.
2. The shape of the curves *ax = f(z) and Pmax = f(z) shown
in Fig. 2 is similar to that of the curve -•m* f(z). The decreaseaýmax =fz.Tedces
in the value of Pmax and Tmax with small and large z can be explained
by the same reasons as the decrease in 3j* max. The maximum ** and p
are in the region z = 14-20.
3. Figure 3 gives individual characteristics of wheels with
various numbers of vanes. From the graphs it follows that since the
curves • and ?P* are more sloping with decreasing number of vanes,
consequently with decreasing z the zones of economical and stable
wheel operation increase.
The increased zones of economical and stable operation with
decreasing number of vanes can evidently be explained as follows.
When i1 • 0 flow past the leading edges is not characteristic; the
wheel characteristics are determined by conditions of gas flow in the
wheel channel. When i1 / 0 and their absolute values are reasonably
high, the maximum local M numbers and maximum local diffusivity occur
with gas flow near the leading edges. The nature of the flow past
these edges for any z should evidently be similar, since for all the
investigated wheels their shape is identical, while the value of
maximum diffusivity and the maximum M number in this region should
be determined mainly by the average value of the M number near the
-28-

leading edges. From the graph in Fig. 6 we see that with an increase
in z the number it continually increases, i.e., with an increase in
z breakaways begin to develop at lower absolute values of the angles
of attack than we observed in the investigated wheels.
With an increase in z the efficiency maxima shift toward smaller
,-PO, while the head coefficient maxima, on the other hand, shift
toward higher IP0, i.e., in this case we observe a certain decrease
in _•oopt and an increase in 9 Poer. This indicates that with an
increasing number of vanes the width of the acting zone of the wheel
characteristic defined by the coefficient ky (Fig. 2) decreases. This
latter does not confirm theoretical formula (9).
The shift in the maxima of q* and k* vs. z can evidently be
explained by the influence exerted by the change in the value of flow
constriction at the inlet on the ratio between M" and N"c.wi N I cr*
The critical number MW cr is the value of Mw at which at any
point on the surface of the profile the gas velocity attains the local
velocity of sound. The value of Mw cr depends basically on the geo-
metry of the cascade design and the angle of attack. To assure
normal operation of the cascade we must have the inequality Mw =< Mw cr"
Otherwise, on the vane surface there arises a supersonic zone and,
as a result, there are compression shocks which cause the vigorous
development of breakaway phenomena and a sharp deterioration of the
flow aerodynamics in the wheel channels.
The value of the local velocity in the vicinity of the leading
edge depends mainly on the shape of the edge, the angle of attack,
and the value of the velooity ahead of the cascade and in the throat
of the cascade channel. The local velocity for the given geometry
and specific velocity ahead of the cascade is minimum when i1 0
-29-

and increases when i., 0. For the given angle of attack the local
velocity increases with increasing constriction, i.e., with increasing
z (except for the case of very small z) due to increased velocity in
the narrow channel cross section.
There are practically no data on the value of N" for circularWI orcascades. In this article let us give .an analysis, using the concept
of the critical number M' or' by which we will understand that M'"N I owi
number [i] for which somewhere on the profile there occurs a local
velocity equal to the local velocity of sound.* The number MI or has
a maximum value at ii - 0 and decreases when iI > 0 and iI < 0.
Regimes corresponding to * max lie in the region of small
angles of attack close to zero. In this case there are optimum con-
ditions for vane profile flow, due to which the number or has a
high value and changes but little with slight changes in the angle
of attack, i.e., in this case preservation of the inequality M" <W1i
( o will depend mainly on the change in the value of M and,
consequently, with constant cascade geometry, only on the value of
the coefficient cPO"
Let us write the expression
V __ R 7 _ V ig [?T7 STfli N, C -R1
From this it follows that with increasing velocity c rland,consequently, 'PP, and with increasing flow restriction (i.e., with
decreasing T.). the velocity w" and the number M" will increase.
* The critical number M cr should be considered arbitrary,
since for not very high u 2 and small or average values of z it is
possible that local supersonic velocity is not attained. In thiscase, N or characterizes the regime for which due to high local
diffusivity breakaways vigorously develop.
-30-

Thus the influence of the flow rate and flow restriction on M" isWi
qualitatively identical. Or, in other words, in order that the
number N not change with increasing restriction due to an increaseiin the number of vanes it is necessary that the gas flow rate (i.e.,
• ) decrease. Therefore, in the regimes j max' when preservation
of the inequality N" < M1c depends mainly on the value of M"i w2cr wI
with increasing z there must be decreased gas flow to prevent an
increase in M• • From this it is understandable that with increasing
z the coefficient q)P0opt should decrease.
Regimes corresponding to •ax lie in the region of large positive
angles of attack and have correspondingly poor conditions of vane
profile flow, due to which the number cr has a relatively low value
and depends greatly on the angle of attack, i.e. ; in this case with
constant cascade geometry preservation of the inequality <i ( Micr
will be determined mainly by the value NIcr, which changes abruptly
even with insigifnicant changes in the angles of attack or qPo"
Increased flow rate in this case leads to a decrease in iI and there-
fore causes a considerable increase in M cr In this case there is
also a certain increase in N" ; however, we must assume that an increase
in the flow factor influences an increase in the number M" to a muchWI
lesser extent than an increase in M cr, i.e., the inequality M" <
I o is retained. With decreasing flow rate, i.e., an increase
in the angles of attack, the opposite should be observed. In this
ev-.t t"-`- inequality M < M" is not preserved.
Thus, in regimes a when the decisive factor is M"w , reten-max w Icrtion of the inequality <i" < M" with increasing z (and, consequently,Swlcr
the number N ) is possible only when the flow rate changes such that
th•c number cr increases. This will occur with a decrease in the
-31-

angle of attack, i.e., with an increase in q0 [i]. From this we
see that with increasing z the coefficient qP0 corresponding to m/axi '
i.e.,, 9p 0cr' should increase, which is confirmed by experimental data
obtained (see Figs. 2 and 3).
In addition, from Formula (ii) it follows that the qualitative
influence of u 1 on the number M" when i= const. i.e., whenI~ w I
sin • 1 /sinpgi = const, is opposite to the influence of T,; therefore
we can assume that for wheels similar to those investigated an increase
in the velocity u,, when its value is reasonably high, should cause
qualitatively the same type of shift of the maxima of q•* and P* as
a decrease in -Ti, i.e., an increase in the number of vanes z. In
other words, to expand the acting zone of the wheel characteristic
we must decrease the peripheral velocity of the wheel ui. This latter
conclusion naturally requires experimental verification.
A change in the angle •g1, when the remaining geometric para-
meters of the wheel are retained, results in a change in the optimum
flow rate, i.e., the optimum value of the coefficient (P0. Using
wheels with large P it is evidently possible to displace the zone
of maximum efficiency to the region of increased flow rates.
The results obtained on the shift in the maximum of the curves
f( po) with a change in z agree with the experimental data of
Kearton [141 and Ris [15]. The shift in the maximum of the curves
T1 = f(9 )does not agree with the experimental data of these authors;p0
this latter can evidently be explained by the influence of the fixed
elements, since our data pertain to a wheel, while the other data
[14, 15] correspond to a stage and a unit, respectively.
4. The coefficients of relative flow nonuniformity with respect
to the internal kh and adiabatic l a6 heads (Figs. 4 and 5) are
-32-

practically independent of the number of vanes, both for * max and
ii 0 0, and for *max-
The relative flow nonuniformity with respect to flow rate and
angle, characterized respectively by the coefficients kG and k. (Figs.
4 and 5), depends on z, particularly for *Max* This is associated
with the fact that the operational regimes corresponding to 4'*max lie
close to the surge zone where breakaway phenomena are particularly
greatly manifested.
For regimes * max and i = 0 a certain increase in kG and ka
is observed with a decrease of z < 8, due to the development of break-
away phenomena because of increased load on the blades and increased
velocity and pressure gradients, and with an increase in z > 1t, due
to the increased diffusivity of the channels and the wheel and also
increased friction in the channels.
The absolute nonuniformity with respect to the angle Act = amax -
- 'min (Figs. 4 and 5) when z = 10-20 is minimum and remains practi-
cally constant, but increases considerably when z = 8. In our test
wheels the absolute nonuniformity with respect to the angle was 6-i0O,
i.e., the variation of the angle a about the average value was +(3-5)_
even for the regimes 3 max and i1 = 0. The presence of a consider-
able absolute nonuniformity with respect to the angle even for design
regimes should be taken into consideration when designing vaned dif-
fusers and particularly for the shape of the leading edges of the
vanes.
5. The nature of the change in the degree of reaction 9 with a
change in z is determined basically by the nature of the change in
( [i], while the degree of reaction p is determined, in addition, by
energy losses (Fig. 4).
-33-

The values of a and p decrease greatly with an increase in z to
6-8. With a further increase in z the decrease in a and p occurs
considerably more slowly (when ný max and i, = 0), while for. *max
the values of n and p in this region remain practically constant. For
all numbers of vanes, as follows from the theory n > p [i1.
6. A comparison of the curves g = f(z) and Q. = f(z) [I]* for
Smax (Fig. 4) and also for i = 0 shows that they are qualitatively
identical, but the numerical value of go is less than the experimental
value of g. With an increase in z the values of g and g converge.
These data agree with those derived by Kearton [14].
7. The dependence of the numbers M. , MwJ, i and M on the0 w' N I c
number of vanes for i* max' i1 = 0, and max is shown in Fig. 6. The
nature of the curves of MCo and MwI is determined by the change in
the coefficient 9P0 corresponding to the regimes 16 max' il = 0 and
m~ax for various z. The nature of the curve Mc for all regimes is
determined by the influence of the number of vanes on g and i [i1.
The value of Mc with increasing z basically increases, most intensely
in the region z = 4-10, and very slowly for z > 14-16.
hen ii 0 the number NI continually increases with increasing
z, since restriction increases (,r, decreases). For •x* the value ofmax
with increasing z increases considerably due to increased restric-
tion as well as due to the shift of to the region of high flow
rates, where effusivity increases at the cascade inlet.
The value of for 7 in the region z -c 16 remains approxi-I
Liately constant. This constancy of the value of M with a changeI
* The coefficient g., = cu/u2 is found by converting from diameter
D2 to the diameter of the control section D of the coefficient 2=- cu2/u 2 defined by the Stodola formula.
-34-

in the number of vanes in the region z A 16 for 7• max supports the
previously expressed concepts on the influence of the number oni
the position of the maximum efficiency. With a further increase in
the number of vanes, preservation of the constancy of would result
in a great reduction in the flow rate and a great increase in the
angle of attack, in which case the number cr would noticeably
decrease. Therefore the maximum efficiency for z a 16 is attained
for approximately constant angles of attack corresponding to the
regime in which N" cr is still large and approximately equal to its
value when i. = 0. For somewhat larger angles of attack the value of
MIcr will evidently decrease considerably. It is characteristic
that when z > 16 n max begins to gradually decrease, which is
evidently associated with an increase in M and which supports our
conclusions.The coefficient po (the flow factor T , for which wi = wi)
p0M p0decreases with increasing restriction due to increasing z, as can be
seen from Fig. 6. Thus, with an increase in the number of vanes the
transition point from a diffusion zone to an effusion zone shifts
toward lower flow rates. Or, in other words, with increasing z the
region of operational regimes for which there is diffusion inlet into
the vane channel of the wheel decreases.
Conclusion
i. Our studies have permitted a qualitative and quantitative
estimate of the influence of the number of vanes z on the operational
efficiency of a wheel. Obviously, however, the specific quantitative
data on the influence of the number of vanes (e.g., the number of
vanes corresponding to maximum efficiency) are relative in nature.
-35-

This is due to the fact that the wheel efficiency depends on many
factors, and therefore quantitative data, strictly speaking, are valid
only for specific design relationships for a wheel, and for the gas-
dynamic flow parameters, i.e., for specific 13 2 ,1 D1 /D 2, 6/D 2 , u2,
the shape of the leading edge of the vanes, etc. Some change in these
parameters (e.g., the thickness of the vanes 6) compared with those
used in the studies could obviously have the result that the influence
of z would change quantitatively (e.g., the maximum efficiency would
occur for some other number of vanes).
We should, however, note that this study was conducted for wheels
made according to the generally-accepted recommendations for typical
wheels of stationary low-output centrifugal compressors. This fact
increases the value of the obtained quantitative relationships.
In addition, the above analysis makes it possible to draw certain
conclusions as to the influence of the number of vanes on the physical
flow pattern in a circular cascade.
Thus, analysis of the obtained experimental data makes it possible,
in many cases, to give a qualitative (and in a number of cases a
quantitative) estimate of the influence of z for other design and
gasdynamic parameters of the wheel and the flow.
In thus recommending that the above data be used in practice,
the authors at the same time consider that the above given theoretical
analysis should now be further refined, and special experimental
operations should be undertaken.
2. To investigate shrouded wheels with normally backward bent
vanes (in the given case, P g 490), the curves T* max and ma as92 m ax
functions of z have a sloping nature for a broad range of vane numbers.
Therefore the maximum efficiency of the head coefficient is found for
r36-

Va broad range of vane numbers z - 10-20 (for the head, z - 14-20;
for the efficiency, z - ±0-18). We should note that the restriction
of the channel at the inlet to the investigated wheels was considerable
(when z - ±0-20 ri - 0.78-0.57) because of the large relative thick-
ness of the milled vanes (6,/D, - 0.0345). These relations with
respect to Ti and VD, are characteristic of low-output centrifugal
compressors. For wheels witi. a smaller relative vane thickness 6./D.
(for stamped vanes Yi(± + (2A/b,))/Di, where 6 is the length of the
flange) we can expect to obtain maximum efficiency and head coeffi-
cients for somewhat more vanes.
Such an assumption can be made with respect to wheels having an
angle P9g which is larger than that of the investigated wheels.
3. The number of vanes greatly influences the value of the zone
of stable and economic wheel operation regimes and, bonsequently,
the width of the acting zone of the characteristic. With an increase
in z the position of the efficiency maximum shifts toward the region
of lower flow rates, while the maximum head coefficient shifts toward
the region of lower flow rates, while the maximum head coefficient
shifts toward the region of higher flow rates and thus the acting
zone of the characteristic is greatly reduced. In this regard, to
increase the acting zone of the characteristic as small a number of
vanes z as possible must be selected.
With large z, when there is great restriction of the flow by the
vanes, the acting zone of the characteristic can evidently be expanded
if we undercut every other vane, since this should increase T, and,
consequently, decrease Mvt•
I4. The most satisfactory flow structure behind the wheel, as
the results of our tests on the series of wheels showed, is obtained
for z = 10-20.
-37-

For wheels with z - 10-20 the absolute nonuniformity, with
respect to the angle, of the flow behind the wheel remained practically
constant. In this case the deviation of the flow angle from the
average value was +(3-5) 0 (Aa - amax - mn 6-i0) at a distance of
6.5 = behind the wheel. This should be taken into consideration
when designing vaned diffusers.
5. The angles of attack in regimes of maximum efficiency were
within the limits i, = 3-7 when TI = 0.78-0.57 (z = 10-20).
6. Ccmparison of the magnitudes and nature of the change in the
M. and M" numbers (with a change in qPO, z, ¶j) resulted in the con-
clusion that the number Mc (more exactly the number Mc 2) is not a
characteristic criterion of the operation of the wheel, but can serve
primarily as a characteristic of the operating conditions of the
diffuser. The criterion which determines the operation of the wheel
is the number M1 i or other numbers which are determined by the inlet
velocity. Therefore there must be theoretical and experimental
studies to establish the critical values of and Mw for character-i i
istic designs, and these must be used as the criteria when selecting
the maximum permissible peripheral velocities.
In testing the indicated series of wheels for u2 = 215 m/sec
in the region z = 10-18, where the maximum values of r1 max were
obtained, the value of N 1 was within the limits 0.5-0.53 (Mc = 0.41-
0. 44).
Thus, for wheels similar to those investigated z = 14-18 should
be considered the best number of vanes, from the standpoint of obtain-
ing maximum efficiency and head and satisfactory flow structure behind
the wheel. If there are rigid requirements for the value of the acting
zone of the wheel characteristic, z = 10-12 should be considered to be
-38-

the best number of vanes. For the investigated wheels the experimental
data show that the formulas proposed by a number of authors [6, 7, 12,
13] give quite accurate results for finding the optimum number of
vanes with respect to efficiency and head. However, for a proper
selection of the number of vanes, taking into account the efficiency,
the head, the width of the acting zone of the characteristic, and the
flow structure behind the wheel, it is necessary to use generalized
experimental data.
J I•
4 8 2 16 20 24 28 Z 32
Fig. 1. Geometric parametersof the investigated wheels.
40 .0 24z
q2 0
Fig. 2. Comparative character-istics of the wheels.
-39-

Optimum Number of Vanes for the Investigated WheelsAccording to Various Reconmendations
Op "esse
~n I
iIn D,
0,3570- 0.45
y* ~~ bps 7~s2-2
6.8--~- sin +
:-k Rs +R, $in+~
C. PflsiA~f? Th aujthor r~oaaamers thiat this formula 222 IS. 9)be used for oontrifuigal pums. In thisswap9 kc 6.5. For oentriflagal sompes. .1
360 IR.
10 I+ 30D,,iwhor.Ds is j in mters
1.. Re Vegilin Asoommened for sing I s shrouded wh~eels I21Of oentrifI049l COoMrOSbort Of trIVnSPOrtInstallaions
*_0,072+
&(I2 R)u
th ujae o s ahe vgs
eT.on 1- 1111430 D- Dss 19g 1131__________, p.1).I____
Pew k0-

47
45 - -
y 0,z3 ..
Fig. 3. Individual character-istics of wheels with various ZtS.
o' - , I - ,•1. 1 1 C te
ROiN I o .wel Lor m ",fo b j,KI, I I ] I I I I I -L__J.!1
Fig. 4. Comparative character-istics of wheels for n* ax
-42-

P I 1 ' i I
.2O,16 20 24 "*8, 47 , 0 . - .
U.6 &P 4 q 4G. q* - f
Fig. 5. Comparative characteristicsof wheels for **ax
I .-. ji
Ihoi -t Fig. 6. Comparative
Q7 characteristics of11z:I: -- wheels for M number.
. : _; •. _
3 - 1 1 1 1l- ~~ I i '.L I. . 4_ I _ ' _,:
-22-

REFERENCES
i. S. A. Anisimov. (see the first article in this collection]
2. F. S. Rekstin. Stend ETsK-I laboratorii. kompressornykhmashin LPI im. M. I. Kmlinina, Nauchrio-tekhnicheslciy in~formatsionnyybyulletent LPI, ±959, No. 6.
3. Yu. S. Podobuyev and K. P. Seleznev.. Teoriya ± raschetosevykh T-s-e-ntfrobezhnykh kompressorov. Maslhgiz, ±957.
4~. V. F. Ris. Tsentrobezhnyye kompressornyye mashiny. Mashgiz,1951.
5. K. I. Strakhovich. Tsentrobezhnyye kompressornyye mashiny.Mashgiz,190
6. V. F. Ris. Kompressornyye mashiny Nevskogo mashinostroitelt-nogo zavoda im. 7. 1. Lenina. Energomashinostroyeniye, 1957, No. ii.
7.. B. Ekkert. Osevyye i tsentrobezhnyye kompressornyye.
8. C. Pfleiderer. Die Kreiselpumpen fUr FlUssigkeiten und Gase,
9. A. N. Sherstyuk. Kompressory. Mashgiz, 1959.
±0. S. I. Tsitlcin. Tsentrobezhnyye kompressory, gazoduvki iventilyatory. Mashgiz, 1950.
11. A. I. Stepanoff. Turboblowers, New York, 1955.
12. L. R. Wosika. Radial flow compressors and turbines forsimple sm~all gas t'~rb7ines, Trais act-,ions' of the A. S. M!. E., XI, vol.
1~ 952, No. 8.
13. V. M. Kulakov. 0 cjiis-Ie lopatok v- kolese turbokompressora.Trudy MVTU-fmii iBuanax, 1958, No. 75.
14l. W. Kearton. The influence of the number of impeller bladeson the pressure generated in a centrifugal compressor and on itsgeneral performance, The Inst. of Mech. Engl. Proceedings, 1933,vol. 124.
15. V. F. Ris.. Iz opyta proyektirovaniya kompressornykh mashinna NZL. Trudy NZL, 1937, Vol. I, TsBNTI.

STUDY OF THE EFFICIENCY OF CENTRIFUGAL COMPRESSOR
WHEELS WITH A TWO-STAGE VANE CASCADE
S. A. Anisimov, et al.
At the present time the stationary centrifugal compressor produc-
tion industry uses wheels with a simple (z 2 = 2zI) and complex (z 2 >
> 2z,) two-stage vane cascade Ii, 2, 3, 4, 5]. The guiding principles
in this case are basically that such cascades can assure the required
flow guidance to the outlet from the wheel with moderate restriction
at the inlet.
The question of the efficiency and expediency of using wheels
with z2 = 2zI is of great practical significance, since to the present
time in the literature there have been no studies made on the influ-
ence of the number of vanes and the relative diameter K = Dx/D 2
(Fig. i) on the efficiency of "compressor-type" wheels (Gg2 = 40-500 )
with a simple two-stage cascade.
These concepts also served as the basis for conducting the pro-
posed work, a theoretical and experimental study of the influence of
z and DK on the operational efficiency of centrifugal wheels (Pg2 = 490)
with a simple two-stage vane cascade. Certain data on this problem
have been published previously (6].

The geometric parameters of the investigated wheels are given
in Fig. i.
i. Theoretical Study
As is known, flow in the impeller is three-dimensional. However,
study of the spatial flow in the vane channels is extremely difficult.
In the general case, analysis of three-dimensional flow can be replaced
by separate study of two flows in the meridional and radial planes
with subsequent superposition of the flow patterns one upon the other.
To simplify the solution of the problem it is expedient to restrict
ourselves to a study of flow only in the radial plane, taking into
account the change in height of the channel b in the meridional plane.
Such an assumption is possible, since usually the axial velocity com-
ponent within the wheel is insignificant and has no substantial effect
on the velocity profile in the vane channels.
On the basis of these concepts we conducted an approximate theo-
retical analysis of the influence of z and D on the operational
efficiency of a centrifugal wheel, with the aim of obtaining the
maximum head and minimum local M numbers in the vane channels for an
optimum regime, and we also estimated the influence of these same
geometric parameters on the width of the acting zone of the wheel
characteristic and its hydraulic efficiency.
The useful head of the wheel can be represented as follows:
h.= hr. - Ak-- Ah,,
where h -M/g(i-(cr 2 /u2)cotpg 2 )u2 is the theoretical head for an
infinite number of vanes; thT = h0 is the decrease in the theoretical
head in association with a finite number of vanes due to the influence
-145-

of the relative eddy, the curvature of the vanes, and the change in
the flow structure in the channels; Ahr - 1 -hn is the loss of
head due to friction and vorticity.
Let us examine the dimensionless value
D(z -hr n Ah, +h,. (±)hr. T) =+hr.
The smaller O(z) the greater the useful head, since the value of
hT does not depend on the number of vanes or on DC. Consequently,
expressing the value O(z) as a function of z and D we can analyze the
influence of z and D5 on the useful head.
The value f 1 (z) can be represented as follows:
____• -(2)hZ) = '- h-r . f r - .
where ± = hT/hT is the coefficient of a decrease in the transmitted
energy.
The value Ahr can be expressed as follows:
IhrR" G Z (3)
where Rx is the resistance arising with friction in the vane channels;
w' is the mean relative velocity taking into account restrictionm
between sections i-i and 2-2 of the impeller; G is the weight flow
of the gas.
On the basis of Kearton's experimental data (72, let us express
the coefficient L for wheels with a single-stage cascade according
to Ekkert, s formula [ 4 ]:
JA= .(4)
I,5+ +11
-46-

The expediency of using Formula (4) has been confirmed by our
experimental data.
Determination of the function f 2 (z) is a more complex problem
due to the lack of sufficient experimental data for finding the resist-
ance Rx. To approximately determine the resistance occurring with
turbulent gas flow in the vane channels of an annular cascade, let
us use, by analogy, the familiar relationship from the theory of
fluid flow in channels of arbitrary cross section:
R , - ,, (5)
where X is the resistance coefficient; pm is the mean density of the
gas in the channel;
S- 2 (um. b ,)1= '', sin N, -- •6z + bm,z D,-D,z sin Irm
am = 7rDmz sin Pgm - 6 is the width of the vane channel; 6 is the
vane thickness; and 1 = (D2 - D,)/2 sin Pgm is the arbitrary length
of the channel.
The values of the parameters with the subscript m were defined
as the arithmetic mean between sections i-i and 2-2.
The resistance coefficient X, according to recommendations by
BalJe [8), can be calculated from the Blasius formula
1 0.31 (6)
where
Re -w~dn,Vm
2a",bm
vm ls the coefficient of kinematic viscosity.
Por wheels with a single-stage cascade, using Eqs. (i)-(6) we
-47-

get,, after transformations,
(D (z) I- IYN(1+w X1.5 +~ I,! 4Ou
2, (1 D,~L
I 91•P, 0o0• \nDm sin.-z "'kn, /W,+ Wt RVo•. -sn .b.sin g nDn sin a•I -- if "{- b m'
To determine 4(z) for wheels with a two-stage cascade we can
use Eq. (7), leaving fi(z) unchanged* and representing friction ar
vorticity losses of the entire wheel as the sum of the losses in the
two stages
f 2 (z) = f 2 (z.) + f 2 (z 2 ).
Figure 2 shows the graphic solution of Eq. (7) for the investi-
gated type of wheels with single- and two-stage cascades. For wheels
with a single-stage cascade the optimum number of vanes, with respect
to useful head, is within the range zopt h - 16-23. Analysis of the
curves shows that with increasing z, the optimum wheel with a two-
stage cascade is obtained for high D . From the standpoint of obtain-
ing minimum losses in useful head it is expedient to use wheels with
a two-stage cascade beginning with z > 18-20.
We should mention the restricted sphere of application of Eq. (7)
because of the approximateness of Eq. (6) which defines the value of
the resistance coefficient X without taking into account the presence
and development of breakaway zones in the rotating vane channels of
* The experimental data obtained verify the expediency of usingEkkert's equation [4] to calculate the influence of a finite numberof vanes of wheels with a two-stage cascade, assuming z - z 2 .
-48-

the wheel, and also without taking into account the effect of the
rotation and curvilinearity of the channels. For wheels with z2 = zi
the expediency of using (7) is limited to the region in which local
diffusivity and the exposure angles of the channels are within toler-
able limits and, consequently, the presence of developed breakaway
zones is not expected, i.e., a region with a sufficiently large number
of vanes. Below we give an analysis which makes it possible to estab-
lish z for which the level of local diffusivity will be minimal. For
wheels with z2 = 2z, the restrictions on the equation for determining
X are made more severe by the fact that with very high D very short
vanes disrupt normal gas flow in the channels of the second stand.
In addition, in the region of very large D it is hardly possible to
reliably determine the coefficient .i from known theoretical and empiri-
cal relationships.
It can be assumed that the nature of the dependences r* = f(po)
and * = f(qD ) will be substantially influenced by the breakawayp0
zones which develop in the channels of a centrifugal wheel; the pres-
ence and scale of these zones, in turn, depend mainly on the value
of local diffusivity. The value of maximum local diffusivity can be
estimated by the relation wloc maxW2 Considering that the relative
velocity w2 for a single series of wheels with u 2 = const changes
insignificantly, the maximum local diffusivity and, consequently, the
degree of development of breakaway zones can be estimated by the value
Wloc max or M oc max* Such an approach to the study of the influence
of breakaway zones on the operational efficiency of a centrifugal
wheel considerably simplifies the theoretical analysis, making it
possible to simultaneously obtain a value for the maximum local Mach
numbers which characterize the operation of the cascade.
-49-

There exist various theoretical methods for calculating the
local relative velocity in the radial plane of a wheel with a finite
number of vanes. However, most of these methods are quite unwieldy
and when making calculations they require use of the method of suc-
cessive approximations. A number of authors [i, 2] have proposed
for this purpose a reasonably simple approximate analytical dependence
which establishes the connection between the local relative velocity
and the coordinates of the examined point. Considering that maximum
local relative velocity is attained on the nonacting surface of the
vane, the proposed equation for wheels with 5 < 900 is written as
follows:
+ = .,, (8)
where w" is the average relative velocity in the investigated sec-avtion, taking into account restriction and bend of the flow to an- angle
g9; a is the width of the channel in the radial plane; R1 is the radius
of curvature of the vane; and c is the angular speed of rotation of
the wheel.
Equation (8) is applicable for determination of the local rela-
tive velocity only in regimes of maximum airfoil cascade flow. Other-
wise, due to a change in shape of the flow lines, there is a consider-
able change in their equidistance from the center line of the vane.
Bearing in mind that
and using the expression for the Mach number and Eq. (8), we get,
finally,
___ nD sin A- 6L.~(
4 j-;t ,Dsi.-a -z 61- ( I- -z
-50-

A graphic solution of Eq. (9) for the investigated wheels is
shown in Fig. 3. An analysis of the curves in this figure shows that
for wheels with z2 - z1 the optimum number of vanes, from the stand-
point of the minimum Mach level or minimum local diffusivity, is within
the range zopt M = 11-13. For wheels with z2 - 2zi, with increasing
z. the minimum level of the development of local diffusivity at the
second stage is observed for larger D5. For any z the maximum value
of /M occurs when 75 = 0.527, i.e., at the inlet to the firstofMnp z0
stage of the cascade.
In two-stage cascades of the investigated type, to obtain minimum
M numbers in the first stage we must select z = 10-14, while for
minimum M numbers in the second stage we must assume 5I = 0.7-0.8.
Taking into account the assumptions used to derive Eq. (9), it
is to be expected that the absolute values of np /M are approxi-
mate. However, use of Eq. (9) makes it possible to quite simply
estimate the region of the origin of the intense development of break-
away zones in vane channels as a function of the geometric relation-
ships of the wheel and the flow parameters.
To determine the influence of the number and length of the vanes
on the hydraulic efficiency of a wheel we can use the functions f 1 (z)
and f 2 (z) obtained previously:h--Ah , (i0)
hr - h r (z)'=1-0
The graphic solution of Eq. (10) is shown in Fig. 3. Analysis
of the curves shows that with increasing 5 KO when z - const, the
hydraulic efficiency of the wheel increases. For the same number of
vanes z2 the efficiency of a wheel with a single-stage cascade is
less than that of a wheel with a two-stage cascade. The absence of
-51-

a maximum on the ig, curves is explained by the above-mentioned
restrictions of Eq. (6) whIch does not take into account the presence
of developed breakaway zones in vane channels for wheels with relative
sparse cascades with a large channel exposure angle. Using previously
obtained data on the influence of z and 1 on the value of local
diffusivity and, consequently, the level of development of breakaway
zones, we can approximately limit the sphere of applicability of Eq.
(iO) by the curve 4-M. To the left of line M-M Eq. (1O) should yield
a qualitatively incorrect result.
Using simple physical concepts it is easy to show that for
increased width of the acting zone of the wheel characteristic it is
necessary to decrease restriction of the flow at the inlet [9]. This
assumption has been confirmed by experimental data obtained. Conse-
quently, the curve M-M and Eq. (9) determine the optimum number of
vanes from the standpoint of attaining the maximum width of the acting
zone of the wheel characteristic for a reasonably high efficiency
level.
It should be mentioned that the proposed equations (7), (9), and
(iO) are sufficiently general and can be used to determine the influ-
ence on the useful head, the level of local diffusivity, and the
hydraulic efficiency of not only z and 5 but also of other geometric
relationships of the wheel and the flow parameters.
Thus, on the basis of this theoretical analysis we can assume
that wheels with two-stage cascades can have advantages over wheels
with single-stage cascades with respect to efficiency, head, and
width of the acting zone of the characteristic.
-52-.

2. Experimental Study
The experimental part of the work was done on the ETsK-i test
stand at the Laboratory of Compressor Machines of M. I. Kalinin Lenin-
grad polytechnic University [iO]. The diagram of the blading of the
stand and the control sections for measuring the flow parameters is
shown on p. 16. The wheels were tested for constant peripheral
velocity u2 = 214.5 n/sec. In all, 25 shrouded wheels with fully
milled vanes were tested (P 2 = 490). Of these, 8 had single-stage
and V7 had two-stage cascades. The basic geometric parameters of the
wheels are shown in Fig. i and given in Table 1. In Table i, the
crosses designate wheels tested on the ETsK-i stand, while the terms
"starting" and "derived" cascades indicate, respectively, single-stage
cascades with z = z2 and z ; z1 .
The experimental data were measured and processed according to
the Leningrad Polytechnic Institute method [6, 9, i1] using small
pneumometric devices developed at LPI [12, 13, 14, 153, and also other
measurement and recording apparatus [6, i0-16].
As criteria for estimating the efficiency of the wheels we used
parameters examined in detail in previous papers [9, ii]. In addition
to the parameters derived in these works, in the present investigation
we used the following:
where
C (12)sin Y,,:Dx6,,M sin P
r is the coefficient of flow restriction at the outlet from the first
stage of the cascade or at the inlet to the second stage, determined
from Z = z1(r.Z) or z = z
-53-

The values of T and 7y were determined approximately, on the
basis of the assumption of a linear law of change in temperature and
density of the gas between sections i-i and 3-3, and the presence of
the equalities T0 T - T" .a n1.
Analysis of the individual characteristics of the wheels has
made it possible to make the following remarks (Fig. 4):
1. The general nature of the individual characteristics of
wheels with z 2 2i, does not differ from the corresponding character-
istics for z2 z. [9, ill.
2. The nature of the curves na= f(q ) and * f(p ) is
determined by the number of vanes in the starting single-stage cascade
z = z2 and the relative diameter K. With an increase in BK for the
given series of wheels, the curve becomes more inclined. A similar
phenomenon is noted with decreasing z for 5 1 const.
Such a result is completely regular. An increase in 5K decreases
the total working surface of the vanes and restriction at the inlet
and leads (when 5 = i) to a decrease in the total number of vanes by
a factor of two. Therefore an increase in 5/ and a decrease in z of
the starting cascade should have a qualitative influence on the
characteristic of the wheel. This inter-dependence of D and z is
evident for other wheel characteristics as well.
3. For all the studied wheels 71 max is within the region i1 =
S0-100, while is within the region i, - 15-240.
4. The number 14 and particularly the numbers I" and M"I W
increase with increasing flow rate. In this case the relation between
the values " and i depends on the value As a rule, " <NK MýK
however, with large z and very small undercuts we have the inequality
NK> 1 -wi-

Analysis of the comparative characteristics of wheels with two-
stage cascades makes it possible to make the following remarks (Fig. 5):
i. With increasing 7K and decreasing z the zone of economic and
stable wheel operation increases.
2. The value of 7j depends on 7 and z. The dependence max=
= f(5) has an extremal value. For all series of wheels, with increas-
ing f there is first an increase in the efficiency to its maximum
value, then it decreases, and finally, when DI > 0.8-0.9, it again
increases somewhat. The nature of these curves can be explained as
follows.
Transition to a two-stage cascade due to undercutting at the
inlet of the vanes results in decreased restriction of the flow (an
increase in ¶) and an increase in the channel exposure angle v of the
first stage compared with the same sections of the starting cascade.
For the first stage of vanes, with a further increase in D K the values
of T and vI remain constant, ¶K increases, while v K decreases slightly.
For rather large z, there will be, at the starting cascade, great
restriction and a small channel exposure angle at the inlet. A small
S (large M" ) will have a negative influence on the operationI st NI st
of the cascade. The influence of small v. st will, however, be insig-
nificant. By undercutting the vane of such a starting cascade we
first decrease the negative influence of great flow restriction. The
influence of undercutting the vanes, however, on the increase of the
angle v. is less clearly expressed. Therefore, when undercutting the
vanes in the starting cascade with high v we can likely expect increased
efficiency. A further increase in 'bK will involve a decrease in flow
restzriction and flow surface friction against the vanes. This leasS
simultaneously to an increased load on the vane apparatus and,
-55-

consequently, to increased local Mach numbers and local diffusivity
on the airfoil, and also to an increase in the part of the channel
having a large exposure angle. Because of these factors, bginning
at a certain D, there is a reduction in efficiency.
The negative influence of these factors for large undercuts, for
the given wheels with 5 > 0.8-0.9, is intensified by the fact that
the short vanes of the second stage of the cascade cease to. operate
as aerodynamic airfoils and are essentially additional resistance.
Therefore, with further undercutting of the vanes, right up to com-
plete shearing of the vanes, there is a certain increase in efficiency.
These concepts make it possible to assume that if the starting
cascade has small z, i.e., large . st (small st ) and large angteVi st' undercutting of the vanes may not increase the efficiency but,
conversely, lower it. In this case a positive influence of the two-
stage cascade on wheel operation can be attained by installing addi-
tional short vanes at the outlet. This decreases the local diffusivity
of the channel at the exit and evidently decreases the intensity of
the turbulent region on the nonacting surface of the vanes. This
analysis shows that the larger the z of the starting cascade, the
larger will be the values of D for which the optimum operating regimes
of a two-stage cascade will be attained. Experimental data have con-
firmed this conclusion.
3. The head coefficient *Opt is a function of DK and z. With
a relatively small number of vanes (z = 16-24) for the starting cas-cade an increase in D causes a decrease in *Opt. With increasing
z the region of decreasing *Opt decreases.
The decrease in yi* with small z, particularly for slight under-
cuts, is evidently associated with a sharp (two-fold) increase in the
-56-

Iangle vi in the cascade of the first stage (compared with the starting
cascade), while the other factors are weakly expressed.* We should
note that with relatively small z the conditions of flow inlet to the
cascade influence the direction of the outlet velocity and, consequently,
the head.
For large z, when the angles v, and small and their influence
is not substantial, undercutting of the vanes, which lowers the
restriction of the flow and decreases energy lost to friction of the
gas against the vanes, can cause an increase in the load on the vane
apparatus and the diffusivity of the channels of the first stage. In
connection with the above, the nature of the change in Wopt for under-
cutting of the vanes in a two-stage cascade will depend on the rela-
tion between these coefficients at the starting and derived cascades.
4. The values of qPoPt and qPor depend on 1 as well as on z.
With increasing D for all wheel series there is an increase in
T Poopt and a decrease in 'Popcr- The greatest change in q)POopt and
Sis observed in the zone 0.55-0.62. For large 5 the values•p0 Cr isosredi h zn
of qPoOPt and TPoCr remain practically constant and only when 5K >
> 0.85-0.9 and for small z is there again a certain decrease in qPoCr
for large K , while for large z (series 24/12) there .is no decrease
whatsoever.
The shift in the maxima of ,la! and ip* vs. 15 and z can be explaineda'C
by the influence of the change in the value of-xI and T on the ratio
between and Mwicr, and and M" ci K w cr
The abrupt shift of the maximum efficiency toward higher flow
rates when D A 0.58-62 can evidently be explained by the sharply
* We should mention that the question of the influence of theoaileo v on operation of the cascade is a complex problem, one that
i',,'e.n little studied. Special studies are required to solve it.
-57-

decreased restriction of flow at the inlet and, consequently, by the
sharp decrease in X4 compared with _ .
An increase in 5, in final analysis, decreases flow restriction
in a two-stage cascade and therefore it in principle should Iower the
value of qPcr. The greatest decrease in 9p 0cr for f < 0.58-0.62
is evidently explained in the same way as the increase in 'PoPOt in
this region. The decrease in 9p 0 cr for 5 > 0.85-0.9 can be associated
with the fact that further undercutting of the vanes, eliminating the
inefficient airfoils of the second stage of the cascade, results in
improved flow aerodynamics and, consequently, an increase in the
"or numbers in the cascade channels. Therefore retention of
the inequality :i o Icr is now possible for larger ii (smaller @P0)"
With increasing z and, consequently, decreasing load on the vanes and
angle v, the' influence of greatly shortened vanes on the flow aero-
dynamics decreases. Therefore there is less of a decrease in q)
in the region D > 0.85-0.9, while for the series of wheels beginning
with 24/12 there is none whatsoever.
Analysis of the curves ky = f(D ) shows that the width of the
acting zone of the characteristic depends on D and on z. In the
region 5 K 0. 58-0.62 there is a sharp expansion of the acting zone
of the wheel characteristic. A further increase in D5 does not result
in a substantial change in kY, and only when 5 > 0.85-0.9 for small
z is there again observed an increase in ky. There is less expansion
of the acting zone of the characteristic in this range of changes of
D with increasing z, while for the series of wheels beginning with
24/12 there is no expansion. The nature of the change in ky Vs. 1
and z is determined by the corresponding shift in the maximum effi'.
ciency and head coefficient.
-58-

5. The relative flow nonuniformity with respect to energy (the
coefficients kc a) and kh i) does not depend on DK and z.
The relative flow nonuniformity with respect to angle and flow
rate (the coefficients ka and kG) depends on 5. With an increase in
'K to 0.76-0.8 the coefficients k. and kG remain practically constant
A further increase in DK leads to an increase in ka and kG. This
latter can evidently be explained by the above-mentioned negative
influence of the greatly shortened vanes of the second stage of the
cascade. Removal of these vanes again decreases ka and kG. As is to
be expected, the surge on the curves of k. and k for 5 > 0.76-0.8
corresponds to a certain decrease efficiency in this zone.
The shape of the curve of the absolute flow nonuniformity with
respect to the angle Aa = f(5 ) is basically identical with that ofthe curve ka = f(D ), and can be explained by the sane reasons.
6. The numbers Mwl and Mt' depend on z and also 5 for -* max6. Te nmbes Mi Wi a mx
The numbers Mw I and I , with increasing D', increase somewhat. This
is due to the fact that an increase in D results in an increase inif i
cP 0 opt and, consequently, in w and wi and, respectively, M and-
With increasing z IPoOpt decreases, which lowers Mw The value
of "with increased z is greatly influence by the increased flowNI Mrestriction which increases w", and therefore increases.
±
3. Comparison of the Results of a Theoretical Analysis
with Experimental Investigations
Wheels with a Single-Stage Cascade. The proposed equation (7)
for estimating the influence of various geometric criteria of a wheel
and-the flow parameters on the value of the useful head can be used
,.lso to determine the optimum number of vanes. The graphic solution

of this equation, given in Fig. 2, shows that the optimum number of
vanes from the point of view of attaining maximum useful heads for
the investigated wheels is in the region zopt h = 16-23. From experi-
mental studies Zopt h - 14-20. Thus, the experimental data obtained
confirm the expediency of using theoretical dependence (7).
The possibility of using Eq. (9) for determining the optimum
number of vanes from the standpoint of achieving the maximum width
of the acting zone of the wheel characteristic with a sufficiently
high efficiency has been confirmed by experimental data obtained.
For the investigated wheels z opt M = 10-14 vanes. According to experi-
mental results zopt M = 1i-13. In this case, compared with a wheel
with z 2 = Zi = 16 ky increases 2- to 3-fold, while the efficiency only
decreases 1. 5-2.0%.
Wheels with a Two-Stage Cascade. The proposed equation (7), from
a qualitative standpoint, correctly evaluates the influence of z and
D on the losses of useful head in a wheel with a two-stage cascade.
Analysis of this equation shows that with increasing D the optimum
number of vanes z opt h increases. From the point of view of achieving
minimum losses of useful head, use of the two-stage cascade is Justi-
fied only when z2 ;1 18-20. This agrees with experimental data obtained,
in accordance with which Z2 opt h > 24.
The use of Eq. (7) to calculate Zopt h in the region of large
DI leads to quantitatively incorrect results because of the mentioned
restrictions on dependence (6) due to the negative influence of the
greatly shortened vanes of the second stage.
Comparison of theoretical and experimental data makes it possible
to confirm that Eq. (9) can be used to determine the optimum values
of z and D/ for wheels with a two-stage cascade from the point of view
-60-

of attaining maximum width of the acting zone of the characteristic
with reasonably high efficiency. The theoretical and experimental
curves in the region DP < 0.8, whosn in Fig. 6, practically coincide.
Shrouded wheels having a single-stage cascade of normally back-
ward bent vanes with z2 = z = 16-24 are widely used in stationary
centrifugal compressors. The conversion from single-stage cascades
of such wheels to two, tage cascades with z2 = 2z, makes it possible
to increase the efficiency and expand the acting zone of the wheel
characteristic (Fig. 6). True, with relatively small z (in our case
z2 = 16 and 20), this involves a certain reduction in 16 max and k,
as well as with respect to '*.
The relative increase (positive or negative) in the values of
max' k, and •opt for optimum two-stage cascades of each series,a; a'y optcompared with their starting single-stage cascades and with an optimum
single-stage cascade having z = i6,* is shown in Table 2.
Our experimental study has made it possible to make a qualitative
and quantitative estimate of the influence of z and f on the operating
efficiency of a wheel with a two-stage cascade. The quantitative data
obtained, strictly speaking, are valid only for specific wheel and
flow parameters, i.e., for specific Pgi' P IgP' DI/D2' 6/D2, shape
of the leading edge of the vanes, etc. A change in these parameters
compared with those used in the experiments might have the result that
the influence of z and 5 would change quantitatively, to a certain
extent. It should be noted, however, that our study was made for
wheels constructed according to generally accepted recommendations
• * Investigations of the LPI [8] showed that the optimum single-stage cascade, from the standpoint of maximum efficiency and head forthe given wheel geometry, is obtained when z2 - zi = :6.
-6f-

for typical wheels of stationary low-output centrifugal compressors.
Use of the obtained theoretical dependences makes possible a
qualitative and quantitative analysis of cascades for various geometric
dimensions of a wheel and distinct flow parameters.
dizLeotion of rotation
Fig. i. Diagram of the investigatedwheels.
- l kll z) l,
Fig. 2. Determinationof zopt h of wheels with
single- and two-stagecascades.
85 11 1.5 2 X 285 y ~ z 5
-62-

r
JZO
2,5-Z
2,0 0 8982rl I I
W(z)
I I.
016-
___ M
8 1? IF 20 n d•24 z z J6
Fig. -3. The effect of .z and 51
on the level of local M numbers,losses in useful head, andhydraulic efficiency.
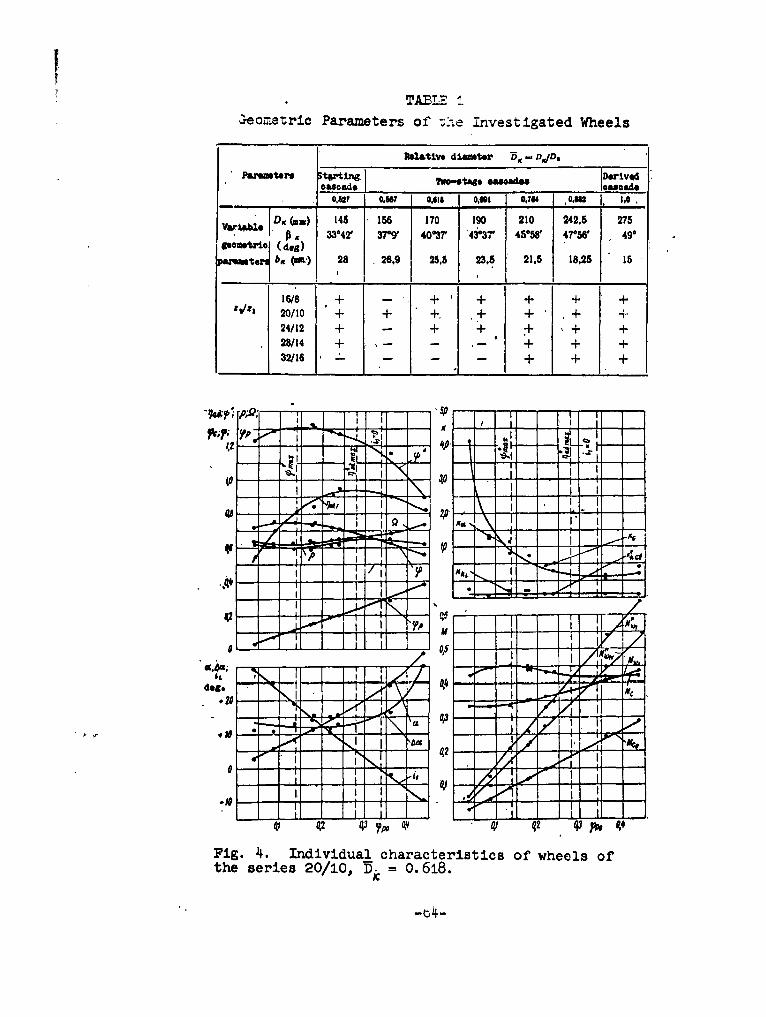
Z-eomietric Parameters of -2,e 1nvestigated Wheels
Pb~tiv* daDeerivjd
A,, 33042' 37@9 40-37 "43037' 4558' 4rW8 490
to x28 26.9 25A5 23.5 21,5 18.25 15
+01 + +, + + .+ 4-2/2+ + t ± + +
28/1 + 4 + + + -
0. EL A l~e4
.1 4,43iFi. f.Inivdul haateisic o'0helso
the erie 20/0, ~ = 061r

h•' __ • [ - , ,-!-.Z
f# -- ' •--r F 1 --
03{• ,__-• __ _• F IT
0.4
F77• j[ I ZrtI--7
tos
?p - ,Ac 10 - " ,
I- -4 , ,_ -
- dog.x -- V -- 0
Fig. 5..Comparative characteristics of
waheels of the serie3 20/10 ("amax - 220).

-:i, : =- . . .. ..m
244024/l z/,e!,/s 4-
Fig. 6. Comparative characteristic of wheelswith starting and derived single-stage, andoptimum two-stage, cascades.
TABLE 2
Comparison of Wheels with Single- and Two-Stage Cascades
omm - -
optp tha
• .,.. •.o., •.:° A,.; "k-
-!:tfL A rI
16, 8 0.59 +4 --3.2 -i-4 --3.2
20/10 0,65 +6 --3.9 +4 --2.4.24/12 0.76 49 --4 +3.5 NOW
2F/14 . 0,9 +Cp t +6,5 +4 +2e 3
32/16 .0.8 -- -- + 1.0 +4
; -66-

REFERENCES
i.. Yu. S. Podobuyv and K. P. Selezrxev. Teoriya i rasehet osevy'ki.*tsentro'bezhnylch lcompressorov, Mashgiz, 1957.
2. V. F. His. Tsentrobezhnyye kompressornyye mashiny, Mashgiz,
3. V. F. Rio.. Iz opyta proyektirovaniya kompressornykh mashinna NZL, Trudy NZL, vol. I, TsBNTI, 1957.
41. B. Elckert. Osevyye i tsentrobezhnyye kompressory, Mashgiz,1959.
5. V. M. Kulakov. 0 chisle lopatok v kolese turbokompressora,Trudy MVIT-F.TF ana, 1958, No. 75.
6. F. S. Rekatin. Vliyaniye otnositel'nogo shaga krugovoyreshetkid kolesa tse-ntfrobezhnogo kompressora na effektivnast' kolesa,Nauchno-tekhnicheskiy informatsionnyy byulleten', LPI, 1959, No. 12.
7. W. Kearton. The influence of the number of impeller bladeson the pressure generated in a centrif'ugal compressor and on. itsgeneral performance, Proc. Inst. Mech. Eng., 1933, vol. 1241.
8. 0.E Ble Contribution to the problem of designing radialturbomach8, Tran. A. S. M. E.), ±952, May.
9. S. A. Anisimov, et al. Vliyaniye chisla lopatok na effektiv-float' tsentrobezhnogo kolesa s odnoyarusnoy reshetkoy. See p. 20 ofthis collection.
10 F. S. Rekstin. Stend ETsK-i laboratorii kompressornykhmashin LPI im. M r. 'Kalinina, Nauchno-tekhnicheskiy informatsionnyybyulletent, LPI, 1959, No. 6.
ii. S. A. Anisimov. Issledovaniye raboty kolesa tsentrobezhnogokompressora. See p. 1 of this collection.
±2. S. A. Anisimov, et al. Sravneniye malogabaritnykh trubokpolnogo davleniya, Nauchno-tekbaicheskiy informatsionnyy byulletent,LPIO 1959, No. 6.
±3. Ibid., No. 12.
14. S. A. Anisimov, et al. Nekotoryye rekomendateii po ispolf-sov4Lniyu uglomerov dlya Issledovaniya potoka v protochnoy chastimodel'nykh tsentrobe zhnykh kompressorov, Nauchno-tekhnicheskiyinformatsionnyy byulletent, LPI, 1959, No. 12.
15. Yu. B. Galerkin and F. S. Rekstin. Malogabari~tnyy nasadokpolnogo davleniya a protokom, Nauchno-tfekhaicheskiy informatsionnyybyuxlletent, LPI, 1960,. No. 6.
-67-

16. F. S. Rekstin. Koordinatnik dyla isslodovaniya potolca vprotoohnoy chasi E-sie-nrobezhnogo kompressora, NO~uolmo-tekhnioheskiyinformatsionnyry byulleten',, LPI, 1959, No. 6.
-68-

CALCULATION OF VARIABLE REGIMES OF CASCADE FLOW
V. A. Zysin
When investigating one-dimensional flow and, in particular, when
analyzing variable regimes of operation of a turbine stage, great
importance may be attached to the clearness and relative simplicity
of the calculation methods used. This is particularly important in
the case of supercritical flow regimes.
Here it might be of great help to introduce an i-S diagram with
a grid of the dynamic characteristics - lines of constant specific
flow rates (Fanno lines) [4, 5]. This would make it possible, e.g.,
to directly determine the state of the supersonic flow behind the
turbine impeller if there is overexpansion relative to the given
counterpressure, to detect the possibility of flow choking, and to
solve a number of calculation problems.
However, for practical application it is necessary that the
diagram be generalized. Here it is desirable that the coordinates of
the dimensionless parameters to be determined and the selected scale
be most adaptable to the usual methods of turbine design.
In the present article we propose using a generalized diagram,
similar in structure to the ordinary i-S diagram, for a calculation
-69-

analysis of the variable regimes of turbine cascade operation.
Calculations using this method aim to explain the most general
regularities. Therefore, all processes are schematized to the utmost:
we use the stream theory, assume that the velocity and flow factors
are identical, do not take into account ejection, leakages, etc.
In light of the above, the methods herein proposed are not intended
to replace profound gasdynamic calculations which strive to take into
account to the fullest possible extent the influence of various factors.
1. The Generalized Dynamic Diagram
Figure I shows a generalized dynamic diagram constructed for an
ideal gas with an isentropic exponent k = 1.3.
The diagram itself and the method for constructing it have been
described previously [i]. Therefore, let us limit ourselves to a
brief examination of it.
The diagram was constructed for isoenergetic flow with irrevers-
ible losses. Consequently,, = i + A .- = const.j (±)
ds > 0,
where i 0 is the stagnation enthalpy, A = i/427T is the thermal equivalent
of work, c is the velocity, and s is the entropy.
Along the abscissa is plotted dimensionless entropy:
AsIn j5L -In P, (2)
where pO is the stagnation pressure for the given entropy, (po)z . 0
is the stagnation pressure for z = 0, p is the dimensional static
pressure, P - P/(Po)z - 0 is dimensionless pressure, and R is the gas
constant.
For convenience in using the diagram the abscissa contains a
-70-

uniform scale of dimensionless pressures.
Along the ordinate (from top to bottom) is plotted the dimension-
less velocitya Y T ' (3 )
where C = -/2g k/(k + i) R is a constant, a* is critical velocity,
and To is the absolute stagnation temperature.
The diagram contains a grid of dimensionless isobars P = const
and a grid of constant reduced flow rates (dimensionless Fanno lines)
a)----- • const. (4l)
Here y is the specific weight, and (cY)= 0 is the critical specific
flow rate (mass flow rate) at zero entropy.
From the upper left-hand corner of the diagram are drawn flow-
lines with constant velocity-loss coefficients 9 or *.
If, parallel to the ordinate, we plot the vertical scales of M,
T/To, and the other gasdynamlc functions, then when using the diagram
it is not necessary to resort to gasdynamic tables.
In addition, on the diagram we could plot grids of the dynamic
characteristics which would make it possible to calculate the com-
pression shocks. In Fig. i, for simplicity, these addIional con-
structions are omitted.
2. A Cascade for' Subsonic Velocities
Figure 2 shows, in X-z coordinates, the process in a turbine
-asoade for subcritical flow regimes.
When using one of the usual methods for calculating a turbine
for`a variable regime, the use of a diagram can facilitate determina-
tion of the state of the flow behind the cascade, if the parameters
of the incoming flow are given.
-71-

Actually, knowing the dimensional relative velocity of the incom-
ing flow c and the critical velocity am, we can determine the corre-
spon4ing dimensionless velocity X. W c/at. From this, on the X-z
diagram, we find the point a which corresponds to the state o'f the
flow entering the cascade.
Let us calculate the reduced flow rate on leaving the cascade:
®. sin a h (5)sin a, hc
where h is the height of the vanes of the preceding cascade or the
height of the guide channel, ha is the height of the vanes at the
exit from the calculated cascade, a is the angle formed by the cascade
axis and the vector of the incoming velocity, aI is the angle formed
by the cascade axis and the exit axis of the vane channel; %a is the
reduced flow rate of the incoming flow, and 0 e is the reduced flow
rate on emerging from the cascade.
Having determined from certain concepts the velocity coefficient
for the cascade q, let us find, at the intersection of the lines D =
i const and q, ' = const, the point b which corresponds to the flow
state at the exit section. From this we determine directly the dimen-
sionless exit velocity Xc., the corresponding dimensionless pressure
P eand the ideal exit velocity Xc0'
When using the generalized diagram it is easy to detect certain
phenomena which can occur in variable operation regimes.
For example, it may be that the line 0e corresponding to the
reduced flow rate at the impeller exit (Fig. 3) does not intersect
the line q, *. This indicates choking, during which the exit section
of the cascade cannot handle the given flow. From the diagram we can
immediately determine the maximum flow which the impeller can handle
for the given parameters of total stagnation ahead of it. This flow
-72-

iS determined by the reduced. flow Oe' the line of which touches the
curve y, #,, at point m.
3. A Cascade for Supersonic Flow Velocities
Let us examine a cascade consisting of a Laval nozzle. When
analyzing the process of expansion in nozzles we should take into
account the difference in losses in the convergent and divergent parts
of the nozzle. Often we can consider that all losses are concentrated
in the divergent part [3]. Then point k. on the X-z diagram (Fig. 4)
corresponds to the state of the flow in the sonic throat. Assuming
,hat the flow fills the entire exit section of the nozzle, let us
:.etermine the reduced flow in this section
(e - fmi'fe'
where fmin is the are of the sonic throat, and fe is the area of the
exit section.
Similarly, let us find the point b which corresponds to the stat-
of the flow in the exit section at the intersection of the lines v =
- const and (e - const.
If losses in the convergent part cannot be neglected, i.e., the
flow factor X < i, the reduced flow in the sonic throat
0m X.
Om=X
It is appropriate to note that in this case the sonic throat is
characterized on the diagram by the point m which has the corresponding
dimensionless velocity Xm - :.
* From the diagram we can immediately see that according to thestream theory the velocity is subsonic in the sonic throat of anactual Laval nozzle.
-73-

IThe throat is defined by the point k' on the intersection of the
line 9 - const (O for the convergent part of the nozzle) with the
line X = i.
The reduced flow in the exit section
-e = fmin/feX"
The position of the throat (in the divergent part of the nozzle)
is determined from the relationship
f/fmin - 'I'
where 0 is the reduced flow at the point kt.
Further, there are possible two basic regimes, depending on one
of the following conditions:
i) the relative rate of flow into the next cascade is supersonic,
or
2) the relative rate of flow into the next cascade is subsonic.
In the first case we can assume that the static pressure in the
axial clearance does not change, and the next cascade is calculated
in the usual manner.
If as a result of this calculation it appears that the state of
the flow behind the cascade is characterized by a point on the diagram
in the region X < 1, we should be on the lookout for choking in the
given stage.
In the second case, when the rate of flow into the next stage,
obtained from the velocity triangle, is subsonic, pressure in the
axial clearance in the general case will differ from the pressure in
the nozzle exit section, and will depend on the amount of pressure
drop in subsequent stages, and on the counterpressure.
-74-

If the pressure in the axial clearance Pn is defined in some way
or other, the cascade operating in the region of supersonic velocities
is calculated as a function of the sign of the inequality
P, P,
where pe is the static pressure in the exit section of the cascade.
If Pe > Pn = Pni there should be divergence in the transverse
section. Let point b (Fig. 4) define the state of the flow in the
nozzle exit section. This section has the corresponding dimension-
less pressure Pe and the dimensionless velocity X. (in the case of
convergent nozzles point b can lie only on the line X = I).
Let us determine the dimensionless pressure in the axial clearance
Pn i= Pn /PO.,
where PO is the total pressure (static and dynamic) ahead of the
nozzles.
The state of the flow behind the transverse section is defined
by the point n. at the intersection of the isobar P with the line
p, * = const. The dimensionless velocity Xcin, > and the reduced
flow "n correspond to the point n1 . From the ratio 0 n /"e we can
find the divergence in the transverse section by one of the familiar
methods. If we consider that there are no losses in tle transverse
section, point b. on the vertical dropped from point b onto the isobar
Pn corresponds to the state of the flow behind the section.
When the pressure in the cascade exit section is lower than that
in the axial clearanoe, strong shock waves are unavoidable.
,,If we assume that the flow is not separated from the walls at
the end of the vane channel, the state behind the exit section is
defined by the intersection of the line (e with the dimensionless
-75-

isobar correspbnding to the given pressure in the axial gap. Figure
4 shows cases when, depending on the counterpressure, the terminal
velocity remains supersonic (the point n2 ) or becomes subsonic (the
point n3). Actually, within the nozzle and in the exit stream, there
occurs a system of compression shocks accompanied by separation of
flow from the walls. Naturally, it is impossible to analyze such
phenomena on the basis of a model of one-dimensional flow used in the
given calculation method. At present it is most correct to use exper-
imental data.
However, we can state that the calculation method given here
gives maximum losses. Actually, if there is flor separation from the
walls (or vice versa) on intersection of the shock front in the free
stream, the current density increases. Consequently, the new reduced
flow 0e is greater than the reduced flow 0e which corresponds to flow
without separation. But now expansion to the given dimensionless
pressure pn2 or p n3 is given not by the points n 2 and n3, but by the
points nq and n• respectively. Figure 4 shows directly that in this
case the value of the terminal entropy decreases, while the velocity
increases.
4. Calculation of a Cr cade for Choi±rng
Above wp examined the case when the cascade cannot pass t:e giwv.
flow due to insufficient area of the exit sections.
It has been shown experimentally that often flow choking is
caused by the angle of attack at the cascade inlet [2]. Actually,
we know that a decrease in current density corresponds to a flow
shock into the concave part of the vane, while an increase in curre•i:
density corresponds to a flow shock into the convex part. In this
-76

latter case there is the danger of flow choking by the leading edges
of the cascade.
If the relative velocity of the incoming undisturbed flow has the
corresponding reduced fl-ow %', the reduced rate of flow into the cas-
cade
Oin = • sin(p, - 6)/sin 0,, (6)
where 6 is the angle of attack, considered positive for a shock into
the concave surface; and P, is the inlet angle of the vane apparatus.
Obviously, even in the ideal case it is necessary that
(in < 1.
From this condition we can determine the negative angle of attac '
for which there will be no flow choking on entry into the cascade.
Considering the finite thickness of the leading edges ar.d the addi-
tional irreversible losses, we should consider that for subsonic
velocity of the incoming flow we must assume the probability of chok-
ing at 0 e > 0.975, to which correspond (at k = 1.3) the values of the
dimensionless velocity Xin > 0.85. In the case of slight overlappings.
for thick leading edges, choking occurs even earlier.
When the incoming flow is supersonic, the danger of choking exist
continually with negative angles of attack.*
It may be that the section limiting the flow is located in the
vane channel, if in the latter the cross section is minimum.
The cascade in this case can be preliminarily checked as follows.
We construct a graph on which along the abscissa is plotted the
;* For example, experiments conducted at Leningrad PolytechnicInstitute and the Central Scientific Research Institute for Boilersand Turbines revealed choking in all cases when the supersonic incom-ing flow had negative angles of attack [2].
-77-

chord of the airfoil bA, and along the ordinate is plotted the reduced
flow, using as unity the critical flow on entry into the cascade *a
(Fig. 5).
The critical reduced flow at the cascade exit
S= PC,
where: P, is the dimensionless pressure at point c (Fig. 2).
If we assume that there is uniform loss in head along the chord
of airfoil b, dz/db i const. The change in critical reduced flow in
the vane channel is thus depicted by the straight line A-B (Fig. 5).
On this same graph we can plot the curve of the change in reduced
flow in the channel:
On = "a = fa/fn'
where 0n is the reduced flow in the given section, and fa is the area
of the corresponding section, determined from the drawing.
If the line On intersects line A-B which corresponds to the
critical flows (segment C'-D' in Fig. 5), we should suspect that the
vane channel will not be able to handle the given flow.
ITD.-TT- 62-i8i6- 1+2+4 -78-

A A
411 '
.... .....-
Fig. 2. Representation ofthe process in an airfoilcascade on a X-z dia.gramfor X < 1.
!HG
4M 01 q& £ ) 8 0.75~ 0,7 45J 46;
Fig. 1. Generalized diagramfor velocity (X = c/a+) minusentropy (z - As/AR). Abscissa- A.-scale of dimensionless pressure.
Fig. 3. Case in which theA-o exit section will not handle
the given flow.
Al.
9p•• • ." I,vI , .
C
Fig. 5. Checking the vaneFig. 4. The process in channel for choking.Laval nozzles.
PTD-TT-62-1816-i+2+4 -79-

i.. V.A Zs Graf'oanaliticheskiy metod rascheta odn~omerrqkhpotokov ozhifer zhiLdkosti. Trudy LIP, No. 2, 1954&.
2. V. A. Zysin, et ale Teploenergetikit, No. 2, 1-955.
3. 1. I. Kirillov, and S. A. Icantor. 'sooriya 1. konstruktaiyaparovyich tur-bin, Mashgiz, 1'7
4f. A. Stodola. Dampf und Gasturbineri, VI Auflage,, 1924.
5. J. Kesti~n., J. M. E. Proc., Vol. 159, 1948.
FTD-T-61-816-+2+4-8o-

IV
DISTRIBUTION LIST
DEPARD(ENT OF DEFENSE Mr. Copies MAJOR AIR COOWIDS= Mr. Cdpi"s
AYSCSCFDD IASTIA 25
HLADQUARTERS USAF TDBTL 5TDBDP 5
AFCIN-3D2 1AZDC (AnY) 1ARL (ARB) 1SSD (8sF) 2
3SD (38P) 1AFPTC (PTY) I
OTHER AGENCIES ArmI Csui)1CIA1NSA 6DIA 9AID 2O TS 2AEC 2Pws 1NASA 1ARMY 3NAVY 3
RAND IPOE 12NAPSO
FTD-TT- 62-1816/142+.4 81