ultra low emission vehicles: the business case, the ... · ultra low emission vehicles: the...
TRANSCRIPT

Ultra Low Emission Vehicles: The business case, the technology
and best practice
Luke RedfernCommercial Partnerships Manager


Cenex Overview of LCV Technology
Cenex partners and clients
Economic development, business case advice, techno-market consultancy, due diligence
Trial management and implementation support of Low carbon vehicle technology and energy infrastructure
Advice and implementation support for fleets and cities (e-,H2,CH4)
Policy, public affairs and operational ‘project brokerage’ support, project dissemination including the LCV event

Cenex Overview of LCV Technology
Where to begin?
CAZ – Clean Air ZoneEuro IV, V, VI, EEVULEV – Ultra Low Emission VehiclePiVG – Plug-in Van GrantPiVC – Plug-in Car GrantOLEV – Office for Low Emission VehiclesGUL – Go Ultra LowEV – Electric VehiclePHEV – Plug-In Hybrid Electric VehicleCVTF – Clean Vehicle Technology FundLEZ – Low Emission ZoneRPC – Reduced Pollution CertificateREEV – Range Extended Electric VehiclePiP – Plugged-In PlacesEuro 4, 5, 6
DfT
ULEVs
OLEV
EVs, PHEVs, REEVs
PiVG & PiCG
PiP & GUL

Cenex Overview of LCV Technology

Cenex Overview of LCV Technology
Technology is moving forwards
Conventional ICE
Simple Hybrid
Plug-In Hybrid
Pure EV Hydrogen
2010 2015 2020 2025
Adapted from Automotive Council 2013 Roadmaps
• General acceptance that there is a need to lower the emissions impact of vehicles

Cenex Overview of LCV Technology
Benefits to the business
Plug-in Van/Car
GrantClass 1A NI
BIK tax savings
VED Fuel CostsReduced
SMR Costs
Whole life cost saving / total cost of ownership
Cenex Overview of LCV Technology
Low Emission Vehicles: The Vehicle Technology

Cenex Overview of LCV Technology
Battery Electric Vehicles (EVs)
Costs can be anywhere from £13,945 to £100,000+

Cenex Overview of LCV Technology
Plug-In Hybrid (PHEVs)
Costs can be anywhere from £33,945 to £51,000+

Cenex Overview of LCV Technology
Range Extended Electric Vehicle (REx, REEV)
Costs can be anywhere from £35,000+

Cenex Overview of LCV Technology
Simple Hybrid Technology
• A hybrid vehicle combines two power sources, an ICE and battery.• A stop-start system, plus energy recovery from braking and limited engine assist
under acceleration

Cenex Overview of LCV Technology
Hydrogen
Costs can be anywhere from £53,050 to £65,954+

Cenex Overview of LCV Technology
Low Emission Vehicles: The Infrastructure Technology

Cenex Overview of LCV Technology
Charging Electric Vehicles
Case B Case C
Case A
Conductive

Cenex Overview of LCV Technology
Charging Electric Vehicles
Inductive

Cenex Overview of LCV Technology
Charging Electric Vehicles

Cenex Overview of LCV Technology
Charging Speeds
Slow or standard charging is typically:• 0-100% in 10-12 hours• 13-16 Amps AC single phase• UK household or “caravan hook-up” style
plug and socket (BS1363) or “Blue Commando” (EN60309)
Fast charging is typically:• 0-100% in 4-6 hours• 16-32 Amps AC single phase• Type 2 plug and socket
Semi-rapid charging is typically:• 0-100% in 1-2 hours• 32 Amps AC three phase• Type 2 plug and socket
Rapid charging is typically:• 0-80% in 20-30 minutes• 63 Amps AC three phase or 100
Amps DC• Type 2 (AC), JEVS/G105 (DC) or
CCS Combo 2 (DC)

Cenex Overview of LCV Technology
Charge Point Costs

Cenex Overview of LCV Technology
Charge Point Costs

Cenex Overview of LCV Technology
Siting Chargepoints
• Identify major routes through the region and the traffic flow on them
• Determine what charge point sites are planned within the region
• National and regional EV registration data should be utilised to identify clear locations that possess an EV customer base
• Sites that allow a good dwell time should be considered, with a criteria that evaluates;• proximity to attractions• space size and utilisation• power supply availability• ownership and contract obligations• security (e.g. CCTV)• existing infrastructure (e.g. availability of walls for wall
mounted points).

Cenex Overview of LCV Technology
Hydrogen Refuelling
• UK hydrogen infrastructure deployment only emerging
• Typically for research purposes or for specific fleets
• Dispensed at either 350 or 700 bar gas
350 bar provided by TK16 nozzle 700 bar provided by TK17 nozzle

Cenex Overview of LCV Technology
Case Studies

Cenex Overview of LCV Technology
British Gas, and the eNV200
• Cenex was commissioned by British Gas to examine the potential cost, emissions and performance implications of integrating electric vehicles into their fleet operations. British Gas operates the third largest fleet in the UK, covering over 160 million miles per year.
• e-NV200 could be a commercial, environmental and operational success in city environments given the (TCO) identified.
• Variations in range due to differing driving duties and high auxiliary loads in cold weather were not overlooked

Cenex Overview of LCV Technology
Segmentation• May need to change the way we segment, and think past the usual ‘categories’
Grey Fleet & Company Cars
HGVs
White Fleet

Cenex Overview of LCV Technology
Segmentation• Start to segment vehicles on their average usage, and change driver behaviour
200miles+
Long distance company car
Rural deliveries
Pool car
Back to base vehicles
Urban deliveries

Cenex Overview of LCV Technology
Wyre Forest Council
Vehicle make & model Ford Transit Connect T220 L75
Vehicle reg. number KT07 OAJ
Data date range 12/04/2016 to 26/04/2016
Average daily mileage 36.7 miles
Days/week usage 6.1 days
Extrapolated annual mileage 11600 miles
Average journeys per day 14.9 journeys
Average journey mileage 2.5 miles
Average daily driving time 2 hours and 36 mins
Average journey driving time 10 mins 30 seconds
In an electric vehicle:
Average daily % charge used 60% State of Charge
Average daily battery capacity used 12.5 kWh out of 21kWh
Driving habit distribution based on observation of usual routes followed
by the vehicle.

Cenex Overview of LCV Technology
Wyre Forest Council
27% of the days the vehicle would need charging during the day, approximately a 20% SoC top-up charge. Using a fast charger (6.6 kW) this would take ca. 40 mins, while a slow charger (3.3 kW) would take ca. 1 hour 30 mins.

Cenex Overview of LCV Technology
Wyre Forest Council
This model, based on 5 years of ownership, proves thestrong economic and environmental advantage of theelectric vehicles against the diesel vehicle. The lack of taxes,the plug-in van grant, and the lower fuel and maintenancecosts combine to allow strong whole life cost savings. TheNissan e-NV200 shows a better economic performancecompared to the Renault Kangoo ZE due to its lowerdepreciation rate (thus higher resale value). The electricvehicles offer a 100% reduction in tailpipe CO2 emissionsand a 42% reduction in well-to-wheel CO2 emissions.

Cenex Overview of LCV Technology
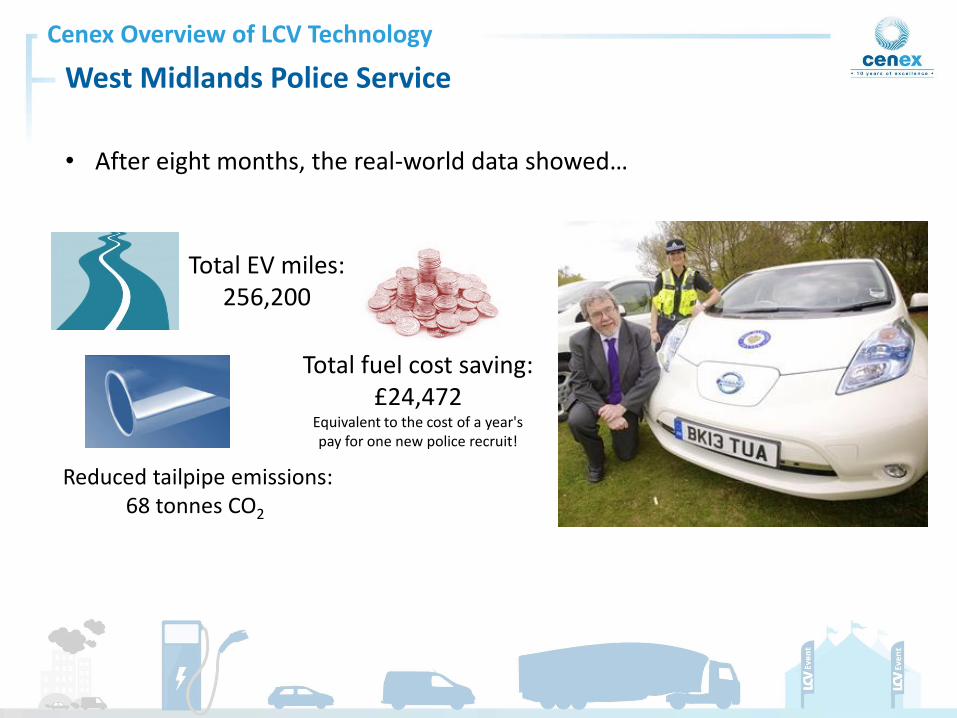
West Midlands Police Service
• Cenex ran a consultancy project with West Midlands Police (WMP) to test the possibility of using the Nissan LEAF as “diary cars” in their fleet operations
• After a successful trial with Cenex, in June 2013 the force ordered 30 LEAFs to be split evenly across all 10 local policing units (LPUs) as diary cars to attend pre-arranged meetings with victims of crimes who have contacted the police
• The cars typically travel 40 to 45 miles a day, but this varies depending on the LPU. They are currently exploring other opportunities for further LCVs in their fleet operations.
Cenex Overview of LCV Technology
West Midlands Police Service
• After eight months, the real-world data showed…
Total EV miles:256,200
Total fuel cost saving:£24,472
Equivalent to the cost of a year's pay for one new police recruit!
Reduced tailpipe emissions:68 tonnes CO2

Cenex Overview of LCV Technology
Van Cost and Carbon Calculator Tool
• Cenex’s VC3 tool enables fleet decision makers to assess the feasibility of incorporating new low carbon vans into their fleet. The tool is based on real-world driving cycles, meaning it predicts real-world fuel consumption.
• By providing a realistic whole life cost, the VC3
de-risks the implementation of low carbon fleet solutions.
• The VC3 tool was developed by Cenex with funding from the Low Carbon Vehicle Partnership (LowCVP).
• http://vc3.cenex.co.uk/
