ultimate shear behavior and modeling of reinforced ... ultimate shear behavior and modeling of...
TRANSCRIPT

Instructions for use
Title Ultimate Shear Behavior and Modeling of Reinforced Concrete Members Jacketed by Fiber Reinforced Polymer andSteel
Author(s) Jirawattanasomkul, Tidarut
Issue Date 2013-09-25
DOI 10.14943/doctoral.k11131
Doc URL http://hdl.handle.net/2115/53882
Type theses (doctoral)
File Information Tidarut_Jirawattanasomkul.pdf
Hokkaido University Collection of Scholarly and Academic Papers : HUSCAP

Ultimate Shear Behavior and Modeling of Reinforced Concrete Members Jacketed
by Fiber Reinforced Polymer and Steel
連続繊維もしくは鋼板巻立て補強鉄筋コンクリート
部材の終局せん断挙動とモデル
by
Tidarut JIRAWATTANASOMKUL
A Dissertation in Civil Engineering Submitted in
Partial Fulfillment of the Requirement for
the Degree of Doctor of Philosophy
English Engineering Education Program (E3)
Graduate School of Engineering
Hokkaido University
September 2013

i
Ultimate Shear behavior and Modeling of Reinforced Concrete Members Jacketed by FRP and Steel
ACKNOWLEGEMENT
I would like to express my sincere gratitude to my supervisor, Professor Tamon UEDA, for giving such a
great opportunity to study in Japan, especially Hokkaido University. Your invaluable supports during this
study are really appreciated.
I would like to extend my humble thanks to the committee members, Associate Professor Koshiro
NISHIMURA, Associate Professor Yasuhiko SATO, Professor Hiroshi YOKOTA, Professor Takafumi
SUGIYAMA, Professor Toshiro HAYASHIKAWA, and Professor Shunji KANIE. Your invaluable
comments and kind guidance on technical knowledge truly help improve the quality of this dissertation.
I would like to extend my gratitude and appreciation to Dr. Werawan MANAKUL-UEDA, former
program coordinator in English Engineering Education program, for all the supports, encouragements,
kind assistance to my academic and non-academic matters.
My sincere gratitude is extended to Associate Professor Yasuhiko SATO and Assistant Professor Hitoshi
FURUUCHI. I would also like to thank to Mr. Tsutomu Kimura for assisting and guiding during my
experimental works. To the lab's members, thank you so much for sharing either happy or tough time
together when we were conducting our experiments. I would especially like to thank my lovely friends
and colleagues, at Laboratory of Engineering for Maintenance System who have always cared about my
life, health, fatty, beauty and all matters.
To my best friends, Thana and Pitcha, thank you so much for your encouragement. I would also like to
thank you all my friends here in Thailand and Japan, Oliver, Matteo, Kira and many friends whom I did
not mention, for all your helps.
To my family, I have no word which can express my thanks for your supports, understanding,
encouragement and especially your unconditional love.
Tidarut JIRAWATTANASOMKUL
2013/06/12
ii
Ultimate Shear behavior and Modeling of Reinforced Concrete Members Jacketed by FRP and Steel
ABSTRACT
Many existing reinforced concrete (RC) members built using old design codes are susceptible to
catastrophic collapse during a major earthquake due to their insufficient shear strength and member
ductility. Use of fiber-reinforced polymer (FRP) composites as the external bonding/jacketing material of
RC members to improve their shear strength and ductility has been a widely used because of the high
strength-to-weight ratio and corrosion resistance of FRP composites. The most often used FRP
composites include carbon-fiber reinforced polymer (CFRP), glass-fiber reinforced polymer (GFRP), and
aramid-fiber-reinforced polymer (AFRP) composites, which are termed conventional FRPs. In recent
years, a new category of FRP composites, which are made of polyethylene naphthalate (PEN) or
polyethylene terephthalate (PET) fibers, have emerged as an alternative to conventional FRPs as the
strengthening materials of RC members. These FRPs have a much larger rupture strain (LRS) compared
to conventional FRPs. Although their elastic modulus and strength are relatively low, they are much
cheaper than conventional FRPs. It should be noted that the relatively low strength and modulus of LRS
FRP can be compensated by the use of a greater amount of the fiber material, whereas the small rupture
strain of conventional FRP cannot be compensated in this way. Up till now, it has remained unclear how
to predict the shear strength of LRS FRP-strengthened RC members, which in turn influence their overall
behaviors. Moreover, the efficiency of LRS FRP composites for the shear strengthening of RC members
remains a concern because concrete degradation may occur before the full activation of the strain capacity
of LRS FRP composites.
This research program aims to conduct an experimental study for the first time on the shear strength and
deformation behavior of RC members strengthened with LRS FRP composites. Tests on ten RC beams
strengthened in shear with fully wrapped PET FRP sheets have been conducted considering the following
test parameters: the strengthening ratio, the longitudinal reinforcement ratio and the shear-span to
effective-depth ratio. The increase in the amount of PET FRP sheets led to an increase of the shear
strength and shear ductility, whereas a lower longitudinal reinforcement ratio and a smaller shear-span to
effective-depth ratio corresponded to improved shear ductility. PET FRP sheets developed very high
strains, namely the maximum strains of 1.4–6% at the peak shear loads and as high as 14.0% at the
defined ultimate state (i.e., the load dropped by 20% compared to its peak load). Consequently, PET FRP
sheets can be used to enhance the shear strength of RC beams while substantially increasing the member
ductility. In particular, PET FRP sheets did not rupture at the peak load, and led to a ductile shear failure
of the strengthened RC members. This failure mode also enabled us to clearly observe the behavior of
shear strength degradation of concrete with increase in shear deformation even before the peak strength
was developed. The shear contribution of concrete was found to degrade by 0–54.6% depending on the
volumetric ratio of the FRP sheets, the shear-span to effective-depth ratio and the member depth. Owing
to the close relationships among the concrete shear deterioration, the member shear deformation and the
strain levels in both FRP sheets and transverse steel reinforcement as observed in the current study,
further research work was carried out to build up a comprehensive model to explain the above
relationships.
The development of a comprehensive shear strength model is proposed to precisely predict not only the
concrete shear deterioration but also the overall load-deformation responses of RC members. The
proposed model, based on the work of Sato et al., is extended to account for the stiffness of both flexural
and shear reinforcements, enabling us to connect interaction between flexural and shear strength
behaviors. To address this interaction, a flexure-shear interaction (FSI) analytical method is presented and
verified using existing experimental results, and demonstrate shear strength and ductility enhancement of
RC columns confined with several alternative jacketing materials, including CFRP, AFRP, PEN, and PET
FRPs. As part of the overall analytical process, in specimens failing in shear, the reduction in load-
carrying capacity with increase in deformation can be considered as a reduction of the contribution of the
shear strength behavior caused by the reduction in secant stiffness of both shear and flexural
reinforcements and residual concrete strength. However, in specimens failing in flexure, the load-carrying

iii
Ultimate Shear behavior and Modeling of Reinforced Concrete Members Jacketed by FRP and Steel
capacity decreases due to concrete crushing along with the buckling of the compression reinforcement.
The influence of the shear strength behavior on the flexural deformation is introduced through the tension
shift phenomenon which increases the flexural deformation. Meanwhile, the flexural strength behavior
affects the shear deformation through the yielding of flexural reinforcement, which decreases the shear
strength of concrete and also increases the shear reinforcement strain, causing an increase of the shear
deformation. The FSI analytical method can precisely predict the strain response of shear reinforcement,
including the rupture of the FRP jackets. It is proven that FRP with high fracture strain (PEN and PET) is
less likely to fracture than conventional fiber (Aramid and carbon) at ultimate deformation.
The final goal of this research program is to extend the FSI analytical method to the cases of
steel-jacketed RC members with different jacketing shapes (i.e., elliptical and rectangular shapes).
Comparing FRP and steel jacketing, FRP jacket can resist the shear crack opening only in the fiber
alignment whereas steel jacket can resist the opening in both vertical and lateral, leading to different in
the concrete shear strength and its degradation. Namely, concrete shear strength in steel jacketing is larger
than that in FRP jacketing since shear crack opening restrained by a steel jacket causes the aggregate
interlock of concrete, which results in it contributing to the shear resistance. In the FSI analytical method,
the concrete contribution to the shear strength is therefore significantly affected by the steel jacket, and its
contribution to shear strength is considered equivalent to that in a continuous transverse steel
reinforcement. Considering confinement shape, elliptical steel jackets provides better enhancement of the
flexural performance of inadequately confined columns than that of rectangular jacket. Using these
concepts, the FSI analytical method can successfully predict the load-deformation envelope responses of
RC columns with steel-jacketing. It can be concluded that the FSI analytical method is expeditious and
efficient for use in predicting structural response of RC members with and without various types of
seismic jacketing, while maintaining a high degree of accuracy.

iv
Ultimate Shear behavior and Modeling of Reinforced Concrete Members Jacketed by FRP and Steel
Table of contents
1. 1. INTRODUCTION
1.1. INTRODUCTORY REMARKS 1
1.2. OBJECTIVES AND SCOPE 3
1.3. ORGANIZATION 4
2. 2. PREVIOUS RESEARCH AND BACKGROUND
2.1. INTRODUCTION 6
2.2. EXPERIMENTAL STUDIES 6
2.2.1. Beam tests 6
2.2.2. Column tests 7
2.3. MODELS FOR SHEAR STRENGTH 10
2.3.1. ACI 318-02 (2002) 10
2.3.2. Canadian standards (2004) 11
2.3.3. CEB-FIP model code (2011) 12
2.3.4. Japan Society of Civil Engineering (2007) 12
2.4. DEFORMATIONS 12
2.4.1. Flexural deformation 12
2.4.2. Shear deformation 12
2.4.3. Pull-out deformation 13
2.4.3.1. Slip of reinforcement at yield strain 13
2.4.3.2. Slip of reinforcement after yield 13
3. 3. EXPERIMENTAL SETUP AND RESULTS
3.1. INTRODUCTION 15
3.2. EXPERIMENTAL PROGRAMS 15
3.2.1. Details of specimens 15
3.2.2. Materials 16
3.2.2.1. Concrete and steel reinforcement 16
3.2.2.2. PET sheet 18
3.2.3. Test procedures and instrumentation 19
3.2.3.1. Loading system, strain gauges and total deformations 19
3.2.3.2. Shear deformation devices 20
3.3. RESULTS AND DISCUSSION 21
3.3.1. Failure modes and crack patterns 21
3.3.2. Overall load-deformation responses 23
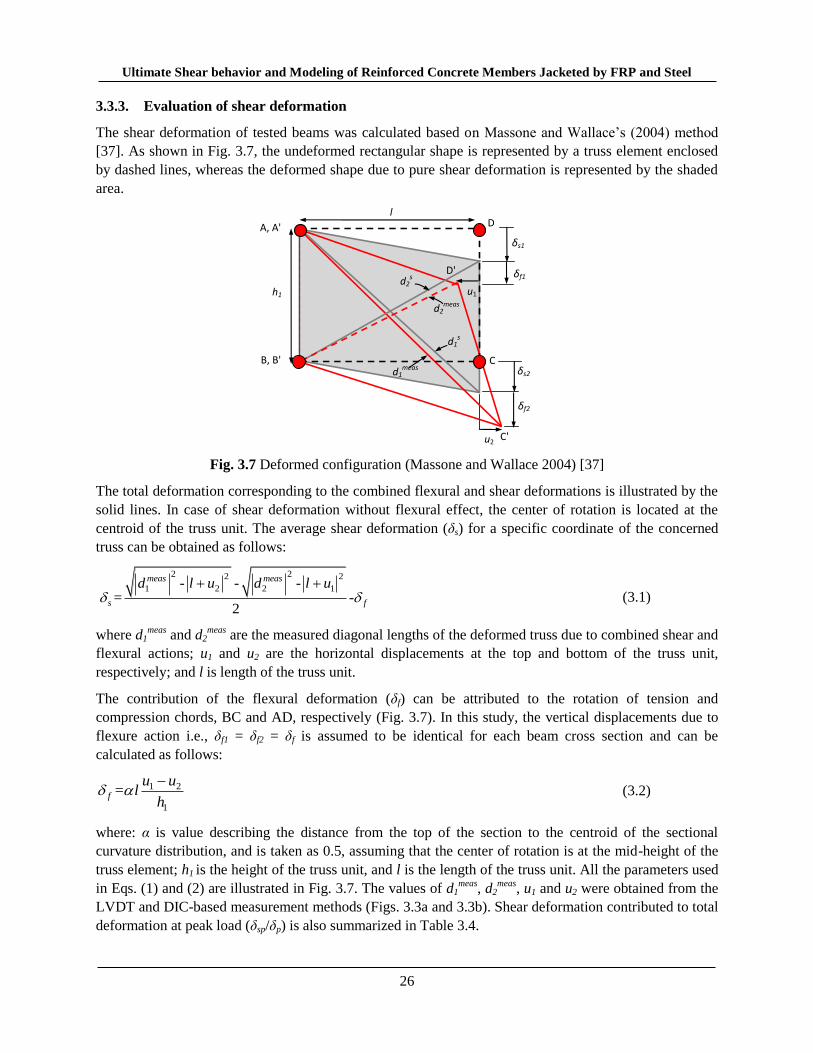
3.3.3. Evaluation of shear deformation 26
3.3.4. Strain development in PET FRP sheets and transverse steel reinforcement 27
3.3.5. Degradation of the shear contribution of concrete 30
3.4. SUMMARY 32
4. 4. MATERIAL AND STRENGTH MODELS
4.1. INTRODUCTION 33
4.2. MATERIAL MODELS FOR STRENGTH ANALYSIS 33
4.2.1. Concrete 33
4.2.2. Steel reinforcement 34
4.2.3. FRP sheet 34
4.2.4. Confinement effect 35
4.3. FLEXURAL STRENGTH 37

v
Ultimate Shear behavior and Modeling of Reinforced Concrete Members Jacketed by FRP and Steel
4.4. SHEAR STRENGTH 38
4.5. INTERACTION BETWEEN FLEXURAL AND SHEAR STRENGTHS 43
4.6. DEFORMATIONS MODELS 44
4.6.1. Flexural deformation model 44
4.6.2. Shear deformation model 45
4.6.2.1. Shear deformation in pre-yielding region 45
4.6.2.2. Shear deformation in post-yielding region 48
4.6.3. Pull-out deformation model 48
4.7. INTERACTION OF FLEXURE AND SHEAR ON DEFORMATION MODEL 48
4.8. THE FSI ANALYTICAL PROCEDURE 50
4.9. SUMMARY 52
5. 5. MODEL VERIFICATIONS
5.1. INTRODUCTION 53
5.2. LOAD-DEFORMATION MODELS AND COMBINED RESPONSE 53
5.2.1. Comparison of peak shear strength from experiments and models 53
5.2.1.1. Beam tests 53
5.2.1.2. Column tests 54
5.2.2. Comparison of load-deformation from experiments and models 56
5.2.2.1. Experimental results of Anggawiddjaja et al. 57
5.2.2.2. Experimental results of Iacobucci et al. 59
5.2.2.3. Experimental results of Saatcioglu and Ozceb 60
5.2.2.4. Experimental results of Sezen et al. 60
5.2.2.5. Experimental results of Aboutaha et al. and Priestley et al. 60
5.2.3. Comparison of deformation components from experiments and models
5.3. COMPARISON OF CALCULATED AND MEASURED
SHEAR FORCE COMPONENTS 62
5.4. COMPARISON OF DEFORMATION COMPONENTS FROM EXPERIMENTS AND
MODELS 62
5.5. SUMMARY 64
6. 6. CONCLUSIONS AND FUTURE CONCERN
6.1. CONCLUSIONS 65
6.1.1. Observed behavior of test specimens and evaluation of experimental data 65
6.1.2. Analytical methods 65
6.1.3. Applicable range of the proposed analytical methods 66
6.2. FUTURE CONCERNS 67
REFERENCES 69
APPENDIX A 73

1
Ultimate Shear behavior and Modeling of Reinforced Concrete Members Jacketed by FRP and Steel
CHAPTER 1
1.
INTRODUCTION
1.1. INTRODUCTORY REMARKS
During the Great Hanshin Earthquake, many reinforced concrete (RC) columns collapsed catastrophically
because of insufficient shear strength and low ductility. Shear failure is often brittle, catastrophic, and
leads to severe damage at a low ductility level [48-49]. To improve seismic performance of existing
columns, strengthening with Fiber Reinforced Polymer (FRP) is widely used because it shows great
promise in high specific strength and corrosion resistance [8,31,63]. Conventional FRPs—Carbon Fiber
Reinforced Polymer (CFRP) and Aramid Fiber Reinforced Polymer (AFRP)—are effective in enhancing
shear strength, but they are brittle because of their low fracture strains (Fig. 1.1a), resulting in early
rupture and loss of load-carrying capacity before the achievement of high ductility in shear-dominant
cases [5-6,23]. To avoid this early rupture behavior, alternative FRP materials were developed with high
fracture strain, in particular Polyethylene Naphthalate (PEN) and Polyethylene Terephthalate (PET),
which enhance shear strength and ductility while being more economical [66]. Materials with high
fracture strain often show low stiffness. The low stiffness can be compensated by the use of more
material; however, the low fracture strain cannot be compensated in this way. Consequently, high-
fracture-strain materials are preferable for achieving the required ductility performance (Fig. 1.1b).
Fig. 1.1 Conventional FRP and large rupture FRP
Prediction of FRP-strengthened RC columns from the pre-peak to post-peak regions has been a great
challenge for seismic engineers owing to the nonlinear behavior caused by complicated interactions
between flexural and shear strength behaviors. Most design specifications to date [2,11-12,20,25,27-28]
have ignored these interactions, although previous research [6,34,38-39,41] has revealed that the flexural
strength behavior influences the shear strength behavior in the yielding of the reinforcement and also the
concrete strength degradation. Many investigators [6,34,38-39,41] have reported a drop in potential shear
strength capacity even before the maximum flexural strength is reached. Although the shear force carried
(a) CFRP- jacketed RC member tested by Sirbu [61]
(b) PET- jacketed RC member tested by Senda [56]
2
Ultimate Shear behavior and Modeling of Reinforced Concrete Members Jacketed by FRP and Steel
by the concrete remains almost constant before the longitudinal reinforcement yields, after yielding this
shear force carried by concrete becomes smaller as the shear stress in the shear reinforcement continues to
be increased. This phenomenon clearly shows that the shear force carried by the concrete, such as the
dowel force and the contribution of compression zone, decreases after the main reinforcement deforms
plastically. Meanwhile, the shear strength behavior significantly affects the flexural strength behavior
related to the reduction of the neutral axis depth due to shear crack opening. Another limitation of existing
designs is that the prediction method for the deformation and ductility does not account for both flexure
and shear deformation mechanisms and their interaction. In reality, the decrease in secant stiffness of
flexural reinforcement due to flexural yielding and concrete strength deterioration directly influences the
shear deformation, and the tension shift effect in the truss mechanism after shear cracking induces an
additional flexural deformation [40-41,65]. To increase confidence in the safety of RC columns with and
without FRP jacketing, a precise analytical method to predict the load-deformation response should be
established for all possible failure modes.
Among the most common analytical methods for predicting load-deformation response of RC columns is
the section analysis method or so-called fiber model [13,21]. This method assumes that plane sections
before bending remain plane after bending while ignoring the shear behavior. In reality, the shear
behavior, such as the formation of shear cracks, significantly dominates the structural behavior. However,
the performance of columns failing in shear or shear-flexure cannot be estimated by this section analysis,
because the shear behavior is not taken into account. To consider the shear behavior, truss mechanism or
strut-and-tie models [22,32,42] have been developed to predict shear strengths. However, the shear
strengths estimated by these models vary over a wide range, and none of these models take into account
the degradation of the shear behavior in their prediction of the post-peak behavior of RC columns
precisely. To account for both flexural and shear behaviors, one research group has successfully
developed the Modified Concrete Field Theory (MCFT) based on the Finite Element Method (FEM)
[9,42,60,67-68]. In MCFT, a column is discretized into a large number of elements characterized by
biaxial stresses and stiffness, and analyzed using a nonlinear FEM. However, such computations are
complicated and impractical for engineering design. Consequently, empirical models have been
developed for simplicity [34,41,52-54,57].
Prediction of the degradation in shear strength in RC columns subjected to reversed cyclic loading using
empirical models has been proposed by many groups [33,34,41,52-54,57] in the context of catastrophic
shear failure related to diagonal shear cracking. Their models describe reasonably well the degradation of
the shear strength on increasing the flexural deformation. However, the shear strength capacity is
significantly degraded by the total deformation rather than by only the flexural deformation [19,71], so
these models are inherently imprecise. In RC columns, the total deformation consists of flexural, shear,
and pull-out deformations. Each deformation component not only degrades the shear strength, but also
affects the shear strength behavior. Sato et al. [52-54] proposed a model for the shear strength of RC
members that accounts for the stiffness of the flexural and shear reinforcements rather than using a
deformation-based approach. In their models, the yielding of reinforcements causes a reduction of
equivalent stiffness or so-called secant stiffness, leading to a reduction in the shear strength. Moreover,
they proposed the use of the average strain of shear reinforcement based on the reduction of the tension
stiffness of concrete surrounding the shear reinforcement. This allows the shear reinforcement fracture to
be predicted. Although these models were successful, they were verified by separating shear strength
contribution into many complicated components.
To address these deficiencies, a flexure-shear interaction (FSI) analytical method is presented which
allows a more precise prediction of the load-deformation responses of RC columns with or without

3
Ultimate Shear behavior and Modeling of Reinforced Concrete Members Jacketed by FRP and Steel
FRP-jacketing. In this FSI analytical method, conventional section analysis is applied by including a
parameter for the confinement ratio as a function of the secant stiffness of the transverse steel and fiber
reinforcements. By including the effects of shear, the truss mechanism proposed by Sato et al. [52-54] is
combined with the section analysis. After the onset of shear cracks, the additional flexural deformation
due to the tension shift phenomenon is included for a more precise prediction of the flexural deformation.
Use of a shear deformation model based on the truss mechanism accounts for the effects of tension
stiffening, fiber confinement and proposed strut angle. The shear and flexural deformations are combined
with the pull-out deformations to obtain an accurate prediction of the total deformations of the columns.
The proposed analytical method is verified using existing experimental results, and demonstrate shear
strength and ductility enhancement of RC columns confined with both low and high fracture strain fiber
materials, including CFRP, AFRP, PEN and PET FRP sheet.
The final goal of this research program is to extend the FSI analytical method to predict peak shear
strength in the cases of steel-jacketed RC members with different jacketing shapes (i.e., elliptical and
rectangular shapes). Comparing FRP and steel jacketing, FRP jacket can resist the shear crack opening
only in the fiber alignment whereas steel jacket can resist the opening in both vertical and lateral, leading
to different in the concrete shear strength and its degradation. Namely, concrete shear strength in steel
jacketing is larger than that in FRP jacketing since shear crack opening restrained by a steel jacket causes
the aggregate interlock of concrete, which results in it contributing to the shear resistance. In the FSI
analytical method, the concrete contribution to the shear strength is therefore significantly affected by the
steel jacket, and its contribution to shear strength is considered equivalent to that in a continuous
transverse steel reinforcement. Considering confinement shape, elliptical steel jackets provides better
enhancement of the flexural performance of inadequately confined columns than that of rectangular jacket.
Using these concepts, the FSI analytical method can successfully predict the load-deformation envelope
responses of RC columns with steel-jacketing. It can be concluded that the FSI analytical method is
expeditious and efficient for use in predicting structural response of RC members with and without
various types of seismic jacketing, while maintaining a high degree of accuracy.
1.2. OBJECTIVES AND SCOPE
In this study, the conventional section analysis approach or fiber model was modified for shear behavior
to be applicable for displacement-based evaluation of reinforced concrete members. The numerical
analysis of RC members was verified by means of a series of experiments on both beams and columns
strengthened with and without seismic jacketing. Those RC members were tested under monotonic and
reversed cyclic loading; parameters such as steel reinforcement and fiber ratio were varied. Therefore, the
objective of this research study is to develop the model for predicting the strength and deformation of
members with and without seismic retrofitting at ultimate state.
1) The experimental program involves only PET FRP wrapped RC beams.
2) To develop accurate predictive shear strength model with consideration of confinement effect and
strain development in FRP jacket, steel jacket and steel reinforcement.
3) In the case of FRP jacketing, both conventional FRPs (i.e., CFRP and AFRP) and LRS FRPs (i.e.,
PEN and PET FRP) considered in this research program are solely fully wrapped FRPs.
4) In the case of steel jacketing, RC columns are strengthened by welded steel plates so brittle shear
failure can be prevented and the column can develop its ultimate flexural capacity.

4
Ultimate Shear behavior and Modeling of Reinforced Concrete Members Jacketed by FRP and Steel
5) In FSI analytical method, the following features are considered:
a. A shear strength model represents degradation of shear strength in post-peak region;
b. A shear deformation model along the plastic hinge zone is considered in the pre- and post-
yielding regions;
c. A flexural strength model considering confinement effects of transverse reinforcement and jacket
(i.e., FRP and steel plates);
d. An additional flexural deformation model is taken into account owing to tension shifting;
e. The interactions between shear and flexural strength behaviors include (i) neutral axis depth
reduction due to shear cracking, (ii) flexural reinforcement stress increase due to shear cracking
(tension shift effect), (iii) effects of yielding of flexural reinforcement on shear strength, and (iv)
effect of concrete compression softening on shear strength.
6) The proposed analytical method is demonstrated to predict accurately the pre-peak and post-peak
load-deformation response, including the strain response of shear reinforcement until the ultimate
point of the rupture of non- and FRP-jacketed RC columns.
1.3. ORGANIZATION
The dissertation is divided into six chapters and basic contents of each chapter are shown in Fig 1.2. In
Chapter 2 the background of previous experiments tested by other researchers and shear strength model
codes is described. Then, in Chapter 3, the details of experimental programs and results are described. In
Chapter 4 the relevant models for prediction of load-deformation responses (i.e., stress-strain
relationships, flexural strength, shear strength, and deformation models) are outlined. In addition, the
related computational procedures are outlined. Chapter 5 describes the verifications and application of the
proposed models to a set of test specimens. Finally, Chapter 6 provides conclusions and future concerns.

5
Ultimate Shear behavior and Modeling of Reinforced Concrete Members Jacketed by FRP and Steel
2. Literature review
1. Introduction
4. Analytical models
Material models
Flexure-shear strength interaction
Flexural strength model
Shear strength model
Deformation model
- Flexural deformation
- Shear deformation
- Pull-out deformation
- Flexure-shear interaction effects on
deformation
6. Conclusions
5. Analytical results and model verification
General descriptions of testing specimens
Load-deformation responses
Verification of shear strength model
Comparison of calculated and experimental
shear force components
Deformation components
3. Experiments
Material properties
Instrumentations and test procedure
Results and discussion
Fig. 1.2. Organizations of dissertation

6
Ultimate Shear behavior and Modeling of Reinforced Concrete Members Jacketed by FRP and Steel
CHAPTER 2
2.
PREVIOUS RESEARCH AND BACKGROUND
2.1. INTRODUCTION
This chapter provides a general review of the behavior of reinforced concrete members which are
strengthened with fiber reinforced polymers (FRPs) and steel plates subjected to cyclic loading.
Background information on the material characteristics of confined concrete, steel with hardening stage,
FRP with high fracturing strain, and mechanism of RC members strengthened by FRP is reviewed. In
addition, summary of the previous experimental research on this topic is studied including an examination
of the various key parameters and failure mechanisms.
2.2. EXPERIMENTAL STUDIES
2.2.1. Beam tests [30,44]
The experimental results of RC beams with and without PET FRP-jacketed failing in shear [30,44] were
taken to investigate shear strength behaviors. The example of cross section and characteristics of beam
specimens are shown in Fig. 2.1. The details of beam specimens are presented in Table 2.1.
160
200
35
20
206
D10
D25D6
250 250
150 100150150
600
900
D6 stirrup
LVDT 100 mm
LVDT
10mm
LVDT
10mm
PET sheet
Fig. 2.1 Cross section and characteristics of specimens [30]
250
200LVDT
50mm
Load
7
Ultimate Shear behavior and Modeling of Reinforced Concrete Members Jacketed by FRP and Steel
2.2.2. Column tests
To evaluate the applicability and accuracy of the FSI analytical method, experimental results of twenty
tests on RC columns failing in shear, flexure-shear and flexure were compiled. Fig. 2.2 shows a test setup
and an example of a specimen tested by Anggawiddjaja et al. [5-6]. Data sets of a total of fifteen square
RC columns (denoted as SP) tested by Anggawiddjaja et al. [5-6] are used, involving various types of
FRP jackets, Aramid, PEN and PET fibers. The cross-sections of their columns are 400×400 mm2 and
600×600 mm2, as shown in Fig. 2.3a.
Data sets of RC columns tested by Iacobucci et al. [23] are also used. In their study, reinforced concrete
square columns with insufficient shear steel reinforcement were used to represent existing old columns
designed according to old seismic specifications. Their main focus was on testing RC columns with and
without CFRP jacketing under lateral cyclic displacement and high axial load ratio (P/f'coAg). Their
columns are denoted as AS and ASC with a cross-section of 305×305 mm2, as shown in Fig. 2.3b.
Additionally, the FRP was aligned along the entire height of the specimens. The fibers were oriented
perpendicular to the longitudinal axis of the column or in the shear direction. According to the flat coupon
tensile tests [5-6,23], the fracture strains of Aramid, PEN, PET and carbon fiber composite are 4.1%,
4.5%, 13.8% and 1.26%, respectively. More data sets on plain RC columns failing in shear tested by
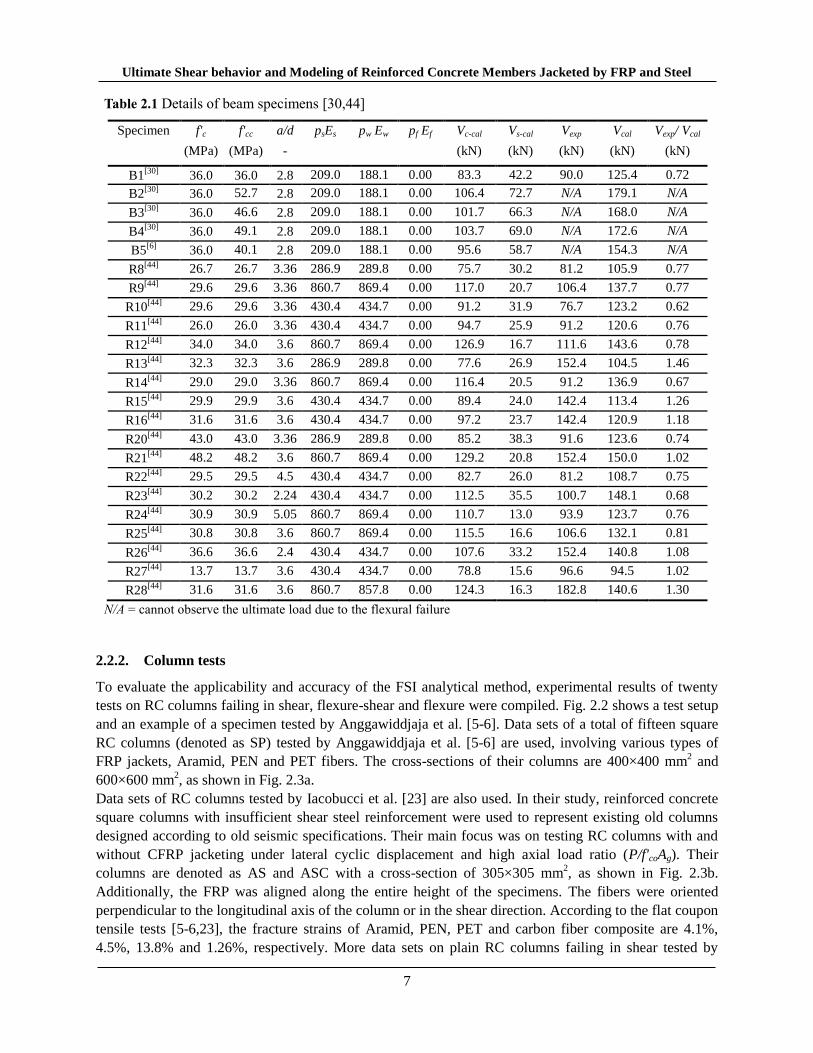
Table 2.1 Details of beam specimens [30,44]
Specimen f'c f'cc a/d psEs
pw Ew pf Ef
Vc-cal
Vs-cal Vexp Vcal Vexp/ Vcal
(MPa) (MPa) - (kN) (kN) (kN) (kN) (kN)
B1[30]
36.0 36.0 2.8 209.0 188.1 0.00 83.3 42.2 90.0 125.4 0.72
B2[30]
36.0 52.7 2.8 209.0 188.1 0.00 106.4 72.7 N/A 179.1 N/A
B3[30]
36.0 46.6 2.8 209.0 188.1 0.00 101.7 66.3 N/A 168.0 N/A
B4[30]
36.0 49.1 2.8 209.0 188.1 0.00 103.7 69.0 N/A 172.6 N/A
B5[6]
36.0 40.1 2.8 209.0 188.1 0.00 95.6 58.7 N/A 154.3 N/A
R8[44]
26.7 26.7 3.36 286.9 289.8 0.00 75.7 30.2 81.2 105.9 0.77
R9[44]
29.6 29.6 3.36 860.7 869.4 0.00 117.0 20.7 106.4 137.7 0.77
R10[44]
29.6 29.6 3.36 430.4 434.7 0.00 91.2 31.9 76.7 123.2 0.62
R11[44]
26.0 26.0 3.36 430.4 434.7 0.00 94.7 25.9 91.2 120.6 0.76
R12[44]
34.0 34.0 3.6 860.7 869.4 0.00 126.9 16.7 111.6 143.6 0.78
R13[44]
32.3 32.3 3.6 286.9 289.8 0.00 77.6 26.9 152.4 104.5 1.46
R14[44]
29.0 29.0 3.36 860.7 869.4 0.00 116.4 20.5 91.2 136.9 0.67
R15[44]
29.9 29.9 3.6 430.4 434.7 0.00 89.4 24.0 142.4 113.4 1.26
R16[44]
31.6 31.6 3.6 430.4 434.7 0.00 97.2 23.7 142.4 120.9 1.18
R20[44]
43.0 43.0 3.36 286.9 289.8 0.00 85.2 38.3 91.6 123.6 0.74
R21[44]
48.2 48.2 3.6 860.7 869.4 0.00 129.2 20.8 152.4 150.0 1.02
R22[44]
29.5 29.5 4.5 430.4 434.7 0.00 82.7 26.0 81.2 108.7 0.75
R23[44]
30.2 30.2 2.24 430.4 434.7 0.00 112.5 35.5 100.7 148.1 0.68
R24[44]
30.9 30.9 5.05 860.7 869.4 0.00 110.7 13.0 93.9 123.7 0.76
R25[44]
30.8 30.8 3.6 860.7 869.4 0.00 115.5 16.6 106.6 132.1 0.81
R26[44]
36.6 36.6 2.4 430.4 434.7 0.00 107.6 33.2 152.4 140.8 1.08
R27[44]
13.7 13.7 3.6 430.4 434.7 0.00 78.8 15.6 96.6 94.5 1.02
R28[44]
31.6 31.6 3.6 860.7 857.8 0.00 124.3 16.3 182.8 140.6 1.30
N/A = cannot observe the ultimate load due to the flexural failure

8
Ultimate Shear behavior and Modeling of Reinforced Concrete Members Jacketed by FRP and Steel
Saatcioglu and Ozceb [51] and by Sezen et al. [57] are used to verify the applicability of the analytical
method to typical reinforced concrete. In their study, reinforced concrete square columns are used with
varied shear steel reinforcement ratio, concrete compressive strength and axial load ratio. Their columns
are denoted as U1-U4, 2CLD12, 2CHD12, 2CVD12 and 2CLD12M with a cross-section of 350×350 mm2
and 457×457 mm2, as shown in Figs. 2.3c and 2.3d. Data sets of RC columns tested by Aboutaha et al. [1]
and Priestley et al. [45-46] to investigate the effect of rectangular and elliptical steel jackets. The columns
from Aboutaha et al. [1] are denoted as SC with an original cross-section of 457×914 mm2, whereas the
columns from Priestley et al. [45-46] are denoted as R with an original cross-section of 406×610 mm2.
Cross-sections of their specimens are also illustrated in Figs. 2.3e and 2.3f.
The details of the specimens are previously shown in Table 2.2, in which column (1) shows the specimen
labels, and the types of FRP jacket, when applicable are shown in columns (2). The material and
geometry properties are shown in columns (3) to (10) in the order of shear-span to effective-depth ratio
(a/d), unconfined concrete compressive strength (f'co), ratio of the tension reinforcement (ρs), ratio of steel
shear reinforcement (ρw), volumetric ratio of fiber reinforcement (ρf) and an axial load ratio (P/f'coAg). The
failure mode, as shown in column 11, corresponds to the definitions which will be explained later.
Fig. 2.2 Test setup and an example of specimen tested by Anggawidjaja et al. [5-6]
RC specimen
Vertical load
1500
700
3
50
Horizontal load
Balanced loading
block

9
Ultimate Shear behavior and Modeling of Reinforced Concrete Members Jacketed by FRP and Steel
a) Specimen SP4 [5-6] b) Specimen ASC-NS2 [23]
e) Specimen SC10 [1] f) Specimen R2R [45-46]
y
x
Steel plate
8D25
914
457 Ø10
CFRP
tj=6.35
Grout=25.4
971.2 812.8
as-built column
Elliptical Steel
406.4
8D19
Ø6.35
610
tj=4.76
609.6
as-built column
305
305
3D19
Ø10
as-built column
PET fiber
40
0
4D25
Ø10
400
as-built column
Fig. 2.3 Cross section and characteristics of column specimens [1,5-6,23,45-46,51,57]
3
50
3D25
Ø10
350
as-built
column
457
457
3D29
Ø10
as-built
column
c) Specimen U1 [51] d) Specimen 2CLD12 [57]

10
Ultimate Shear behavior and Modeling of Reinforced Concrete Members Jacketed by FRP and Steel
2.3. MODELS FOR SHEAR STRENGTH
2.3.1. ACI 318-05 [2]
According to the ACI 318-2005 [2], the nominal shear strength, Vn, is calculated as the summation of
contributions from concrete, Vc, and the transverse reinforcement, Vs.
n c sV V V (2.1)
Table 2.2 Details of column specimens [1,5-6,23,45-46,51,57]
Reference Specimen Fiber b
(mm)
h
(mm)
a/d f'co
(MPa)
ρs
(%)
ρw
(%)
ρf
(%)
P/Agf'co Failure
mode* (1) (2) (3) (4) (5) (6) (7) (8) (9) (10) (11)
Aboutaha et
al. [1]
SC9 None 914 457 3 16.0 2.20 0.10 0.00 0.00 Mode II
SC10 Steel 914 457 3 16.5 2.20 0.10 2.50 0.00 Mode III
Anggawidjaja
et al. [5-6]
SP1 None 400 400 3 29.5 2.87 0.16 0.00 0.03 Mode II
SP2 Aramid 400 400 3 29.5 2.87 0.16 0.13 0.03 Mode IV
SP3 PEN 400 400 3 29.5 2.87 0.16 0.38 0.03 Mode IV
SP4 PET 400 400 3 29.5 2.87 0.16 0.37 0.03 Mode III
SP5 PET 400 400 3 31.7 2.87 0.16 0.19 0.03 Mode III
SP6 PET 400 400 4 31.7 2.87 0.16 0.12 0.03 Mode III
SP7 PET 400 400 4 31.7 2.87 0.16 0.06 0.03 Mode III
SP8 None 400 400 4 31.7 2.87 0.16 0.00 0.03 Mode II
SP9 PET 400 400 4 31.7 3.59 0.16 0.12 0.03 Mode III
SP10 PET 400 400 4 31.7 2.15 0.16 0.06 0.03 Mode III
SP11 PET 600 600 4 31.7 2.82 0.20 0.25 0.03 Mode III
SP12 PET 600 600 4 31.7 2.82 0.20 0.125 0.03 Mode III
SP13 PET 600 600 4 34.5 2.82 0.20 0.29 0.03 Mode III
SP14 PET 600 600 4 23.7 2.82 0.09 0.42 0.03 Mode III
SP15 PEN 600 600 4 31.1 2.82 0.09 0.42 0.03 Mode III
Iacobucci
et al. [23]
AS-NS1 None 305 305 3 31.4 1.30 0.61 0.00 0.40 Mode II
ASC-NS2 CFRP 305 305 3 36.5 1.30 0.61 0.65 0.38 Mode III
ASC-NS3 CFRP 305 305 3 36.9 1.30 0.61 1.30 0.65 Mode III
ASC-NS4 CFRP 305 305 3 36.9 1.30 0.61 0.65 0.65 Mode III
ASC-NS5 CFRP 305 305 3 37.0 1.30 0.61 1.96 0.65 Mode III
Priestley et el.
[45-46]
R1A None 610 416.4 2.8 24.8 1.30 0.14 0.00 0.06 Mode II
R2R Steel 610 416.4 2.8 25.2 1.30 0.14 1.56 0.06 Mode IV
Saatcioglu
and Ozceb
[51]
U1 None 350 350 3.3 43.6 3.3 0.3 0 0.00 Mode III
U2 None 350 350 3.3 30.2 3.3 0.3 0 0.16 Mode III
U3 None 350 350 3.3 34.8 3.3 0.6 0 0.14 Mode III
U4 None 350 350 3.3 34.8 3.3 0.9 0 0.14 Mode III
Sezen el al.
[57]
2CLD12 None 457 457 3.7 21.1 2.5 0.17 0 0.15 ModeII
2CHD12 None 457 457 3.7 21.1 2.5 0.17 0 0.61 ModeII
2CVD12 None 457 457 3.7 20.9 2.5 0.17 0 0.51 ModeII
2CLD12M None 457 457 3.7 21.8 2.5 0.17 0 0.15 ModeII
*Mode I = Brittle shear failure, Mode II = Brittle shear failure after yielding, Mode III = Less brittle shear failure
after yielding, and Mode IV = Flexural failure
11
Ultimate Shear behavior and Modeling of Reinforced Concrete Members Jacketed by FRP and Steel
0.166 113.8
c cg
PV f bd
A
(unit: MPa) (2.2)
an effective shear area of Ae = 0.8bh = 0.8Ag for rectangular columns, where Ag is gross column area. The
shear reinforcement contribution is calculated as follows:
v y
s
A f dV
s (2.3)
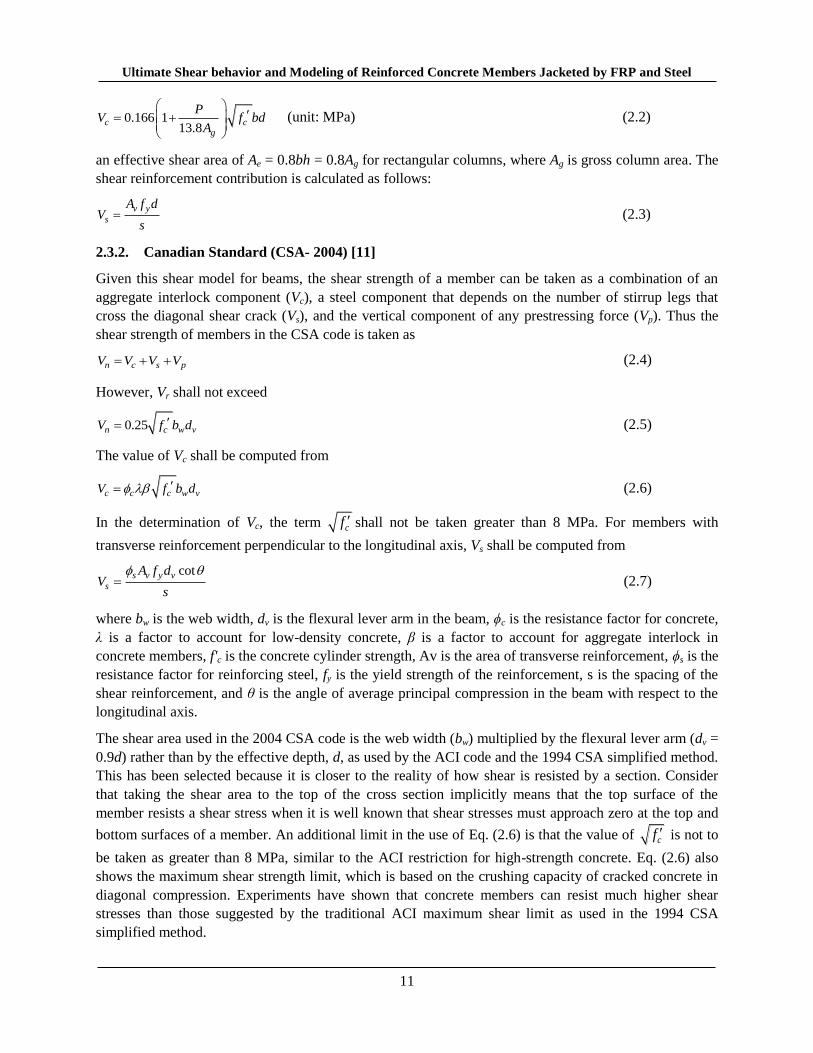
2.3.2. Canadian Standard (CSA- 2004) [11]
Given this shear model for beams, the shear strength of a member can be taken as a combination of an
aggregate interlock component (Vc), a steel component that depends on the number of stirrup legs that
cross the diagonal shear crack (Vs), and the vertical component of any prestressing force (Vp). Thus the
shear strength of members in the CSA code is taken as
n c s pV V V V (2.4)
However, Vr shall not exceed
0.25n c w vV f b d (2.5)
The value of Vc shall be computed from
c c c w vV f b d (2.6)
In the determination of Vc, the term cf shall not be taken greater than 8 MPa. For members with
transverse reinforcement perpendicular to the longitudinal axis, Vs shall be computed from
cots v y v
s
A f dV
s
(2.7)
where bw is the web width, dv is the flexural lever arm in the beam, ϕc is the resistance factor for concrete,
λ is a factor to account for low-density concrete, β is a factor to account for aggregate interlock in
concrete members, f'c is the concrete cylinder strength, Av is the area of transverse reinforcement, ϕs is the
resistance factor for reinforcing steel, fy is the yield strength of the reinforcement, s is the spacing of the
shear reinforcement, and θ is the angle of average principal compression in the beam with respect to the
longitudinal axis.
The shear area used in the 2004 CSA code is the web width (bw) multiplied by the flexural lever arm (dv =
0.9d) rather than by the effective depth, d, as used by the ACI code and the 1994 CSA simplified method.
This has been selected because it is closer to the reality of how shear is resisted by a section. Consider
that taking the shear area to the top of the cross section implicitly means that the top surface of the
member resists a shear stress when it is well known that shear stresses must approach zero at the top and
bottom surfaces of a member. An additional limit in the use of Eq. (2.6) is that the value of cf is not to
be taken as greater than 8 MPa, similar to the ACI restriction for high-strength concrete. Eq. (2.6) also
shows the maximum shear strength limit, which is based on the crushing capacity of cracked concrete in
diagonal compression. Experiments have shown that concrete members can resist much higher shear
stresses than those suggested by the traditional ACI maximum shear limit as used in the 1994 CSA
simplified method.

12
Ultimate Shear behavior and Modeling of Reinforced Concrete Members Jacketed by FRP and Steel
To determine the shear strength of a member by the general method, it is necessary to determine the
values of β and θ for use in Eq. (2.6). These have generally been defined with respect to the three shear
parameters discussed in the following sections.
2.3.3. CEB-FIP Model code [12]
In CEB-FIP Model code the classical design tasks like design for shear, torsion and punching are found.
n c sV V V (2.8)
The value of Vc shall be computed from
c c c w vV f b d (2.9)
In the determination of Vc, the term cf shall not be taken greater than 8 MPa. For members with
transverse reinforcement perpendicular to the longitudinal axis, Vs shall be computed from
cots v y v
s
A f dV
s
(2.10)
2.3.4. Japan Society of Civil Engineering [25]
For a linear member provided with transverse steel reinforcement, the shear force is carried by transverse
steel reinforcement after the initiation of diagonal cracks and the load-carrying mechanism is transformed
to a truss mechanism.
n c sV V V (2.11)
4 30.2 1000 / 100c w cV d f bd (2.12)
,1.15
v y
s
A f z dV z
s (2.13)
2.4. DEFORMATIONS
Total deformation of RC columns generally consists of three components which are flexural, shear and
pull-out deformation. Although for simplicity these three deformations are considered to occur
independently, they actually interact with each other.
2.4.1. Flexural deformation
The flexural deformation can be obtained by integrating curvature along the column length as in Eq.(2.14).
This curvature is calculated from section analysis as discussed in the flexural behavior.
0 0
l l
flexure dzdz (2.14)
2.4.2. Shear deformation
The most common method to predict shear deformation is through the use of truss mechanism. The truss
mechanism is considered to be applicable after diagonal shear crack forms in the structure. Before the
formation of flexural or diagonal cracks, the shear deformation is predicted by using the principles of

13
Ultimate Shear behavior and Modeling of Reinforced Concrete Members Jacketed by FRP and Steel
elasticity. The truss mechanism considers the shear deformation is caused due to shortening of
compression strut (s1) and elongation of tension tie (s2). The equations are as follows:
14(cot cot )sin
ss
c w
V
E b
(2.15)
2
cot cot sin ³
ss
cw w ce
w
V s
EE A A
E
(2.16)
Ueda et al. [65] proposed a shear deformation model based on truss mechanism which considers the effect
of concrete effective in concrete and additional flexural deformation due to shear cracking. Fig. 2.4 shows
the truss mechanism model from Ueda et al. [65].
DEA
CBz (cot+cot)
z
D’
A’
C’
B’
Fig. 2.4 Shear deformation based on truss analogy [65]
2.4.3. Pull-out deformation
The slip of reinforcement is predicted analytically at the yielding load using Eqs. (2.17) and (2.18), and
after yielding of longitudinal reinforcement using Eqs. (2.19) and (2.20). The pullout deformation
equations proposed by Shima et al. [59] for different stages of reinforcement strain are as follow:
2.4.3.1. Slip of reinforcement at yield strain
2/3
7.4 . (2 3500 )
'S
y y y
ckf
(2.17)
0.45(1 )
1 0.9
Cs
ey
(2.18)
2.4.3.2. Slip of reinforcement after yield
.S sKfc
(2.19)
where s- value is different for each strain level of reinforcement
When the reinforcement strain takes the value of yield strain ( y)
(2 3,500 )sy y y
(2.20)
When the reinforcement strain is at the initiation point of strain hardening area ( sh)

14
Ultimate Shear behavior and Modeling of Reinforced Concrete Members Jacketed by FRP and Steel
0.5( - ) ( )s ssh y y (2.21)
When the reinforcement strain takes the value at the change in gradient of the non-dimensional slip in
the reinforcement strain hardening area (a)
0.08( - )( - ) ( )s f f su y a sh sh
(2.22)
s( )y
0.132-2= +
sh 0.13( )a f fu y
(2.23)
When the reinforcement strain is greater than a
0.027( - )( - ) ( )s f f su y s a a
(2.24)
where
S = pullout of reinforcement (cm),
y = effect of bar spacing,
= diameter of reinforcement bar (cm),
f'ck = strength of footing concrete (N/mm²),
fy = yield strength of reinforcement (N/mm²),
fu = tensile strength of reinforcement (N/mm²),
Cs = bar spacing (cm),
y = strain at reinforcement yield,
sh = strain at initiation of reinforcement strain hardening,
a = point of non-dimensional slip gradient change in strain hardening area,
s = reinforcement strain.
By substituting the slip of reinforcement (S) value to Eq. (2.19), deformation of piers due to pullout of
reinforcement can be obtained analytically.

15
Ultimate Shear behavior and Modeling of Reinforced Concrete Members Jacketed by FRP and Steel
CHAPTER 3
3.
EXPERIMENTAL SETUP AND RESULTS
3.1. INTRODUCTION
This chapter presents an experimental study on the shear behavior of reinforced concrete (RC) members
fully wrapped with polyethylene terephthalate (PET) fiber reinforced polymer (FRP) composites, which
are a new type of FRP material characterized with a much larger rupture strain (LRS) compared to
conventional FRPs (i.e., made of carbon, glass, and aramid fibers). A total of ten PET fully-wrapped RC
beams, which were designed to fail in shear and with different shear-span to effective-depth ratios,
transverse reinforcement ratios and shear strengthening ratios, were tested under four-point bending loads.
The overall load-deflection responses and the shear deformation of the beams as well as the strain
development of the transverse steel reinforcement and the FRP jackets were carefully observed. Based
upon the extensive strain measurements, the shear contributions by concrete, FRP and transverse
reinforcement are differentiated. The behavior of PET FRP composites as the jacket material of RC
members will be reported by use of nominal shear stress and drift ratio at mid-span. The failure modes
and crack patterns will be shown and compared with that of the control RC beam. Shear deformation was
also measured and calculated to evaluate the effect of shear crack opening with different strengthening
ratio, longitudinal reinforcement ratio, and shear-span to effective-depth ratio. Moreover, the distribution
of strain developed in FRP sheets and transverse steel reinforcement will be shown in order to clarify the
influence of FRP sheets.
3.2. EXPERIMENTAL PROGRAMS
3.2.1. Details of Specimens
Ten simply-supported RC beams designed to fail in shear were subjected to four-point bending loads. RC
beams rather than RC columns as the test members allows the elimination of the effects of pull-out from
footings and lateral buckling of the longitudinal reinforcement, enabling more accurate shear deformation
measurement. However, the current study of shear behavior is applicable only for the cases, in which
axial loading is not a significant concern (e.g. bridge columns). Two groups of RC beams were prepared
(see Table 3.1):
(1) Group 1 included a reference RC beam (SP1) and five RC beams fully wrapped with different
amounts of FRP composites (SP2 to SP6), all with identical longitudinal and transverse steel
reinforcement as the reference beam but different strengthening ratios of FRP. Each specimen had a cross
section of 250 mm × 270 mm, whose corners were chamfered with a radius of 11 mm to prevent stress
concentration, and the shear span was 600 mm, resulting in a shear-span to effective-depth ratio of 2.50.
The longitudinal reinforcement and transverse steel reinforcement ratios were 2.53% and 0.17%,
respectively, in all the six specimens, whereas the volumetric ratio (i.e., calculated based on the nominal
thickness of the LRS FRP sheets) of the wrapped LRS FRP composites varied from 0.11 % to 0.45%.
(2) Group 2 included four RC beams (SP7 to SP10) that had different sectional dimensions and shear-
span to effective-depth ratios to the reference beam. This group was designed to investigate the effects of
the longitudinal reinforcement ratio and shear-span to effective-depth ratio. SP7, representing a deep

16
Ultimate Shear behavior and Modeling of Reinforced Concrete Members Jacketed by FRP and Steel
beam with dimensions 250 mm (width) × 500 mm (height) and a shear span of 1125 mm (see Table 1),
whereas SP8 and SP9 had dimensions of 250 mm (width) × 270 mm (height) and a shear span length of
600 mm. SP10, representing a small section of beam, had dimensions 100 mm (width) × 150 (height) mm
and a shear span of 300 mm. The specimen corners were chamfered with a radius of 11 mm. SP7 and SP9
were designed to have a similar shear strengthening ratio and shear-span to effective-depth ratio as SP5,
whereas the longitudinal reinforcement ratio was made different. SP8 had a similar shear strengthening
and longitudinal reinforcement ratio as SP3, whereas the shear-span to effective-depth ratio was made
different. SP10 had a large spacing of transverse reinforcement significantly less than that required in the
JSCE-2007 specification.
For all strengthened specimens (SP2 to SP10), a continuous fiber sheet with the main fibers oriented in
the transverse direction was fully wrapped around the RC beam with an overlapping zone of length 250
designed to span the top side (subject to compression) of the specimens for firm anchorage.
3.2.2. Materials
3.2.2.1. Concrete and steel reinforcement
Two groups of specimens were cast with two batches of ready-mixed concrete with a maximum 20 mm
size of aggregate. At the time of testing, the cylinder concrete strengths of the first and second batches of
concrete were 25.3 MPa and 32.6 MPa, respectively. The longitudinal steel reinforcement and transverse
steel reinforcement were tested to find their tensile stress-strain relationship. The longitudinal
reinforcement used in Groups 1 and 2 specimens had a 25 mm diameter with yield strengths of 382 MPa,
and 539 MPa, respectively, except in SP10 for which a 13 mm diameter of compression reinforcement
was used with a yield strength of 360 MPa (see Tables 3.1 and 3.2). In specimens SP1 to SP9, the
transverse reinforcement had a 6 mm diameter and a 350 MPa yield strength, whereas for SP10 the
transverse reinforcement had a 13 mm diameter and the same yield strength.
Table 3.2 Material properties of steel reinforcement
Item Diameter
(mm)
Sectional area
(mm2)
Yielding
strength (MPa)
Young's modulus
(MPa)
Yielding
strain (μɛ)
Longitudinal reinforcement
D25 (SD345) 25 506.7 382 188,000 2,000
D25 (SD490) 25 506.7 539 198,000 2,700
D13 (SD360) 13 126.7 360 180,000 2,000
Transverse Reinforcement
D13 13 126.7 360 180,000 2,000
D6 6 31.67 350 196,000 1,800

17
Ultimate Shear behavior and Modeling of Reinforced Concrete Members Jacketed by FRP and Steel
Table 3.1 Details of test specimens
Items Specimen
unit SP1 SP2 SP3 SP4 SP5 SP6 SP7 SP8 SP9 SP10
f'c MPa 25.3 25.3 25.3 25.3 25.3 25.3 32.6 32.6 32.6 32.6
b mm 250 250 250 250 250 250 250 250 250 100
h mm 270 270 270 270 270 270 500 270 270 150
d
mm 240 240 240 240 240 240 450 240 240 120
a mm 600 600 600 600 600 600 1125 750 600 300
a/d - 2.50 2.50 2.50 2.50 2.50 2.50 2.50 3.13 2.50 2.50
Longitudinal reinforcement in
compression 3D25 (SD345)
5D25
(SD345)
3D25
(SD345)
3D25
(SD345)
2D13
(SD360)
Longitudinal reinforcement in
tension 5D25 (SD345)
10D25
(SD490)
5D25
(SD490)
4D25
(SD490)
1D25
(SD490)
Transverse reinforcement D6 D6 D6 D6 D6 D6 D6 D6 D6 D13
ρsc
% 2.53 2.53 2.53 2.53 2.53 2.53 2.30 2.50 2.50 2.10
ρst
% 4.22 4.22 4.22 4.22 4.22 4.22 4.50 4.22 3.38 4.22
ρw
% 0.17 0.17 0.17 0.17 0.17 0.17 0.17 0.17 0.17 0.25
ρf
% 0.00 0.11 0.17 0.22 0.34 0.45 0.34 0.17 0.34 0.19
s
mm 150 150 150 150 150 150 150 150 150 250
tf mm 0 0.28 0.42 0.56 0.84 1.12 0.84 0.42 0.84 0.18
Aw mm2
63.34 63.34 63.34 63.34 63.34 63.34 63.34 63.34 63.34 253.40
Ef GPa 0 9.58 9.58 9.58 9.58 9.58 9.58 9.58 9.58 9.58
Ew GPa 196 196 196 196 196 196 196 196 196 196
Eftf KN/mm 0.00 0.34 4.02 5.36 8.05 10.73 8.05 4.02 8.05 1.72
EwAw/s KN/mm 82.76 82.76 82.76 82.76 82.76 82.76 82.76 82.76 82.76 198.67
EfAf/(EwAw/s) - - 0.03 0.05 0.06 0.10 0.13 0.10 0.05 0.10 0.01
f'c = compressive strength of concrete cylinder; b = width of beam cross-section; h = total depth of beam cross-section; d = effective depth of
beam cross-section; a = shear span; a/d = shear-span to effective-depth ratio; ρsc = ratio of compression reinforcement; ρst = ratio of tension
reinforcement; ρw = ratio of transverse steel reinforcement; ρf = volumetric ratio of FRP sheet; s = spacing of transverse steel reinforcement; tf =
total nominal thickness of FRP sheet for both shear sides; Aw = total cross-sectional area of both legs for one single transverse steel reinforcement;
Ef, Ew = Young's modulus of FRP sheet, and Young's modulus of transverse steel reinforcement.

18
Ultimate Shear behavior and Modeling of Reinforced Concrete Members Jacketed by FRP and Steel
3.2.2.2. PET sheet
Polyethylene terephthalate (PET) dry fiber sheets (PET-600) were used in the experiments to form LRS
FRP composites. Flat coupon tests for PET FRP composites were conducted to determine their tensile
properties following the JSCE standard E541-2000 [26]. The tensile coupons sheets had a nominal
thickness of 0.841 mm, a length of 280 mm and a width of 13 mm. The coupon preparation followed the
usual wet lay-up process involving the impregnation of a large area of fiber sheet with a matrix epoxy
resin, which consisted of a main resin component and a hardener, with a mix ratio of 2∶1 by weight. After
one week of curing in the laboratory environment, the hardened large PET FRP plate was cut into many
strips (i.e., testing coupons) with the required dimensions. Glass FRP (GFRP) tabs (25 mm long and 13
mm wide) were bonded to strengthen the two ends of each PET FRP coupon and to ensure uniform stress
transfer from the loading heads during the tensile tests, which were performed at a constant loading rate
equivalent to 1% strain per minute. An image measurement method [24,50] was used to capture the
tensile strain of each PET flat coupon with a gauge length of 45 mm (Fig. 3.1a). The tensile stress in the
PET FRP composite was calculated from the tensile load on the basis of the nominal area of the fiber
sheet. All six coupons were tested and found to fail in the central region of the specimens. Fig. 1b shows
the obtained tensile stress-strain relationships. The PET FRP sheets exhibit a bilinear stress-strain
behavior caused by the motion of amorphous phases and by the sliding or failing of macromolecular
chains in PET and PET fibers [14,33]. During the initial deformation, the amorphous regions within the
microfibrils align themselves with a similar orientation to that in the mesamorphous phase. The stress-
strain curve moves to the transition point that occurs when the applied load starts to strain the bonds in
both the amorphous and crystalline phases. Table 3.3 presents a summary of the material properties of
PET FRP sheets provided by the manufacturer and obtained from the present tensile tests. Two different
values of elastic modulus, namely the initial elastic modulus (E1) for the first linear portion of the stress-
strain relationship and the second-stage elastic modulus (E2) for the second linear part are given in the
table, together with the strain value at the transition point (o) between the two linear portions.
Fig. 3.1 Tensile test of flat coupon:
0
200
400
600
800
0 2 4 6 8 10
Str
ess (M
Pa
)
Strain (%)
E1=21,452 MPa
E2=9,580 MPa
ɛo=0.74%
E1=21,452 MPa
E2=9,580 MPa
(b) Stress-strain relationship of flat coupon
50
50
13
45
180
(a) Tensile test and flat coupon
Microfibril
Amorphous
phases
Tensile force

19
Ultimate Shear behavior and Modeling of Reinforced Concrete Members Jacketed by FRP and Steel
Table 3.3 Material properties of PET FRP sheets
Product
Manufacturer data Present tensile tests
Nominal
thickness
(mm)
Tensile
strength
(MPa)
Young's
modulus
(MPa)
Rupture
strain
(%)
Nominal
thickness
(mm)
Tensile
strength
(MPa)
Strain at
transition,
ɛo (%)
Rupture
strain
(%)
E1
(MPa)
E2
(MPa)
PET-600 0.841 740 10,000 6.7-8.2 2.5 704 0.74 6.43 21,452 9,580
3.2.3. Test procedures and instrumentation
3.2.3.1. Loading system, strain gauges and total deformations
All the beam specimens were tested under four-point loads and carefully instrumented during the tests to
monitor the loads, mid-span beam deflections and strains of transverse reinforcement and PET FRP
composites (Fig. 3.2a). The locations of strain gauges and Linear Variable Differential Transformers
(LVDTs) are illustrated in Figs. 3.2b and 3.2c. The strain gauges were located in the region where shear
cracks are expected to occur. A network of strain gauges (with a gauge length of 10 mm) were mounted
on all the transverse reinforcements at a spacing of 80 mm. Asymmetrical loading was applied to ensure
failure to occur within this span. Strain gauges were also attached onto the PEF FRP at one beam side
within the shear span. The gauge length was also 10 mm and the spacing between adjacent gauges was 55
mm. For each specimen, deformations were measured using LVDTs at two supports and at mid-span.
Fig. 3.2 Test setup (SP1–SP6, SP9)
300mm300mm 600mm
D6 3@150mm
Strain gauge
80 S-2
S-3
Ø6 3@150 110 40
300 600 300
LVDT
600mm
PET Sheet
Strain gauges
55
75
F-1
F-2
F-4 F-5
F-6
F-7
F-8
F-9
F-10
F-11
F-12
F-13
F-14
F-15
F-16
F-17
F-18
F-19
F-20
F-21
F-22
F-23
F-24
F-25
F-26
F-27
F-28
F-29
F-30
F-31
F-32
F-33
F-34
F-35
600
Strain gauges on FRP
PET sheet
F-3
S-1
S-5
S-6
S-4
S-8
S-9
S-7
S-11
S-12
S-10
(a) Asymmetrical loading
(b) Locations of strain gauges on steel reinforcement
(c) Locations of strain gauges on FRP

20
Ultimate Shear behavior and Modeling of Reinforced Concrete Members Jacketed by FRP and Steel
3.2.3.2. Shear deformation devices
Various techniques have been attempted to measure the shear deformation of RC members, including the
placement of LVDTs (e.g., Massone and Wallace [37]; Anggawidjaja et al. [5]), the use of potentiometric
extensometers for curvature and shear strain measurements (e.g., Debernardi and Taliano [18]), and the
laser speckle method (e.g., Ueda et al. [65]). Conventional LVDT-based methods were used here, as
shown in Fig. 3.3a, for the measurement of shear deformation for the first batch of specimens (i.e., SP1 to
SP6). However, for the second batch of specimens, the shear deformation measurement was done using a
more advanced digital image correlation (DIC) method with the help of charge-coupled device (CCD)
cameras (Fig. 3.3b). This method probes cracks and shear deformation of concrete surfaces with high
image quality, low processing cost, and can monitor until the failure of specimens while avoiding causing
specimen damage (Ito et al. [24]; Qi et al. [50]). For confirmation purposes, the conventional LVDT–
based method was implemented in parallel with the DIC method for SP7, whereas only the DIC method
was implemented for specimens SP8 to SP10 after its reliability was confirmed. The measurement of
shear deformation focused on the plastic hinge region of the specimens, which is within 1.5d from the
loading point to the support location. This region is most likely to experience shear deterioration
particularly during seismic loading (Anggawidjaja et al. [5]). The frame for installing the LVDTs and the
grid for the calibration points in the DIC method are shown in Figs. 3.3a and 3.3b, respectively. In the
DIC measurement, the measured region was divided into many square grids, each of which had four
target coordinating points A, B, C and D (Fig. 3.3b). In order to produce a physical picture, the image was
translated into the digital information of target coordinate using commercially available software such as
Adobe Photoshop. Based upon the digital information, the shear deformation of each tested beam could
be calculated.
Fig. 3.3 Measurement of shear deformation
d
1.5d
120
A
B
C
D
120
(a) Strain deformation measurement using LVDTs in SP1–SP6
LVDT
240
360
1.5d
d
360
(b) Strain deformation measurement using LVDTs in SP7–SP10

21
Ultimate Shear behavior and Modeling of Reinforced Concrete Members Jacketed by FRP and Steel
3.3. RESULTS AND DISCUSSION
3.3.1. Failure modes and crack patterns
Figure 3.4 shows the failure modes of specimens SP1 to SP10 presenting the sketches of the failed
specimens and photographs after the removal of the LRS FRP jackets. The black lines drawn on the
concrete surface show the locations of cracks, and the hatched areas indicate the bulges on the concrete
surface and spalling of concrete. Except SP6, which had the largest shear strengthening ratio (Table 3.1),
all other specimens failed in shear with clear shear deformation (i.e., no yielding of flexural reinforcement
was observed before the yielding of transverse steel reinforcement). The shear failure in the ultimate state
was mainly caused by the crushing of the concrete in the compression zone at the top of the critical
diagonal crack (i.e., shear compression failure). At the peak load, PET FRP composites showed no sign of
rupture, except in SP10. For the reference SP1, spalling of concrete cover occurred. However, in all
strengthened specimens the spalling of concrete was prevented by the FRP confinement. Instead, bulging
of PET FRP composites was seen at the top of the compression region, as indicated by the hatched areas
in Fig. 3.4.
The angles of major diagonal shear cracks (θcr) were evaluated both from visible shear cracks and from
the locations of maximum strains developed in transverse steel reinforcement and PET FRP sheets at
different beam sections, as shown in Fig. 3.4 using dashed lines. The values of these angles varied from
39° to 53° to the member axis. In the first group of specimens, the reference specimen (SP1) developed
two major shear cracks at an angle of 45°. In the strengthened specimens SP2 to SP5, the angle of the
major shear cracks were slightly less than 45° ranging 44° to 39°. As the member deformation increased
further, partial debonding of the FRP occurred near the critical shear crack or at the edge of the beam (see
Fig. 3.5), and a loud noise was produced owing to the bulge of the concrete in the compression region.
Finally, the PET FRP composites at the corner locations ruptured, leading to concrete crushing and a
complete detachment of the FRP from the concrete substrate (Fig. 3.5). SP6, with a 0.45% volumetric
ratio of FRP, showed no major shear deformation (Fig. 3.4) because of a confinement effect.
SP8 in the second group with a relatively high shear-span to effective-depth ratio (a/d =3.13) exhibited a
crack angle of 49° in the plastic hinge area. In SP7, whose ratio of shear reinforcement spacing to beam
depth is smaller than the others, showed the largest crack angle (θcr=53°) among all the specimens. In
SP10, PET FRP sheets ruptured at the moment when the diagonal shear crack penetrated to the
compression zone of concrete, and the major shear crack did not pass any transverse steel reinforcement
because of their large spacing (i.e., s = 250 mm); the PET FRP sheets ruptured at the shear crack locations
rather than the corners of the beam section owing to the significant shear stress transferred from the
concrete to the FRP, leading to a diagonal tension failure of the member. This is an example of a poor
truss mechanism by which the shear stresses were not transferred through the truss nodes, leading to
member collapse in a very brittle behavior.
Overall, apart from the case when the transverse steel reinforcement ratio is extremely low, PET FRP
composites prevented crack opening in the strengthened beams that leads to multiple shear cracks in the
shear critical zones. Fig. 3.5 shows the locations where the PET FRP sheets ruptured, indicating that the
breakage of PET FRP sheets usually started from the corner of the beam section near to the loading plate
(e.g., in SP4). In addition, the rupture of PET FRP sheets was observed mostly at a large shear
deformation level.

22
Ultimate Shear behavior and Modeling of Reinforced Concrete Members Jacketed by FRP and Steel
Fig. 3.4 Failure modes and crack patterns
SP1 θcr=45
°
θcr=44°
θcr=39°
θcr=39°
Bulge of concrete surface
Strain gauge
SP2
SP3
SP4
θcr=39°
SP5
SP6
Bulge of concrete surface
SP7 θcr=53°
θcr=49°
SP8

23
Ultimate Shear behavior and Modeling of Reinforced Concrete Members Jacketed by FRP and Steel
Fig. 3.4 Failure modes and crack patterns (Continued)
Fig. 3.5 Rupture and debonding location in PET sheet at termination of test in SP4
3.3.2. Overall load-deformation responses
The overall shear force vs. mid-span deflection responses of specimens SP1 to SP6 and SP7 to SP10 are
presented in Figs. 3.6a and 3.6b, respectively; the shear force (Vt) is presented using a nominal shear
stress (νt) by dividing the shear force by the effective cross section (i.e., νt=Vt/bd). The mid-span
deflection is presented by the drift ratio (δ), which is defined as the ratio of the mid-span deflection (∆total)
to the shear span (a).
The reference specimen (SP1) showed a linearly increasing portion until the peak load and a sudden drop
of the load-carrying capacity afterwards, indicating a typical brittle shear failure of the member. During
the tests of specimens SP2 to SP5 the evolution of the member’s mid-span deflection was terminated at
the rupture of PET FRP sheets. The corners in SP5 were not well rounded, resulting in the premature
rupture of FRP at a corner, and subsequently a lower ultimate ductility was achieved compared to SP4.
For SP6, which failed in flexure, neither FRP rupture nor the decrease in shear capacity was observed
even at the drift ratio of 12%, at which point the test was stopped owing to the extremely large
deformation. It is interesting that specimens SP2 to SP5 also exhibited significant ductility although they
SP9 θcr=46
°
SP10 θcr=45°
Rupture of PET FRP sheet
Loading point
Support point
Top corner
Bottom corner

24
Ultimate Shear behavior and Modeling of Reinforced Concrete Members Jacketed by FRP and Steel
failed in shear. The nominal shear stress achieved in the peak of the linear portion of the load-deflection
response increased with the amount of PET fiber sheets, as did the drift ratio. This is because that, with
increasing strengthening ratio, the confinement provided by LRS FRP not only prevented concrete from
spalling off but also restrained the widening of shear cracks. The considerable ductility development
before the member’s shear failure seems to be a unique characteristic of PET FRP-strengthened RC
members. In other words, the shear failure is no longer brittle.
Fig. 3.6 Relationships between nominal shear stress (ν) and drift ratio at mid-span (δ)
In the second group, SP10 was subjected to a brittle shear failure, and exhibited a load-deflection
response similar to that of the reference SP1. The nominal shear strength of SP10 was the highest among
all the specimens mainly because it had the smallest sectional dimensions (Fig. 3.6b). SP7 to SP9
exhibited ductile shear failure (Fig. 3.6b). SP7 and SP9 had similar shear-span to effective-depth ratio and
strengthening ratio as SP5. The difference between these three specimens was their longitudinal
reinforcement ratios; SP9, which had the lowest value, achieved the highest shear ductility, as shown in
Fig. 3.6b, because of its highest shear to flexural strength ratio. SP7 exhibited the smallest ductility owing
to its higher longitudinal reinforcement ratio, as shown in Fig. 3.6b. The largest sectional dimensions of
SP7 may also be the reason for its lower shear ductility, because concrete degradation may be faster in the
case of large-depth RC beams owing to the widening of concrete cracks in the web. This is also witnessed
by the observed crack patterns (Fig. 3.4). SP8 had the same longitudinal reinforcement ratio and shear
strengthening ratio as SP3, whereas their shear-span to effective-depth ratios were different. Both two
specimens maintained a constant nominal shear stress until the drift ratio of approximately 5% (Figs. 3.6a
and 3.6b). However, SP8 showed more ductility compared to SP3 because the former had a larger shear-
span to effective-depth ratio than the latter (Figs. 3.6a and 3.6b).
Table 3.4 presents a comparison between the tested shear strengths and the predicted ones based upon
existing design codes. The shear strengths are compared in terms of three components, which are from
concrete (νc), transverse steel reinforcement (νs) and LRS FRP sheet (νf). Each component is computed
based on the existing design equations in the JSCE codes, JSCE 2001; JSCE 2007 [25,27] (see Appendix
A). For the test values, the shear stresses carried by the transverse steel reinforcement (νs-test) and LRS
FRP (νf-test) are obtained from their measured strain values, and then the shear contribution of concrete (νc-
0
1
2
3
4
5
6
0.0 2.5 5.0 7.5 10.0 12.5 15.0
Nom
inal shear
str
ess (
MP
a)
Drift ratio at mid-span (%)
SP1 (ρf=0%)
SP2 (ρf=0.11%)
SP3 (ρf=0.17%)
SP4 (ρf=0.22%)
SP5 (ρf=0.34%)
SP6 (ρf=0.45%)
(a) SP1–SP6
0
1
2
3
4
5
6
0.0 2.5 5.0 7.5 10.0 12.5 15.0
Nom
inal shear
str
ess (
MP
a)
Drift ratio at mid-span (%)
SP7 (a/d=2.5,ρf=0.34%,ρw=0.17%,ρst=4.50%)
SP8 (a/d=3.13,ρf=0.17%,ρw=0.17%,ρst=4.22%)
SP9 (a/d=2.5,ρf=0.34%,ρw=0.17%,ρst=3.38%)
SP10 (a/d=2.5,ρf=0.19%,ρw=0.25%,ρst=4.22%)
(b) SP7–SP10

25
Ultimate Shear behavior and Modeling of Reinforced Concrete Members Jacketed by FRP and Steel
test) can be obtained. The estimations of the contributions of the transverse steel reinforcement and LRS
FRP also depend on the shear crack angle (θcr) of each specimen, which is also summarized in Table 3.4.
The approaches by which the strain values of transverse steel reinforcement and LRS FRP were chosen
for calculation will be elaborated later. It is seen in Table 3.4 that generally the shear contribution of
concrete is underestimated while the shear contribution of LRS FRP composites is overestimated. The
underestimation of the concrete shear contribution is due to the conservative nature of the design
equations, whereas the overestimation of the FRP contribution arises because the design equation was
derived from the experimental data of carbon and Aramid FRPs which often show the rupture of FRP at
the peak load.
Table 3.4 Summary of test results in shear-stress and drift-ratio component
Items unit Specimen
SP1 SP2 SP3 SP4 SP5 SP6 SP7 SP8 SP9 SP10
Calc
ula
tion
at δ
p
νc MPa 1.78 1.78 1.78 1.78 1.78 1.78 1.69 1.77 1.79 2.30
νs MPa 1.48 1.48 1.48 1.48 1.48 1.48 1.58 1.85 1.48 1.85
νf MPa - 0.27 0.41 0.55 0.82 1.10 0.82 0.41 0.82 0.44
νt MPa 3.26 3.53 3.67 3.80 4.08 4.35 4.09 4.03 4.09 4.59
νmu MPa 5.58 5.58 5.58 5.58 5.58 5.58 5.94 5.75 6.25 6.11
νt/νmu - 0.58 0.63 0.66 0.68 0.73 0.78 0.69 0.70 0.65 0.75
Tes
t at δ
p
νc-test MPa 1.86 2.59 2.25 2.78 2.45 2.30 1.05 0.75 1.35 4.40
νs-test MPa 1.12 1.06 1.11 1.11 1.11 1.14 1.11 1.19 1.19 0.99
νf-test MPa - 0.23 0.46 0.44 0.62 1.00 1.73 1.29 1.72 0.28
νt-test MPa 2.97 3.87 3.82 4.33 4.14 4.43 3.89 3.22 4.26 5.68
δp % 0.66 0.95 0.80 1.39 1.14 11.44 2.61 4.28 9.96 1.64
δsp % 0.48 0.23 0.16 0.42 0.22 0.91 2.35 2.70 6.13 0.62
δsp/δp - 0.73 0.24 0.20 0.30 0.19 0.08 0.90 0.63 0.62 0.38
Tes
t at δ
u* νc-test MPa 1.33 1.60 - 0.34 1.49 - 0.48 0.47 0.45 2.90
νs-test MPa 1.05 1.17 - 1.22 1.08 - 1.14 1.19 1.19 1.18
νf-test MPa - 0.32 - 1.91 0.73 - 1.41 0.08 1.78 0.23
νt-test MPa 2.38 3.10 - 3.46 3.30 - 3.03 2.58 3.42 4.31
δu % 0.96 3.76 - 8.46 4.06 - 6.60 5.28 12.06 2.49
At
the
end
of
test
νc-test MPa 1.25 1.30 1.17 0.00 0.99 2.30 0.12 0.35 0.00 0.00
νs-test MPa 1.11 1.11 1.17 1.22 1.08 1.14 1.13 0.80 1.19 1.88
νf-test MPa 0.00 0.13 1.15 0.80 0.38 1.00 0.21 0.29 1.55 0.22
νt-test MPa 2.37 2.54 3.49 2.01 2.45 4.43 1.46 1.44 2.61 1.79
δend % 1.07 4.89 5.27 11.42 6.0 11.44 8.84 9.53 13.05 8.59
Failure
mode -
Shear.
comp
Shear.
comp
Shear.
comp
Shear.
comp
Shear.
comp
Shear.
comp
Shear.
comp
Shear.
comp Flexure
Diag.
tens
*The ultimate state (δu) is defined to be reached with the load dropped by 20% compared to its peak load;
Shear. comp = Shear compression failure; Diag. tens = Diagonal tension failure.
26
Ultimate Shear behavior and Modeling of Reinforced Concrete Members Jacketed by FRP and Steel
3.3.3. Evaluation of shear deformation
The shear deformation of tested beams was calculated based on Massone and Wallace’s (2004) method
[37]. As shown in Fig. 3.7, the undeformed rectangular shape is represented by a truss element enclosed
by dashed lines, whereas the deformed shape due to pure shear deformation is represented by the shaded
area.
Fig. 3.7 Deformed configuration (Massone and Wallace 2004) [37]
The total deformation corresponding to the combined flexural and shear deformations is illustrated by the
solid lines. In case of shear deformation without flexural effect, the center of rotation is located at the
centroid of the truss unit. The average shear deformation (δs) for a specific coordinate of the concerned
truss can be obtained as follows:
(3.1)
where d1meas
and d2meas
are the measured diagonal lengths of the deformed truss due to combined shear and
flexural actions; u1 and u2 are the horizontal displacements at the top and bottom of the truss unit,
respectively; and l is length of the truss unit.
The contribution of the flexural deformation (δf) can be attributed to the rotation of tension and
compression chords, BC and AD, respectively (Fig. 3.7). In this study, the vertical displacements due to
flexure action i.e., δf1 = δf2 = δf is assumed to be identical for each beam cross section and can be
calculated as follows:
(3.2)
where: α is value describing the distance from the top of the section to the centroid of the sectional
curvature distribution, and is taken as 0.5, assuming that the center of rotation is at the mid-height of the
truss element; h1 is the height of the truss unit, and l is the length of the truss unit. All the parameters used
in Eqs. (1) and (2) are illustrated in Fig. 3.7. The values of d1meas
, d2meas
, u1 and u2 were obtained from the
LVDT and DIC-based measurement methods (Figs. 3.3a and 3.3b). Shear deformation contributed to total
deformation at peak load (δsp/δp) is also summarized in Table 3.4.
2 22 2
1 2 2 1- - -= -
2
meas meas
s f
d l u d l u
1 2
1
=f
u ul
h
l
B, B'
C
D
D'
A, A'
C'
u1
u2
δf2
δf1
d1s
d2s
d1meas
d2meas
δs1
δs2
h1
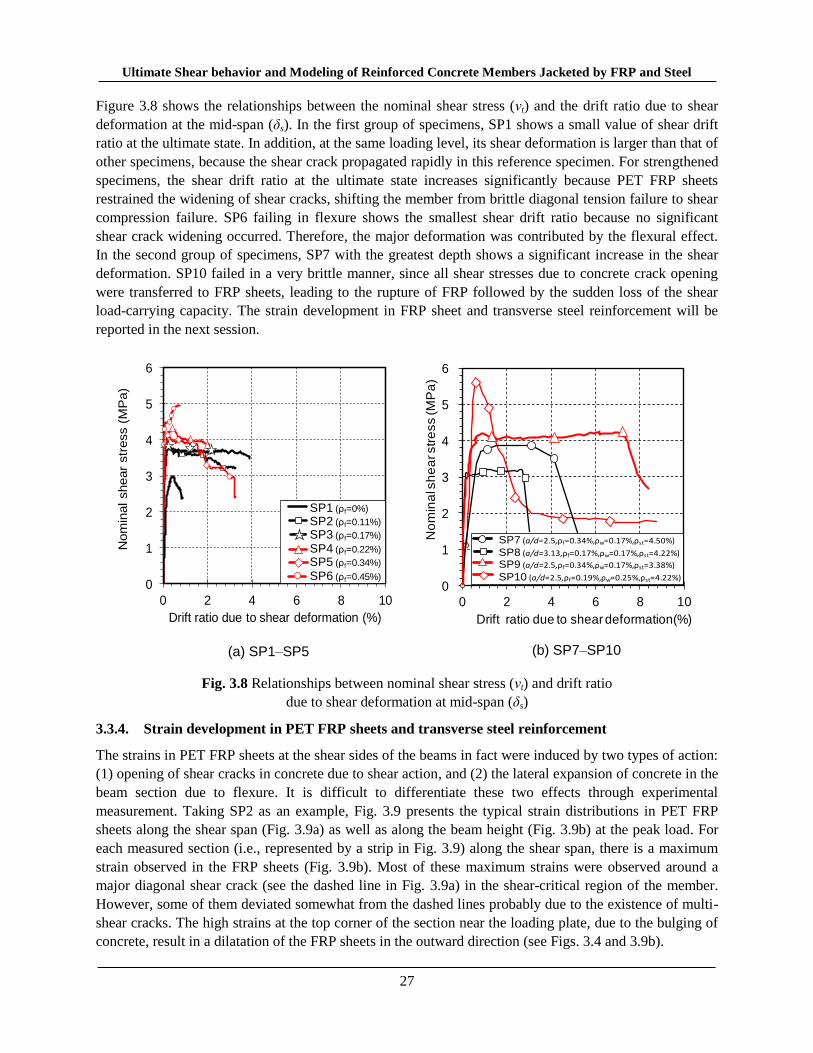
27
Ultimate Shear behavior and Modeling of Reinforced Concrete Members Jacketed by FRP and Steel
Figure 3.8 shows the relationships between the nominal shear stress (νt) and the drift ratio due to shear
deformation at the mid-span (δs). In the first group of specimens, SP1 shows a small value of shear drift
ratio at the ultimate state. In addition, at the same loading level, its shear deformation is larger than that of
other specimens, because the shear crack propagated rapidly in this reference specimen. For strengthened
specimens, the shear drift ratio at the ultimate state increases significantly because PET FRP sheets
restrained the widening of shear cracks, shifting the member from brittle diagonal tension failure to shear
compression failure. SP6 failing in flexure shows the smallest shear drift ratio because no significant
shear crack widening occurred. Therefore, the major deformation was contributed by the flexural effect.
In the second group of specimens, SP7 with the greatest depth shows a significant increase in the shear
deformation. SP10 failed in a very brittle manner, since all shear stresses due to concrete crack opening
were transferred to FRP sheets, leading to the rupture of FRP followed by the sudden loss of the shear
load-carrying capacity. The strain development in FRP sheet and transverse steel reinforcement will be
reported in the next session.
Fig. 3.8 Relationships between nominal shear stress (νt) and drift ratio
due to shear deformation at mid-span (δs)
3.3.4. Strain development in PET FRP sheets and transverse steel reinforcement
The strains in PET FRP sheets at the shear sides of the beams in fact were induced by two types of action:
(1) opening of shear cracks in concrete due to shear action, and (2) the lateral expansion of concrete in the
beam section due to flexure. It is difficult to differentiate these two effects through experimental
measurement. Taking SP2 as an example, Fig. 3.9 presents the typical strain distributions in PET FRP
sheets along the shear span (Fig. 3.9a) as well as along the beam height (Fig. 3.9b) at the peak load. For
each measured section (i.e., represented by a strip in Fig. 3.9) along the shear span, there is a maximum
strain observed in the FRP sheets (Fig. 3.9b). Most of these maximum strains were observed around a
major diagonal shear crack (see the dashed line in Fig. 3.9a) in the shear-critical region of the member.
However, some of them deviated somewhat from the dashed lines probably due to the existence of multi-
shear cracks. The high strains at the top corner of the section near the loading plate, due to the bulging of
concrete, result in a dilatation of the FRP sheets in the outward direction (see Figs. 3.4 and 3.9b).
0
1
2
3
4
5
6
0 2 4 6 8 10
Nom
inal shear
str
ess (
MP
a)
Drift ratio due to shear deformation (%)
0
1
2
3
4
5
6
0 2 4 6 8 10
No
min
al s
he
ar str
ess (M
Pa
)
Drift ratio due to shear deformation(%)
(a) SP1–SP5
SP1 (ρf=0%)
SP2 (ρf=0.11%)
SP3 (ρf=0.17%)
SP4 (ρf=0.22%)
SP5 (ρf=0.34%)
SP6 (ρf=0.45%)
SP7 (a/d=2.5,ρf=0.34%,ρw=0.17%,ρst=4.50%)
SP8 (a/d=3.13,ρf=0.17%,ρw=0.17%,ρst=4.22%)
SP9 (a/d=2.5,ρf=0.34%,ρw=0.17%,ρst=3.38%)
SP10 (a/d=2.5,ρf=0.19%,ρw=0.25%,ρst=4.22%)
(b) SP7–SP10

28
Ultimate Shear behavior and Modeling of Reinforced Concrete Members Jacketed by FRP and Steel
Fig. 3.9 Strain distribution of PET FRP sheet along the shear-span length at peak load
Figure 3.10 shows the strain distributions in transverse steel reinforcement along the shear span and the
sectional depth. The strain distributions of transverse steel reinforcement in the shear-critical region are
similar to those of PET FRP sheets. However, the maximum strains are always observed at the mid-height
of the shear side of the beam (Fig. 3.10a) rather than the top corner because there is negligible effect of
the concrete bulging on the transverse steel reinforcement.
Fig. 3.10 Strain distribution of transverse steel reinforcement s along the shear-span length at peak load
The locations of strain gauges bonded on FRP sheets and transverse steel reinforcement intersected with
the critical shear crack are also shown in Figs. 3.9 and 3.10. The readings of the strain gauges at these
locations (i.e., marked with circles in strips F2 to F5 in Fig. 3.9, and in lines S1 to S3 in Fig. 3.10) were
(a) Strain of SP2 along shear-span
shear crack path wf =75 mm
shear span
sectional depth
shear crack
F1 F2 F5 F3 F4 F6 F7 Strip:
F1 F2 F5 F3 F4 F6 F7 Strip:
20000
0
10000
(b) Strain of SP2 along sectional depth
0
50
100
150
200
250
300
0 5000 10000 15000 20000
Sectional depth
(m
m)
Strain value (μɛ)
F1 F2 F3 F4F5 F6 F7
ɛmax =14612
(a) Strain of SP2 along shear-span (b) Strain of SP2 along sectional depth
S4 S1 S2 S3
shear crack path
Line:
S1 S2 S3 S4
shear span
sectional depth
Line: 12000
0
6000
0
50
100
150
200
250
0 5000 10000 15000 20000
Sect
ional d
epth
(m
m)
Strain value (μɛ)
S1 S2 S3 S4
ɛmax =10355
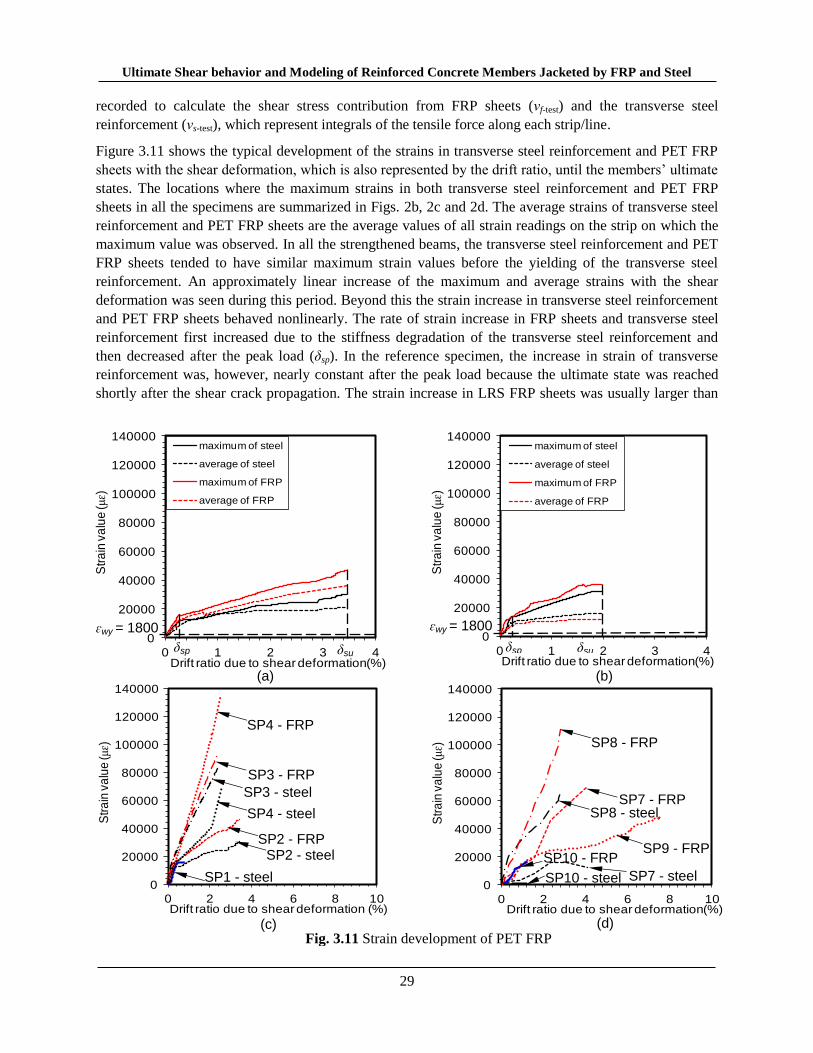
29
Ultimate Shear behavior and Modeling of Reinforced Concrete Members Jacketed by FRP and Steel
recorded to calculate the shear stress contribution from FRP sheets (νf-test) and the transverse steel
reinforcement (νs-test), which represent integrals of the tensile force along each strip/line.
Figure 3.11 shows the typical development of the strains in transverse steel reinforcement and PET FRP
sheets with the shear deformation, which is also represented by the drift ratio, until the members’ ultimate
states. The locations where the maximum strains in both transverse steel reinforcement and PET FRP
sheets in all the specimens are summarized in Figs. 2b, 2c and 2d. The average strains of transverse steel
reinforcement and PET FRP sheets are the average values of all strain readings on the strip on which the
maximum value was observed. In all the strengthened beams, the transverse steel reinforcement and PET
FRP sheets tended to have similar maximum strain values before the yielding of the transverse steel
reinforcement. An approximately linear increase of the maximum and average strains with the shear
deformation was seen during this period. Beyond this the strain increase in transverse steel reinforcement
and PET FRP sheets behaved nonlinearly. The rate of strain increase in FRP sheets and transverse steel
reinforcement first increased due to the stiffness degradation of the transverse steel reinforcement and
then decreased after the peak load (δsp). In the reference specimen, the increase in strain of transverse
reinforcement was, however, nearly constant after the peak load because the ultimate state was reached
shortly after the shear crack propagation. The strain increase in LRS FRP sheets was usually larger than
0
20000
40000
60000
80000
100000
120000
140000
0 1 2 3 4
Str
ain
va
lue
(μɛ)
Drift ratio due to shear deformation(%)
maximum of steel
average of steel
maximum of FRP
average of FRP
δsp δsu
ɛwy = 1800 0
20000
40000
60000
80000
100000
120000
140000
0 1 2 3 4
Str
ain
va
lue
(μɛ)
Drift ratio due to shear deformation(%)
maximum of steel
average of steel
maximum of FRP
average of FRP
ɛwy = 1800
δsp δsu
0
20000
40000
60000
80000
100000
120000
140000
0 2 4 6 8 10
Str
ain
va
lue
(μɛ)
Drift ratio due to shear deformation (%)
SP4 - FRP
SP3 - FRP
SP3 - steel
SP4 - steel
SP2 - FRP SP2 - steel
SP1 - steel 0
20000
40000
60000
80000
100000
120000
140000
0 2 4 6 8 10
Str
ain
va
lue
(μɛ)
Drift ratio due to shear deformation(%)
SP8 - FRP
SP7 - FRP SP8 - steel
SP9 - FRP
SP7 - steel
SP10 - FRP
SP10 - steel
(b) (a)
(d) (c) Fig. 3.11 Strain development of PET FRP

30
Ultimate Shear behavior and Modeling of Reinforced Concrete Members Jacketed by FRP and Steel
that in transverse steel reinforcement because of the dual effects of LRS FRP sheets (i.e., shear
strengthening and confinement effects).
The difference between the average strain and the maximum strain of FRP sheets reflects the extent of
strain localization. It is seen that such a difference was smaller in SP2 (Fig. 3.11a) than that in SP5 (Fig.
3.11b). This is mainly because the location of the maximum strain observed in SP2 was closer to the
major shear crack (F-18 in Fig. 3.2) while that observed in SP5 was closer to the top corner of the section.
The stress concentrations at the former and latter locations tended to lead to easy debonding and fiber
rupture, respectively.
Figs. 3.11c and 3.11d show the development of the maximum strain in FRP sheets and transverse steel
reinforcement with the shear deformation for Group 1 and Group 2 beams, respectively. For the first
group, just SP1 to SP4 are presented due to the premature failure of SP5 and the different failure mode of
SP6. It is seen that the strengthening ratio influenced significantly the strain development in both FRP
sheets and transverse steel reinforcement. Given the same drift ratio due to shear deformation, the higher
strengthening ratio of LRS FRP sheets was used, the higher strain values developed in both the FRP
sheets and the transverse steel reinforcement. For the second group of specimens, SP7 with the highest
longitudinal reinforcement ratio developed higher strain values in the FRP sheets with the shear
deformation compared to SP9, which had the lowest longitudinal reinforcement ratio. Strains of
transverse steel reinforcement in SP9 were not available due to the breakage of gauges. Compared to all
other specimens in Group 2, SP8 exhibited the faster strain development in the FRP sheets with the
deflection increase during the whole loading period owing to its largest shear-span-to-effective depth ratio
(a/d = 3.13).
3.3.5. Degradation of the shear contribution of concrete
The contribution of concrete to the shear resistance can be isolated from the total member shear force
once the shear contributions of transverse steel reinforcement and LRS FRP sheets are known from the
analyses on strain readings. The shear contribution of concrete in RC members wrapped with LRS FRP
sheets was usually found to have reached its peak value before the full development of the member shear
strength, as shown in Fig. 3.12. For example, in SP7 the concrete contribution to shear started degrading
at the shear drift ratio of 0.80% while had degraded by 47.6% compared to its peak value at the shear drift
ratio of 2.35% (Fig. 3.12a). A similar phenomenon was observed in all other strengthened members such
as in SP10 (Fig. 3.12b). The extent of degradation varied from a range of 0~54.6% depending on the
volumetric ratio of FRP sheets, the shear-span to effective-depth ratio and the depth of member section.
Therefore, the prediction of the degradation of concrete shear contribution is essential for RC members
strengthened by LRS FRP composites.
Figure 3.13 shows the relationships between the concrete shear stress (νc) and the member drift ratio due
to shear deformation (δs). In the first group of specimens, the maximum shear contributions from concrete
are different for different specimens in spite of their identical sectional dimensions because the fully
wrapped FRP sheets provided confinement to concrete and hence enhanced its compressive concrete
strength, as shown in Fig. 3.13a and Table 3.4 (νc-test at peak load). In addition, the mark “” in Figs. 3.13a
and 13b indicates the shear drift ratio levels at which the member's shear strength was reached in SP4,
SP7 to SP10 as examples. These levels (i.e., δsp) for all other specimens can be found in Table 3.4. In the
second group of specimens, the degradation of the concrete shear contribution in SP8, which had a higher
shear-span to effective-depth ratio, started earlier than that in other specimens, indicating that the shear-
span to effective-depth ratio influenced the initiation of concrete degradation. In SP10, the concrete shear
degradation suddenly lost after the peak due to insufficient transverse reinforcement.
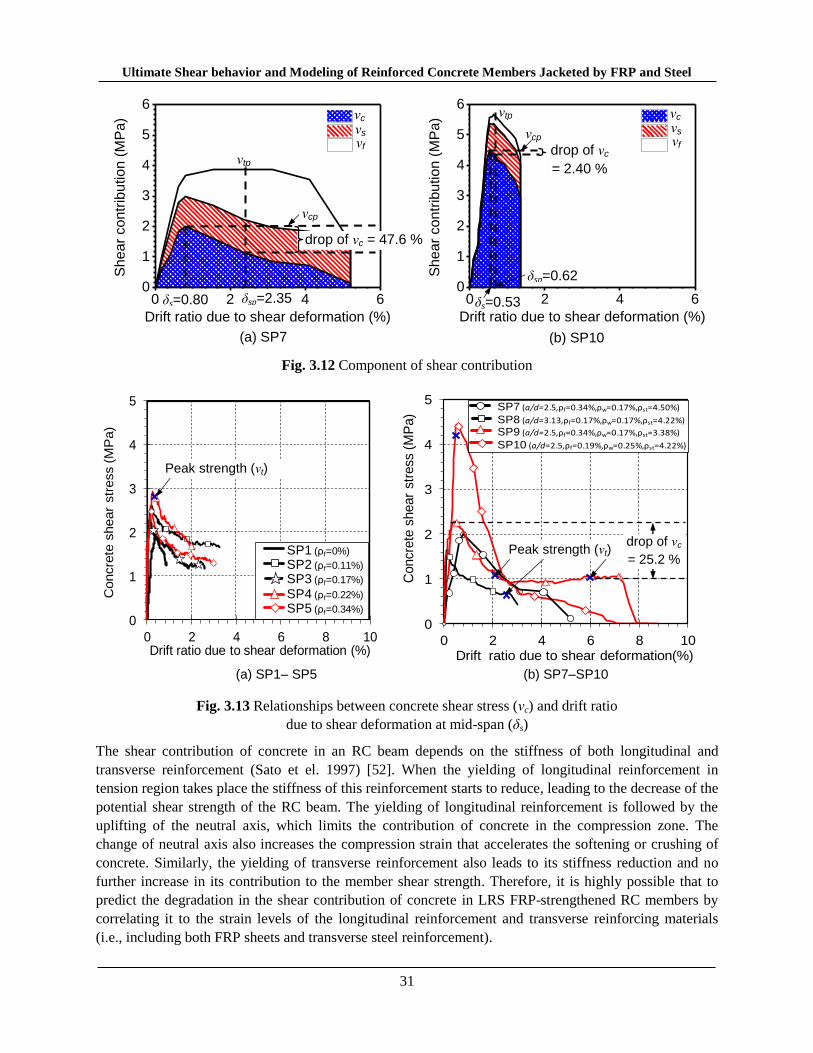
31
Ultimate Shear behavior and Modeling of Reinforced Concrete Members Jacketed by FRP and Steel
Fig. 3.12 Component of shear contribution
Fig. 3.13 Relationships between concrete shear stress (νc) and drift ratio
due to shear deformation at mid-span (δs)
The shear contribution of concrete in an RC beam depends on the stiffness of both longitudinal and
transverse reinforcement (Sato et el. 1997) [52]. When the yielding of longitudinal reinforcement in
tension region takes place the stiffness of this reinforcement starts to reduce, leading to the decrease of the
potential shear strength of the RC beam. The yielding of longitudinal reinforcement is followed by the
uplifting of the neutral axis, which limits the contribution of concrete in the compression zone. The
change of neutral axis also increases the compression strain that accelerates the softening or crushing of
concrete. Similarly, the yielding of transverse reinforcement also leads to its stiffness reduction and no
further increase in its contribution to the member shear strength. Therefore, it is highly possible that to
predict the degradation in the shear contribution of concrete in LRS FRP-strengthened RC members by
correlating it to the strain levels of the longitudinal reinforcement and transverse reinforcing materials
(i.e., including both FRP sheets and transverse steel reinforcement).
0 2 4 60
1
2
3
4
5
6
Shear
contr
ibution (
MP
a)
Drift ratio due to shear deformation (%)
(a) SP7 (b) SP10
νc νs νf
νcp
δs=0.53
δsp=0.62
νtp
drop of νc
= 2.40 %
0 2 4 60
1
2
3
4
5
6
Shear
contr
ibution (
MP
a)
Drift ratio due to shear deformation (%)
νc νs νf
νtp
δs=0.80 δsp=2.35
drop of νc = 47.6 %
νcp
0
1
2
3
4
5
0 2 4 6 8 10
Concre
te s
hear
str
ess (
MP
a)
Drift ratio due to shear deformation (%)
Peak strength (νt)
(b) SP7–SP10 (a) SP1– SP5
SP1 (ρf=0%)
SP2 (ρf=0.11%)
SP3 (ρf=0.17%)
SP4 (ρf=0.22%)
SP5 (ρf=0.34%)
0
1
2
3
4
5
0 2 4 6 8 10
Concre
te s
hear
str
ess (
MP
a)
Drift ratio due to shear deformation(%)
Peak strength (νt) drop of νc
= 25.2 %
SP7 (a/d=2.5,ρf=0.34%,ρw=0.17%,ρst=4.50%)
SP8 (a/d=3.13,ρf=0.17%,ρw=0.17%,ρst=4.22%)
SP9 (a/d=2.5,ρf=0.34%,ρw=0.17%,ρst=3.38%)
SP10 (a/d=2.5,ρf=0.19%,ρw=0.25%,ρst=4.22%)
32
Ultimate Shear behavior and Modeling of Reinforced Concrete Members Jacketed by FRP and Steel
3.4. SUMMARY
An experimental program involving tests on ten RC beams strengthened in shear with fully wrapped LRS
PET FRP sheets has been conducted. The test parameters include the strengthening ratio, the longitudinal
reinforcement ratio as well as the shear-span to effective-depth ratio. In conclusion, PET FRP sheets with
a large rupture strain can be used to enhance the shear strength of RC beams while substantially
increasing the member ductility. In particular, PET FRP sheets did not rupture at the peak load and led to
a ductile shear failure of the strengthened RC members. This failure mode also enabled us to clearly
observe the behavior of shear strength degradation of concrete with the increase of shear deformation
until the rupture of PET FRP sheets. Moreover, the increase of amount of PET FRP sheets led to an
increase of the shear strength and shear ductility whereas a lower longitudinal reinforcement ratio and a
smaller shear-span to effective-depth ratio corresponded to improved shear ductility. It is found that PET
FRP sheets developed very high strains; namely the maximum strains of 1.4-6.0% at the peak shear loads
and as high as 15.0% at the termination of tests. Finally, the initiation of the degradation of the shear
contribution of concrete occurred even before the peak strength was developed in PET FRP-strengthened
RC members. The shear contribution of concrete was found to degrade by 0-54.6% depending on the
volumetric ratio of FRP sheets, the shear-span to effective-depth ratio and the member depth. This
degradation of concrete contribution to shear strength is eligible in the case of no axial loading for the
current study.
Owing to the close relation between the concrete shear deterioration, the member shear deformation and
the strain levels in the transverse reinforcing materials including both FRP sheets and transverse steel
reinforcement as observed in the current experimental results, further study will be carried out to build up
a comprehensive model to explain the above relation. The development of such a comprehensive model
will be reported and discussed in the next chapter.
33
Ultimate Shear behavior and Modeling of Reinforced Concrete Members Jacketed by FRP and Steel
CHAPTER 4
4.
MATERIAL AND STRENGTH MODELS
4.1. INTRODUCTION
A new method to predict load-deformation envelope responses of reinforced concrete (RC) columns both
with and without fiber reinforced polymer (FRP) jacketing under seismic loading is presented. Firstly, the
material stress-strain relationships such as concrete, steel reinforcement and jacketing materials are
established. In concrete stress-strain model, the confinement effect in the pre-and post-peak regions is
proposed for more precise prediction. Secondly, strength models consisting of flexural and shear strengths
are developed. The flexural strength is predicted based on section analysis or fiber model, where as shear
strength is developed based on truss mechanism. For steel jacketing, steel plates are assumed to limit an
opening of shear cracks in vertical, horizontal and shear directions. For FRP jacketing, FRP sheets are
assumed to resist the shear crack opening only in the fiber alignment. The interaction between flexural
and shear strengths will be proposed. A flexure-shear interaction (FSI) analytical method is presented
which allows a more precise prediction of the load-deformation responses of RC columns with and
without seismic jacketing. In this FSI analytical method, conventional section analysis is applied by
including a parameter for the confinement ratio as a function of the secant stiffness of the steel shear and
fiber reinforcements. By including the effects of shear, the truss mechanism proposed by Sato et al.
[52-54] is combined with the section analysis. After the onset of shear cracks, the additional flexural
deformation due to the tension shift phenomenon is included for a more precise prediction of the flexural
deformation. Use of a shear deformation model based on the truss mechanism accounts for the effects of
tension stiffening, fiber confinement and proposed strut angle. The shear and flexural deformations are
combined with the pull-out deformations to obtain an accurate prediction of the total deformations of the
columns. The proposed analytical method can demonstrate shear strength and ductility enhancement of
RC columns confined with both low and high fracture strain fiber materials, including steel jacket, CFRP,
AFRP, PEN and PET FRP sheet.
4.2. MATERIAL MODELS FOR STRENGTH ANALYSIS
4.2.1. Concrete
Fig. 4.1 illustrates the stress-strain relationships of (a) concrete under compression, (b) concrete under
tension, (c) reinforcing steel, and (d) reinforcing fiber. For a typical compressive concrete stress-strain
relationship, as shown in Fig. 4.1a, separation into pre-peak and post-peak regions is convenient to
examine the influence of confinement and concrete strength degradation. This separation of pre- and post-
peak regions on the basis of relevant important criteria has successfully been developed in many studies
[35,69]. These criteria for both regions are dependent on each other. For instance, the compressive strain
of concrete at peak strength controls the criteria in both regions, while the ultimate strain significantly
controls the criteria in the post-peak region. In the pre-peak region, the confinement effect provided by
transverse steel reinforcement and fiber reinforcement as a jacket is described by a second-order parabolic
function based on the models of Mander et al. [35] and Wang and Restrepo [69]. For the post-peak or
softening region, it is assumed that, according to the previous models [30,35,69], the descending branch is
a linear curve until the value of stress becomes equal to the residual stress, which is a constant even for

34
Ultimate Shear behavior and Modeling of Reinforced Concrete Members Jacketed by FRP and Steel
further increase in strain. The concrete model proposed by Jirawattanasomkul et al. [30] can be applied to
evaluate the degradation in strength. The partial confinement effect in the section subjected to bending
moment, where the confinement effect only exists in the compression zone, is considered in this model. In
the post-peak region, the effective concrete strength is considered as the residual concrete strength. Figure
4.1b illustrates the corresponding stress-strain relationship for concrete under tension.
4.2.2. Steel reinforcement
Fig. 4.1c shows the stress-strain relationship of steel reinforcements. For the steel reinforcement under
tension, a tri-linear model, which is applied for the un-embedded steel reinforcement stress-strain curve in
tension, and includes the effects of (1) elasticity, (2) the yield plateau, and (3) strain-hardening. In the
elastic region, the secant modulus of reinforcement (Ese) is constant with a value equal to the Young's
modulus. After the yielding point is reached, the steel reinforcement behaves plastically, resulting in a
reduction of the secant modulus. For the embedded steel reinforcement, the stress-strain model proposed
in CEB-FIP Model Code 1990 [12] is applied, which consists of stages for un-cracked concrete, crack
formation, stabilized cracking and post-yielding. Regarding the compression part of the stress-strain curve,
the buckling of reinforcement modeled by Dhakal et al. [17] causes a sudden reduction in the secant
modulus, leading to a corresponding reduction in the compressive stress.
4.2.3. FRP sheet
Fig. 4.1d shows the stress-strain relationship of FRP reinforcements. The stress increases linearly with
increasing tensile strain; a constant value of secant modulus is therefore obtained until rupture, when the
secant modulus loses its stability. FRP jackets are subjected to only tensile loading since they elongate
owing to the expansion of the inner concrete [30,69]. Therefore, in the analytical method, the stress-strain
relationship of fibers is applied only for the tension region.
Fig. 4.1 Stress-strain relationships and secant moduli
σs,σw
ɛct
σct
b) Concrete in tension
Ece
1
σc
Unconfined
ɛc
Ece
a) Concrete in compression
Confined 1
Residual concrete
strength f'ce
d) Fiber reinforcement in tension
σf
ɛf
Tension
Efe
rupture
1
Compression
ɛs,ɛw
Tension
c) Steel reinforcement
1 Ese ,Ewe
1 Ese ,Ewe
reinforcement
(unembedded)
reinforcement
(embedded)

35
Ultimate Shear behavior and Modeling of Reinforced Concrete Members Jacketed by FRP and Steel
4.2.4. Confinement effect
One important application of FRP-jacketing is the confinement effect due to fiber and steel tie. In fact, the
confinement effect exists only in the compression region which can be indicated by the neutral axis depth
(xe) and the lateral confining pressure provided by FRP jacket can be calculated by the simplified
assumption [30] as in Fig. 4.2(a). For simplicity, the effective lateral confining pressure in y-direction
(fly,f) is a ratio of the neutral axis depth to the total depth (x/xe), whereas the lateral confining pressure in x-
direction (flx,f) is a half of the total concrete expansion. Therefore, the effective confinement in both
directions is expressed in Eq. 8 and Eq. 9.
,
1
2lx f f f ff E (4.1)
,ly f f f fe
xf E
x (4.2)
In Fig.4.2(b), the effective core concrete enclosed by steel tie is proposed as the arching action by Mander
et al. [35]. In the assumption, the lateral pressure provided by steel tie in x- (flx,w)and y-directions (fly,w) is
a function of stiffness of steel tie (Ew) and the strain of steel tie (εw) measured from the experiment.
,lx w w w w wf k E (4.3)
,ly w w w w wf k E (4.4)
Moreover, Mander et al. [35] developed the effective confinement coefficient (kw). The core dimensions
to centerlines of perimeter steel tie in x- and y- directions are hw and bw, respectively. The clear distance
between adjacent longitudinal bars is wi and s' is a clear vertical spacing of tie reinforcement as shown in
Fig. 4.3.
2
1
1 1 16 2 2
1
ni
w wi
w
cc
w s s
b h b hk
(4.5)
where: Acc = area of the core section enclosed by the center lines of steel tie and ρcc = ratio of total area of
longitudinal reinforcement to area of the core section (Ac).
h
flx,f fly,
f
xe
b bw
hw
fly,w
flx,w
wi
(b) Transverse steel (a) FRP sheet
Neutral axis line
Fig. 4.2 Lateral confining pressure

36
Ultimate Shear behavior and Modeling of Reinforced Concrete Members Jacketed by FRP and Steel
2 2
1 1
1 1 16 6 2 2
1
m ny x
i i
w
cc
w w s s
bd bd b d
k
(4.6)
2
12
1
s
w
cc
s
dk
(4.7)
Since both steel tie and fiber jackets enclose the core section, the total lateral pressure in x- (flx) and y-
directions (flx) derives from the summation of the lateral pressure provided by fiber sheet and steel tie.
The maximum lateral stress (fl) is considered by using the larger value between Eqs. (4.8) and (4.9). To
address the confinement effect to the concrete strength, Mander et al. [35] proposed the confined
compressive strength of concrete (f'cc) as a function of the maximum lateral stress and the unconfined
compressive strength (f'c) as in Eq. (4.10). In this equation, the concrete strength is equal to the
unconfined concrete strength in case of no lateral pressure (fl=0).
, ,lx lx w lx ff f f (4.8)
, ,ly ly w ly ff f f (4.9)
7.941.254 2.254 1 2l l
cc cc c
f ff f
f f
(4.10)
Side view
y
x
ds
ds-s/2
s' s
Top view
Side view
wy
wx
m=1,2,...
n=1,2,...
bc
bc-s/2
s' s
Top view
Fig. 4.3 Lateral confining pressure

37
Ultimate Shear behavior and Modeling of Reinforced Concrete Members Jacketed by FRP and Steel
4.3. FLEXURAL STRENGTH
The FSI analytical method makes use of both flexural and shear strength models. In the flexural strength
model, conventional section analysis is applied using the stress-strain relationships of materials as
mentioned in the previous section. By satisfying the compatibility and equilibrium conditions, the
mechanical properties—secant stiffness and effective concrete strength—can be obtained. These
properties are applied in the shear strength model which accounts for the effect of shear crack. One finds
that the neutral-axis depth calculated from the shear strength model based on truss mechanism is
reasonably accurate, whereas the flexural strength model gives an overestimate [34,38-39,52-54,65].
Because of this, the neutral axis depth obtained from the shear strength model is assigned in the flexural
strength model. Then the stress-strain relationships of the materials are iterated in order to satisfy the
compatibility condition and force equilibrium.
To calculate the flexural strength, a section analysis is performed by dividing the section area into a
number of discrete strips, and it is assumed that plane sections remain planes at any loading level. In this
analysis, the increments in strain for the compression at the top fiber are fixed, and the strain across the
depth of the cross-section is assumed to be proportional to the distance from the neutral axis, as shown in
Fig. 4.4. In the flexural strength model, the enhancement of flexural strength is a consequence of the
confined concrete stress-strain relationship. For a given flexural cross section, the force and moment
equilibrium conditions are given by Eq. (4.11) and Eq. (4.12), respectively. The corresponding shear force,
Vmu, is obtained using Eq. (4.3).
1 1
n m
ci ci sj sji j
P A A
(4.11)
1 1
n m
ci ci i sj sj ji j
M A d A d
(4.12)
mu
MV
a (4.13)
where
σci = stress in ith concrete layer= ɛciEci,
k
k+1 lp
curvature (ø)
P z y
x
h = total depth of cross section
a = shear span
di = distance from top fiber to the centroid of ith concrete
layer dj = distance from top fiber to the centroid of j
th steel layer
x = initial neutral axis depth calculated in section analysis εcc = concrete compression strain at top εct = concrete tension strain at bottom
Fs2
εct
εcc σcc
dj
Fs3
di σs1
σs2
σs3
σs4 Fs4
Fs5
P
σs5
dm
dn
xi
h
Fs1
a
Fig. 4.4 Section analysis

38
Ultimate Shear behavior and Modeling of Reinforced Concrete Members Jacketed by FRP and Steel
σsj = stress in jth longitudinal reinforcement = ɛsjEsj,
Aci = area of ith concrete layer,
Asj = area of jth longitudinal reinforcement,
i, j = 1,2,3…n or m.
P = axial force,
M = moment at the considered cross section,
a = shear span (mm).
As expressed in Fig. 4.4, the strain compatibility equations of the ith concrete and the j
th longitudinal
reinforcement are given by the following equations:
ici ct cc ct
d
h (4.14)
j
sj ct cc ct
h d
h
(4.15)
From the section analysis, the secant moduli of materials (Ese, Ewe, Ece), the effective concrete strength
(f'ce), the strain of concrete at the compression edge (ɛcc) and the initial neutral axis depth (xi) can be
obtained. These parameters are applied in the shear strength model. However, the neutral axis depth used
in the flexural strength model is not the same as that used in the shear strength model (Fig. 4.4) because of
the shear crack opening (see Chapter 4.4).
4.4. SHEAR STRENGTH MODEL
The main limitation of the section analysis is that the effect of the shear strength behavior, such as shear
crack opening and reduction of the neutral axis depth on the flexural strength is not taken into account.
The post-peak region of the load-deformation response is dominated by the shear strength behavior. To
account for this, the truss mechanism approach proposed by Sato et al. [52-54] is combined with the
section analysis to predict the shear strength more precisely.
P = axial compressive force
V = applied shear force
Vc = concrete resisting shear force =Vcpz+Vstr
Vcpz = shear strength resisted by concrete in compression
Vstr = shear strength resisted by aggregate interlocking
Vs+f = shear strength resisted by transverse steel and fiber reinforcements
Vsu = total shear strength from Eq. (4.16)
θ = strut angle
Deformation
Vc – Eq.(4.17)
Shear reinforcement yielding
point
Flexural yielding
point
Vs+f – Eq. (4.18)
Potential shear force (Vsu)
P
Vs
Vstr
Vf
Lweb
Lstr xe
d
Vcpz
V
ɵ
P
Vs
Vstr
Vf
Lweb
Lstr xe
d
Vcpz
V
ɵ
P
Vs
Vstr
Vf
Lweb
Lstr xe
d
Vcpz
V
P
Vs
Vstr
Vf
Lweb
Lstr xe
d
Vcpz
P
Vs
Vstr
Vf
Lweb
Lstr xe
d
Vcpz
P
Vs
Vstr
Vf
Lweb
Lstr xe
d
Vcpz
V
ɵ
Fig. 4.5 Shear strength model

39
Ultimate Shear behavior and Modeling of Reinforced Concrete Members Jacketed by FRP and Steel
Figure 4.5 illustrates the concept of the shear strength model based on the truss mechanism by Sato et al.
[52-54]. This model is applicable for RC beams considering the yielding of reinforcements in reduction in
stiffness. Although the shear resisting mechanism of RC beams is similar to that in RC columns, the
location of the critical compression zone where concrete crushing occurs is different. For columns, this
concrete compression zone is located near the tip of the major diagonal shear crack. Owing to the
similarities between beam and column cases, Sato et al.’s model is implemented in the proposed
analytical approach as a base for shear strength prediction, as explained later.
Previous experimental observations [5-6,34,38-39,41,47,52-54,57] showed that the shear strength of RC
columns depends significantly on the secant stiffness of the flexural and shear reinforcements. As
explained previously, the secant stiffness is obtained from the stress-strain relationships of materials
which satisfy the compatibility and equilibrium conditions in the flexural strength model. When the
flexural reinforcement reaches its yield point, a reduction of the flexural stiffness occurs, and then a drop
of potential shear capacity is observed. Moreover, the potential shear capacity further decreases after the
yielding of the shear reinforcement, because the shear reinforcement contribution shows no further
increase.
The total shear strength can be expressed as a sum of the contribution from the concrete (Vc) and the shear
reinforcement (Vs+f), as shown in Eq. (4.16). This shear reinforcement consists of contribution from
transverse steeland fiber reinforcements.
su c s fV V V (4.16)
The effective concrete strength (f'ce) is another important parameter in the shear strength model [5-
6,34,38-39,41,47,52-54,57]. As indicated in Fig. 4.1a, the effective concrete strength, which is a function
of strain in the post-peak region, is considered as the residual concrete strength in the compressive
softening region. As a result, the concrete resisting force degrades after the onset of the reduction in the
effective concrete strength.
In the post-peak region, the observed shear force for a given deformation can be considered as the
remaining shear strength for that deformation. Column shear strength is influenced by several parameters,
including column cross-sectional dimensions, shear-span to effective-depth ratio, concrete compressive
strength, flexural reinforcement stiffness, transverse reinforcement stiffness, and axial load. While various
existing shear strength models incorporate some of these variables [2,12,27,34,38-39,41,47,52-54,57], the
development of a new shear strength model considering all the salient factors for columns is proposed.
Following a review of available data and previous models, the shear strength contributed by concrete (Vc)
is modified based on the formula in JSCE-2007 accounting for the ideas proposed by Sato et al. [52-54]
involving the stiffness of RC members, including the flexural and shear reinforcements. Using the
experimentally observed shear force components, the shear strength can be assumed to depend on four
parameters: the secant stiffness of the flexural reinforcement (ρsEse), the shear reinforcement (ρwEwe+ρfEfe),
the shear-span to effective-depth ratio (a/d) and the effective concrete strength (f'ce). Using a non-linear
regression analysis, the concrete contribution to shear strength can be written as:
c d p s w vcdV f b d (4.17)
where 30.2vcd cef f , 4 /d a d , 2.5
p
g co
P
A f
, 4
s s seE and 4w w we f feE E .

40
Ultimate Shear behavior and Modeling of Reinforced Concrete Members Jacketed by FRP and Steel
In order to calculate the shear reinforcement contribution in Eq. (4.16), an approach related to that of the
model of Sato et al. [52-54] is implemented. The average strains of the transverse steel reinforcement and
fiber reinforcement (ɛw and ɛf) are estimated, and the strains of both steel shear reinforcement and fiber
reinforcement are considered to be equal to the average shear strain (w ):
s f web w w f fV bL (4.18)
where w w weE and f w feE
4 0.20.12 0.20.066
1
1
E E fw we f fe ceE ns se
w
cc
efa
d
(4.19)
To estimate the shear strength provided by the shear reinforcement shown in Fig. 4.3, the projected shear
crack lengths along the vertical and horizontal axes (Lstr and Lweb) together with the diagonal compression
stress inclined at an angle θ are calculated according to Eqs. (4.20) and (4.21):
str eL h x (4.20)
tan
strweb
LL
(4.21)
Sato et al. [52-54] proved that the neutral axis depth from the flexural strength model is inapplicable after
shear cracking. This is because the plane-remains-plane assumption is no longer applicable. The neutral
axis depth is reduced, resulting in an increase in the compressive stress. Their formula (Sato et al. [52])
indicated that the concrete compression depth (xe) is related to the initial neutral axis depth obtained from
the section analysis (xi). Anggawidjaja et al. [6] modified formula proposed by Sato et al. by including the
influence of fiber reinforcement on the neutral axis depth as shown in the following equation:
0.4
0.70.420.08
1000
0.12
11 1.25
1 3.2
s se
w we f fe
a Ed
e n
E Ei cc
x ee
x f
(4.22)
In the case of steel jacket, the truss mechanism depicts the general case of shear reinforcement inclined at
an angle α to the vertical. It illustrates the relation between the external force (Vs+j) to be resisted by the
various internal forces. To satisfy equilibrium along the A-A section, the internal forces should balance
with the external forces as shown in Fig. 4.6(a). The internal forces consist of the following: tension force
in tension reinforcement (Tst,t), compression force in compression reinforcement (Cc), shear resisting force
along shear crack (Vstr) and shear force carried by steel shear reinforcement (Ts). The applied external
forces are axial compression (P) and applied lateral loads (V's+j). Figure 4.6(b) is a simplified free body
diagram including the jacket. The jacket induces a tension force along the tension tie direction (Tjt) and a
shear force along the shear cracking plane (Sjt). Note that there is no Sjt-component in case of FRP-
jacketing.

41
Ultimate Shear behavior and Modeling of Reinforced Concrete Members Jacketed by FRP and Steel
From the equilibrium condition, the shear force carried by the steel shear reinforcement and jacket can be
obtained as follows:
sin sins j s jt jtV T T S (4.23)
FRP-jacketing (without Sjt-component):
s j web w w we j jeV bL E E (4.23a)
For rectangular steel-jacketing:
sins j web w w we j je jtV bL E E S (4.23b)
For elliptical steel-jacketing:
2
04 sin
D t j
s j web w we w j j jt jtV bL E t dx
(4.23c)
where Sjt= τjt Ajt, Tjt= σjt Ajt and Ajt= tjz /sinθ.
Figure 4.7 shows reinforced concrete and steel jacket elements. For the given state of stress in alternative
jackets (Fig. 4.7(a)), we can determine the normal and shearing forces exerted on the oblique face of the
shaded triangular element as shown in Fig. 4.7(b). To evaluate these new stress components, we consider
the force equilibrium of a triangular element in the directions of x′ and y′:
2 2sin cos sin 2jt xx yy xy (4.24)
sin cos cos2jt yy xx xy (4.25)
V′s+j
CcTst,t
Ts
ɵ
zcotɵ
P
z
P
Tjt
α V′s+j
x
A
A
Sjt
jacketP
P
V's+j
Ts
V's+j
A
Tst,tCc
A
ɵ
α
a) Specimen SP1 without jacketing b) Simplified free body diagram
Fig. 4.6 Free body diagram of a cracked RC column

42
Ultimate Shear behavior and Modeling of Reinforced Concrete Members Jacketed by FRP and Steel
a) Stress state along shear crack for alternative jacket
Shear crack in existing RC column
Fig. 4.7 Stress state of alternative jackets
b) Plane stress state
σyy
σxσx
σyy
τyy
θ
τxy
τxy
σyyAjtcosθ
τjtAjt
σjtAjt
θ
σxxAjtsinθτxyAjtsinθ
τxyAjtcosθ
y
x
x'
y'
θz
θ α
z(cotθ+cotα)
tj
x
x+zcotθ
SjtTjt
Fig. 4.7 Stress state of alternative jackets (continued)

43
Ultimate Shear behavior and Modeling of Reinforced Concrete Members Jacketed by FRP and Steel
4.5. INTERACTION BETWEEN FLEXURAL AND SHEAR STRENGTHS
Fig. 4.8 illustrates the concept for failure modes of RC columns using interaction between the flexural and
shear strengths. The relationship between the applied shear force (V) and the total deformation of these
columns (∆) is indicated together with the flexural behavior under various conditions of shear strength
(Vsu1 and Vsu2), where Vsu1 represents the shear strength of columns with insufficient shear reinforcement
that fail in brittle shear before the flexural yielding (Vy), and Vy is defined as the shear force at yielding of
longitudinal reinforcement. On the other hand, Vsu2 represents the shear strength of columns with
sufficient shear reinforcement, so shear failure occurs after the flexural yielding followed by shear
reinforcement yielding, the latter being defined as the yielding of the shear reinforcement. This shear
reinforcement yielding causes not only a reduction in stiffness but also leads to no further increase in
shear reinforcement contribution to the shear capacity, in turn leading to a further decrease in the potential
shear strength. The intersection point between the curves representing the flexural strength and shear
strength corresponds to the peak shear force, and this point corresponds to the initiation of the post-peak
behavior. The failure mode can be distinguished by different cases of the intersection point. Mode I
corresponds to a brittle shear failure, as the intersection point occurs before the flexural yielding (Vy).
This means that the potential shear strength is smaller than the flexural yielding strength. Although the
shear failure causes a catastrophic collapse, many studies [34,47] show that shear failure after yielding
can be observed when RC members reach their flexural yielding strength (Vy) and peak flexural strength
(Vmu) before they fail in shear. Therefore, Mode II corresponds to a brittle shear failure after yielding in
which the intersection point comes before the peak flexural strength (Vmu) is reached. Mode III
corresponds to a shear failure after yielding, which occurs when the curves representing the flexural and
shear strengths intersect with each other after the development of the peak flexural strength. Finally,
Mode IV corresponds to a flexural failure, as the shear strength is higher than the flexural strength even
for large deformations. For the actual behavior of load-deformation response in RC columns, the applied
Intersection point
Flexural strength
Shear strength
Yielding point
Brittle shear failure I
II
Modes:
Brittle shear failure after
yielding
Less brittle shear failure
after yielding
Flexural failure
III
IV
Vmu
Vy
Flexural yielding
Vsu2
Vsu1
Deformation (∆)
I II III
IV
Applied shear force (V)
Shear reinforcement yielding
Fig. 4.8 The concept for failure modes of RC columns

44
Ultimate Shear behavior and Modeling of Reinforced Concrete Members Jacketed by FRP and Steel
shear force (V) should be equal to the smaller value of the two quantities Vmu and Vsu for a given
deformation.
4.6. DEFORMATIONS MODELS
It is necessary to establish deformation models in order to evaluate the load-deformation response
accurately. For RC columns, the total deformation is made up of flexural, shear and pull-out deformations.
4.6.1. Flexural deformation model
The flexural deformation in the elastic region is estimated from the flexural stiffness, EI. After flexural
cracking, an effective moment of inertia (Ie) is considered to obtain the effective stiffness or the EI-value
in the range between the partially cracked and fully cracked sections. Using Branson's equation [10], the
effective moment of inertia is defined as the flexural rigidity of the cracked columns in the elastic range in
which no yielding of tension reinforcement occurs:
3 3
max max
1cr cre g cr
M MI I I
M M
(4.26)
The flexural deformation can be determined as follows:
3
3f
c e
Va
E I (4.27)
where
V = applied shear force (N),
a = shear span (mm),
Ig = moment of inertia of un-cracked cross section (mm4),
Icr = moment of inertia of cracked section (mm4),
Mmax = maximum moment in the member at the stage deflection is computed (N.mm),
Mcr = cracking moment at the section (N.mm).
In the shear crack region (Lweb), the flexural deformation is calculated by the integration of curvature (ø)
along the column length as in Eq. (4.28):
0 0
web webL L
f dzdz (4.28)
where /cc ct D , ɛcc = strain of concrete at the compression edge, ɛct = strain of concrete at the
tension edge, and D = distance between the compression and tension edges.
Shear cracking results in a tension shift that produces an increase in the curvature. This in turn results in
an increase in the flexural deformation. This will be discussed in Chapter 4.7.

45
Ultimate Shear behavior and Modeling of Reinforced Concrete Members Jacketed by FRP and Steel
4.6.2. Shear deformation model
4.6.2.1. Shear deformation in pre-yielding region
The system used to evaluate the shear deformation is shown in Fig. 4.9a. It consists of an RC column
simulated as a truss system along the shear span length. The truss system is divided into a truss unit
illustrated by coordinates, A, B, C and D in Fig. 4.9b. On movement of these target coordinates to the
arbitrary coordinates, A', B', C' and D', the shortening of the compression strut (∆lst,c) and the elongation
of the tension tie (∆lst,t) generate the shear deformation components Δs1 and Δs2, respectively, resulting in
the total shear deformation, Δs (= Δs1 + Δs2). These quantities are expressed as follows (Ueda et al. [65]):
,1
4sin (cot cot )sin
s fst cs
ce
Vl
E b
(4.29)
,2
sin 1cot cot sin ³
s fst ts
fececewe w f
we we
Vl
EEE A A t
s E E
(4.30)
where
b = width of cross section (mm),
Ece = secant modulus of concrete (MPa),
Ewe = secant modulus of transverse steel reinforcement (MPa),
Efe = secant modulus of fiber reinforcement (MPa),
s = spacing of transverse steel reinforcement (mm),
tf = thickness of fiber reinforcement (mm),
Aw = cross-sectional area of transverse steel reinforcement,
Ace = cross-sectional area of surrounding effective concrete in tension, 3
/ceo crackA V V ,
Aceo = cross-sectional area of surrounding effective concrete in tension immediately after shear crack
/w wy tA f f ,
fwy = yield strength of transverse steel reinforcement,
ft = tensile strength of concrete,
crackV = shear force at diagonal shear cracking suggested in JSCE-2007 standard specification [27],
V = applied shear force,
V's+f = shear force carried by transverse steel and fiber reinforcements,
θ = strut angle,
α = angle of transverse steel reinforcement.

46
Ultimate Shear behavior and Modeling of Reinforced Concrete Members Jacketed by FRP and Steel
Many studies [6,64-65] showed that the strut angle is a key factor affecting the shear deformation. Based
on the formula proposed by Ueda et al. [65], the strut angle (θ) can be obtained by using a nominal shear
stress, ν (=V/bd). The equations are shown as follows:
2
0 0 , for 0 1.7 c (4.31)
01
1.7
, for 1.7 c (4.32)
where
0 3.2 40.2a
d
, for 1.5a d (4.33)
2
1 1 0 01.7 c (4.34)
0 0.9 c (4.35)
1 3 1 3 1 4 1.4
0.2 100 1000 0.75c co sf da d
(4.36)
2
1 0.4 2.9a
d
(4.37)
0.7 32 /s w a d (4.38)
To calculate the shear deformation, the shear force components in Eqs. (4.39) and (4.40)—shear force
carried by concrete (V'c) and shear force carried by shear and fiber reinforcement (V's+f)—need to be
clarified. In the pre-peak region, the applied shear force is not equal to the shear strength, so that the
b) A unit truss a) Total shear deformation
z y
x
Δs
Δs1
α
ɵ
A B
C D
B'
C'
E
Δs2
Δst,c
Δst,t
A'
D'
Fig. 4.9 Truss analogy for shear deformation

47
Ultimate Shear behavior and Modeling of Reinforced Concrete Members Jacketed by FRP and Steel
concrete and shear reinforcement contributions that resist the applied shear force cannot be explicitly
determined. In the post-peak region, the applied shear force is equal to the remaining shear strength, so
the V'c- and V's+f-values can be directly calculated from the shear strength model. The following steps,
therefore, are taken to estimate the shear force components in the pre-peak region:
1) For a given flexural reinforcement strain, the sectional moment and the effective concrete strength
(f'ce) are calculated. The strength enhancement due to the confinement effect is taken into account in
the calculation of the effective concrete strength.
2) The total shear strength (Vsu) as well as each shear force component (Vc and Vs+f) are then calculated
by the shear strength model.
3) Each shear force component is assumed to vary linearly from the shear cracking load (Vcrack) to the
total shear strength (Vsu), as shown in Fig. 4.10, so that each shear force component (V'c and V's+f)
under the shear force corresponding to the calculated moment can be calculated as follows:
2ms f
s f mu crack mu crack
su crack
VV V V V V
V V
(4.39)
mu crackc mu s f mu s f
c s f crack
V VV V V V V
V V V
(4.40)
where
V's+f = shear force carried by transverse steel and fiber reinforcements,
V'c = shear force carried by concrete,
m1 = slope of the internal and applied shear forces before shear cracking, which is equal to 1
m2 = slope of the internal and applied shear forces after shear cracking, /s f su crackV V V .
Vcrack
Vsu - Vcrack
V'c
V's+f
Vc
Vs+f
Vsu
Vcrack
m1
m2
Vmu - Vcrack Applied shear force (V)
Web and fiber reinforcement shear
force
Concrete shear force
Internal shear force
Fig. 4.10 Shear force components and internal shear resistance relationship

48
Ultimate Shear behavior and Modeling of Reinforced Concrete Members Jacketed by FRP and Steel
4.6.2.2. Shear deformation in post-yielding region
Although the current method presented in Chapter 4.6.2.1 can predict the shear deformation, it is not
applicable to the post-yielding region. To improve the applicability of the model, a modified strut angle
for the post-yielding region is obtained using a nonlinear regression approach in order to obtain a better
shear-deformation correlation with the experiment. The strut angle in the calculation of the shear
deformation is modified on the basis that the experimental value of shear deformation should be equal to
that calculated. By changing the strut angle until these values show the best fit, the value of strut angle is
obtained as a function of different parameters. These important parameters are the shear-span-to-depth
ratio, stiffness of reinforcement and compressive concrete strength according to studies of previous
researchers [65,70]. The model for the strut angle is as follows:
2 2 20.3ln 4.4ln 10.74 0.4ln 4ln 12.9 0.8ln 4ln 1.5A A B B C C (4.41)
where s seA E , w we f feB E E and ceC f .
4.6.3. Pull-out deformation model
In addition to the shear and flexural deformations, the pull-out of the steel reinforcement under tension at
the section above the basement footing of the specimen should be included in the total deformation. Pull-
out deformations stem from the elongation of the reinforcement relative to the anchoring concrete. These
deformations result in additional lateral displacements that are not included in the flexural analysis. Slip
models of the steel reinforcement have been developed by several groups [5-6,38-39,59]. A steel
reinforcement embedded in concrete can be modeled by assuming linear elastic behavior and a uniform
bond stress over the development length of the reinforcement. According to previous studies by
Anggawiddjaja et al. [6], the slip model proposed by Shima et al. [59] shows good agreement with
experimental results, and the pull-out deformation makes a large contribution after the yielding of the
tension reinforcement. In the FSI analytical method, the same slip model is applied to calculate the pull-
out deformation. From the pull-out model, it is clear that the pull-out deformation (∆p) is influenced by
the flexure and shear strength behaviors because the slip is related to the depth of the neutral axis [52-54].
4.7. INTERACTION OF FLEXURE AND SHEAR ON DEFORMATION MODEL
Regarding the section analysis, the flexural deformation can only be reliably predicted before the onset of
shear cracking. However, shear cracking increases the stress on the tension reinforcement, which
invalidates the plane-remains-plane assumption in the section analysis. This phenomenon that is termed
tension shift [21,65].
As shown in the free body diagram illustrated in Fig. 4.11, the cracked column is depicted as a truss
analogy with the diagonal compression stress inclined at an angle θ and the shear reinforcement aligned at
an angle α. The figure also illustrates the resisting force in the compression (Cc) and the tension
reinforcement (Tst,t). In equilibrium, the shear force component carried by the shear reinforcement (V's+f)
should satisfy a balance condition with a tension force along the shear crack length (Ts). The increase in
the tensional stress due to the tension shift can be expressed by an additional tension force in the tension
reinforcement (∆T). Based on Ueda’s model [65], the tension force increases when the shear force is
larger than the diagonal shear crack force (Vcrack), as follows:

49
Ultimate Shear behavior and Modeling of Reinforced Concrete Members Jacketed by FRP and Steel
If crackV V , ∆T =0 (4.42)
If crackV V , cot cot
2s fT V
(4.43)
This additional tension force induces greater tensile stress, and the sectional moment (M) remains the
same even after shear cracking. This is because the diagonal compression strut force and/or the tension
force in the shear reinforcement cancel the additional moment induced by the additional tension force in
the tension reinforcement.
According to the tension shift effect, the additional tension force influences the increment of strain in the
tension reinforcement. Consequently, an additional curvature (∆ø) is produced by the incremental strain,
which leads to a larger flexural deformation. Moreover, the neutral axis depth due to shear cracking (xe)
theoretically affects the flexural deformation in terms of the additional curvature of the section. In the
shear cracking region or the plastic hinge region (Lweb), and accounting for the tension shift effect, the
flexural deformation is given as follows:
0 0
web webL L
f shift dzdz (4.44)
where ∆ø = additional curvature of section.
After flexural yielding, the secant stiffness of flexural reinforcement continuously decreases with the
increase in flexural deformation. According to the shear strength model, the contribution to the shear
strength from the concrete (Eq. (4.17)) decreases with the decrease in secant stiffness of flexural
reinforcement. The contribution of the shear reinforcement (Eq. (4.18)) then tends to increase under the
same shear force, which results in an increase in shear deformation.
V’s+f
CcTst,t
Ts
ɵ
αzcotɵ
P
z
P
Fig. 4.11 Tension shift phenomenon [65]

50
Ultimate Shear behavior and Modeling of Reinforced Concrete Members Jacketed by FRP and Steel
4.8. THE FSI ANALYTICAL PROCEDURE
Figure 4.12 presents the analytical procedure for the FSI method. The first step in the analytical procedure
assumes a fixed value of the strain in the concrete strain at the compression edge, which is defined as ɛcc.
The section analysis is performed by dividing the section into number of strips, as previously explained in
Fig. 4.2. By adding an incremental axial strain (∆ɛc) until the compatibility and force equilibrium
conditions are satisfied in the iteration process, all parameters—secant modulus of flexural reinforcement
(Ese), effective concrete strength (f'ce), initial neutral axis depth (xi) and flexural strength (Vmu)—can thus
be determined. Using these parameters, the shear strength model based on the truss mechanism is
considered. This model also requires an initial fixed value of the average shear reinforcement strain
denoted by ɛw to determine the average shear reinforcement strain in Eq. (4.19). To ensure the accuracy of
the fixed average shear reinforcement strain, an iteration process is performed by adding an incremental
shear strain (∆ɛw) until the initial fixed value of the average shear reinforcement strain is equal to that
obtained from Eq. (4.19). Then, the neutral axis depth, including the shear crack effect (xe), is obtained
and compared with the initial neutral axis depth from the section analysis (xi). The section analysis is then
reanalyzed by updating the xi-value to be fixed as the xe-value (xi= xe). During the reanalysis of the neutral
axis depth in the section analysis, the two unknowns which are the strains at the compression and tension
edges are varied until the equilibrium and compatibility conditions are satisfied. Then the shear strength
value (Vsu) is calculated. If the Vsu-value is larger than the Vmu-value, the behavior of RC columns is
considered to be in the pre-peak region. If the Vsu-value is smaller than the Vmu-value, the behavior of RC
columns is considered to be in the post-peak region. Because the shear strength controls the post-peak
behavior of RC columns, the Vmu-value should be equal to the Vsu-value in the equilibrium equation. To
account for this reduction of strength capacity in the post-peak region, ∆ɛc is subtracted from ɛcc, resulting
in the unloading stress-strain relationships of materials in the iteration process. Finally, the deformation
components—flexure (∆f), shear (∆s), pull-out (∆p) and additional flexural deformation due to tension
shift (∆f-shift)—are calculated, and then the load-deformation response can be obtained.

51
Ultimate Shear behavior and Modeling of Reinforced Concrete Members Jacketed by FRP and Steel
Give the axial strain of concrete at the top fiber (εcc)
Give an average transverse strain (εw)
Obtain neutral axis depth with shear crack (xe)
No
Yes
Obtain shear strength (Vsu)
i ex x No
Yes
If V>Vcrack
Section analysis
Truss Mechanism
su muV V No
Yes
Incremental strain εw= εw+∆εw
w w = (Eq.(4.19))
V=Vmu
Pre-peak and post-peak
Calculate deformation components
(∆=∆f+∆s+∆p+∆f-shift)
Obtain a load-deformation response
V=Vsu
Divide the section into a number of strips
Apply compatibility condition and stress-strain relationship of materials
No
Yes
εcc= εcc+∆εc
Obtain remaining
concrete strength (f'ce)
Obtain initial neutral
axis depth (xi)
Obtain flexural
strength (Vmu=M/a)
Obtain secant
modulus (Ese)
εcc= εcc+∆εc
muV V εcc= εcc-∆εc
No
Yes
Pre-peak
Post-peak
1 1
n mP A Aci ci sj sj
i j
(Eq.(4.11))
1 1
n mM A d A dci ci i sj sj j
i j
(Eq.(4.12))
Fig. 4.12 The FSI analytical procedure

52
Ultimate Shear behavior and Modeling of Reinforced Concrete Members Jacketed by FRP and Steel
4.9. SUMMARY
In this chapter, the FSI analytical method is proposed based on both strength and deformation models.
This flexure-shear interaction (FSI) analytical method for both strength and deformation includes (i) a
shear strength model representing degradation of shear strength in post-peak region, (ii) a shear
deformation model in the plastic hinge zone in the post-peak region, (iii) a flexural strength model
considering confinement effects of transverse reinforcement and jacket, and (iv) a flexural deformation
model. The interactions include (i) neutral axis depth reduction due to shear cracking, (ii) flexural
reinforcement stress increase due to shear cracking (tension shift effect), (iii) effects of yielding of
flexural reinforcement on shear strength, and (iv) effect of concrete compression softening on shear
strength. The proposed analytical method is demonstrated to predict accurately the pre-peak and post-
peak load-deformation response, including the strain response of shear reinforcement until the ultimate
point of the rupture of non- and FRP-jacketed RC columns. This analytical method will be extended its
application in the cases of steel jacketing.
The verification of the proposed shear strength model as well as the FSI analytical method will be shown
in the next chapter, in which includes several RC members strengthened by FRP with high fracture strain
(PEN and PET), conventional fiber (AFRP and CFRP) and steel plates.

53
Ultimate Shear behavior and Modeling of Reinforced Concrete Members Jacketed by FRP and Steel
CHAPTER 5
5.
MODEL VERIFICATION
5.1. INTRODUCTION
In this chapter, the verification of proposed models is described for both RC beams and columns. The
proposed analytical approach is verified by means of a series of experiments on various cross-section of
RC beams and columns (e.g., square, rectangular and elliptical section) strengthened with and without
seismic jacketing tested under reversed cyclic loading. The parameters considered here are compressive
strength of concrete, longitudinal reinforcement ratio, transverse steel reinforcement ratio, fiber
volumetric ratio, shear-span to effective depth ratio, axial load ratio, and type of jacketing materials (e.g.,
FRP sheets and steel plate with welding connection). In the discussion part, the peak shear strength and
load-deformation responses obtained from experiments and models are compared. The proposed
confinement model is also verified in terms of load-deformation responses with and without taking into
account of confinement effect. The fracture of FRP jacketing materials such in conventional FRPs (e.g.,
CFRP) is predicted and compared with that in experiment. For steel-jacketed RC members, the
assumption that steel jacket limits the opening of shear cracks in vertical, horizontal and shear directions,
will be proved by comparing with several shape of cross-section. In addition, the ultimate deformation
defined at 80% of peak load and deformation components (e.g., flexural, shear, pull-out, and tension shit
induced deformations) are also evaluated in this chapter.
5.2. LOAD-DEFORMATION MODELS AND COMBINED RESPONSE
5.2.1. Comparison of peak shear strength from experiments and models
5.2.1.1. Beam tests
In Table 2.1, the analytical parameters are taken to estimate the shear. The analytical parameter consists
of the compressive strength of concrete (f'c) which is from the experimental observation whereas the
confined compressive strength (f'cc) is from Eq. 4.10. The other parameters are shear-span to effective-
depth ratio (a/d), the stiffness of tension reinforcement (psEs), steel tie (pwEw) and fiber (pfEf). In this study,
the shear strength components consist of shear strength contributed by concrete (Vc) and shear
reinforcement (Vs) so the verification of shear strength can separate in each component, if the data is
available.
The ultimate shear strength from the experiments [30,44] is compared with the total shear strength
(Vtotal=Vc+Vs) predicted by the proposed model. In Fig. 5.1, the Vtotal obtained from models correlates well
with the shear strength observed in the experiment with and without PET strengthening.
The experimental results tested by the authors are shown as a blue rectangular marker in all the graphs.
Starting from the comparison between calculated and experimental concrete shear strength, the results
from the experiment and model are illustrated in Fig. 5.2a. The concrete shear strength is considered
from the actual shear contribution of concrete at ultimate load. However, the experimental observations
showed the reduction of concrete shear strength after the shear crack becomes wider which leads to not
only the loss of shear force due to the aggregate inter-locking and also the decrease of concrete
compression zone. The proposed model shows a good correlation with the experimental results in terms

54
Ultimate Shear behavior and Modeling of Reinforced Concrete Members Jacketed by FRP and Steel
of concrete shear strength. In Fig. 5.2b, the shear strength carried by fiber and steel tie obtained from the
model is conservative compared with the experimental results. This is because the shear crack is assumed
to be equal to 45˚. With this assumption, the number of fiber and steel tie across the shear crack is slightly
underestimated. In fact, the inclination of the shear crack is smaller than the assumed value so the
calculated shear force shows conservative value.
Fig. 5.2 Comparison between shear strength resisted by concrete and transverse reinforcement
5.2.1.2. Column tests
To evaluate the applicability and accuracy of the FSI analytical method, experimental results of twenty
tests on RC columns failing in shear, flexure-shear and flexure were compiled. Data sets of a total of
fifteen square RC columns (denoted as SP) tested by Anggawiddjaja et al. [5-6] are used, involving
various types of FRP jackets, Aramid, PEN and PET fibers. The cross-sections of their columns are
400×400 mm2 and 600×600 mm
2. Fig. 9 shows a test setup and an example of a specimen tested by
Anggawiddjaja et al. [5-6]. Data sets of RC columns tested by Iacobucci et al. [23] are also used. In their
study, reinforced concrete square columns with insufficient shear steel reinforcement were used to
represent existing old columns designed according to old seismic specifications. Their main focus was on
y = 1.0058xR² = 0.6199
0
100
200
300
0 100 200 300
Vto
tal-te
st (k
N)
Vtotal-model (kN)
Fig. 5.1 Comparison between Vtotal from experiment and Vtotal from model
y = 0.9552xR² = 0.8177
0
100
200
300
0 100 200 300
Vc-e
xp
erim
ent
(kN
)
Vc-model (kN)
(a) Vc from experiment and Vc from model (b) Vs+f from experiment and Vs+f from model
y = 1.3863xR² = 0.6005
0
100
200
300
0 100 200 300
Vs+
f -e
xp
erim
ent (k
N)
Vs+f - model (kN)

55
Ultimate Shear behavior and Modeling of Reinforced Concrete Members Jacketed by FRP and Steel
testing RC columns with and without CFRP jacketing under lateral cyclic displacement and high axial
load ratio (P/f'coAg). Their columns are denoted as AS and ASC with a cross-section of 305×305 mm2.
Additionally, the FRP was aligned along the entire height of the specimens. The fibers were oriented
perpendicular to the longitudinal axis of the column or in the shear direction. According to the flat coupon
tensile tests [5-6,23], the fracture strains of Aramid, PEN, PET and carbon fiber composite are 4.1%,
4.5%, 13.8% and 1.26%, respectively. More data sets on plain RC columns failing in shear tested by
Saatcioglu and Ozceb [51] and by Sezen et al. [57] are used to verify the applicability of the analytical
method to typical reinforced concrete. In their study, reinforced concrete square columns are used with
varied shear steel reinforcement ratio, concrete compressive strength and axial load ratio. Their columns
are denoted as U1-U4, 2CLD12, 2CHD12, 2CVD12 and 2CLD12M with a cross-section of 350×350 mm2
and 457×457 mm2. The details of the specimens are previously shown in Table 2.2, in which column (1)
shows the specimen labels, and the types of FRP jacket, when applicable are shown in columns (2). The
material and geometry properties are shown in columns (3) to (10) in the order of shear-span to depth
ratio (a/d), unconfined concrete compressive strength (f'co), ratio of the tension reinforcement (ρs), ratio of
steel shear reinforcement (ρw), volumetric ratio of fiber reinforcement (ρf) and an axial load ratio (P/f'coAg).
The comparison of the peak shear strength obtained from experiment and models are shown in Fig. 5.3.
y = 1.0324xR² = 0.8592
0
200
400
600
800
0 200 400 600 800
Vte
st
(kN
)
Vtotal-model (kN)
CSA
CSA
y = 1.0496xR² = 0.8576
0
200
400
600
800
0 200 400 600 800
Vte
st
(kN
)
Vtotal-model (kN)
ACI 318-2002
ACI 318-2002
Fig. 5.3 Peak shear strength from experiments and various models
y = 0.6607xR² = 0.8354
0
200
400
600
800
0 200 400 600 800
Vte
st
(kN
)
Vtotal-model (kN)
JSCE 2007
JSCE 2007
y = 1.0718xR² = 0.7631
0
200
400
600
800
0 200 400 600 800
Vte
st
(kN
)
Vtotal-model (kN)
Proposed Model
Proposed model

56
Ultimate Shear behavior and Modeling of Reinforced Concrete Members Jacketed by FRP and Steel
5.2.2. Comparison of load-deformation from experiments and models
For simplicity, analytical and experimental load-deformation responses under reversed cyclic load are
shown as envelopes to the curve. The strength and deformation models were applied. Regarding the
flexural strength model, the section analysis including the confinement effect correctly predicts the load-
deformation response of the specimen failing in flexure (SP2 and SP3), as shown in Fig. 5.4, and similar
results were observed in other specimens. As shown in Fig. 5.4, the confinement effect can be clearly
seen, especially in the post-peak region.
Fig. 5.4 Load-deformation responses with and without the confinement effect
To evaluate the shear strength degradation in the post-peak region, the specimens failing in shear were
taken. Figure 5.5 shows the load-deformation response corresponding to the strength models and
experimental result of SP7, which exhibited a less brittle shear failure after yielding (see Fig. 4.4).
Fig. 5.5 Load-deformation response corresponding to the strength models and experiment
a) Specimen SP2 b) Specimen SP3
1= flexural yielding line, 2= shear yielding line, 3 = intersection line, 4 = post-peak region
Specimen SP7
Concrete shear
force (V'c-experiment)

57
Ultimate Shear behavior and Modeling of Reinforced Concrete Members Jacketed by FRP and Steel
The testing results can be considered separately in the pre-peak and post-peak regions. In the pre-peak
region, where the curves of the flexural and shear strengths do not intersect, the total shear strength (Vsu)
starts to drop after the flexural yielding point (see point 1 in Fig. 5.5). Further decrease can then be
observed after the shear reinforcement yielding point is passed (point 2). After the intersection point, the
shear strength becomes dominant, leading to a drastic decrease in load-carrying capacity. In the post-peak
region, the observed concrete shear force (V'c-experiment) is considered as the residual concrete shear
strength (Vc). The concrete shear force from experiment (V'c-experiment) is calculated by subtracting the
V's+f-value from an applied shear force (V) measured by the loading machine. The V's+f-value is obtained
from the measured value using two strain gauges, which are mounted on the steel and fiber
reinforcements. Good correlation between the concrete shear force in the post-peak region obtained from
experiment and concrete shear strength calculated from Eq. (6) can be achieved in the post-peak region.
5.2.2.1. Experimental results of Anggawiddjaja et al.
The load-deformation responses of specimens tested by Anggawiddjaja et al. [5-6] are shown in Fig. 5.6.
For specimens SP1-4, the effectiveness of Aramid, PEN and PET FRP jacket in strength and ductility
enhancement is examined, as shown in Figs. 5.6(a)-(d). The experimental results reveal that specimen
SP4 with PET FRP has a higher ductility than the PEN FRP (SP3), Aramid (SP2) and the control (SP1)
specimens. The analytical results for SP1-4 correlate well with the experimental results. The FSI
analytical method can accurately predict the behavior of specimens SP2 and SP3 failing in flexure (Mode
IV), and that of specimens SP1 and SP4 failing in brittle and less brittle shear after yielding (Mode II and
III). For flexure failure, the analytical results of specimens SP2 and SP3 show the reduction of load-
carrying capacity due to the buckling of reinforcement. For shear failure after yielding, specimens SP1
and SP4 clearly show the decrease in the load-carrying capacity at the intersection point of flexural and
shear strengths.
For specimens SP5-10, the effects of the fiber volumetric ratio (ρf) and the shear reinforcement ratio (ρw)
on the improvement of strength and ductility are examined, as shown in Figs. 5.6(e)-(j). A sudden
decrease in load-carrying capacity is observed in SP8 (the control specimen) because concrete strength
reduction due to compression softening, spall-off and reduction of reinforcement stiffness occurs
simultaneously. However, specimens jacketed by PET FRP, namely SP5, SP6, SP7, SP9 and SP10, show
higher values of both load-carrying capacity and ductility, which can be predicted by the FSI analytical
method. In specimens SP7, SP9 and SP10, the FSI analytical method can also predict the rupture of PET
fiber. Note that the rupture in the analysis means that the calculated fiber strain (ɛf) reaches the rupture
strain obtained from the fiber coupon test.
Specimens SP11 and SP12 were tested to determine the effects of column size and fiber ratio, as shown in
Figs. 5.6(k) and (l). As for these specimens, the FSI analytical method can accurately predict not only the
load-deformation response but also the rupture of PET fiber which affects the ultimate deformation.
Specimens SP13-15 were tested to investigate the effects of replacing transverse steel reinforcement with
FRP by increasing the fiber volumetric ratio and reducing web reinforcement. In Figs. 5.6(m)-(o), the
experimental and analytical results are compared, and show good agreement.

58
Ultimate Shear behavior and Modeling of Reinforced Concrete Members Jacketed by FRP and Steel
a) Specimen SP1 b) Specimen SP2 c) Specimen SP3
d) Specimen SP4 e) Specimen SP5 f) Specimen SP6
Fig. 5.6 Load-deformation responses of specimens tested by Anggawiddjaja et al. [5-6]
g) Specimen SP7 h) Specimen SP8 i) Specimen SP9
j) Specimen SP10 k) Specimen SP11 l) Specimen SP12
Breakage of fiber in experiment Breakage of fiber in analysis
Fig. 5.6 Load-deformation responses of specimens tested by Anggawiddjaja et al. (continued)
[5-6]

59
Ultimate Shear behavior and Modeling of Reinforced Concrete Members Jacketed by FRP and Steel
5.2.2.2. Experimental results of Iacobucci et al.
To verify the FSI analytical method for specimens jacketed by CFRP, the experimental and analytical
results of Iacobucci et al. [23] are compared in Figs. 5.7(a)-(e). The load-carrying capacity of specimen
AS-NS1 failing in brittle shear after yielding (Mode II) suddenly drops owing to concrete spall off and
less confinement of shear reinforcement. The proposed analytical approach overestimates the post-peak
region of the load-deformation behavior because of an overestimation of the shear strength. Moreover, the
concrete is assumed to carry 20% of the compressive strength in the softening-concrete model, whereas in
fact the cover concrete cannot carry load after its spall-off. To examine the influence of fiber ratio on the
shear strength and ductility, the retrofitted columns ASC-NS2-5 were analyzed. It can be seen that the
analytical method can accurately predict the post-peak behavior of these retrofitted columns, including the
rupture of carbon fiber.
Fig. 5.6 Load-deformation responses of specimens tested by Anggawiddjaja et al. [5-6] (continued)
Fig. 5.6 Load-deformation responses of specimens tested by Anggawidjaja et al. [6] (continued)
m) Specimen SP13 n) Specimen SP14 o) Specimen SP15
Fig. 5.6 Load-deformation responses of specimens tested by Anggawidjaja et al. [6] (continued)
m) Specimen SP13 n) Specimen SP14 o) Specimen SP15
Fig. 5.6 Load-deformation responses of specimens tested by Anggawidjaja et al. [6] (continued)
m) Specimen SP13 n) Specimen SP14 o) Specimen SP15
Fig. 5.7 Load-deformation responses of specimens tested by Iacobucci et al. [23]

60
Ultimate Shear behavior and Modeling of Reinforced Concrete Members Jacketed by FRP and Steel
5.2.2.3. Experimental results of Saatcioglu and Ozceb
To verify the FSI analytical method for plain RC columns, the experimental and analytical results of
Saatcioglu and Ozceb [51] are compared in Fig. 5.8. Specimens U1-U4 fail in brittle shear after yielding
(Mode II). The analytical approach can accurately predict the post-peak behavior of these plain RC
columns.
5.2.2.4. Experimental results of Sezen et al.
To verify the FSI analytical method for plain RC columns, the experimental and analytical results of
Sezen et al. [57] are compared in Fig. 5.9. The load-carrying capacity of Specimens 2CLD12, 2CHD12,
2CVD12 and 2CLD12M fail in less brittle shear after yielding (Mode III) are shown. The analytical
approach can accurately predict the post-peak behavior of these plain RC columns.
5.2.2.5. Experimental results of Aboutaha et al. and Priestley et al.
Steel jacketing is a more common retrofit technique than concrete jacketing. Aboutaha et al. [1] proved
that steel jacketing shows several advantages: a smaller increase in the cross-sectional dimensions, ease
and speed of construction, lower cost of structural intervention and interruption of use, and a smaller
c) Specimen U3 d) Specimen U4
Fig. 5.8 Load-deformation responses of specimens tested by Saatcioglu and Ozceb [51]
a) Specimen U1 b) Specimen U2
a) Specimen 2CLD12 b) Specimen 2CHD12 c) Specimen 2CVD12 d) Specimen 2CLD12M
Fig. 5.9 Load-deformation responses of specimens tested by Sezen et al. [57]

61
Ultimate Shear behavior and Modeling of Reinforced Concrete Members Jacketed by FRP and Steel
increase in additional stiffness to the retrofitted column. Figure 5.10 demonstrates the load-deformation
responses from the experiment carried out by Aboutaha et al. [1] and from the analytical method. With an
rectangular jacket (Specimen SC10 in Fig. 5.10(a)), the column showed subsequent improved behavior
compared to the control column (Specimen SC9 in Fig. 5.10 (b)). The steel jacket is effective in a passive
confinement. The level of lateral confinement induced in the concrete by flexible restraint as the concrete
attempts to expand laterally in the compression zone depends on the strength and stiffness of the steel
jacket. The steel jacket also resists the lateral dilation of columns associated with the development of
diagonal shear cracks. In both the case of confinement of flexural hinges or potential shear failures, the
steel jacket can be considered equivalent to a continuous steel shear reinforcement.
Figure 5.10 demonstrates the load-deformation responses from the experiment of Priestley et al. [45-46]
and from the analytical method. By encasing rectangular columns with elliptical steel jackets, as shown in
Fig. 5.10 (c)-(d), extensive tests of Priestley et al. [45-46] have established that such jackets provide
excellent enhancement of the flexural performance of inadequately confined columns. However, changing
the rectangular column section by elliptical jacketing enlarges the column section significantly, and may
not always be desirable or practical.
The overall load-deformation responses from the analytical predictions agree well with the experiment in
terms of both strengths and deformations in the cases of both with and without FRP-jacketing. In addition,
a) Specimen SC9 b) Specimen SC10
c) Specimen R1A d) Specimen R2R
Fig. 5.10 Load-deformation responses of specimens tested by Aboutaha et al [1] and Priestley et al.[45-46]

62
Ultimate Shear behavior and Modeling of Reinforced Concrete Members Jacketed by FRP and Steel
the FSI analytical method is applicable not only to FRP with high fracture strain (PET and PEN) but also
to FRP with low fracture strain (AFRP and CFRP).
5.3. COMPARISON OF CALCULATED AND MEASURED SHEAR FORCE COMPONENTS
Figure 5.10 shows comparisons of the shear force components and average shear strain obtained from
experiments and models. These experimental shear forces are taken from the peak value of each cycle of
cyclic load-deformation responses. The experimental shear force carried by transverse steel and fiber
reinforcements (V's-experiment and V'f-experiment) is obtained from strain gauges mounted on the
transverse steel and fiber reinforcements. The concrete shear force from experiment (V'c-experiment) is
calculated by subtracting the V's+f -value from the applied shear force (V). The shear force carried by the
transverse steel and fiber reinforcements as calculated from Eq. (4.39) fits well to that of the experiment,
as shown in Figs. 5.10a and 5.10b. Moreover, good correlation between the concrete shear force predicted
from Eq. (4.40) and that in the experiment is demonstrated in Fig. 5.10c. The average shear strains
obtained from the experiment and calculated from Eq. (4.19) are compared, and show good agreement as
shown in Fig. 5.10d.
5.4. COMPARISON OF DEFORMATION COMPONENTS FROM EXPERIMENTS AND
MODELS
The predicted ultimate deformation of the specimens shown in Table 1 agrees well with the experimental
ultimate deformation, as shown in Fig. 5.11. The ultimate deformation state occurs when the deformation
a) V's-experiment and V's-model
c) V'c-experiment and V'c-model d) -experiment and -model in (Eq. (4.19))
Fig. 5.10 Comparisons of the shear force components and average shear strain obtained
from experiments and models
y = 0.8738xR² = 0.7911
0
100
200
300
400
500
600
0 100 200 300 400 500 600
V's
Exp
erim
en
t (kN
)
V's Model (kN)
b) V'f-experiment and V'f-model
y = 0.9864xR² = 0.8738
0
100
200
300
400
500
600
0 100 200 300 400 500 600
V'f E
xp
erim
en
t (kN
)
V'f Model (kN)

63
Ultimate Shear behavior and Modeling of Reinforced Concrete Members Jacketed by FRP and Steel
reaches the region where the remaining load-carrying capacity becomes lower than the yield load, as
stated in the JSCE seismic specification [28].
The calculated deformation components of the total deformation at the ultimate deformation agree well
with that of the experimental deformation results, as shown by the example of SP5 in Fig. 5.12. It can be
seen that the early-stage shear deformation gives a small contribution to the total deformation. After the
onset of shear cracking, shear deformation increased significantly. At the ultimate state of the column, the
increases in the shear deformation as well as an additional deformation due to the tension shift are
significant and should not be neglected. It is evident that the contribution of shear deformations to the
total deformations can be significant, especially in RC columns with insufficient transverse steel
reinforcement. For instance, the contribution of shear deformation to the total deformation of Specimen
SP5 [5-6] significantly increases with increasing deformations as a result of further shear cracking, while
inducing an additional deformation due to the tension shift, as shown in Fig. 5.12. Shear deformation after
yielding based on the strut angle models is shown in Fig. 5.13.
Fig. 5.11 Ultimate deformation of experiment and analysis
Anggawiddjaja et al. [5-6]
Iacobucci et al. [23]
Saatcioglu and Ozceb [51]
Sezen et al. [57]
Fig. 5.12 Deformation components of specimen SP5

64
Ultimate Shear behavior and Modeling of Reinforced Concrete Members Jacketed by FRP and Steel
5.5. SUMMARY
An accurate prediction method for load and deformation is necessary to ensure the safety of structures.
This chapter aimed to develop an analytical method that can precisely predict not only the strength but
also the deformation capacity of reinforced concrete columns with and without FRP-jacketing. In
summary, the proposed flexure-shear interaction (FSI) analytical method can successfully predict the
load-deformation envelope responses of RC columns with and without FRP-jacketing. The flexural
strength model meshes with the shear strength model through the neutral axis depth of the shear crack
region, whereas the shear strength model meshes with the flexural strength model through the yielding of
reinforcement and effective concrete strength. In specimens failing in shear, the reduction in load-
carrying capacity with increase in deformation can be considered as a reduction of the contribution of the
shear strength behavior caused by the reduction in secant stiffness of both shear and flexural
reinforcements and residual concrete strength. However, in specimens failing in flexure, the load-carrying
capacity decreases due to concrete crushing along with the buckling of the compression reinforcement.
The influence of the shear strength behavior on the flexural deformation is introduced through the tension
shift phenomenon which increases the flexural deformation. Meanwhile, the flexural strength behavior
affects the shear deformation through the yielding of flexural reinforcement, which decreases the shear
strength of concrete and also increases the shear reinforcement strain, causing the increase of the shear
deformation. The proposed analytical methods can successfully evaluate the advantage of PET FRP with
high fracture strain over conventional FRPs with low fracture strain (e.g., CFRP and AFRP). RC
members strengthened by PET FRP have higher strength and deformability whereas RC members
strengthened with CFRP and AFRP have high strength but lower deformability. In addition, the FSI
analytical methods successfully predict shear strength of RC members jacketed by both FRP sheets and
steel plate. This validates the assumption that steel jacket limits the opening of shear cracks in vertical,
horizontal and shear directions, whereas FRP jacket can resist the shear crack opening only along the
fiber alignment. The proposed analytical method is applicable for RC members with normal strength of
concrete, the axial loading ratio range 0-0.65, shear-span to effective-depth ratio of 2.0-4.5, and jacketed
with FRP or steel plates. More details of available range will be discussed in the next Chapter.
0
5
10
15
0 5 10 15
∆sh
ear-e
xp
eri
me
nt (
mm
)
∆shear - model (mm)
y = 0.748xR2 = 0.545
y = 0.9955xR² = 0.3569
20
30
40
50
60
20 30 40 50 60
Str
ut
an
gle
-e
xp
eri
me
nt
Strut angle - model
a) Shear deformation of experiment and model b) Compression strut angle of experiment and model
Fig. 5.13 Shear deformation after yielding

65
Ultimate Shear behavior and Modeling of Reinforced Concrete Members Jacketed by FRP and Steel
CHAPTER 6
6.
CONCLUSIONS AND FUTURE CONCERN
6.1. CONCLUSIONS
6.1.1. Observed behavior of test specimens and evaluation of experimental data
An experimental program involving tests on ten RC beams strengthened in shear with fully wrapped LRS
PET FRP sheets has been conducted. The test parameters include the strengthening ratio, the longitudinal
reinforcement ratio as well as the shear-span to effective-depth ratio. The following conclusions can be
drawn from the test results:
(1) PET FRP sheets with a large rupture strain can be used to enhance the shear strength of RC beams
while substantially increasing the member ductility. In particular, PET FRP sheets did not rupture at
the peak load and led to a ductile shear failure of the strengthened RC members. This failure mode
also enabled us to clearly observe the behavior of shear strength degradation of concrete with the
increase of shear deformation until the rupture of PET FRP sheets.
(2) The increase of amount of PET FRP sheets led to an increase of the shear strength and shear ductility
whereas a lower longitudinal reinforcement ratio and a smaller shear-span to effective-depth ratio
corresponded to improved shear ductility.
(3) PET FRP sheets developed very high strains; namely the maximum strains of 1.4-6.0% at the peak
shear loads and as high as 15.0% at the termination of tests,.
(4) The initiation of the degradation of the shear contribution of concrete occurred even before the peak
strength was developed in PET FRP-strengthened RC members. The shear contribution of concrete
was found to degrade by 0-54.6% depending on the volumetric ratio of FRP sheets, the shear-span to
effective-depth ratio and the member depth. This degradation of concrete contribution to shear
strength is eligible in the case of no axial loading for the current study.
6.1.2. Analytical methods
An accurate prediction method for load and deformation is necessary to ensure the safety of structures.
This research aimed to develop an analytical method that can precisely predict not only the strength but
also the deformation capacity of reinforced concrete columns with and without FRP-jacketing. The
findings of this study can be summarized as follows:
1) The proposed flexure-shear interaction (FSI) analytical method can successfully predict the load-
deformation envelope responses of RC columns with and without FRP-jacketing. The flexural
strength model meshes with the shear strength model through the neutral axis depth of the shear crack
region, whereas the shear strength model meshes with the flexural strength model through the
yielding of reinforcement and effective concrete strength.
2) In specimens failing in shear, the reduction in load-carrying capacity with increase in deformation can
be considered as a reduction of the contribution of the shear strength behavior caused by the reduction
in secant stiffness of both shear and flexural reinforcements and residual concrete strength. However,

66
Ultimate Shear behavior and Modeling of Reinforced Concrete Members Jacketed by FRP and Steel
in specimens failing in flexure, the load-carrying capacity decreases due to concrete crushing along
with the buckling of the compression reinforcement.
3) The influence of the shear strength behavior on the flexural deformation is introduced through the
tension shift phenomenon which increases the flexural deformation. Meanwhile, the flexural strength
behavior affects the shear deformation through the yielding of flexural reinforcement, which
decreases the shear strength of concrete and also increases the shear reinforcement strain, causing the
increase of the shear deformation.
4) Steel jacket limits the opening of shear cracks in vertical, horizontal and shear directions. However,
FRP jacket can resist the shear crack opening in uni-direction occurring only along the fiber
alignment.
The FSI analytical method can precisely predict the strain response of shear reinforcement, including the
rupture of the FRP jackets. It is proven that FRP with high fracture strain (PEN and PET) is less likely to
fracture than conventional fiber (AFTP and CFRP) at ultimate deformation.
6.1.3. Applicable range of the proposed analytical methods
Since RC specimens used to develop models in this current research were tested under limited condition
and some parameters, the applicable range of the proposed FSI analytical method for predicting the load-
deformation responses should be addressed as follows:
1) The shear strength model can be applied in only RC members with normal concrete compressive
strength (f'c<50MPa). Currently, the advancement of material technology and production has led to
higher grades of concrete strengths such as High strength Concrete (HSC). However, HSC is not
considered in the current shear strength model.
2) The axial load ratio is one of the important factors for shear strength of RC columns. In the current
shear strength model, the specimens used for developing models are subjected to the constant axial
load ratio (P/Agf'c) in range 0–0.65.
3) The member's shear span is considered by use of the shear-span to effective-depth ratio (a/d). It is
imperative to address that shear span length of RC members are in the range of normal beams or
columns in the current study. Therefore, the a/d-value is in range 2.0–4.5. This means slender and
short RC members (e.g. long or short columns) are not included.
4) The application of the current model is limited to the strengthening of undamaged concrete because of
the lack of experimental observation of strengthening of damaged concrete. The damaged RC
members here are referred to those members exposed in the harsh environment such as chloride attack.
5) The analytical method can predict RC members subjected to monotonic flexure-shear loading. To
predict the behavior of RC members subjected to the reversed cyclic loading, the FSI analytical
method is extended to RC members under cyclic loading. The cyclic loads were applied horizontally
to the member's axis with constant axial loading. The displacement was controlled at the top of the
specimens. The reversed cycle was applied when longitudinal reinforcement at the bottom of the pier
yielded, considered as flexural yielding displacement (y), and the corresponding load was yielding
load (Py). Therefore, this type of push-pull loading was applied in all specimens.

67
Ultimate Shear behavior and Modeling of Reinforced Concrete Members Jacketed by FRP and Steel
6.2. FUTURE CONCERN
To have a further completeness of the present study or to formulate direct guidelines on retrofitting design
and material selections in retrofitting and strengthening applications, the following issues should be
concerned:
1) The use of High strength Concrete (HSC) elements (f'c>50MPa) for concrete structures has become
common in building owing to several advantages of HSC in earthquake resistant structures. Generally,
concrete structures are inherently heavy, and hence induce substantial inertial forces. High strength
concrete members will have the distinct advantage of reducing these inertial forces by reducing
member's sizes. Higher elastic modulus will reduce the drift due to lateral load. Other aspects relevant
to high strength concrete members are discussed in the next section. High strength concrete is
structurally a different material and rules applicable to normal strength concrete are not always
conservative when applied to high strength concrete because of their different in fracture modes and
microstructure. Therefore, current shear strength model, originally intended for concrete strengths (f'c
<50MPa), needs to be re-evaluated for HSC in the future.
2) The axial load can represent the weight of superstructures (e.g. bridge decks and bridge slabs) on RC
columns or bridge piers. During major earthquakes, the axial loads are varied owing to level ground
shaking. Therefore, the inconstant axial load should be concerned to ensure that the RC columns can
carry weight of superstructures.
3) The shear-span to effective-depth ratio (a/d) significantly influences to shear behavior of RC
members. Slender RC members are always dominated by flexural strength behavior, whereas short
(or deep) RC members are usually dominated by shear strength behavior. As a result, RC members
with different a/d-value entirely exhibit dissimilar failure modes, depending on the range of the a/d-
value. Hence, wider range of a/d-value should be extended to demonstrate more precise behaviors of
RC members subjected to seismic loads.
4) Generally, RC members exposed to severe environments such as chloride attack are often deteriorated,
leading to reduction of their life cycle. Their damaging effects due to exposure environment should be
evaluated before seismic strengthening in order to improve the prediction of their seismic
performance. Future study for this issue will aim to clarify the effect of chloride attack prior seismic
strengthening. One of the deteriorations is the reduction of steel reinforcement's area because of
corrosion. This project will be cooperated with the research group in Zhejiang University, China.
5) During serious seismic events, behaviors of RC structures subjected to reversed cyclic loading depend
on a loading speed or strain increment rate, known as a loading history. This loading speed
significantly influences the material properties of RC structures and their behaviors, especially in
seismic loading. Therefore, the current study is successfully satisfied in the cases of RC structures
under static loading precisely. However, it has been confirmed experimentally that the behavior
under static loading is similar to that under seismic loading. In the cases of seismic loading, the
influence of load history on material behaviors can be investigated by applying different number of
cycles, as shown in Fig. 6.1. This shows different number of loading histories, representing various
ground shaking accelerations. For RC structures loaded under less number of cycles in each peak
loading history (Fig. 6.1a), the ultimate deformation reaches much later whereas, for RC structures

68
Ultimate Shear behavior and Modeling of Reinforced Concrete Members Jacketed by FRP and Steel
loaded under more number of cycles in each peak loading history (Fig. 6.1b), the ultimate
deformation can reach earlier. Considering each peak loading history, the damages due to higher
number of cycles are more serious than that due to lower number of cycles. It is worthwhile
mentioning here that the various types of loading histories should be further investigated to ensure the
damage level of RC structures under seismic loading.
6) For seismic strengthening, there are several materials commonly used to improve seismic
performance such as FRP, steel, concrete and cementitious materials. To justify the most appropriate
material for seismic strengthening, other alternative materials, besides FRP and steel plates, should be
investigated extensively. Finally, the comparison between alternative materials to help engineers
select appropriate materials for construction.
In addition, the validity of the proposed analytical method should be extended to more case studies. The
current analytical method and computer programming developed in this research will be world widely
opened to other researchers in order to permit more investigation of this analytical method. In the future,
the analytical programs will be uploaded.
Fig. 6.1 Variation of loading history
a) Less number of cycles
b) More number of cycles
n cycle
-20
-15
-10
-5
0
5
10
15
20
0 10 20 30 40 50 60 70 80 90 100
Dis
pla
cm
en
t (Δ
/Δy)
Number of cycle
-20
-15
-10
-5
0
5
10
15
20
0 10 20 30 40 50 60 70 80 90 100
Dis
pla
cm
en
t (Δ
/Δy)
Number of cycle

69
Ultimate Shear behavior and Modeling of Reinforced Concrete Members Jacketed by FRP and Steel
REFERENCES
[1] Aboutaha, R. S., Engelhardt, M. D., Jirsa, J. O., and Kreger, M. E. (1999). “Rehabilitation of shear
critical concrete columns by use of rectangular steel jackets.” ACI Structural Journal, 96(1), 68-78.
[2] ACI Committee 318. (2005). “Building code requirements for structural concrete (ACI 318-05).”
American Concrete Institute, Farmington Hills, MI, USA.
[3] ACI Committee 440. (2002). “Guide for the design and construction of externally bonded FRP
systems for strengthening concrete structures.” American Concrete Institute, Farmington Hills, MI,
USA.
[4] Alsiwat, J. M., and Saatcioglu, M. (1992). “Reinforcement anchorage slip under monotonic loading.”
Journal of Structural Engineering, 118(9), 2421-2438.
[5] Anggawidjaja, D., Ueda, T., Dai, J., and Nakai, H. (2006). “Deformation capacity of RC piers
wrapped by new fiber-reinforced polymer with large fracture strain.” Journal of Cement and
Concrete Composites, 28(10), 914-927.
[6] Anggawidjaja, D., and Ueda, T. (2009). “PET, high fracturing strain fiber, for concrete structure
retrofitting: shear force and deformation enhancement: experiments, analysis and model.” VDM
Verlag Dr. Müller, Germany, 1-64.
[7] Bai, Y.L., Dai, J.G. and Teng, J.G. (2013). “Cyclic compressive behavior of concrete confined with
large rupture strain FRP composites.” Journal of Composites for Construction, ASCE (Accepted for
publications)
[8] Bakis, C. E., Bank, L. C., Brown, V. L., Cosenza, E., Davalos, J. F., Lesko, J. J., Machida, A.,
Rizkalla, S. H., and Triantafillou, T. C. (2002). “Fiber-reinforced polymer composites for
construction-state-of-the-art review.” Journal of Composites for Construction, ASCE, 6(2), 73-87.
[9] Bentz, E. C., Vecchio, F. J., and Collins, M. P. (2006). “Simplified modified compression field
theory for calculating shear strength of reinforced concrete elements.” ACI Structural Journal,
103(4), 614.
[10] Branson, D. E. (1968). “Design procedures for computing deflections.” ACI Journal Proceedings,
65(9), 730-742.
[11] Canadian Standards, A. (2004). “Design of Concrete Structures (CSA-A23. 3-04).” Mississauga,
Ontario, 1-214.
[12] CEB-FIP Model Code 90. (1993). Design code. Thomas Telford, London.
[13] Chaallal, O., Nollet, M. J., and Perraton, D. (1998). “Strengthening of reinforced concrete beams
with externally bonded fiber-reinforced-plastic plates: Design guidelines for shear and flexure.”
Canadian Journal of Civil Engineering, 25(4), 692-704.
[14] Dai, J. G., Bai, Y.L. and Teng, J.G. (2011), “Behavior and modeling of concrete confined with FRP
composites of large deformability.” Journal of Composites for Construction, ASCE, 15(6), 963-973.
[15] Dai, J.G., Lam, L., and Ueda, T. (2012). “Seismic retrofit of square RC columns with polyethylene
terephthalate (PET) fibre reinforced polymer composites.” Journal of Construction and Building
Materials, 27(1), 206-217.
[16] Dai, J. G. and Ueda, T. (2012). “Strength and deformability of concrete members wrapped with fibre
reinforced polymer composites with a large rupture strain.” Journal of Innovative Materials and
Techniques in Concrete Construction, 14, 225-241.
[17] Dhakal, R. P., and Maekawa, K. (2002). “Modeling for postyield buckling of reinforcement.”
Journal of Structural Engineering, 128(9), 1139-1147.

70
Ultimate Shear behavior and Modeling of Reinforced Concrete Members Jacketed by FRP and Steel
[18] Debernardi, P. G., and Taliano, M. (2006). “Shear deformation in reinforced concrete beams with
thin web.” Magazine of Concrete Research, 58(3), 157-171.
[19] Elwood, K. J., and Eberhard, M. O. (2009). “Effective stiffness of reinforced concrete columns.”
ACI Structural Journal, 106(4).
[20] FIB. (2001). “Externally Bonded FRP Reinforcement for RC Structures,” The International
Federation for Structural Concrete.” Lausanne, Switzerland.
[21] Hines, E. M., Restrepo, J. I., and Seible, F. (2004). “Force-displacement characterization of well-
confined bridge piers.” ACI Structural Journal, 101(4), 537-548.
[22] Hsu, T. T. C. (1988). “Softened truss model theory for shear and torsion.” ACI Structural Journal,
85(6), 624-635.
[23] Iacobucci, R. D., Sheikh, S. A., and Bayrak, O. (2003). “Retrofit of square concrete columns with
carbon fiber-reinforced polymer for seismic resistance.” ACI Structural Journal, 100(6), 785-794.
[24] Ito, A., Aoki, Y., and Hashimoto, S. (2002). “Accurate extraction and measurement of fine cracks
from concrete block surface image.” Proceeding of 28th Annual Conference of the Industrial
Electronics Society, Industrial Electronics Society, 3(1), 2202-2207.
[25] Japan Society of Civil Engineers (JSCE). (2001). “Recommendations for upgrading of concrete
structures with use of continuous fiber sheets.” Japan Society of Civil Engineers, Tokyo, 41.
[26] Japan Society of Civil Engineers (JSCE). (2002). “Test method for tensile properties of continuous
fiber sheets.” Japan Society of Civil Engineers, JSCE-E541-2000.
[27] Japan Society of Civil Engineers (JSCE) Series 41. (2007). “Standard specification for concrete
structures - structural performance verification.” Japan Society of Civil Engineers, Tokyo.
[28] Japan Society of Civil Engineers (JSCE) Series 5. (2007). “Standard specification for concrete
structures - seismic performance verification.” Japan Society of Civil Engineers, Tokyo.
[29] Jaqin, H., Nakai, H., Ueda, T., Sato Y., and Dai, J. (2005). “Seismic retrofitting of RC piers using
continuous fiber sheet with large fracturing strain.” Journal of Structural Engineering, JSCE, 51A ,
893–902.
[30] Jirawattanasomkul, T., Ikoma, Y., Zhang D., and Ueda, T. (2011) “Shear strength of reinforced
concrete members strengthened with FRP jacketing.” Proceedings of Japan Concrete Institute,
Japan Concrete Institute, 33(2), 991-996.
[31] Karbhari, V. M., and Zhao, L. (2000). “Use of composites for 21st century civil infrastructure.”
Computer Methods in Applied Mechanics and Engineering, 185(2-4), 433-454.
[32] Kuchma, D., Yindeesuk, S., Nagle, T., Hart, J., and Lee, H. H. (2008). “Experimental validation of
strut-and-tie method for complex regions.” ACI Structural Journal, 105(5), 578-589.
[33] Lechat, C., Bunsell, A. R., and Davies, P. (2011). “Tensile and creep behavior of polyethylene
terephthalate and polyethylene naphthalate fibres.” Journal Material Science, 46(2), 528–533.
[34] Maekawa, K., and An, X. (2000). “Shear failure and ductility of RC columns after yielding of main
reinforcement.” Engineering Fracture Mechanics, 65(2-3), 335-368.
[35] Mander, J. B., Priestley, M. J. N., and Park, R. (1988). “Theoretical Stress-strain Model for Confined
Concrete.” Journal of Structural Engineering, 114(8), 1804-1826.
[36] Markeset, G., and Hillerborg, A. (1995). “Softening of concrete in compression - Localization and
size effects.” Cement and Concrete Research, 25(4), 702-708.
[37] Massone, L. M., and Wallace, J. W. (2004). “Load-deformation responses of slender reinforced
concrete walls.” ACI Structural Journal, 101(1), 103-113.

71
Ultimate Shear behavior and Modeling of Reinforced Concrete Members Jacketed by FRP and Steel
[38] Mostafaei, H., and Kabeyasawa, T. (2007). “Axial-shear-flexure interaction approach for reinforced
concrete columns.” ACI Structural Journal, 104(2), 218-226.
[39] Mostafaei, H., and Vecchio, F. J. (2008). “Uniaxial shear-flexure model for reinforced concrete
elements.” Journal of Structural Engineering, ASCE, 134(9), 1538-1547.
[40] Ozcebe, G., and Saatcioglu, M. (1989). “Hysteretic shear model for reinforced concrete members.”
Journal of Structural Engineering, 115(1), 132-148.
[41] Park, H. G., Yu, E. J., and Choi, K. K. (2012). “Shear-strength degradation model for RC columns
subjected to cyclic loading.” Engineering Structures, 34, 187-197.
[42] Park, J. W., and Kuchma, D. (2007). “Strut-and-tie model analysis for strength prediction of deep
beams.” ACI Structural Journal, 104(6), 657-666.
[43] Pesic, N., and Pilakoutas, K. (2005). “Flexural analysis and design of reinforced concrete beams
with externally bonded FRP reinforcement.” Materials and Structures, 38(2), 183-192.
[44] Placas, A., and Regan, P. E. (1971). “Shear failure of reinforced concrete beams.” ACI Journal
Proceedings, 68(10), 763-773.
[45] Priestley, M. J. N., Seible, F., Xiao, Y., and Verma, R. (1994). “Steel jacket retrofitting of reinforced
concrete bridge columns for enhanced shear strength-Part 1: Theoretical considerations and test
design.” ACI Structural Journal, 91(4), 394-405.
[46] Priestley, M. J. N., Seible, F., and Xiao, Y. (1994). “Steel jacket retrofitting of reinforced concrete
bridge columns for enhanced shear strength--Part 2: Test results and comparison with theory.” ACI
Structural Journal, 91(5), 537-551.
[47] Priestley, M. J. N., Verma, R., and Xiao, Y. (1994). “Seismic shear strength of reinforced concrete
columns.” Journal of Structural Engineering, ASCE, 120(8), 2310-2327.
[48] Priestley, M. J. N. (2000). “Performance-based seismic design.” Keynote Address, Proceeding of
12th World Conference on Earthquake Engineering, Auckland, New Zealand, 1-22.
[49] Priestley MJN, Calvi GM, Kowalsky MJ. (2007). “Direct displacement-based seismic design of
structures”, IUSS Press, Pavia, Italy.
[50] Qi, C., Weiss, J., and Olek, J. (2003). “Characterization of plastic shrinkage cracking in fiber
reinforced concrete using image analysis and a modified Weibull function.” Materials and
Structures, 36(6), 386-395.
[51] Saatcioglu, M., and Ozcebe, G. (1989). “Response of reinforced concrete columns to simulated
seismic loading.” ACI Structural Journal, 86(1), 3-12.
[52] Sato, Y., Ueda, T., and Kakuta, Y. (1997). “Shear strength of reinforced and prestressed concrete
beams with shear reinforcement.” Concrete Library International of JSCE, 29, 233-247.
[53] Sato Y, Ueda T, Kakuta Y. “Shear resisting model of reinforced and prestressed concrete beams
based on finite element analysis. Bulletin of the Faculty of Engineering, Hokkaido University, No
171. 1994:1-17.
[54] Sato Y, Ueda T, Kakuta Y. (1996). “Shear strength of prestressed concrete beams with FRP tendon.
Concrete Library of JSCE, 27, 189-208.
[55] Seible, F., Priestley, M. J. N., Hegemier, G. A., and Innamorato, D. (1997). “Seismic retrofit of RC
columns with continuous carbon fiber jackets.” Journal of Composites for Construction, ASCE, 1(2),
52-62.
[56] Senda, M. and Ueda, T. (2008). “Experimental study on shear strengthening by continuous fiber
with high fracturing strain.” Proceedings of the Concrete Structure Scenarios, JSMS, 8, 249-256 (in
Japanese).

72
Ultimate Shear behavior and Modeling of Reinforced Concrete Members Jacketed by FRP and Steel
[57] Sezen, H., and Moehle, J. P. (2004).“Shear strength model for lightly reinforced concrete columns.”
Journal of Structural Engineering, 130(11), 1692-1703.
[58] Sezen, H., and Setzler, E. J. (2008). “Reinforcement slip in reinforced concrete columns.” ACI
Structural Journal, 105(3), 280-289.
[59] Shima, H., Chou, L.-L., and Okamura, H. (1987). “Micro and macro models for bond in reinforced
concrete.” Journal of the Faculty of Engineering, University of Tokyo, 39(2), 133-194.
[60] Sigrist, V. (2011). “Generalized Stress Field Approach for Analysis of Beams in Shear.” ACI
Structural Journal, 108(4), 479-487.
[61] Sirbu, G., Ueda, T., and Kakuta, Y. (2001). “A study on shear resisting mechanism of RC columns
strengthened with carbon fiber sheets.” Journal of Structural Engineering, JSCE, 47(3), 1289-1298.
[62] Susantha, K. A. S., Ge, H., and Usami, T. (2001). “Uniaxial stress-strain relationship of concrete
confined by various shaped steel tubes.” Engineering Structures, 23(10), 1331-1347.
[63] Tumialan, G., Nanni, A., Ibell, T., and Fukuyama, H. (2002). “FRP composites for strengthening
civil infrastructure around the world." Sampe Journal, 38(5), 9-15.
[64] Ueda, T., Pantaratorn, N., and Sato, Y. (1995). “Finite element analysis on shear resisting
mechanism of concrete beams with shear reinforcement.” Proceedings-Japan Society of Civil
Engineers, 273-286.
[65] Ueda, T., Sato, Y., Ito, T., and Nishizono, K. (2002). “Shear deformation of reinforced concrete
beam.” Journal of Materials, Concrete Structures and Pavements, JSCE, 711(56), 205-215.
[66] Ueda, T., (2009). “Seismic application of sustainable fiber material.” Proceedings of US-Japan
Workshop. US-Japan Workshop on Life Cycle Assessment of Sustainable Infrastructure Materials,
Sapporo, Japan, October, 1-9.
[67] Vecchio, F. J., and Collins, M. P. (1986). “The modified compression-field theory for reinforced
concrete elements subjected to shear.” ACI Journal, 83(2), 219-231.
[68] Vecchio, F. J. (1989). “Nonlinear finite element analysis of reinforced concrete membranes.” ACI
Structural Journal, 86(1), 26-35.
[69] Wang, Y. C., and Restrepo, J. I. (2001). “Investigation of concentrically loaded reinforced concrete
columns confined with glass fiber-reinforced polymer jackets.” ACI Structural Journal, 98(3), 377-
385.
[70] Wang, Y. C. (2003). “Analytical and experimental study on seismic performance of RC T-beams
with design deficiency in steel bar curtailment.” Engineering Structures, 25(2), 215-227.
[71] Xu, S. Y., and Zhang, J. (2012). “Axial-shear-flexure interaction hysteretic model for RC columns
under combined actions.” Engineering Structures, 34, 548-563.

73
Ultimate Shear behavior and Modeling of Reinforced Concrete Members Jacketed by FRP and Steel
APPENDIX A
Calculation of shear contribution
According to JSCE specifications, JSCE 2001; JSCE 2007 [23,25], total shear strength (νt) consists of the
contribution to shear strength due to concrete (νc), transverse steel reinforcement (νs) and FRP sheet (νf).
t c s f (A-1)
The concrete and transverse steel contributions to shear strength can be calculated as follows:
43 40.20 1000/ 100c c wf d (A-2)
sin cos / /s w wy s s sA f s z bd (A-3)
where fʹc is compressive strength of concrete; b is width of member, d is effective depth of member; ρw is
ratio of transverse steel reinforcement; Aw is cross-sectional area of transverse steel reinforcement; fwy is
yielding strength of transverse reinforcement; αs is angle of transverse steel reinforcement to the
member's axis; and z is d/1.15.
The shear contribution provided by FRP sheet is its tensile capacity and is computed based on the shear
reinforcing efficiency of the FRP sheet (K) as shown in Eq. (A-4).
sin cos / /f f fu f f fK A f s z bd
(A-4)
where 1.68 0.67K R in which 0.4 0.8K and 1/ 4 2/3 1/3
/ 1/f f fu f cR E f E f in which
0.5 2.0R ; Af is cross-sectional area of the FRP sheet; ffu is design tensile strength of the FRP sheet
(N/mm2); sf is spacing of the FRP sheet; Ef is modulus of elasticity of the FRP sheet (kN/mm
2); ρf is
volumetric ratio of the FRP sheet; and αf is angle of the FRP sheet to the member axis.