uk/us exchange rate - welcome to the babson...
TRANSCRIPT
BABSON COLLEGE
UK/US Exchange Rate A study examining a set of financial and economic
variables that could influence the UK/US exchange rate
Eveline Dang
Anushka Doshi
Apurv Jhawar
Hanson So
“I pledge my honor that I have neither received nor provided any unauthorized assistance during the
completion of this work.”
“The authors of this paper hereby give permission to Professor Michael Goldstein to distribute this paper
by hard copy, to put it on reserve at Horn Library at Babson College, or to post a PDF version of this
paper on the internet.”
1
Table of Contents
Executive Summary
2
Introduction
3
Models and Analysis
3
-Data Selection
3
-Relationship of Interest Rate with Exchange Rate
4
-Relationship of Consumer Price Index with Exchange Rate
6
-Relationship of Gold Price with Exchange Rate
8
-Relationship of Crude Oil Price with Exchange Rate
9
- Relationship between Stock Markets and Exchange Rates
9
Methodology
10
-Further Study
10
Model 1A and 1B
11
-Model 1A
11
-Model 1B
14
Model 2A and 2B
16
-Model 2A
17
-Model 2B
17
Model 3
19
Works Cited
23
Exhibits 25

2
EXECUTIVE SUMMARY
The United States of America and the United Kingdom have had strong relationships even
before the Bretton Woods System was abandoned. Exchange rates and interest rates have been
used as mechanisms to influence each country’s economic monetary policy. Throughout this
paper, we discuss various variables that could impact the US/UK exchange rate and examine
such relationships by generating regression models. Studying past researches has led us to a
selection of eight variables: US treasury rate, UK treasury rate, US CPI, UK CPI, Gold Price,
Crude Oil Price, S&P 500 Change and FTSE 100 Change. We attempted to test the effect of
short-term and long-term treasury rates on the exchange rate by using 3-month T-Bill for both
countries in one model and 10-year treasury rates for both countries in another model, while
benchmarking the rest of the variables. The models show that long-term treasury rates tend to
display a better relationship with exchange rates. Commodity prices in general have an influence
on the direction of exchange rates’ movement. It also seems that exchange rates move in the
inverse direction with gold price and demonstrate a positive relationship with crude oil price. In
addition, the models imply that stock indices do not impact exchange rates.
We then ran a regression model for the errors between the observed and calculated exchange
rates (from the uncovered interest rate parity) against all the independent variables to see if any
variables were significantly contributing to the error. Most notably, it dawns on us that treasury
rates, whether short-term or long-term, can be used to explain the errors between the value of
exchange rates in theory and in reality. This is a result of arbitrage involved with investing
activities.
We also built an additional model to forecast exchange rates using an autoregression method.
We have found that our model functions fairly well in terms of forecasting exchange rate returns
of 1-steo horizon ahead. Given forecasting exchange rate returns of several months ahead, it is
unlikely that the model will be valid.

3
INTRODUCTION
The United States and the United Kingdom have shared a rich history. Post the revolutionary
war, which was a conflict between the two nations’ different ideologies and interests, the Jay
Treaty was signed in 1794. This peace treaty began the trade relationship between the United
States and the United Kingdom. Even though this treaty favored the British more than the
Americans in terms of trade, it was the first initiative taken by both nations to establish a brighter
trading future1. Since that moment, both nations have gone on making breakthroughs in the fields
of finance, R&D, arts and science, defense and many more sectors by working together. Today,
the trading relationship between the US and the UK has reached about one trillion dollars, having
almost two million expats in combined employment between the nations2. With the collapse of
the Bretton Woods system in 1971, many countries started holding US currency as a method of
holding foreign currency reserves. At that time, the UK discontinued its fixed exchange scheme
and decided to freely float its currency. Ever since then, the relationship between the US and UK
currency has become a subject of interest for several researchers3.
Moving onto the present early in November 2013, the Bank of England (BOE) mentioned
that they were thinking of raising interest rates earlier than planned. Though BOE representatives
reasoned that this plan was taken into consideration due to growing economy and declining
unemployment, such plan could possibly be interpreted as a response of the UK to the
expectation that US quantitative easing would no longer work in the near future. BOE’s initiative
in terms of interest rates is most likely an attempt to maintain the current exchange rate between
the UK and the US. The removal of quantitative easing would cause US interest rates to move
upward, and in order to have the US/UK exchange rates remained unchanged, the UK interest
rates would need to be increased.
MODEL AND ANALYSIS
Data Selection
1 http://history.state.gov/milestones/1784-1800/jay-treaty
2 http://ukustrade.com/
3 http://www.nber.org/chapters/c6876.pdf
4
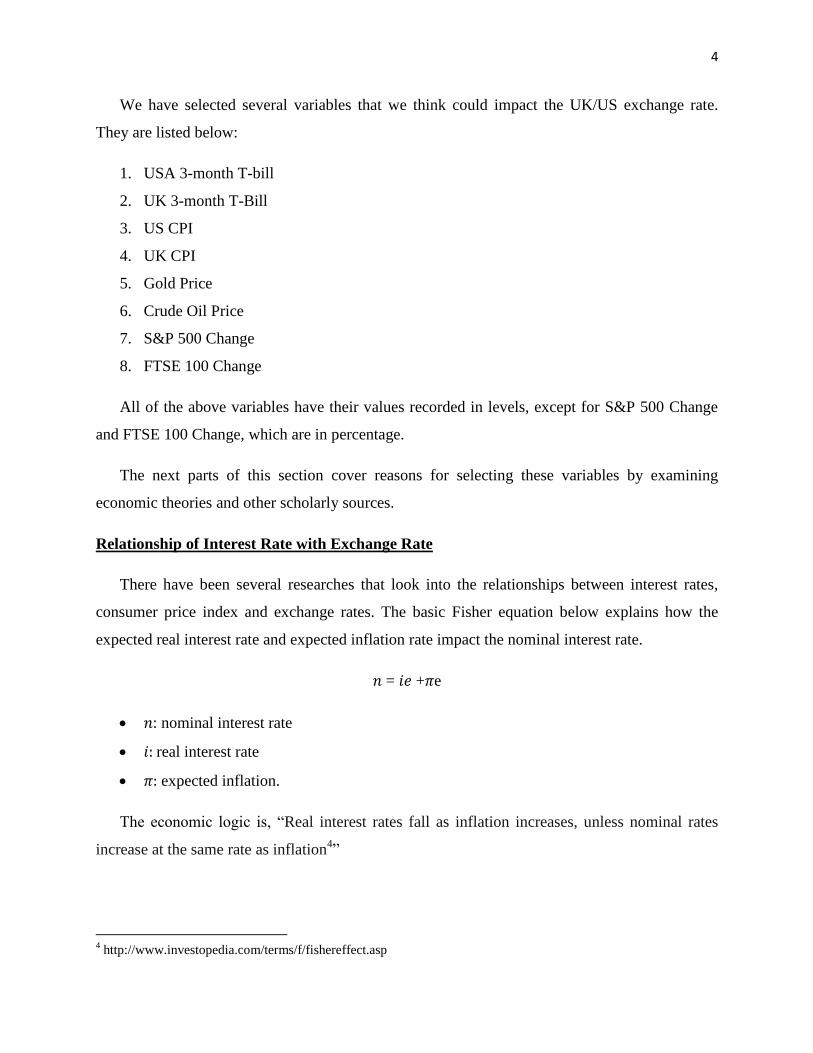
We have selected several variables that we think could impact the UK/US exchange rate.
They are listed below:
1. USA 3-month T-bill
2. UK 3-month T-Bill
3. US CPI
4. UK CPI
5. Gold Price
6. Crude Oil Price
7. S&P 500 Change
8. FTSE 100 Change
All of the above variables have their values recorded in levels, except for S&P 500 Change
and FTSE 100 Change, which are in percentage.
The next parts of this section cover reasons for selecting these variables by examining
economic theories and other scholarly sources.
Relationship of Interest Rate with Exchange Rate
There have been several researches that look into the relationships between interest rates,
consumer price index and exchange rates. The basic Fisher equation below explains how the
expected real interest rate and expected inflation rate impact the nominal interest rate.
𝑛 = 𝑖𝑒 +𝜋e
𝑛: nominal interest rate
𝑖: real interest rate
𝜋: expected inflation.
The economic logic is, “Real interest rates fall as inflation increases, unless nominal rates
increase at the same rate as inflation4”
4 http://www.investopedia.com/terms/f/fishereffect.asp
5
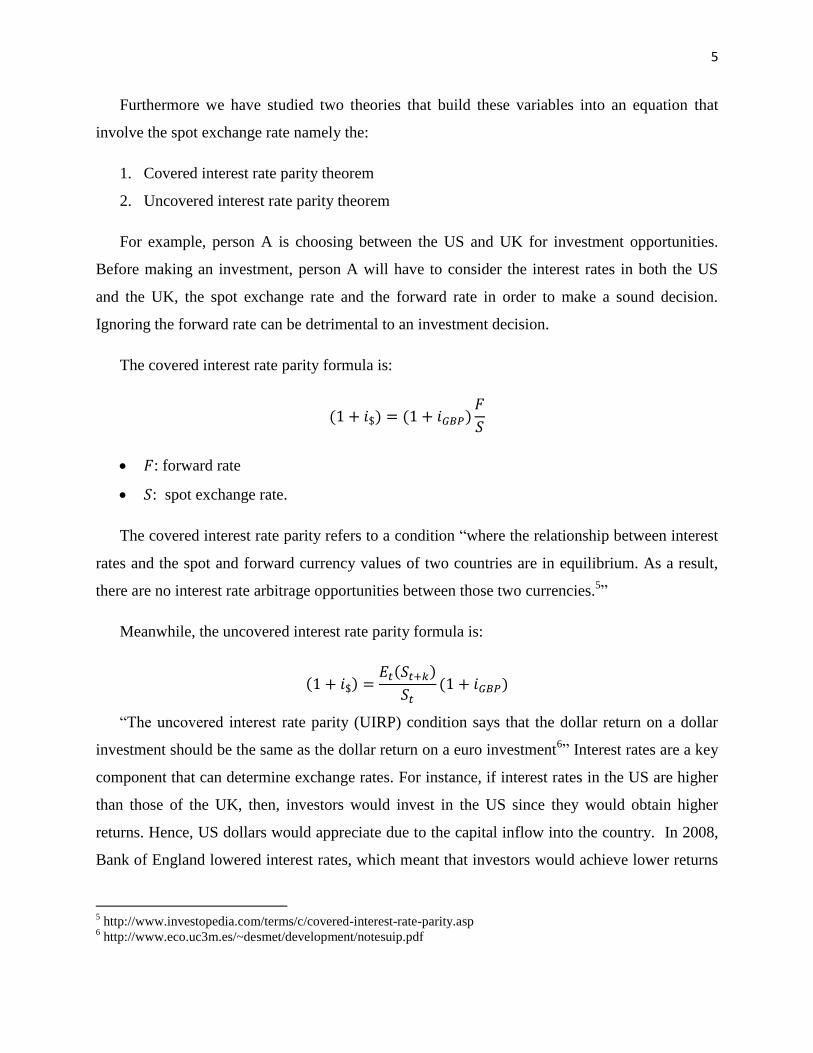
Furthermore we have studied two theories that build these variables into an equation that
involve the spot exchange rate namely the:
1. Covered interest rate parity theorem
2. Uncovered interest rate parity theorem
For example, person A is choosing between the US and UK for investment opportunities.
Before making an investment, person A will have to consider the interest rates in both the US
and the UK, the spot exchange rate and the forward rate in order to make a sound decision.
Ignoring the forward rate can be detrimental to an investment decision.
The covered interest rate parity formula is:
𝑖 𝑖
: forward rate
: spot exchange rate.
The covered interest rate parity refers to a condition “where the relationship between interest
rates and the spot and forward currency values of two countries are in equilibrium. As a result,
there are no interest rate arbitrage opportunities between those two currencies.5”
Meanwhile, the uncovered interest rate parity formula is:
𝑖
𝑖
“The uncovered interest rate parity (UIRP) condition says that the dollar return on a dollar
investment should be the same as the dollar return on a euro investment6” Interest rates are a key
component that can determine exchange rates. For instance, if interest rates in the US are higher
than those of the UK, then, investors would invest in the US since they would obtain higher
returns. Hence, US dollars would appreciate due to the capital inflow into the country. In 2008,
Bank of England lowered interest rates, which meant that investors would achieve lower returns
5 http://www.investopedia.com/terms/c/covered-interest-rate-parity.asp
6 http://www.eco.uc3m.es/~desmet/development/notesuip.pdf

6
than what they were receiving previously. This is the reason why investors would take their
money back out of the UK to invest elsewhere. Thus, the demand for the British Pound fell,
which resulted in the depreciation of the British Pound’s value. This is shown in the graph
below where lowered interest rates lead to the value of GBP weakening7.
Within interest rates, we have selected 3-month T- bill rates and 10-year treasury rates to
make a comparison of how short-term and long-term interest rates will impact the exchange rate
of UK and US. According to secondary research we conducted on interest rates for bonds, “We
have seen that the volatility of interest rates depends on the maturity of the underlying bond:
long-term interest rates are less variable than short-term interest rates. Short-term interest rates
are procyclical while long-term interest rates co-vary little with movements in output over the
business cycle8”
Since different maturities of bonds could have varying effects on the exchange rate, we
wanted to incorporate both 3-month and 10-year treasury rates in the model to give us a
comparison, which we refer to as Model 1A and 1B (in our regression analysis).
Relationship of Consumer Price Index (CPI) with Exchange Rate:
The theory of Purchasing Power Parity (PPP) stresses that, “PPPs are price relatives, which
show the ratio of the prices in national currencies of the same good or service in different
7 http://www.economicshelp.org/macroeconomics/exchangerate/factors-influencing/
8http://www.phil.frb.org/research-and-data/publications/business-review/1996/january-february/cyclical-
volatility.cfm
7
countries9” PPP is an “economic theory that estimates the amount of adjustment needed on the
exchange rate between countries in order for the exchange to be equivalent to each currency's
purchasing power. The relative version of PPP is calculated as:
: exchange rate of currency 1 to currency 2
: cost of good "x" in currency 1
: cost of good "x" in currency 210
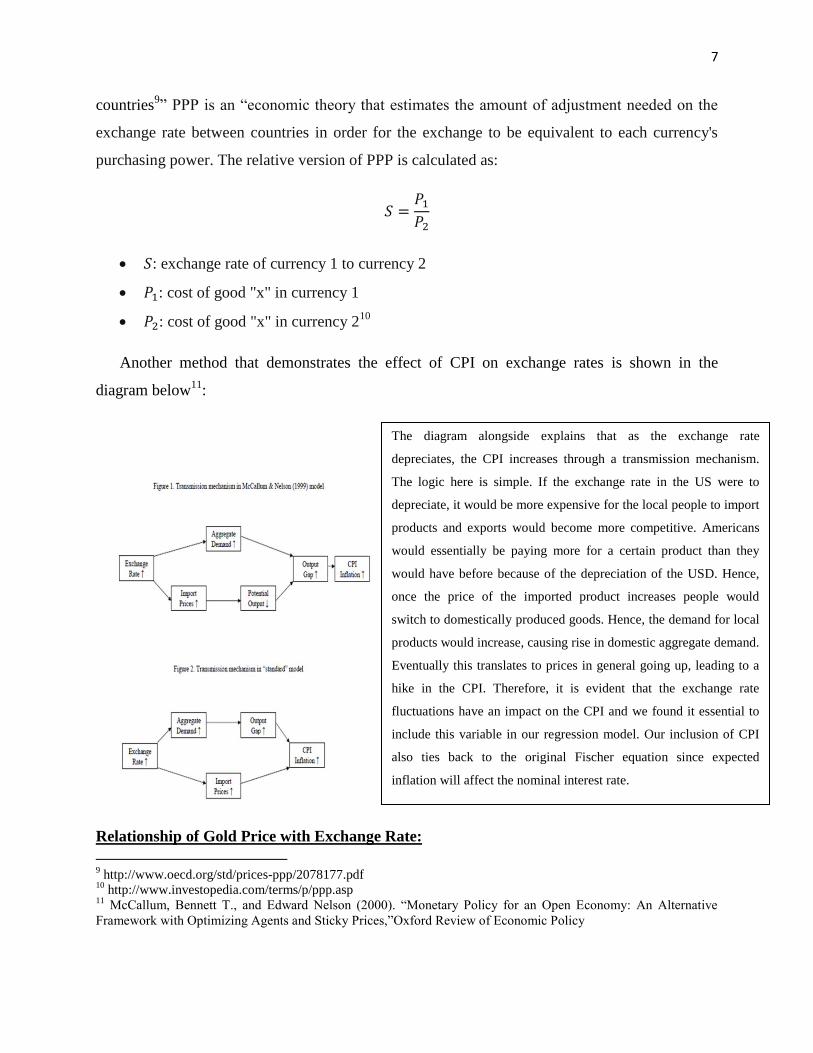
Another method that demonstrates the effect of CPI on exchange rates is shown in the
diagram below11
:
Relationship of Gold Price with Exchange Rate:
9 http://www.oecd.org/std/prices-ppp/2078177.pdf
10 http://www.investopedia.com/terms/p/ppp.asp
11 McCallum, Bennett T., and Edward Nelson (2000). “Monetary Policy for an Open Economy: An Alternative
Framework with Optimizing Agents and Sticky Prices,”Oxford Review of Economic Policy
The diagram alongside explains that as the exchange rate
depreciates, the CPI increases through a transmission mechanism.
The logic here is simple. If the exchange rate in the US were to
depreciate, it would be more expensive for the local people to import
products and exports would become more competitive. Americans
would essentially be paying more for a certain product than they
would have before because of the depreciation of the USD. Hence,
once the price of the imported product increases people would
switch to domestically produced goods. Hence, the demand for local
products would increase, causing rise in domestic aggregate demand.
Eventually this translates to prices in general going up, leading to a
hike in the CPI. Therefore, it is evident that the exchange rate
fluctuations have an impact on the CPI and we found it essential to
include this variable in our regression model. Our inclusion of CPI
also ties back to the original Fischer equation since expected
inflation will affect the nominal interest rate.
8
Gold has deep historical roots in determining purchase power parity12
. There have been
studies that suggest the relationship between gold price and exchange rates. The gold standard
was created in the United States and United Kingdom in the 19th
century. For paper currency to
be issued, it had to be backed by enough gold in the vaults. The gold exchange ratio is how
much unit of gold can be redeemed for each paper bill issued by the respective country. While
researching about the relationship between exchange rates and gold research, one main finding
was discovered: “The exchange ratio between a country’s money and gold did not vary when the
country was on a gold standard. The real exchange rate can be determined through the use of this
formula13
:
𝑒 (
)
: time-t real exchange rate
𝑒 time-t nominal exchange rate
and : time-t price levels in the foreign country and domestic country in gold value
14
To build the price indices for the domestic and foreign country, the country’s basket of goods
is multiplied by the gold exchange ratio. The real exchange rate is a measurement of one
country’s goods to another. The conclusion holds true over the long run that gold retains its
purchasing power parity.
However, there has been a transition in the image of gold today. Gold is considered an
alternative to the US currency. As a result, trend analysis shows gold and the dollar trading in
inverse directions over the past ten year period observed. When gold prices are rising, the US
Dollar is weakening as a result compared the British Pound. Why does the same not occur for
the British Pound when gold price rises? This is because the US dollar is considered to be the
international monetary reserve. When the world is starting to fear and distrust the reliability of
the US Dollar, they will demand more gold. Inflation, distrust, and fear are other factors that
will drive people to demand gold. This demand in gold will also put pressure pushing down the
12
http://www.sciencedirect.com.ezproxy.babson.edu/science/article/pii/S0301420708000202
13 http://www.minneapolisfed.org/research/dp/dp32.pdf
14 http://www.minneapolisfed.org/research/dp/dp32.pdf

9
price of the US dollar. The price of gold is a measurement of fear sentiment rather than priced
by the yearly output production. This inverse relationship is also because of the fact that gold
becomes more expensive to buy in other currencies as the US Dollar appreciates more. Gold in
US denominated currency would therefore decrease. This relationship concludes the inverse
relationship between gold and the US exchange rate with other countries. This evidence
supports the notion of the US dollar being an international currency15
.
Relationship of Crude Oil Price with Exchange Rate:
Crude oil is one of the most highly demanded commodities that essentially “power” the
economy. This commodity is required in order to run energy consuming production and
transportation resources. Since every nation requires oil, importing and exporting of oil is vital
for a countries finances, which is why it has an important relationship with exchange rates. If a
country is a major importer of crude oil, and if oil prices rise, then obviously the country
importing oil is worse off than the country exporting oil. The OPEC nations are all oil exporting
nations who have a great impact on the supply of crude oil. The price of oil is denominated in US
Dollars, and so, when the US Dollar weakens, the price of oil automatically reduces for the
countries that import oil. For instance, if the UK was importing oil, and the dollar weakened, the
UK government would pay fewer pounds for oil than they would have if the dollar had not
depreciated. In other words, the UK can buy more oil when the prices are lower. However, a
weakening dollar for the nations is not healthy as they receive fewer dollars for the quantities
they export16
. Hence, in order to make higher profits, these nations collectively decide to cut the
supply of oil, purely to increase oil prices. We found it useful to introduce a commodity such as
oil in our model because we wanted to see if it has a specific effect on the US/UK exchange rate.
Relationship between Stock Markets and Exchange Rates
The Standards & Poors 500, also known as the S&P 500, consists of the top 500 companies
in the US. It is also known to be the best representation of the US stock markets, and it is
different to other US indices such as the Dow Jones and NASDAQ because of its weighting
15
http://www.lbma.org.uk/assets/Alch6605Oconnor.pdf 16
http://www.economicinsight.ca/economic_docs/2009may_oilprices.pdf

10
methodology. In order to be listed on S&P 500, companies must have market capitalization of at
least four billion, and a minimum of 50% floated to the public17
.
FTSE 100, on the other hand, is a major stock exchange in the UK. It represents the top 100
companies based on market capitalization from the London Stock Exchange. The index began in
1984, and has now become one of the major indices in the world. 18
There has been an extensive research on the relationship between stock markets and
exchange rates, so we were curious to see how stock indices would or would not “collaborate”
with other independent variables in displaying an aggregate relationship with exchange rates.
We came across many articles but decided to explore the research done by Desislava
Dimitrova on a deeper scale. His paper focuses on the relationship between exchange rates and
stock markets between the US and UK, which has been helpful for us to gain a better
understanding of the topic. In this paper, Dimitrova makes reference to “Ajayi and Mougoue”
who study the relationships between stock prices and exchange rates in “eight advanced
economies”. In their study, Ajayi and Mougoue notice that a hike in stock prices would cause the
currency to weaken for the US and the UK. They go on inferring that this happens because a
rising stock market would suggest a booming economy, which would lead to an increase in
inflation. A higher inflation would mean that the value of the currency would be worth less,
which in turn would lower the demand for the currency. Thus, the currency would become
weaker19
. With this study in our mind, we decided to include stock market indices such as S&P
500 and FTSE 100 as our variables that may have a relationship with the US/UK exchange rate.
METHODOLOGY
The goal f the models is to test whether 3- month T-bill rates, 10-year treasury rates and CPIs of
both the US and UK will have a significant relationship with the UK/US Exchange rate.
Further Study
17
http://www.spindices.com/documents/factsheets/fs-sp-500-ltr.pdf 18
http://www.londonstockexchange.com/exchange/prices-and-markets/stocks/indices/summary/summary-
indices.html?index=UKX 19
http://org.elon.edu/ipe/dimitrova%20final.pdf

11
Simultaneously we are studying whether 3-month (short-term) or 10-year (long-term) rates have
a greater impact on the exchange rate for UK/US, if any.
Model 1A and 1B explore the effect of UK and US treasury rates (short-term and long-term,
respectively), US CPI, UK CPI, Gold Price, Crude Oil Price, S&P 500 Change and FTSE 100
Change on the US/UK exchange rate. Data used is collected for monthly basis, from Bloomberg
and the FRED website to maintain consistency. All values were in levels except for the S&P 500
and FTSE 100 which were taken as a percentage change from the previous month. Our data set
ranges from January 1973 to December 2012, 40 X 12 = 480 observations. All data is available
across this time frame except for FTSE 100 which started in 1984. In addition, there were some
missing values of Crude Oil Price.
A large data set is more representative of the behavior of US/UK exchange rate over the
years. There are advantages and disadvantages of choosing a large data set. In terms of
advantages, many data points indicate a better trend of exchange rate and allow us to see the big
picture of how exchange rates move in relation to the movements of other predictor variables.
However, a large data set overlooks the specificity of certain time periods where significant
events happened that considerably impacted exchange rates. For the purpose of this paper, a
large sample size yields more advantages than disadvantages.
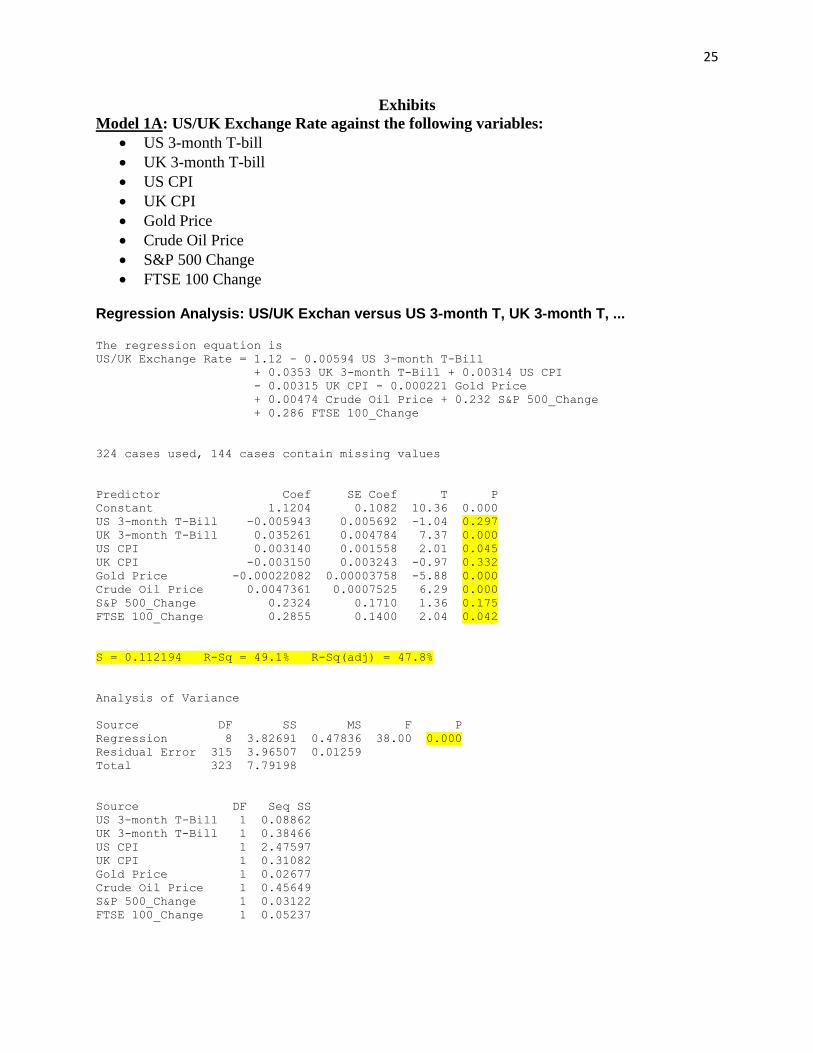
MODEL 1A AND MODEL 1B
Model 1A
Model 1A serves to test the relationship between exchange rates and eight other variables. In
this model, we used the short-term 3-month T-Bill for both the US and UK. We ran an initial
simple regression against the US/UK exchange rate (commonly known as the spot rate), then
compared the p-values of individual variables with the level of significance . We found
that all variables were significant except for US 3-month T-bill (p-value is 0.297 > 0.05), UK
CPI (p-value is 0.332 > 0.05), and S&P 500 Change (p-value is 0.175 > 0.05). The FTSE 100
Change was almost on a border as its p-value is 0.042, showing weaker significance than the
other variables.
The overall regression equation was:
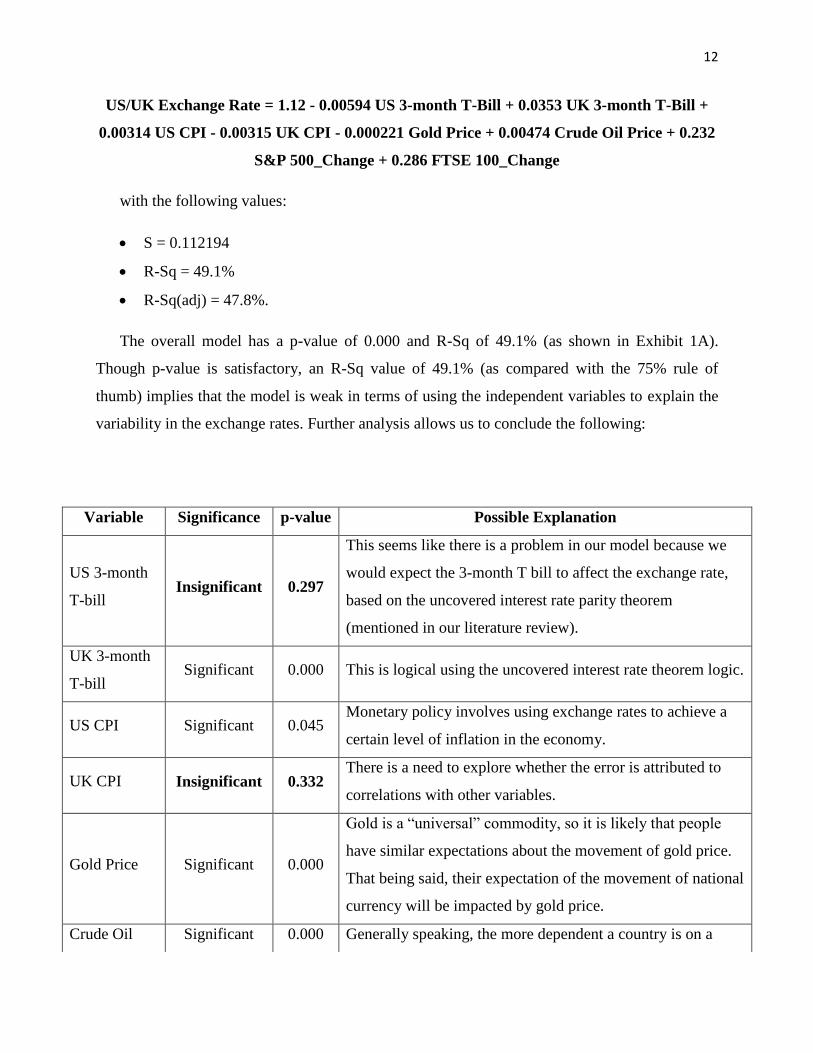
12
US/UK Exchange Rate = 1.12 - 0.00594 US 3-month T-Bill + 0.0353 UK 3-month T-Bill +
0.00314 US CPI - 0.00315 UK CPI - 0.000221 Gold Price + 0.00474 Crude Oil Price + 0.232
S&P 500_Change + 0.286 FTSE 100_Change
with the following values:
S = 0.112194
R-Sq = 49.1%
R-Sq(adj) = 47.8%.
The overall model has a p-value of 0.000 and R-Sq of 49.1% (as shown in Exhibit 1A).
Though p-value is satisfactory, an R-Sq value of 49.1% (as compared with the 75% rule of
thumb) implies that the model is weak in terms of using the independent variables to explain the
variability in the exchange rates. Further analysis allows us to conclude the following:
Variable Significance p-value Possible Explanation
US 3-month
T-bill Insignificant 0.297
This seems like there is a problem in our model because we
would expect the 3-month T bill to affect the exchange rate,
based on the uncovered interest rate parity theorem
(mentioned in our literature review).
UK 3-month
T-bill Significant 0.000 This is logical using the uncovered interest rate theorem logic.
US CPI Significant 0.045 Monetary policy involves using exchange rates to achieve a
certain level of inflation in the economy.
UK CPI Insignificant 0.332 There is a need to explore whether the error is attributed to
correlations with other variables.
Gold Price Significant 0.000
Gold is a “universal” commodity, so it is likely that people
have similar expectations about the movement of gold price.
That being said, their expectation of the movement of national
currency will be impacted by gold price.
Crude Oil Significant 0.000 Generally speaking, the more dependent a country is on a

13
*Correlation among independent variables:
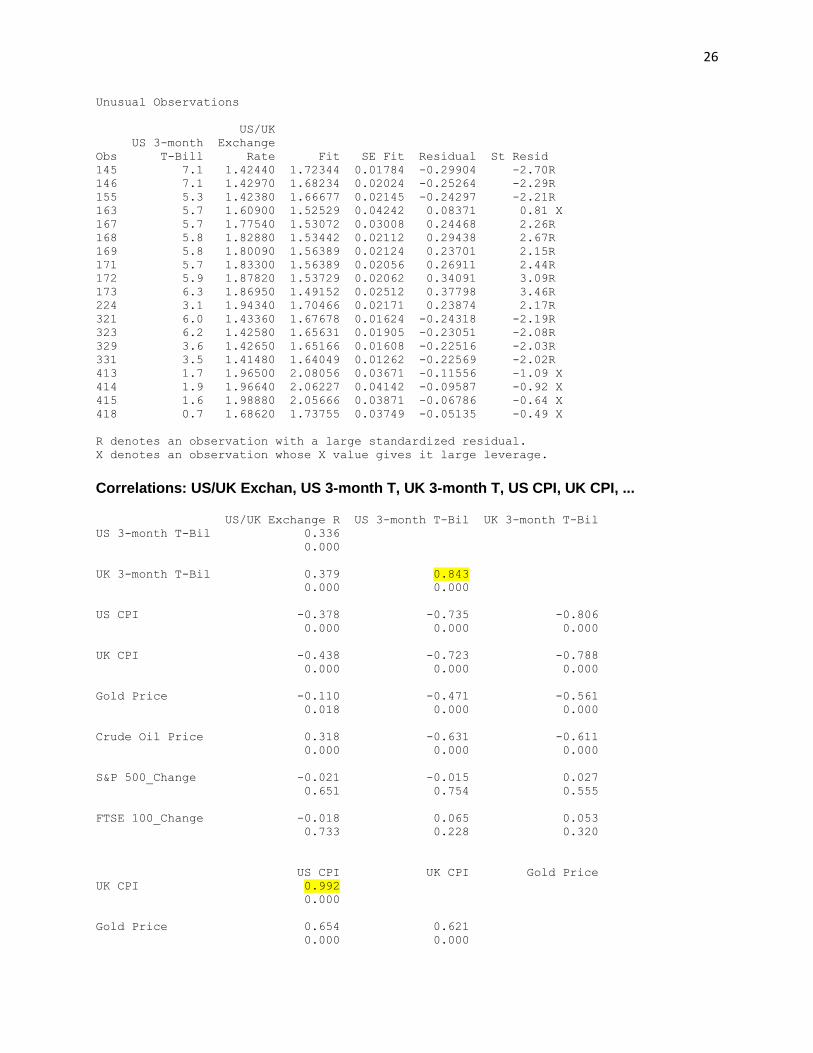
Of all the variables, the most notable and interesting correlations are coming from the US 3-
month T-bill. The US 3-month T-bill is highly correlated with the UK 3-month T-bill by a value
of 0.843. This could possibly indicate how the US and UK respond to each other’s treasury rate
through observing the other country’s monetary policy. The question is, if US and UK 3-month
T-bill were highly correlated, why was the UK 3 month T-Bill significant to the model, whereas
the US 3-month T-Bill failed to do so? The correlation between these two specific variables
indeed weakens the validity of our overall model. The study of literature reviews suggested that
we include both variables in the model. We believe it might have been due to our approach to the
individual variables: there could potentially be other ways of representing these two variables
such as taking the ratio of two countries’ short-term interest rates, taking the difference between
the countries’ interest rates, or taking the ratio of the change in the countries’ interest rates, etc.
In addition, the US 3-month T-bill is highly correlated with US CPI by a value of -0.735,
showing an inverse relationship between the two variables. As interest rates decrease, it is
cheaper to borrow money, hence investment and consumption in the economy increases, which
increases the overall aggregate demand and causes inflation. This would make the CPI index
rise. Similarly, the UK 3-month T-bill and UK CPI have a correlation of -0.788. As seen, interest
20
http://www.investopedia.com/ask/answers/06/forexcommodities.asp
Price primary domestic industry, the stronger the correlation
between the national currency and the industry’s commodity
prices.20
S&P
500_Change Insignificant 0.175
It is possible that this particular stock index was not
representative of the whole economy. Therefore, we cannot
make any conclusion for stock price in general. We would
have needed to calculate a weighted average of all stock
indices in USA.
FTSE
100_Change Significant 0.042
We cannot make a definitive conclusion of stock market in
general from this value only.

14
rates are inversely related to CPI for both countries. In a recent WSJ article, it quotes “The Bank
of England Wednesday said the U.K.'s economy is set to grow more rapidly than it had expected
just three months ago, but stressed that a subdued outlook for inflation means it is still unlikely to
raise interest rates soon21
" This article clearly displays the relationship between the inflation and
interest rate and reinstates our claim of how CPI and interest rate are closely related. Further, the
UK CPI and US CPI are correlated by 0.992, clearly demonstrating how both CPI indexes and
short-term treasury rates are strongly correlated between both these nations.
Another finding is that the Crude Oil Price has a high correlation with US CPI and UK CPI,
0.842 and 0.793 respectively. This can be attributed to the fact that both the US and UK are
importers of crude oil. Import costs of oil affect the transportation and manufacturing industries
and high costs will have spillover effects on overall price increases in the economy.
This model raised curiosity as to why the US 3-month T-bill was not significant as we had
hypothesized. One would assume from previous research that interest rates directly affect
exchange rates, which is why we had hypothesized that both 3-month T-bill of UK and US
would be significant. We wanted to carry out another regression analysis to explore whether the
10 year bond rates for UK and US different effects on the exchange rate for US/UK. Using this
model, we studied it in comparison to our short run 3-month T-bill model.
Model 1B
This model involves the same data set as Model 1A. The only difference is that both the US
and UK 3-month T-bills were substituted by US and UK 10-year treasury rates, respectively. WE
found more supporting results where, the US 10-year treasury rates were now significant. The
regression equation is:
US/UK Exchange Rate = 0.851 + 0.0337 US 10-year Treasury + 0.0267 UK 10-year
Treasury + 0.00627 US CPI - 0.00856 UK CPI - 0.000252 Gold Price + 0.00498 Crude Oil
Price + 0.314 S&P 500_Change + 0.289 FTSE 100_Change
with the following values:
21
http://online.wsj.com/news/articles/SB10001424052702303289904579195292401776098?mod=WSJ_hps_LEFTT
opStories

15
S = 0.117358
R-Sq = 44.3%
R-Sq(adj) = 42.9%.
The only variable that was insignificant in this model was the S&P 500 Change, having a p-
value of 0.081. The insignificance of S&P 500 Change is also reflected in Model 1A. The FTSE
100 Change is once again on a border as its p-value of approximately 0.05 implies a weaker
significance on exchange rates than other variables. From both Model 1 A and 1B, it is fair to say
that the S&P 500 Change and FTSE 100 Change do not contribute to determining the US/UK
exchange rate as much as the other variables. The following table explains our findings from
Model 1B:
22
http://www.investopedia.com/ask/answers/06/forexcommodities.asp
Variable Significance P Possible Explanation
US 10-year
rate Significant 0.008 Adheres to uncovered interest rate parity theorem
UK 10-year
rate Significant 0.004 Adheres to uncovered interest rate parity theorem
US CPI Significant 0.001 Logical using PPP theorem
UK CPI Significant 0.013 Logical using PPP theorem
Gold Price Significant 0.000
Gold is a “universal” commodity, so it is likely that people
have similar expectations about the movement of gold price.
That being said, their expectation of the movement of
national currency will be impacted by gold price.
Crude Oil
Price Significant 0.000
Generally speaking, the more dependent a country is on a
primary domestic industry, the stronger the correlation
between the national currency and the industry’s commodity
prices22
S&P
500_Change Insignificant 0.081
It is possibly not relevant to predicting the exchange rate
since it is also insignificant in Model 1A using short term T-
bill rate.
16
Analyzing the correlations, we see similarities in both Model 1A and 1B. In model 1B there
is once again a high correlation between US and UK 10-year treasury rate of 0.865. An article
talks about this in the WSJ in 2013, “The spread between ten-year treasury yields and those of
their British equivalents, gilts, is hovering at 2-year highs. So the pound gets support from all
angles, form the hard numbers, from rate differentials and from activist central bank23
” (From the
article: "Sterling Climbs, but what about those imbalances?" by David Cottle
Once again US 10-year rate is related to US CPI by -0.776 and UK 10 year rate is related to
UK CPI by -0.935, once again showing the negative relationship of interest and CPI. A finding
that is seen in the previous model as well, to add to its credibility.
UK CPI and US CPI are correlated by 0.992 establishing that irrespective of the time frame
of interest rates the two nations will affect each other’s CPI strongly.
MODEL 2A AND MODEL 2B
Model 1A and 1B bring us to an important question: do short term T-bills and long term 10-
year treasury bonds have different effects on the exchange rate from the above regressions
ceterus paribus? Using the uncovered interest rate parity formula we now try and predict the
future exchange rate, where we use the interest rate of US and UK and the current spot rate to
find E(S) – which is the predicted spot rate the following year.
𝑖
𝑖
23
http://blogs.wsj.com/moneybeat/2013/09/13/sterling-climbs-but-what-about-those-
imbalances/?KEYWORDS=British+Pound)
FTSE
100_Change Significant 0.050
This value is very close to the p value at 95% level of
significance making it difficult to make any conclusion about
the relationship between the FTSE 100 change and the
exchange rate.
17
The formula gives us a calculated value for the exchange rate. Meanwhile, our regression
equation also give us a value which is an estimated value based on the assumptions of our model.
We calculate the error as:
𝑒 𝑒 𝑛 𝑒 𝑒 𝑒 𝑛 𝑒 𝑒
𝑒 𝑒 𝑒 𝑛 𝑒 𝑒
It is fair to assume that larger the percentage error, the more inaccurate model 1A and 1B are,
and perhaps such error could possibly be attributed to one of the variables we used in our initial
regression models. Hence, we decided to run two other regression models, which we called
Model 2A (for short term 3-month T-bill) and Model 2B (for long term 10-year treasury), with
percentage error of spot exchange rate as out dependent variable. Meanwhile, we kept all
independent variables the same as model 1A and 1B to determine which variables would me
more significant to the percentage error of spot exchange rate.
Model 2A:
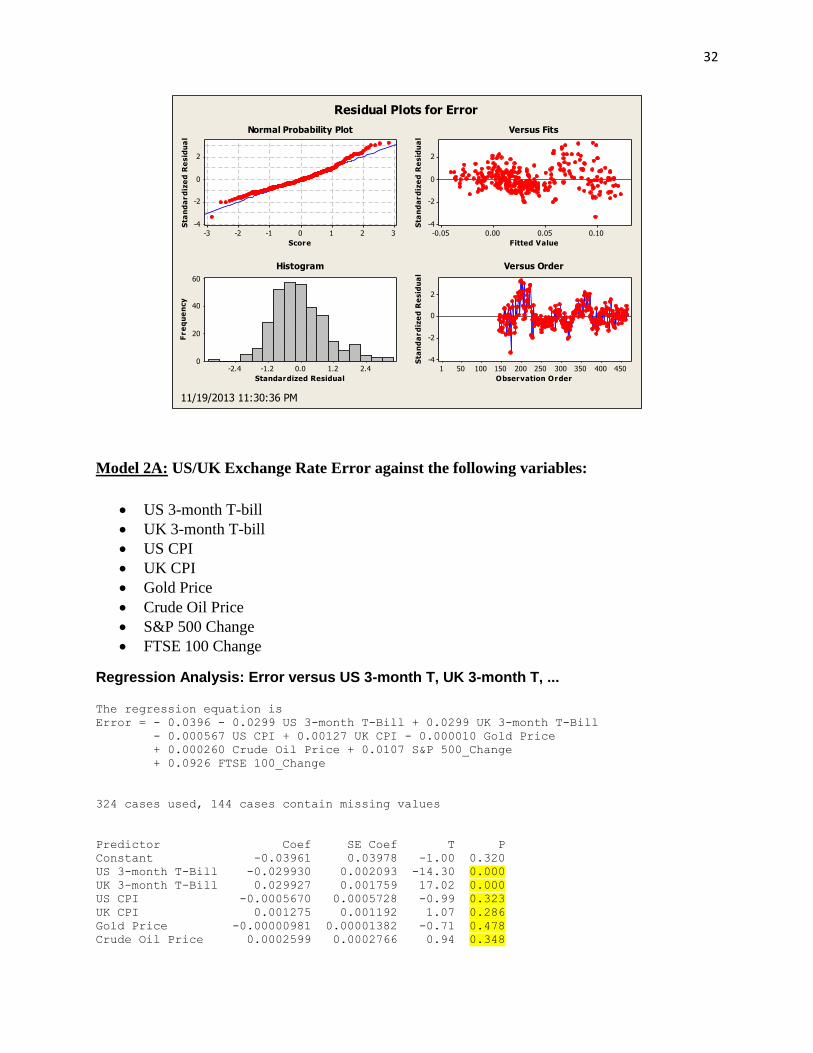
This model examined the relationship between the error of short-term spot exchange rate
against the following variables: US and UK 3 month T-bills, US and UK CPI, Gold Price, Crude
Oil Price, S&P 500 change and FTSE 100 change.
Studying the p-values from the regression it turned out that the only two variables that could
be used to explain the error in exchange rates are US and UK 3-month treasury bills. The other
variables all proved to be unable to account for the discrepancy between predicted exchange rate
and observed exchange rate. Logically, this finding gave us some insight in relation to the model
1A, which had previously revealed that short-term treasury rates, particularly US 3-month T-bill
rates, did not contribute to explaining the exchange rate. However, there remained one concern if
we solely went with this logic. As we recalled, the UK CPI were insignificant in model 1A, so
theoretically, we expected this variable to prove its significance in model 2A. Having been aware
of the “unusual behavior” of UK CPI, we understood that we would have to conduct further
analysis/ research to find out why UK CPI did not meet any of our expectation.
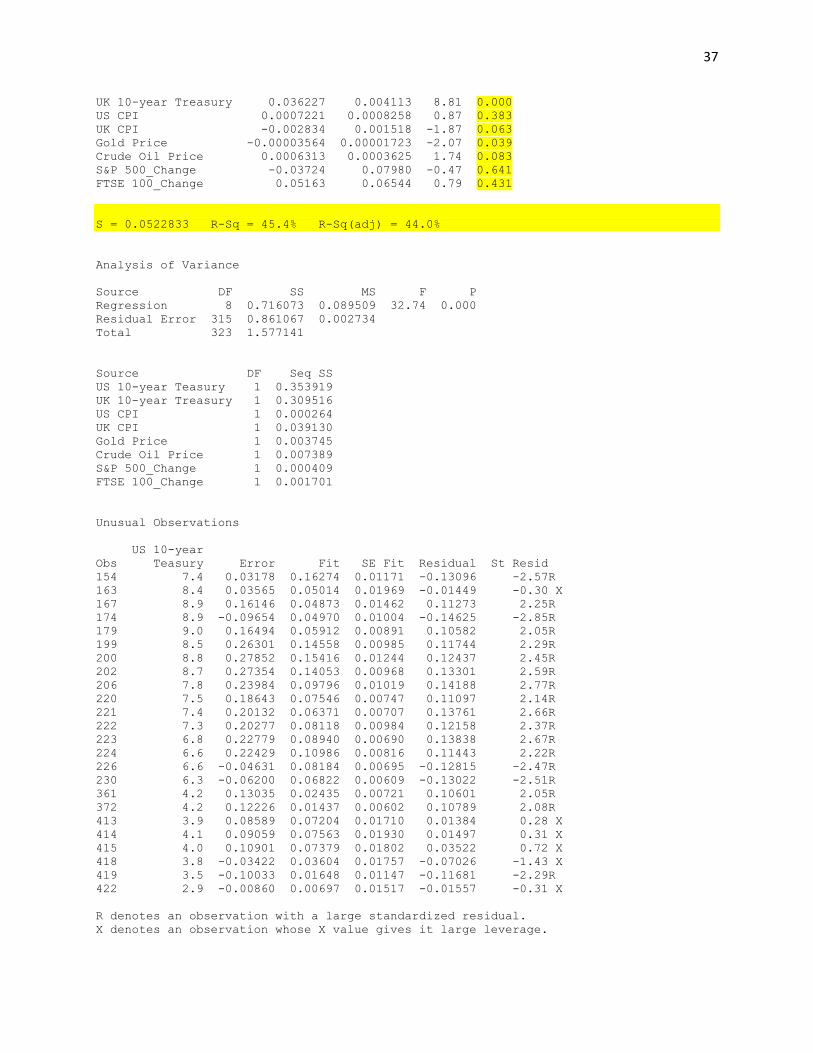
Model 2B:
Our findings from model 1B suggested that 10-year treasury rates for both the US and UK
had an impact on the exchange rate. With this in mind, we hoped to see these two variables as
insignificant in model 2B. However, the predictor variables that turned out to be significant
18
included US and UK 10-year Treasury, US and UK CPI, and S&P 500. At first sight, this
seemed contradictory with what we had hypothesized given the result and logic derived from
model 2A. However, both findings from Model 2A and 2B were assuring in a sense that they
“claimed” treasury rates, regardless of maturity term, as being able to explain the error between
observed spot exchange rate and calculated spot exchange rate. Strictly and hypothetically
speaking, treasury rates should not account for the error between the observed and calculated
spot exchange rates, because they “determine” the spot exchange rate, based on the uncovered
interest rate parity.
This seemingly contradiction could be attributed to the different rates at which US and UK
treasury rates changed. The formula associated with the uncovered interest rate parity only gave
us the spot exchange rate based on the primary assumptions of capital mobility and perfect
substitutability of domestic and foreign assets24
. For example, if investors expect the rate of
return to be higher in the US, this would attract capital into the U.S., driving US interest rates
down and moving UK interest rates up, causing a dollar appreciation against the British Pound.
This process continues until the URIP equation holds again. However, in reality, investors can
actually earn arbitrage profits by borrowing in a country with lower interest rates, exchange for
foreign currency, and investing in a foreign country with higher interest rates, while allowing for
any losses (or gains) from exchanging back to their domestic currency at maturity25
. This
explains the deviation from UIRP, which in turn provides an insight into why there were
differentials in our observed and calculated spot exchange rates. In addition, the UIRP does not
specify whether the interest rates used for the equation are short-term or long-term rates. For this
reason, we can safely assume that the lack of compensating capital flows also have similar
effects on both 3-month T-Bill rates and 10-year treasury rates in causing the differentials in
observed and calculated spot exchange rates.
24
http://arxiv.org/abs/1303.4314 25
http://arxiv.org/abs/1303.4314
19
2009
-03-01
2005
-04-01
2001
-05-
01
1997
-06-
01
1993
-07-01
1989
-08-01
1985
-09-01
1981
-10-
01
1977
-11-
01
1974
-01-
01
2.4
2.2
2.0
1.8
1.6
1.4
1.2
1.0
Month
US
/U
K E
xch
an
ge
Ra
te
Time Series Plot of US/UK Exchange Rate
11/27/2013 7:30:09 PM
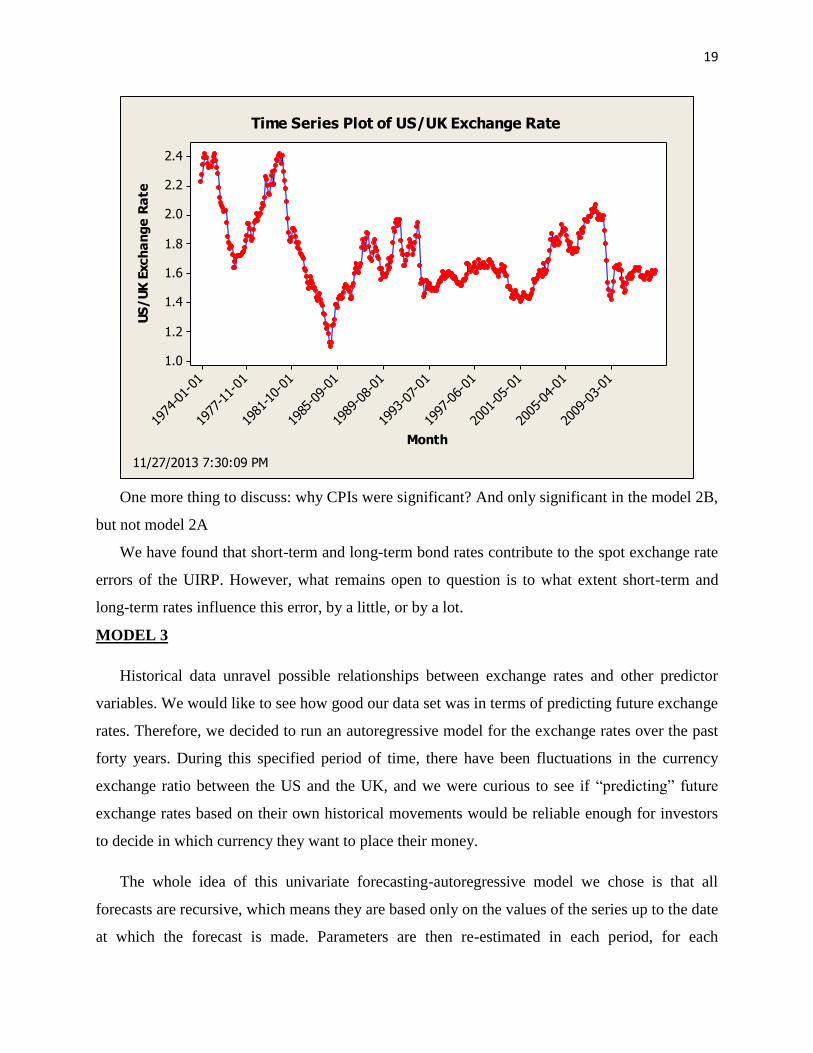
One more thing to discuss: why CPIs were significant? And only significant in the model 2B,
but not model 2A
We have found that short-term and long-term bond rates contribute to the spot exchange rate
errors of the UIRP. However, what remains open to question is to what extent short-term and
long-term rates influence this error, by a little, or by a lot.
MODEL 3
Historical data unravel possible relationships between exchange rates and other predictor
variables. We would like to see how good our data set was in terms of predicting future exchange
rates. Therefore, we decided to run an autoregressive model for the exchange rates over the past
forty years. During this specified period of time, there have been fluctuations in the currency
exchange ratio between the US and the UK, and we were curious to see if “predicting” future
exchange rates based on their own historical movements would be reliable enough for investors
to decide in which currency they want to place their money.
The whole idea of this univariate forecasting-autoregressive model we chose is that all
forecasts are recursive, which means they are based only on the values of the series up to the date
at which the forecast is made. Parameters are then re-estimated in each period, for each

20
forecasting model, using data from the beginning of the sample through the current forecasting
date. For forecasts that entail data-based model selection, the order of the model is also selected
recursively, and thus can change over the sample as new information is added to the forecast data
set. We chose the period between 1973-1 and 1982-12 as our “burning” period, whose
terminology is “estimation subsample”. This “burning” period created a preliminary
autoregressive model which provided us with the coefficients for forecasting purposes.
For the time series regression to be externally valid, it is essential to assume stationary,
which says that history is relevant26
. Many macroeconomic time series appear to be non-
stationary in the sense of having one or more unit roots, which should explain why we transform
the real value of exchange rates into exchange rate returns by taking their first difference27
.
We proceeded with this model by calculating the exchange rate returns between 1973-1 and
2012-12. This was done by taking the difference between the natural logarithm of one month’s
exchange rate and the natural logarithm of the previous month’s exchange rate. The calculated
exchange rate returns were then used as our dependent variable, which we labelled as Y1, Y2…
Yt-1, Yt (t: the observations on the time series random variable Y).
The autoregressive model that we chose does not formulate causal interpretations. It simply
performs a forecasting function for out-of-sample data. In this model, Yt (value of Y in period t)
is regressed against its own lagged values. The number of lags used as regressors is called the
order of the autoregression. In a first order autoregression, Yt is regressed against Yt–1. In a pth
order autoregression, Yt is regressed against Yt–1, Yt–2,…, Yt–p. For the purpose of simplicity, we
solely used the first order autoregression to forecast the exchange rate returns.
The population autoregressive model is28
:
The above model is characterized by:
and do not have causal interpretations
26
http://www.princeton.edu/~mwatson/papers/PhillipsCurveInflationForecasts_Sept2008.pdf 27
http://www.princeton.edu/~mwatson/papers/Marcellino_Stock_Watson_FinalVersion_hstep.pdf 28
http://www.econ.brown.edu/fac/Frank_Kleibergen/ec163/ch14_slides_1.pdf
21
If then is not useful for forecasting
The autoregressive model can be estimated by OLS regression of against
Testing vs. provides a test of the hypothesis that is not useful for
forecasting
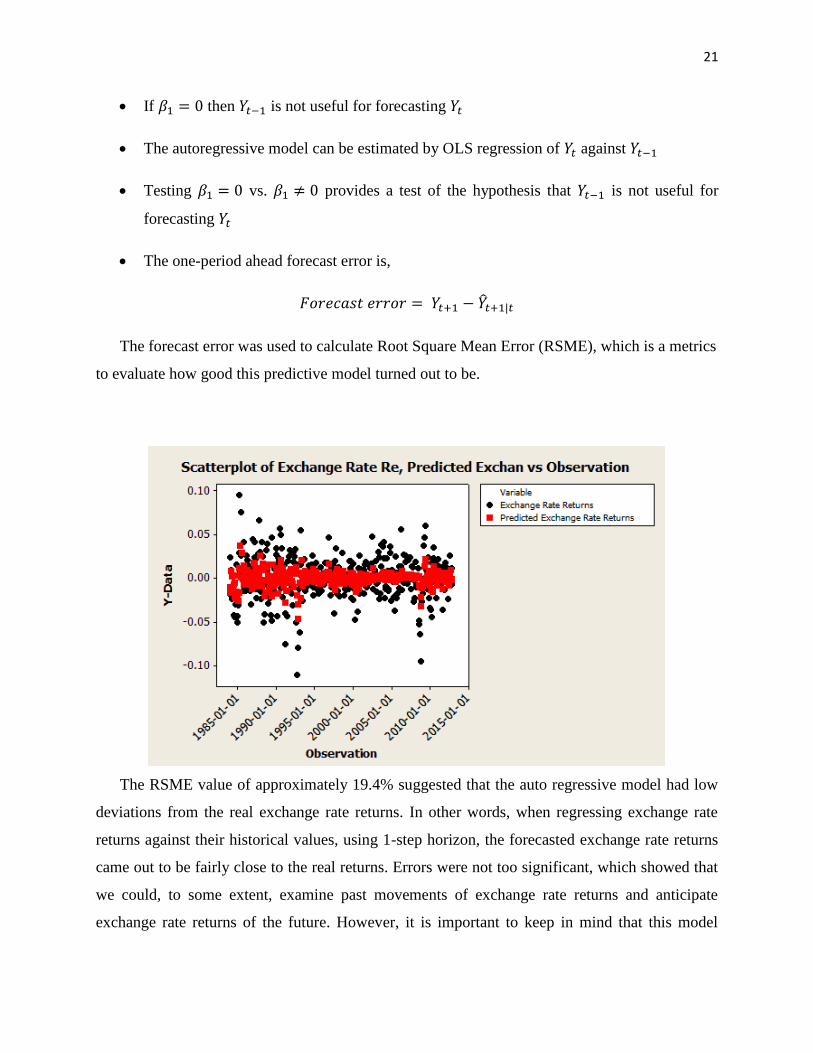
The one-period ahead forecast error is,
𝑒 𝑒 ̂
The forecast error was used to calculate Root Square Mean Error (RSME), which is a metrics
to evaluate how good this predictive model turned out to be.
The RSME value of approximately 19.4% suggested that the auto regressive model had low
deviations from the real exchange rate returns. In other words, when regressing exchange rate
returns against their historical values, using 1-step horizon, the forecasted exchange rate returns
came out to be fairly close to the real returns. Errors were not too significant, which showed that
we could, to some extent, examine past movements of exchange rate returns and anticipate
exchange rate returns of the future. However, it is important to keep in mind that this model

22
demonstrated insignificant errors only when it was used to forecast the exchange rate returns of
one period ahead ( in this case, one month ahead). It is unlikely that the model will hold its
validity in forecasting exchange rate returns of more than one month ahead.
The graph that features the time series of real exchange rate returns and forecasted exchange
rate returns reveals a pattern. It seems that forecasted exchange rate returns are distributed more
densely around the center line (the mean exchange rate returns). This pattern of distribution
could be interpreted as a sign of the predictive model being consistent; meaning the coefficients
which had been re-estimated (for every month period) managed to forecast the exchange rate
returns of the following months at a consistently accurate rate. In addition, the model did not
appear to have any noticeable outliers. Though it is ideal to have a model free of outliers, it is
essential to pay attention to unusual observations. Looking at the real exchange rates data, there
are a few observations where exchange rates return were unusually high or low. The model,
however, did not appear to reflect these unusual observations. We believe this is where we need
to be concerned about the model. The auto regression somehow failed to take into account the
months where exchange rate returns behaved unusually. For further study, this concern needs to
be addressed because at this point, we are not certain about the possibility of the model failing to
incorporate the unusual real exchange rate returns and reflect them in the forecasted exchange
rate returns. If an investor were to monitor the current real exchange rate but note that the current
rate has been unusual, he would not have any confidence in using this model to make educated
guesses about how the exchange rate would be in the upcoming month.

23
Works Cited
Ames, Matthew. "Reinvestigating the Uncovered Interest Rate Parity Puzzle via Analysis of
Multivariate Tail Dependence in Currency Carry Trades." Reinvestigating the Uncovered
Interest Rate Parity Puzzle via Analysis of Multivariate Tail Dependence in Currency
Carry Trades. Cornell, Mar. 2013. Web. 4 Dec. 2013.
"Business Is Great." Business Is Great. British Embassy, 2012. Web. 04 Dec. 2013.
Brittain, Alex. "BOE Opens Door to Earlier Rate Rise." BOE Opens Door to Earlier Rate Rise.
N.p., 13 Nov. 2013. Web. 4 Dec. 2013.
"Covered Interest Rate Parity." Investopedia. N.p., n.d. Web. 03 Dec. 2013.
Cottle, David. "Sterling Climbs, But What About Those Imbalances?" Sterling Climbs, But What
About Those Imbalances? WSJ, 13 Sept. 2013. Web. 4 Dec. 2013.
Desmet, Klaus. "Notes on Uncovered Interest Parity." Notes on Uncovered Interest Parity. N.p.,
2000. Web. 3 Dec. 2013.
Dimitrova, Desislava. "The Relationship between Exchange Rates and Stock Prices: Studied in a
Multivariate Model." N.p., 14 Aug. 2005. Web. 20 Nov. 2013.
Garber, Peter. "The Collapse of the Bretton Woods Fixed Exchange Rate System." The Collapse
of the Bretton Woods Fixed Exchange Rate System. University of Chicago Press, Oct.
1993. Web.
"Fisher Effect." Investopedia. N.p., n.d. Web. 03 Dec. 2013.
"FTSE 100." - London Stock Exchange. N.p., n.d. Web. 20 Nov. 2013.
"John Jay's Treaty, 1794–95 - 1784–1800 - Milestones." John Jay's Treaty, 1794–95 - 1784–
1800 - Milestones - Office of the Historian. N.p., 2010. Web. 01 Dec. 2013.
Kleibergen, Frank. "Introduction to Time Series Regression and Forecasting." Introduction to
Time Series Regression and Forecasting. N.p., 2010. Web.
24
Marcellino, Massimiliano. "A Comparison of Direct and Iterated Multistep AR Methods for
Forecasting Macroeconomic Time Series." A Comparison of Direct and Iterated
Multistep AR Methods for Forecasting Macroeconomic Time Series. Princeton, Feb.
2004. Web.
McCallum, Bennett T., and Edward Nelson (2000). “Monetary Policy for an Open Economy: An
Alternative Framework with Optimizing Agents and Sticky Prices,”Oxford Review of
Economic Policy
O'connor, Fergal. "Gold’s Negative Relationship with the US Dollar." Gold’s Negative
Relationship with the US Dollar. N.p., Feb. 2012. Web.
Pettinger, Tejvan R. "Factors Which Influence the Exchange Rate." Economics Help. N.p., Jan.
2009. Web. 03 Dec. 2013.
"Purchasing Power Parity - PPP." Investopedia. N.p., 2010. Web. 03 Dec. 2013.
Rush, Mark. "Real Exchange Rates under the Gold Standard." Real Exchange Rates under the
Gold Standard. N.p., Oct. 1990. Web. 3 Dec. 2013.
Schreyer, Paul. "Purchasing Power Parities – Measurement and Uses." Purchasing Power Parities
– Measurement and Uses. N.p., Web. March 2002.
Sill, Keith. "The Cyclical Volatility of Interest Rates." The Cyclical Volatility of Interest Rates.
N.p., 1996. Web. 03 Dec. 2013.
Sjaastada, Larry. "The Price of Gold and the Exchange Rates: Once Again." The Price of Gold
and the Exchange Rates: Once Again. N.p., June 2008. Web.
"S&P 500 Equity Indices." S&P Dow Jones Indices. McGraw Hill Financial, 28 Mar. 2013.
Web. 20 Nov. 2013.
Stock, James. "Phillips Curve Inflation Forecasts." Phillips Curve Inflation Forecasts. N.p., 2012.
Web.
"What is the Relationship Between the Exchange Rate and Oil Prices?." Dale ORR Economic
Insight. N.p. ,n.d. Web.18 November 2013.
25
Exhibits
Model 1A: US/UK Exchange Rate against the following variables:
US 3-month T-bill
UK 3-month T-bill
US CPI
UK CPI
Gold Price
Crude Oil Price
S&P 500 Change
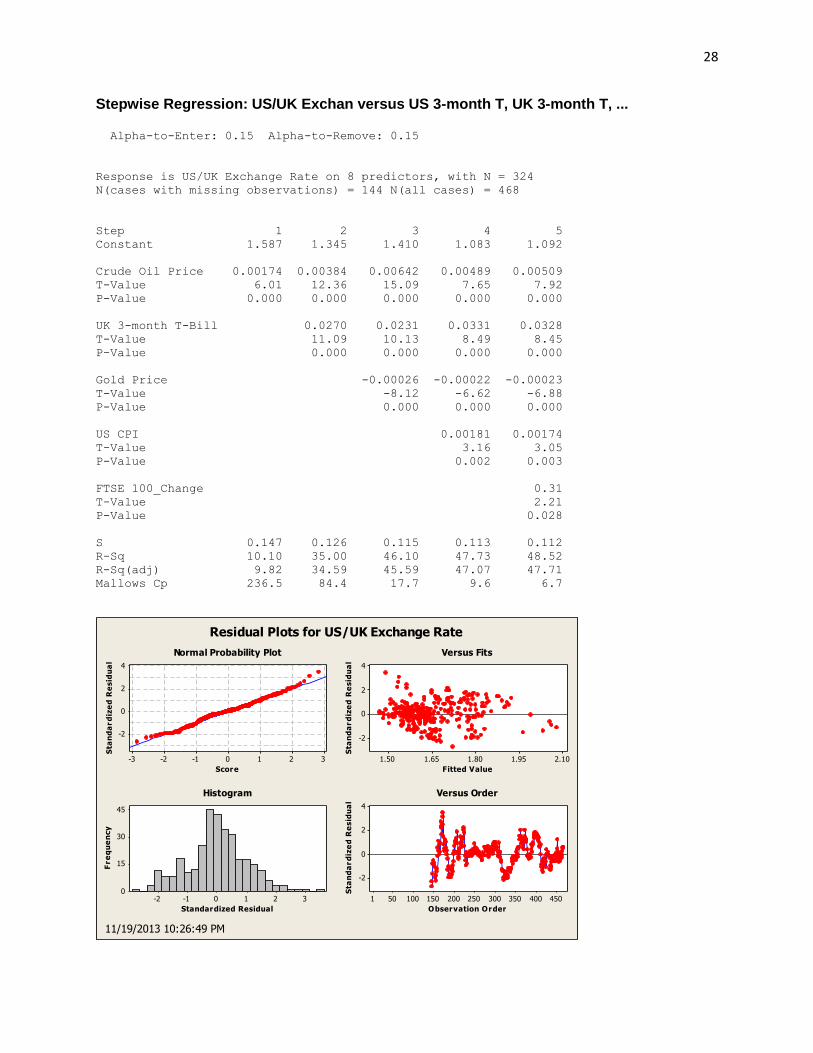
FTSE 100 Change Regression Analysis: US/UK Exchan versus US 3-month T, UK 3-month T, ... The regression equation is
US/UK Exchange Rate = 1.12 - 0.00594 US 3-month T-Bill
+ 0.0353 UK 3-month T-Bill + 0.00314 US CPI
- 0.00315 UK CPI - 0.000221 Gold Price
+ 0.00474 Crude Oil Price + 0.232 S&P 500_Change
+ 0.286 FTSE 100_Change
324 cases used, 144 cases contain missing values
Predictor Coef SE Coef T P
Constant 1.1204 0.1082 10.36 0.000
US 3-month T-Bill -0.005943 0.005692 -1.04 0.297
UK 3-month T-Bill 0.035261 0.004784 7.37 0.000
US CPI 0.003140 0.001558 2.01 0.045
UK CPI -0.003150 0.003243 -0.97 0.332
Gold Price -0.00022082 0.00003758 -5.88 0.000
Crude Oil Price 0.0047361 0.0007525 6.29 0.000
S&P 500_Change 0.2324 0.1710 1.36 0.175
FTSE 100_Change 0.2855 0.1400 2.04 0.042
S = 0.112194 R-Sq = 49.1% R-Sq(adj) = 47.8%
Analysis of Variance
Source DF SS MS F P
Regression 8 3.82691 0.47836 38.00 0.000
Residual Error 315 3.96507 0.01259
Total 323 7.79198
Source DF Seq SS
US 3-month T-Bill 1 0.08862
UK 3-month T-Bill 1 0.38466
US CPI 1 2.47597
UK CPI 1 0.31082
Gold Price 1 0.02677
Crude Oil Price 1 0.45649
S&P 500_Change 1 0.03122
FTSE 100_Change 1 0.05237
26
Unusual Observations
US/UK
US 3-month Exchange
Obs T-Bill Rate Fit SE Fit Residual St Resid
145 7.1 1.42440 1.72344 0.01784 -0.29904 -2.70R
146 7.1 1.42970 1.68234 0.02024 -0.25264 -2.29R
155 5.3 1.42380 1.66677 0.02145 -0.24297 -2.21R
163 5.7 1.60900 1.52529 0.04242 0.08371 0.81 X
167 5.7 1.77540 1.53072 0.03008 0.24468 2.26R
168 5.8 1.82880 1.53442 0.02112 0.29438 2.67R
169 5.8 1.80090 1.56389 0.02124 0.23701 2.15R
171 5.7 1.83300 1.56389 0.02056 0.26911 2.44R
172 5.9 1.87820 1.53729 0.02062 0.34091 3.09R
173 6.3 1.86950 1.49152 0.02512 0.37798 3.46R
224 3.1 1.94340 1.70466 0.02171 0.23874 2.17R
321 6.0 1.43360 1.67678 0.01624 -0.24318 -2.19R
323 6.2 1.42580 1.65631 0.01905 -0.23051 -2.08R
329 3.6 1.42650 1.65166 0.01608 -0.22516 -2.03R
331 3.5 1.41480 1.64049 0.01262 -0.22569 -2.02R
413 1.7 1.96500 2.08056 0.03671 -0.11556 -1.09 X
414 1.9 1.96640 2.06227 0.04142 -0.09587 -0.92 X
415 1.6 1.98880 2.05666 0.03871 -0.06786 -0.64 X
418 0.7 1.68620 1.73755 0.03749 -0.05135 -0.49 X
R denotes an observation with a large standardized residual.
X denotes an observation whose X value gives it large leverage.
Correlations: US/UK Exchan, US 3-month T, UK 3-month T, US CPI, UK CPI, ... US/UK Exchange R US 3-month T-Bil UK 3-month T-Bil
US 3-month T-Bil 0.336
0.000
UK 3-month T-Bil 0.379 0.843
0.000 0.000
US CPI -0.378 -0.735 -0.806
0.000 0.000 0.000
UK CPI -0.438 -0.723 -0.788
0.000 0.000 0.000
Gold Price -0.110 -0.471 -0.561
0.018 0.000 0.000
Crude Oil Price 0.318 -0.631 -0.611
0.000 0.000 0.000
S&P 500_Change -0.021 -0.015 0.027
0.651 0.754 0.555
FTSE 100_Change -0.018 0.065 0.053
0.733 0.228 0.320
US CPI UK CPI Gold Price
UK CPI 0.992
0.000
Gold Price 0.654 0.621
0.000 0.000
27
Crude Oil Price 0.842 0.793 0.840
0.000 0.000 0.000
S&P 500_Change -0.024 -0.007 -0.003
0.610 0.875 0.951
FTSE 100_Change -0.084 -0.078 -0.034
0.117 0.148 0.531
Crude Oil Price S&P 500_Change
S&P 500_Change -0.097
0.081
FTSE 100_Change -0.100 0.137
0.072 0.011
Cell Contents: Pearson correlation
P-Value
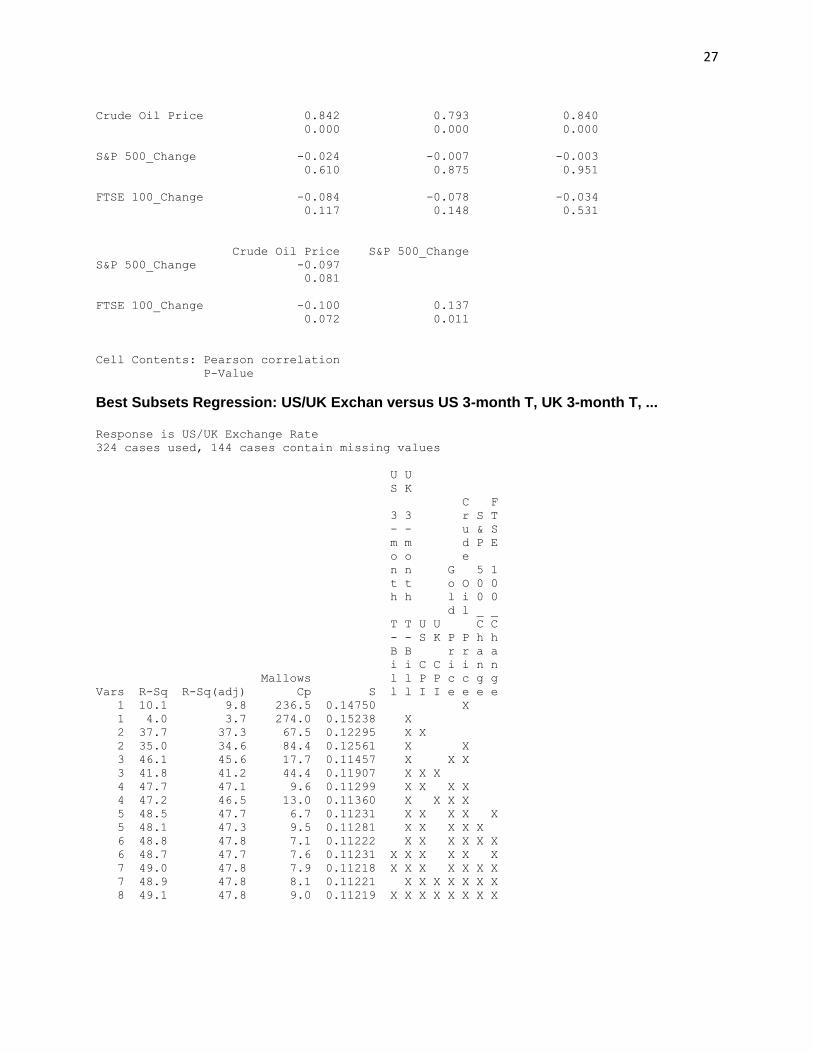
Best Subsets Regression: US/UK Exchan versus US 3-month T, UK 3-month T, ... Response is US/UK Exchange Rate
324 cases used, 144 cases contain missing values
U U
S K
C F
3 3 r S T
- - u & S
m m d P E
o o e
n n G 5 1
t t o O 0 0
h h l i 0 0
d l _ _
T T U U C C
- - S K P P h h
B B r r a a
i i C C i i n n
Mallows l l P P c c g g
Vars R-Sq R-Sq(adj) Cp S l l I I e e e e
1 10.1 9.8 236.5 0.14750 X
1 4.0 3.7 274.0 0.15238 X
2 37.7 37.3 67.5 0.12295 X X
2 35.0 34.6 84.4 0.12561 X X
3 46.1 45.6 17.7 0.11457 X X X
3 41.8 41.2 44.4 0.11907 X X X
4 47.7 47.1 9.6 0.11299 X X X X
4 47.2 46.5 13.0 0.11360 X X X X
5 48.5 47.7 6.7 0.11231 X X X X X
5 48.1 47.3 9.5 0.11281 X X X X X
6 48.8 47.8 7.1 0.11222 X X X X X X
6 48.7 47.7 7.6 0.11231 X X X X X X
7 49.0 47.8 7.9 0.11218 X X X X X X X
7 48.9 47.8 8.1 0.11221 X X X X X X X
8 49.1 47.8 9.0 0.11219 X X X X X X X X
28
Stepwise Regression: US/UK Exchan versus US 3-month T, UK 3-month T, ... Alpha-to-Enter: 0.15 Alpha-to-Remove: 0.15
Response is US/UK Exchange Rate on 8 predictors, with N = 324
N(cases with missing observations) = 144 N(all cases) = 468
Step 1 2 3 4 5
Constant 1.587 1.345 1.410 1.083 1.092
Crude Oil Price 0.00174 0.00384 0.00642 0.00489 0.00509
T-Value 6.01 12.36 15.09 7.65 7.92
P-Value 0.000 0.000 0.000 0.000 0.000
UK 3-month T-Bill 0.0270 0.0231 0.0331 0.0328
T-Value 11.09 10.13 8.49 8.45
P-Value 0.000 0.000 0.000 0.000
Gold Price -0.00026 -0.00022 -0.00023
T-Value -8.12 -6.62 -6.88
P-Value 0.000 0.000 0.000
US CPI 0.00181 0.00174
T-Value 3.16 3.05
P-Value 0.002 0.003
FTSE 100_Change 0.31
T-Value 2.21
P-Value 0.028
S 0.147 0.126 0.115 0.113 0.112
R-Sq 10.10 35.00 46.10 47.73 48.52
R-Sq(adj) 9.82 34.59 45.59 47.07 47.71
Mallows Cp 236.5 84.4 17.7 9.6 6.7
4
2
0
-2
3210-1-2-3
Sta
nd
ard
ize
d R
esid
ua
l
Score
2.101.951.801.651.50
4
2
0
-2
Fitted Value
Sta
nd
ard
ize
d R
esid
ua
l
3210-1-2
45
30
15
0
Standardized Residual
Fre
qu
en
cy
450400350300250200150100501
4
2
0
-2
Observation Order
Sta
nd
ard
ize
d R
esid
ua
l
Normal Probability Plot Versus Fits
Histogram Versus Order
Residual Plots for US/UK Exchange Rate
11/19/2013 10:26:49 PM

29
Model 1B: US/UK Exchange Rate against the following variables:
US 10-year treasury rate
UK 10-year treasury rate
US CPI
UK CPI
Gold Price
Crude Oil Price
S&P 500 Change
FTSE 100 Change
Regression Analysis: Error versus US CPI, UK CPI, ... The regression equation is
Error = 0.294 - 0.00130 US CPI - 0.00100 UK CPI - 0.000027 Gold Price
+ 0.00140 Crude Oil Price - 0.0421 S&P 500_Change
+ 0.103 FTSE 100_Change
324 cases used, 144 cases contain missing values
Predictor Coef SE Coef T P
Constant 0.29449 0.02337 12.60 0.000
US CPI -0.0012962 0.0007932 -1.63 0.103
UK CPI -0.000998 0.001674 -0.60 0.551
Gold Price -0.00002748 0.00001841 -1.49 0.136
Crude Oil Price 0.0014035 0.0003603 3.89 0.000
S&P 500_Change -0.04212 0.08876 -0.47 0.635
FTSE 100_Change 0.10259 0.07275 1.41 0.159
S = 0.0583422 R-Sq = 31.6% R-Sq(adj) = 30.3%
Analysis of Variance
Source DF SS MS F P
Regression 6 0.498133 0.083022 24.39 0.000
Residual Error 317 1.079007 0.003404
Total 323 1.577141
Source DF Seq SS
US CPI 1 0.379632
UK CPI 1 0.046001
Gold Price 1 0.017450
Crude Oil Price 1 0.047908
S&P 500_Change 1 0.000373
FTSE 100_Change 1 0.006769
Unusual Observations
Obs US CPI Error Fit SE Fit Residual St Resid
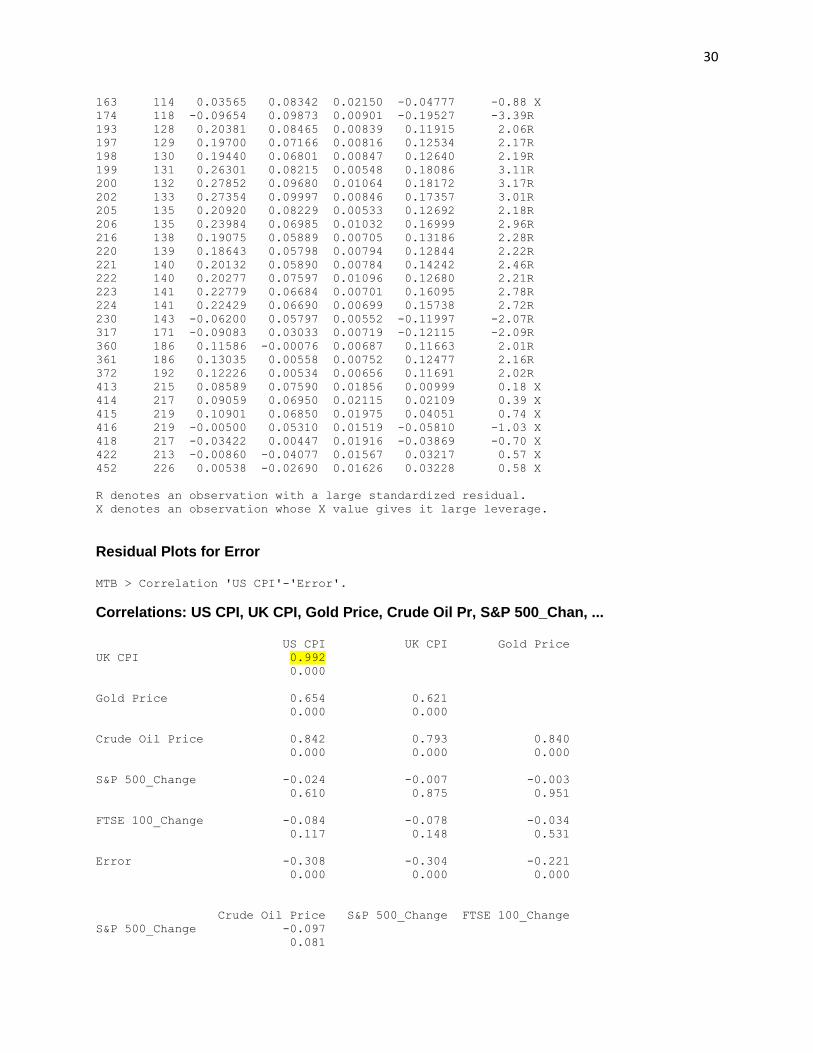
30
163 114 0.03565 0.08342 0.02150 -0.04777 -0.88 X
174 118 -0.09654 0.09873 0.00901 -0.19527 -3.39R
193 128 0.20381 0.08465 0.00839 0.11915 2.06R
197 129 0.19700 0.07166 0.00816 0.12534 2.17R
198 130 0.19440 0.06801 0.00847 0.12640 2.19R
199 131 0.26301 0.08215 0.00548 0.18086 3.11R
200 132 0.27852 0.09680 0.01064 0.18172 3.17R
202 133 0.27354 0.09997 0.00846 0.17357 3.01R
205 135 0.20920 0.08229 0.00533 0.12692 2.18R
206 135 0.23984 0.06985 0.01032 0.16999 2.96R
216 138 0.19075 0.05889 0.00705 0.13186 2.28R
220 139 0.18643 0.05798 0.00794 0.12844 2.22R
221 140 0.20132 0.05890 0.00784 0.14242 2.46R
222 140 0.20277 0.07597 0.01096 0.12680 2.21R
223 141 0.22779 0.06684 0.00701 0.16095 2.78R
224 141 0.22429 0.06690 0.00699 0.15738 2.72R
230 143 -0.06200 0.05797 0.00552 -0.11997 -2.07R
317 171 -0.09083 0.03033 0.00719 -0.12115 -2.09R
360 186 0.11586 -0.00076 0.00687 0.11663 2.01R
361 186 0.13035 0.00558 0.00752 0.12477 2.16R
372 192 0.12226 0.00534 0.00656 0.11691 2.02R
413 215 0.08589 0.07590 0.01856 0.00999 0.18 X
414 217 0.09059 0.06950 0.02115 0.02109 0.39 X
415 219 0.10901 0.06850 0.01975 0.04051 0.74 X
416 219 -0.00500 0.05310 0.01519 -0.05810 -1.03 X
418 217 -0.03422 0.00447 0.01916 -0.03869 -0.70 X
422 213 -0.00860 -0.04077 0.01567 0.03217 0.57 X
452 226 0.00538 -0.02690 0.01626 0.03228 0.58 X
R denotes an observation with a large standardized residual.
X denotes an observation whose X value gives it large leverage.
Residual Plots for Error MTB > Correlation 'US CPI'-'Error'.
Correlations: US CPI, UK CPI, Gold Price, Crude Oil Pr, S&P 500_Chan, ... US CPI UK CPI Gold Price
UK CPI 0.992
0.000
Gold Price 0.654 0.621
0.000 0.000
Crude Oil Price 0.842 0.793 0.840
0.000 0.000 0.000
S&P 500_Change -0.024 -0.007 -0.003
0.610 0.875 0.951
FTSE 100_Change -0.084 -0.078 -0.034
0.117 0.148 0.531
Error -0.308 -0.304 -0.221
0.000 0.000 0.000
Crude Oil Price S&P 500_Change FTSE 100_Change
S&P 500_Change -0.097
0.081
31
FTSE 100_Change -0.100 0.137
0.072 0.011
Error -0.280 0.095 0.056
0.000 0.041 0.299
Cell Contents: Pearson correlation
P-Value
MTB > BReg 'Error' 'US CPI'-'FTSE 100_Change' ;
SUBC> NVars 1 6;
SUBC> Best 2;
SUBC> Constant.
Best Subsets Regression: Error versus US CPI, UK CPI, ... Response is Error
324 cases used, 144 cases contain missing values
C F
r S T
u & S
d P E
e
G 5 1
o O 0 0
l i 0 0
d l _ _
U U C C
S K P P h h
r r a a
C C i i n n
Mallows P P c c g g
Vars R-Sq R-Sq(adj) Cp S I I e e e e
1 26.2 26.0 21.8 0.060106 X
1 24.1 23.8 31.8 0.060983 X
2 30.5 30.1 3.9 0.058425 X X
2 30.2 29.7 5.5 0.058569 X X
3 31.0 30.4 3.6 0.058304 X X X
3 30.8 30.2 4.5 0.058385 X X X
4 31.5 30.6 3.6 0.058216 X X X X
4 31.1 30.3 5.1 0.058351 X X X X
5 31.5 30.5 5.2 0.058271 X X X X X
5 31.5 30.4 5.4 0.058283 X X X X X
6 31.6 30.3 7.0 0.058342 X X X X X X
32
2
0
-2
-4
3210-1-2-3
Sta
nd
ard
ize
d R
esid
ua
l
Score
0.100.050.00-0.05
2
0
-2
-4
Fitted Value
Sta
nd
ard
ize
d R
esid
ua
l
2.41.20.0-1.2-2.4
60
40
20
0
Standardized Residual
Fre
qu
en
cy
450400350300250200150100501
2
0
-2
-4
Observation Order
Sta
nd
ard
ize
d R
esid
ua
l
Normal Probability Plot Versus Fits
Histogram Versus Order
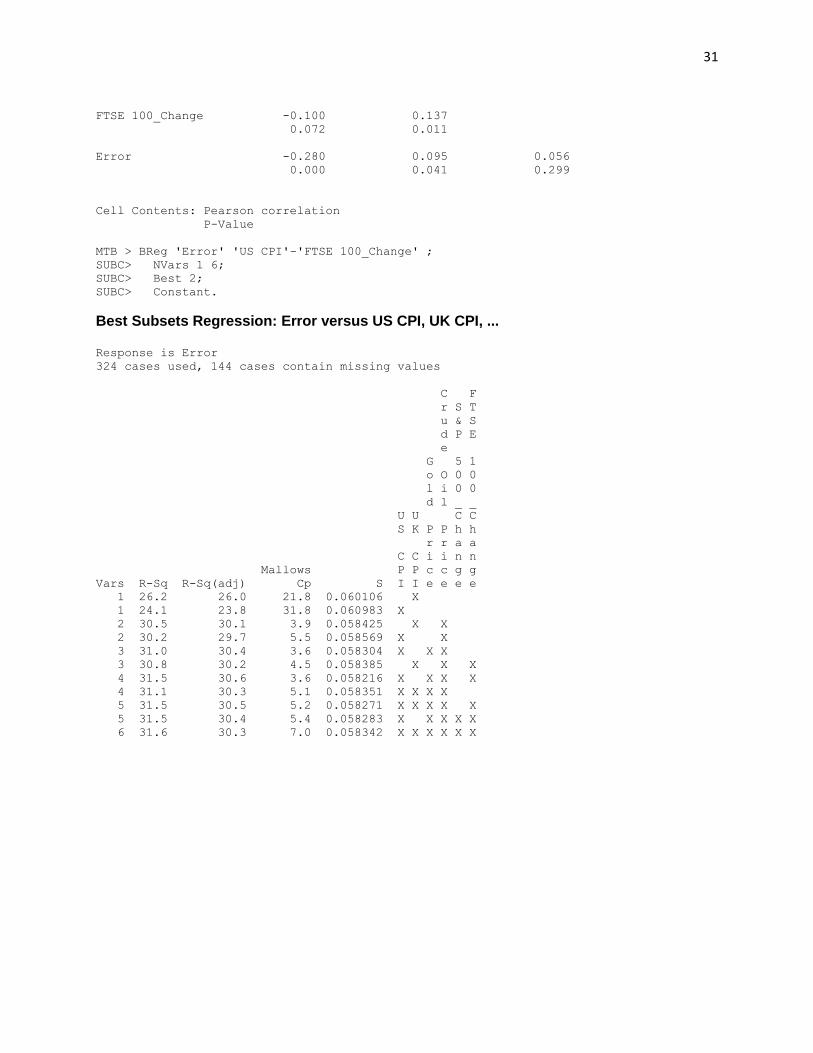
Residual Plots for Error
11/19/2013 11:30:36 PM
Model 2A: US/UK Exchange Rate Error against the following variables:
US 3-month T-bill
UK 3-month T-bill
US CPI
UK CPI
Gold Price
Crude Oil Price
S&P 500 Change
FTSE 100 Change
Regression Analysis: Error versus US 3-month T, UK 3-month T, ... The regression equation is
Error = - 0.0396 - 0.0299 US 3-month T-Bill + 0.0299 UK 3-month T-Bill
- 0.000567 US CPI + 0.00127 UK CPI - 0.000010 Gold Price
+ 0.000260 Crude Oil Price + 0.0107 S&P 500_Change
+ 0.0926 FTSE 100_Change
324 cases used, 144 cases contain missing values
Predictor Coef SE Coef T P
Constant -0.03961 0.03978 -1.00 0.320
US 3-month T-Bill -0.029930 0.002093 -14.30 0.000
UK 3-month T-Bill 0.029927 0.001759 17.02 0.000
US CPI -0.0005670 0.0005728 -0.99 0.323
UK CPI 0.001275 0.001192 1.07 0.286
Gold Price -0.00000981 0.00001382 -0.71 0.478
Crude Oil Price 0.0002599 0.0002766 0.94 0.348
33
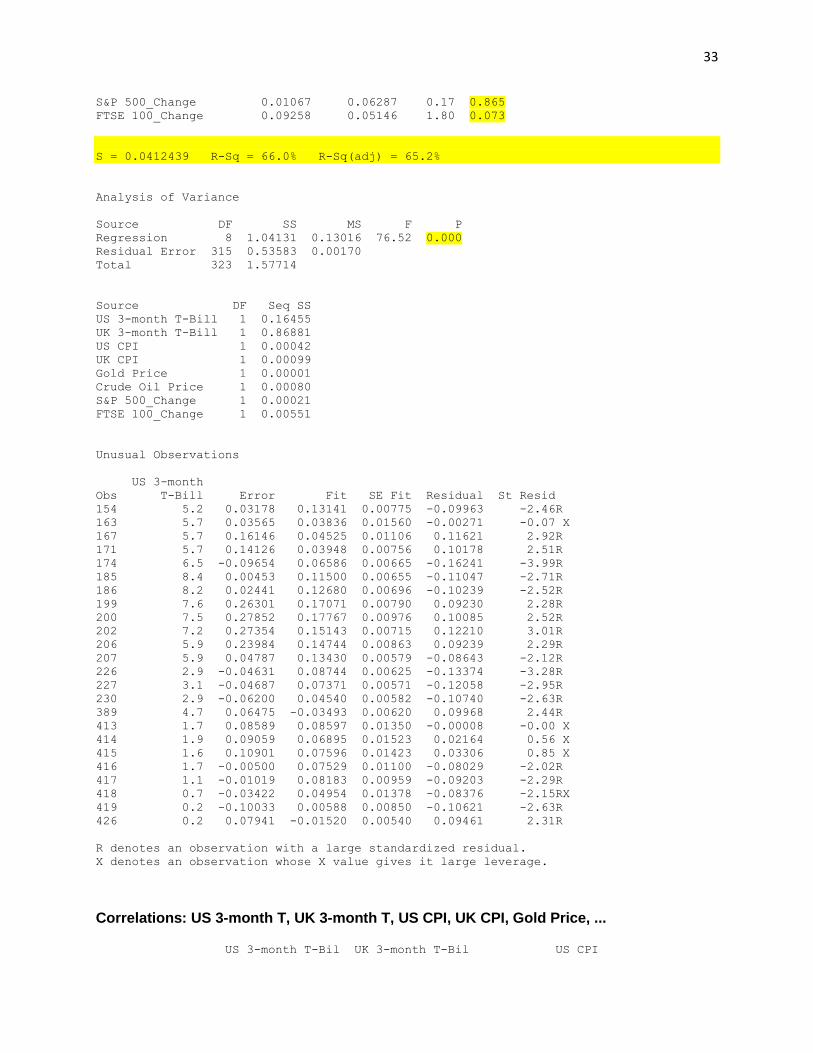
S&P 500_Change 0.01067 0.06287 0.17 0.865
FTSE 100_Change 0.09258 0.05146 1.80 0.073
S = 0.0412439 R-Sq = 66.0% R-Sq(adj) = 65.2%
Analysis of Variance
Source DF SS MS F P
Regression 8 1.04131 0.13016 76.52 0.000
Residual Error 315 0.53583 0.00170
Total 323 1.57714
Source DF Seq SS
US 3-month T-Bill 1 0.16455
UK 3-month T-Bill 1 0.86881
US CPI 1 0.00042
UK CPI 1 0.00099
Gold Price 1 0.00001
Crude Oil Price 1 0.00080
S&P 500_Change 1 0.00021
FTSE 100_Change 1 0.00551
Unusual Observations
US 3-month
Obs T-Bill Error Fit SE Fit Residual St Resid
154 5.2 0.03178 0.13141 0.00775 -0.09963 -2.46R
163 5.7 0.03565 0.03836 0.01560 -0.00271 -0.07 X
167 5.7 0.16146 0.04525 0.01106 0.11621 2.92R
171 5.7 0.14126 0.03948 0.00756 0.10178 2.51R
174 6.5 -0.09654 0.06586 0.00665 -0.16241 -3.99R
185 8.4 0.00453 0.11500 0.00655 -0.11047 -2.71R
186 8.2 0.02441 0.12680 0.00696 -0.10239 -2.52R
199 7.6 0.26301 0.17071 0.00790 0.09230 2.28R
200 7.5 0.27852 0.17767 0.00976 0.10085 2.52R
202 7.2 0.27354 0.15143 0.00715 0.12210 3.01R
206 5.9 0.23984 0.14744 0.00863 0.09239 2.29R
207 5.9 0.04787 0.13430 0.00579 -0.08643 -2.12R
226 2.9 -0.04631 0.08744 0.00625 -0.13374 -3.28R
227 3.1 -0.04687 0.07371 0.00571 -0.12058 -2.95R
230 2.9 -0.06200 0.04540 0.00582 -0.10740 -2.63R
389 4.7 0.06475 -0.03493 0.00620 0.09968 2.44R
413 1.7 0.08589 0.08597 0.01350 -0.00008 -0.00 X
414 1.9 0.09059 0.06895 0.01523 0.02164 0.56 X
415 1.6 0.10901 0.07596 0.01423 0.03306 0.85 X
416 1.7 -0.00500 0.07529 0.01100 -0.08029 -2.02R
417 1.1 -0.01019 0.08183 0.00959 -0.09203 -2.29R
418 0.7 -0.03422 0.04954 0.01378 -0.08376 -2.15RX
419 0.2 -0.10033 0.00588 0.00850 -0.10621 -2.63R
426 0.2 0.07941 -0.01520 0.00540 0.09461 2.31R
R denotes an observation with a large standardized residual.
X denotes an observation whose X value gives it large leverage.
Correlations: US 3-month T, UK 3-month T, US CPI, UK CPI, Gold Price, ... US 3-month T-Bil UK 3-month T-Bil US CPI

34
UK 3-month T-Bil 0.843
0.000
US CPI -0.735 -0.806
0.000 0.000
UK CPI -0.723 -0.788 0.992
0.000 0.000 0.000
Gold Price -0.471 -0.561 0.654
0.000 0.000 0.000
Crude Oil Price -0.631 -0.611 0.842
0.000 0.000 0.000
S&P 500_Change -0.015 0.027 -0.024
0.754 0.555 0.610
FTSE 100_Change 0.065 0.053 -0.084
0.228 0.320 0.117
Error -0.013 0.418 -0.308
0.783 0.000 0.000
UK CPI Gold Price Crude Oil Price
Gold Price 0.621
0.000
Crude Oil Price 0.793 0.840
0.000 0.000
S&P 500_Change -0.007 -0.003 -0.097
0.875 0.951 0.081
FTSE 100_Change -0.078 -0.034 -0.100
0.148 0.531 0.072
Error -0.304 -0.221 -0.280
0.000 0.000 0.000
S&P 500_Change FTSE 100_Change
FTSE 100_Change 0.137
0.011
Error 0.095 0.056
0.041 0.299
Cell Contents: Pearson correlation
P-Value
Stepwise Regression: Error versus US 3-month T, UK 3-month T, ... Alpha-to-Enter: 0.15 Alpha-to-Remove: 0.15
Response is Error on 8 predictors, with N = 324
N(cases with missing observations) = 144 N(all cases) = 468
Step 1 2 3

35
Constant -0.03848 -0.02668 -0.02686
UK 3-month T-Bill 0.01240 0.02952 0.02954
T-Value 15.05 22.65 22.73
P-Value 0.000 0.000 0.000
US 3-month T-Bill -0.0300 -0.0301
T-Value -15.02 -15.11
P-Value 0.000 0.000
FTSE 100_Change 0.086
T-Value 1.71
P-Value 0.088
S 0.0536 0.0412 0.0410
R-Sq 41.29 65.52 65.83
R-Sq(adj) 41.10 65.31 65.51
Mallows Cp 224.4 1.7 0.8
Best Subsets Regression: Error versus US 3-month T, UK 3-month T, ... Response is Error
324 cases used, 144 cases contain missing values
U U
S K
C F
3 3 r S T
- - u & S
m m d P E
o o e
n n G 5 1
t t o O 0 0
h h l i 0 0
d l _ _
T T U U C C
- - S K P P h h
B B r r a a
i i C C i i n n
Mallows l l P P c c g g
Vars R-Sq R-Sq(adj) Cp S l l I I e e e e
1 41.3 41.1 224.4 0.053626 X
1 26.2 26.0 363.9 0.060106 X
2 65.5 65.3 1.7 0.041158 X X
2 43.3 43.0 207.5 0.052770 X X
3 65.8 65.5 0.8 0.041035 X X X
3 65.6 65.3 3.2 0.041190 X X X
4 65.9 65.5 2.1 0.041058 X X X X
4 65.9 65.5 2.3 0.041067 X X X X
5 65.9 65.4 3.9 0.041108 X X X X X
5 65.9 65.4 4.1 0.041119 X X X X X
6 66.0 65.3 5.5 0.041148 X X X X X X
6 65.9 65.3 5.9 0.041171 X X X X X X
7 66.0 65.3 7.0 0.041180 X X X X X X X
7 66.0 65.2 7.5 0.041212 X X X X X X X
8 66.0 65.2 9.0 0.041244 X X X X X X X X
36
2
0
-2
-4
3210-1-2-3
Sta
nd
ard
ize
d R
esid
ua
l
Score
0.150.100.050.00-0.05
2
0
-2
-4
Fitted Value
Sta
nd
ard
ize
d R
esid
ua
l
3210-1-2-3-4
75
50
25
0
Standardized Residual
Fre
qu
en
cy
450400350300250200150100501
2
0
-2
-4
Observation Order
Sta
nd
ard
ize
d R
esid
ua
l
Normal Probability Plot Versus Fits
Histogram Versus Order
Residual Plots for Error
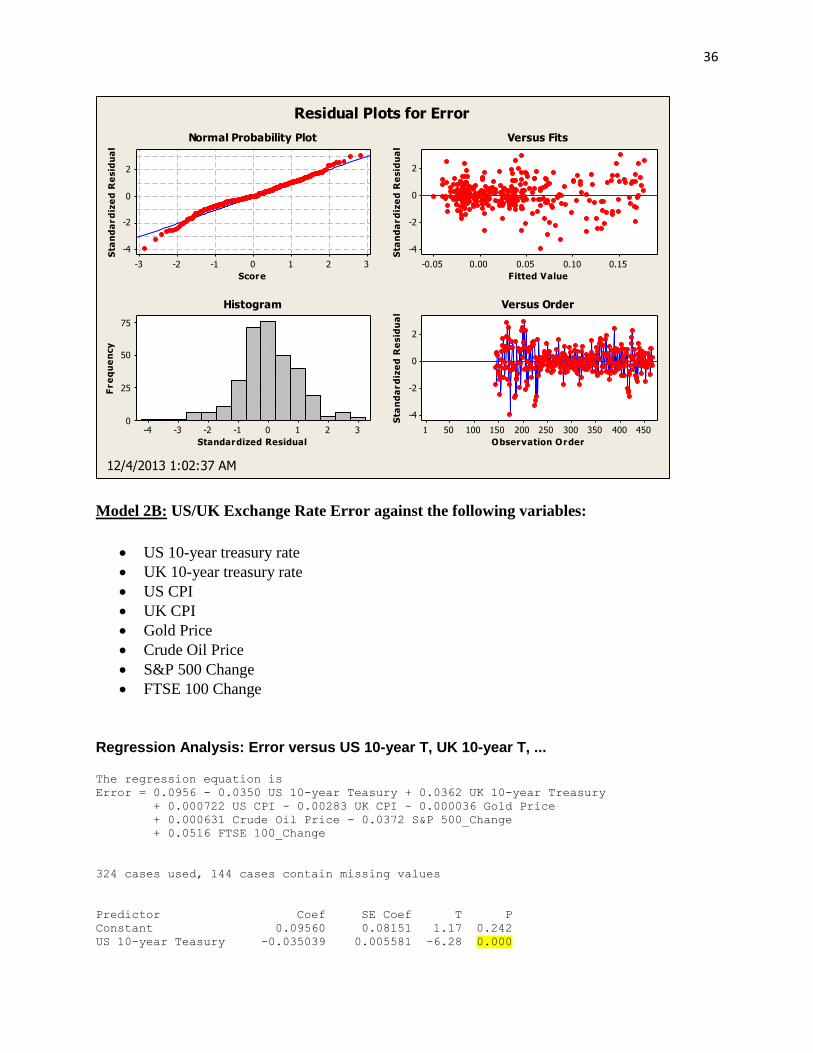
12/4/2013 1:02:37 AM
Model 2B: US/UK Exchange Rate Error against the following variables:
US 10-year treasury rate
UK 10-year treasury rate
US CPI
UK CPI
Gold Price
Crude Oil Price
S&P 500 Change
FTSE 100 Change
Regression Analysis: Error versus US 10-year T, UK 10-year T, ... The regression equation is
Error = 0.0956 - 0.0350 US 10-year Teasury + 0.0362 UK 10-year Treasury
+ 0.000722 US CPI - 0.00283 UK CPI - 0.000036 Gold Price
+ 0.000631 Crude Oil Price - 0.0372 S&P 500_Change
+ 0.0516 FTSE 100_Change
324 cases used, 144 cases contain missing values
Predictor Coef SE Coef T P
Constant 0.09560 0.08151 1.17 0.242
US 10-year Teasury -0.035039 0.005581 -6.28 0.000
37
UK 10-year Treasury 0.036227 0.004113 8.81 0.000
US CPI 0.0007221 0.0008258 0.87 0.383
UK CPI -0.002834 0.001518 -1.87 0.063
Gold Price -0.00003564 0.00001723 -2.07 0.039
Crude Oil Price 0.0006313 0.0003625 1.74 0.083
S&P 500_Change -0.03724 0.07980 -0.47 0.641
FTSE 100_Change 0.05163 0.06544 0.79 0.431
S = 0.0522833 R-Sq = 45.4% R-Sq(adj) = 44.0%
Analysis of Variance
Source DF SS MS F P
Regression 8 0.716073 0.089509 32.74 0.000
Residual Error 315 0.861067 0.002734
Total 323 1.577141
Source DF Seq SS
US 10-year Teasury 1 0.353919
UK 10-year Treasury 1 0.309516
US CPI 1 0.000264
UK CPI 1 0.039130
Gold Price 1 0.003745
Crude Oil Price 1 0.007389
S&P 500_Change 1 0.000409
FTSE 100_Change 1 0.001701
Unusual Observations
US 10-year
Obs Teasury Error Fit SE Fit Residual St Resid
154 7.4 0.03178 0.16274 0.01171 -0.13096 -2.57R
163 8.4 0.03565 0.05014 0.01969 -0.01449 -0.30 X
167 8.9 0.16146 0.04873 0.01462 0.11273 2.25R
174 8.9 -0.09654 0.04970 0.01004 -0.14625 -2.85R
179 9.0 0.16494 0.05912 0.00891 0.10582 2.05R
199 8.5 0.26301 0.14558 0.00985 0.11744 2.29R
200 8.8 0.27852 0.15416 0.01244 0.12437 2.45R
202 8.7 0.27354 0.14053 0.00968 0.13301 2.59R
206 7.8 0.23984 0.09796 0.01019 0.14188 2.77R
220 7.5 0.18643 0.07546 0.00747 0.11097 2.14R
221 7.4 0.20132 0.06371 0.00707 0.13761 2.66R
222 7.3 0.20277 0.08118 0.00984 0.12158 2.37R
223 6.8 0.22779 0.08940 0.00690 0.13838 2.67R
224 6.6 0.22429 0.10986 0.00816 0.11443 2.22R
226 6.6 -0.04631 0.08184 0.00695 -0.12815 -2.47R
230 6.3 -0.06200 0.06822 0.00609 -0.13022 -2.51R
361 4.2 0.13035 0.02435 0.00721 0.10601 2.05R
372 4.2 0.12226 0.01437 0.00602 0.10789 2.08R
413 3.9 0.08589 0.07204 0.01710 0.01384 0.28 X
414 4.1 0.09059 0.07563 0.01930 0.01497 0.31 X
415 4.0 0.10901 0.07379 0.01802 0.03522 0.72 X
418 3.8 -0.03422 0.03604 0.01757 -0.07026 -1.43 X
419 3.5 -0.10033 0.01648 0.01147 -0.11681 -2.29R
422 2.9 -0.00860 0.00697 0.01517 -0.01557 -0.31 X
R denotes an observation with a large standardized residual.
X denotes an observation whose X value gives it large leverage.

38
Correlations: US 10-year T, UK 10-year T, US CPI, UK CPI, Gold Price, ... US 10-year Teasu UK 10-year Treas US CPI
UK 10-year Treas 0.865
0.000
US CPI -0.776 -0.942
0.000 0.000
UK CPI -0.753 -0.935 0.992
0.000 0.000 0.000
Gold Price -0.485 -0.557 0.654
0.000 0.000 0.000
Crude Oil Price -0.728 -0.672 0.842
0.000 0.000 0.000
S&P 500_Change 0.002 -0.001 -0.024
0.963 0.985 0.610
FTSE 100_Change 0.064 0.079 -0.084
0.234 0.143 0.117
Error 0.035 0.308 -0.308
0.444 0.000 0.000
UK CPI Gold Price Crude Oil Price
Gold Price 0.621
0.000
Crude Oil Price 0.793 0.840
0.000 0.000
S&P 500_Change -0.007 -0.003 -0.097
0.875 0.951 0.081
FTSE 100_Change -0.078 -0.034 -0.100
0.148 0.531 0.072
Error -0.304 -0.221 -0.280
0.000 0.000 0.000
S&P 500_Change FTSE 100_Change
FTSE 100_Change 0.137
0.011
Error 0.095 0.056
0.041 0.299
Cell Contents: Pearson correlation
P-Value
Stepwise Regression: Error versus US 10-year T, UK 10-year T, ... Alpha-to-Enter: 0.15 Alpha-to-Remove: 0.15

39
Response is Error on 8 predictors, with N = 324
N(cases with missing observations) = 144 N(all cases) = 468
Step 1 2 3 4
Constant -0.06663 -0.03444 0.06841 0.04192
UK 10-year Treasury 0.0157 0.0367 0.0350 0.0368
T-Value 13.14 10.43 9.50 10.06
P-Value 0.000 0.000 0.000 0.000
US 10-year Teasury -0.0298 -0.0339 -0.0325
T-Value -6.30 -6.22 -6.06
P-Value 0.000 0.000 0.000
UK CPI -0.00087 -0.00456
T-Value -1.50 -3.78
P-Value 0.136 0.000
US CPI 0.00177
T-Value 3.47
P-Value 0.001
S 0.0565 0.0534 0.0532 0.0524
R-Sq 34.90 42.07 42.47 44.56
R-Sq(adj) 34.70 41.70 41.93 43.87
Mallows Cp 55.6 16.3 15.9 5.8
Best Subsets Regression: Error versus US 10-year T, UK 10-year T, ... Response is Error
324 cases used, 144 cases contain missing values
U
U K
S
1
1 0 C F
0 - r S T
- y u & S
y e d P E
e a e
a r G 5 1
r o O 0 0
T l i 0 0
T r d l _ _
e e U U C C
a a S K P P h h
s s r r a a
u u C C i i n n
Mallows r r P P c c g g
Vars R-Sq R-Sq(adj) Cp S y y I I e e e e
1 34.9 34.7 55.6 0.056466 X
1 26.2 26.0 105.6 0.060106 X
2 42.1 41.7 16.3 0.053352 X X
2 37.4 37.0 43.2 0.055463 X X
3 42.5 41.9 15.9 0.053249 X X X
3 42.4 41.9 16.2 0.053273 X X X
4 44.6 43.9 5.8 0.052353 X X X X
4 44.1 43.4 8.6 0.052581 X X X X
5 45.1 44.2 4.7 0.052179 X X X X X

40
5 44.8 43.9 6.5 0.052322 X X X X X
6 45.3 44.2 5.8 0.052182 X X X X X X
6 45.2 44.2 6.1 0.052207 X X X X X X
7 45.4 44.2 7.2 0.052219 X X X X X X X
7 45.3 44.1 7.6 0.052252 X X X X X X X
8 45.4 44.0 9.0 0.052283 X X X X X X X X
4
2
0
-2
3210-1-2-3
Sta
nd
ard
ize
d R
esid
ua
l
Score
0.150.100.050.00-0.05
2
0
-2
Fitted Value
Sta
nd
ard
ize
d R
esid
ua
l
2.251.500.750.00-0.75-1.50-2.25
40
20
0
Standardized Residual
Fre
qu
en
cy
450400350300250200150100501
2
0
-2
Observation Order
Sta
nd
ard
ize
d R
esid
ua
l
Normal Probability Plot Versus Fits
Histogram Versus Order
Residual Plots for Error
12/4/2013 1:05:11 AM
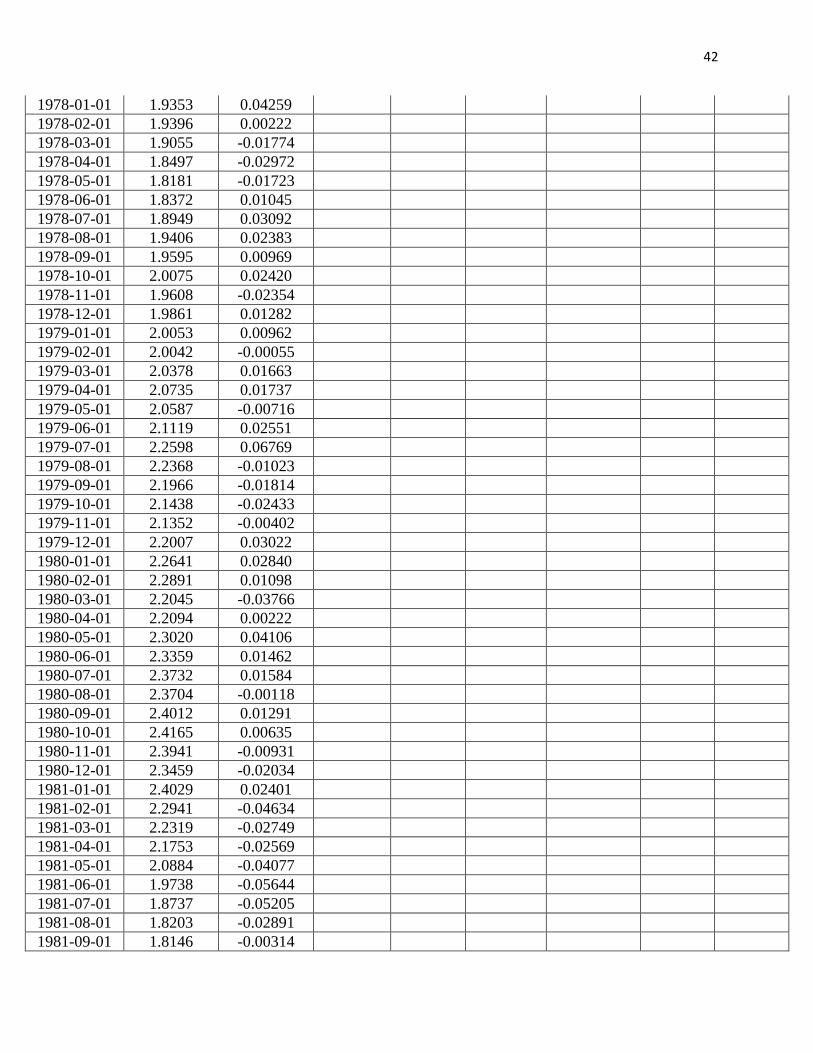
Model 3:
Observation
US/UK
Exchange
Rate
Exchange
Rate
Returns
Intercept Slope
Predicted
Exchange
Rate
Returns
Forecasting
Error
Squared
Error RSME
1974-01-01 2.2240 0.19387
1974-02-01 2.2749 0.02263
1974-03-01 2.3406 0.02847
41
1974-04-01 2.3886 0.02030
1974-05-01 2.4137 0.01045
1974-06-01 2.3902 -0.00978
1974-07-01 2.3896 -0.00025
1974-08-01 2.3456 -0.01858
1974-09-01 2.3165 -0.01248
1974-10-01 2.3330 0.00710
1974-11-01 2.3252 -0.00335
1974-12-01 2.3294 0.00180
1975-01-01 2.3623 0.01402
1975-02-01 2.3958 0.01408
1975-03-01 2.4180 0.00922
1975-04-01 2.3707 -0.01976
1975-05-01 2.3205 -0.02140
1975-06-01 2.2803 -0.01748
1975-07-01 2.1845 -0.04292
1975-08-01 2.1143 -0.03266
1975-09-01 2.0834 -0.01472
1975-10-01 2.0568 -0.01285
1975-11-01 2.0484 -0.00409
1975-12-01 2.0221 -0.01292
1976-01-01 2.0286 0.00321
1976-02-01 2.0262 -0.00118
1976-03-01 1.9428 -0.04203
1976-04-01 1.8463 -0.05095
1976-05-01 1.8079 -0.02102
1976-06-01 1.7640 -0.02458
1976-07-01 1.7850 0.01183
1976-08-01 1.7828 -0.00123
1976-09-01 1.7272 -0.03168
1976-10-01 1.6377 -0.05321
1976-11-01 1.6381 0.00024
1976-12-01 1.6784 0.02430
1977-01-01 1.7124 0.02005
1977-02-01 1.7103 -0.00123
1977-03-01 1.7174 0.00414
1977-04-01 1.7190 0.00093
1977-05-01 1.7185 -0.00029
1977-06-01 1.7191 0.00035
1977-07-01 1.7226 0.00203
1977-08-01 1.7397 0.00988
1977-09-01 1.7431 0.00195
1977-10-01 1.7711 0.01594
1977-11-01 1.8178 0.02603
1977-12-01 1.8546 0.02004
42
1978-01-01 1.9353 0.04259
1978-02-01 1.9396 0.00222
1978-03-01 1.9055 -0.01774
1978-04-01 1.8497 -0.02972
1978-05-01 1.8181 -0.01723
1978-06-01 1.8372 0.01045
1978-07-01 1.8949 0.03092
1978-08-01 1.9406 0.02383
1978-09-01 1.9595 0.00969
1978-10-01 2.0075 0.02420
1978-11-01 1.9608 -0.02354
1978-12-01 1.9861 0.01282
1979-01-01 2.0053 0.00962
1979-02-01 2.0042 -0.00055
1979-03-01 2.0378 0.01663
1979-04-01 2.0735 0.01737
1979-05-01 2.0587 -0.00716
1979-06-01 2.1119 0.02551
1979-07-01 2.2598 0.06769
1979-08-01 2.2368 -0.01023
1979-09-01 2.1966 -0.01814
1979-10-01 2.1438 -0.02433
1979-11-01 2.1352 -0.00402
1979-12-01 2.2007 0.03022
1980-01-01 2.2641 0.02840
1980-02-01 2.2891 0.01098
1980-03-01 2.2045 -0.03766
1980-04-01 2.2094 0.00222
1980-05-01 2.3020 0.04106
1980-06-01 2.3359 0.01462
1980-07-01 2.3732 0.01584
1980-08-01 2.3704 -0.00118
1980-09-01 2.4012 0.01291
1980-10-01 2.4165 0.00635
1980-11-01 2.3941 -0.00931
1980-12-01 2.3459 -0.02034
1981-01-01 2.4029 0.02401
1981-02-01 2.2941 -0.04634
1981-03-01 2.2319 -0.02749
1981-04-01 2.1753 -0.02569
1981-05-01 2.0884 -0.04077
1981-06-01 1.9738 -0.05644
1981-07-01 1.8737 -0.05205
1981-08-01 1.8203 -0.02891
1981-09-01 1.8146 -0.00314
43
1981-10-01 1.8407 0.01428
1981-11-01 1.9025 0.03302
1981-12-01 1.9033 0.00042
1982-01-01 1.8860 -0.00913
1982-02-01 1.8470 -0.02090
1982-03-01 1.8053 -0.02284
1982-04-01 1.7720 -0.01862
1982-05-01 1.8104 0.02144
1982-06-01 1.7563 -0.03034
1982-07-01 1.7354 -0.01197
1982-08-01 1.7250 -0.00601
1982-09-01 1.7120 -0.00756
1982-10-01 1.6962 -0.00927
1982-11-01 1.6321 -0.03852
1982-12-01 1.6160 -0.00991
1983-01-01 1.5756 -0.02532
1983-02-01 1.5329 -0.02747
1983-03-01 1.4900 -0.02839
1983-04-01 1.5361 0.03047
1983-05-01 1.5722 0.02323
1983-06-01 1.5480 -0.01551
1983-07-01 1.5273 -0.01346
1983-08-01 1.5026 -0.01630
1983-09-01 1.4986 -0.00267
1983-10-01 1.4969 -0.00114
1983-11-01 1.4766 -0.01365
1983-12-01 1.4338 -0.02941
1984-01-01 1.4076 -0.01844 -0.00230 0.47017 -0.01613 -0.00231 0.00001
1984-02-01 1.4417 0.02394 -0.00224 0.45305 -0.01060 0.03454 0.00119
1984-03-01 1.4557 0.00966 -0.00234 0.44835 0.00840 0.00127 0.00000
1984-04-01 1.4210 -0.02413 -0.00262 0.44084 0.00164 -0.02577 0.00066
1984-05-01 1.3894 -0.02249 -0.00257 0.44677 -0.01335 -0.00914 0.00008
1984-06-01 1.3770 -0.00896 -0.00260 0.44626 -0.01263 0.00367 0.00001
1984-07-01 1.3200 -0.04228 -0.00275 0.44996 -0.00678 -0.03549 0.00126
1984-08-01 1.3132 -0.00516 -0.00265 0.43959 -0.02123 0.01606 0.00026
1984-09-01 1.2563 -0.04430 -0.00309 0.44175 -0.00538 -0.03892 0.00151
1984-10-01 1.2196 -0.02965 -0.00310 0.44674 -0.02289 -0.00676 0.00005
1984-11-01 1.2392 0.01594 -0.00295 0.43424 -0.01582 0.03177 0.00101
1984-12-01 1.1861 -0.04380 -0.00358 0.41661 0.00306 -0.04686 0.00220
1985-01-01 1.1271 -0.05102 -0.00385 0.43005 -0.02268 -0.02834 0.00080
1985-02-01 1.0931 -0.03063 -0.00394 0.43114 -0.02594 -0.00469 0.00002
1985-03-01 1.1253 0.02903 -0.00346 0.41934 -0.01631 0.04534 0.00206
1985-04-01 1.2377 0.09521 -0.00239 0.46220 0.01103 0.08417 0.00709
1985-05-01 1.2483 0.00853 -0.00285 0.41858 0.03700 -0.02847 0.00081
1985-06-01 1.2808 0.02570 -0.00237 0.41772 0.00119 0.02451 0.00060
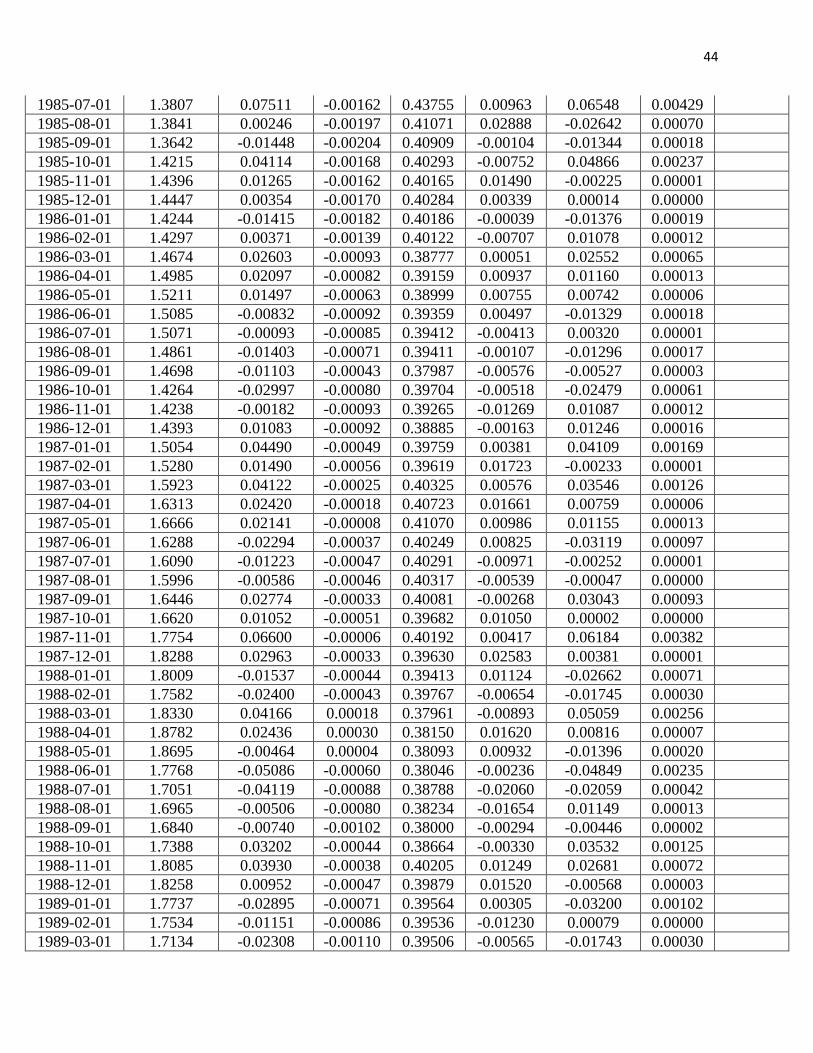
44
1985-07-01 1.3807 0.07511 -0.00162 0.43755 0.00963 0.06548 0.00429
1985-08-01 1.3841 0.00246 -0.00197 0.41071 0.02888 -0.02642 0.00070
1985-09-01 1.3642 -0.01448 -0.00204 0.40909 -0.00104 -0.01344 0.00018
1985-10-01 1.4215 0.04114 -0.00168 0.40293 -0.00752 0.04866 0.00237
1985-11-01 1.4396 0.01265 -0.00162 0.40165 0.01490 -0.00225 0.00001
1985-12-01 1.4447 0.00354 -0.00170 0.40284 0.00339 0.00014 0.00000
1986-01-01 1.4244 -0.01415 -0.00182 0.40186 -0.00039 -0.01376 0.00019
1986-02-01 1.4297 0.00371 -0.00139 0.40122 -0.00707 0.01078 0.00012
1986-03-01 1.4674 0.02603 -0.00093 0.38777 0.00051 0.02552 0.00065
1986-04-01 1.4985 0.02097 -0.00082 0.39159 0.00937 0.01160 0.00013
1986-05-01 1.5211 0.01497 -0.00063 0.38999 0.00755 0.00742 0.00006
1986-06-01 1.5085 -0.00832 -0.00092 0.39359 0.00497 -0.01329 0.00018
1986-07-01 1.5071 -0.00093 -0.00085 0.39412 -0.00413 0.00320 0.00001
1986-08-01 1.4861 -0.01403 -0.00071 0.39411 -0.00107 -0.01296 0.00017
1986-09-01 1.4698 -0.01103 -0.00043 0.37987 -0.00576 -0.00527 0.00003
1986-10-01 1.4264 -0.02997 -0.00080 0.39704 -0.00518 -0.02479 0.00061
1986-11-01 1.4238 -0.00182 -0.00093 0.39265 -0.01269 0.01087 0.00012
1986-12-01 1.4393 0.01083 -0.00092 0.38885 -0.00163 0.01246 0.00016
1987-01-01 1.5054 0.04490 -0.00049 0.39759 0.00381 0.04109 0.00169
1987-02-01 1.5280 0.01490 -0.00056 0.39619 0.01723 -0.00233 0.00001
1987-03-01 1.5923 0.04122 -0.00025 0.40325 0.00576 0.03546 0.00126
1987-04-01 1.6313 0.02420 -0.00018 0.40723 0.01661 0.00759 0.00006
1987-05-01 1.6666 0.02141 -0.00008 0.41070 0.00986 0.01155 0.00013
1987-06-01 1.6288 -0.02294 -0.00037 0.40249 0.00825 -0.03119 0.00097
1987-07-01 1.6090 -0.01223 -0.00047 0.40291 -0.00971 -0.00252 0.00001
1987-08-01 1.5996 -0.00586 -0.00046 0.40317 -0.00539 -0.00047 0.00000
1987-09-01 1.6446 0.02774 -0.00033 0.40081 -0.00268 0.03043 0.00093
1987-10-01 1.6620 0.01052 -0.00051 0.39682 0.01050 0.00002 0.00000
1987-11-01 1.7754 0.06600 -0.00006 0.40192 0.00417 0.06184 0.00382
1987-12-01 1.8288 0.02963 -0.00033 0.39630 0.02583 0.00381 0.00001
1988-01-01 1.8009 -0.01537 -0.00044 0.39413 0.01124 -0.02662 0.00071
1988-02-01 1.7582 -0.02400 -0.00043 0.39767 -0.00654 -0.01745 0.00030
1988-03-01 1.8330 0.04166 0.00018 0.37961 -0.00893 0.05059 0.00256
1988-04-01 1.8782 0.02436 0.00030 0.38150 0.01620 0.00816 0.00007
1988-05-01 1.8695 -0.00464 0.00004 0.38093 0.00932 -0.01396 0.00020
1988-06-01 1.7768 -0.05086 -0.00060 0.38046 -0.00236 -0.04849 0.00235
1988-07-01 1.7051 -0.04119 -0.00088 0.38788 -0.02060 -0.02059 0.00042
1988-08-01 1.6965 -0.00506 -0.00080 0.38234 -0.01654 0.01149 0.00013
1988-09-01 1.6840 -0.00740 -0.00102 0.38000 -0.00294 -0.00446 0.00002
1988-10-01 1.7388 0.03202 -0.00044 0.38664 -0.00330 0.03532 0.00125
1988-11-01 1.8085 0.03930 -0.00038 0.40205 0.01249 0.02681 0.00072
1988-12-01 1.8258 0.00952 -0.00047 0.39879 0.01520 -0.00568 0.00003
1989-01-01 1.7737 -0.02895 -0.00071 0.39564 0.00305 -0.03200 0.00102
1989-02-01 1.7534 -0.01151 -0.00086 0.39536 -0.01230 0.00079 0.00000
1989-03-01 1.7134 -0.02308 -0.00110 0.39506 -0.00565 -0.01743 0.00030
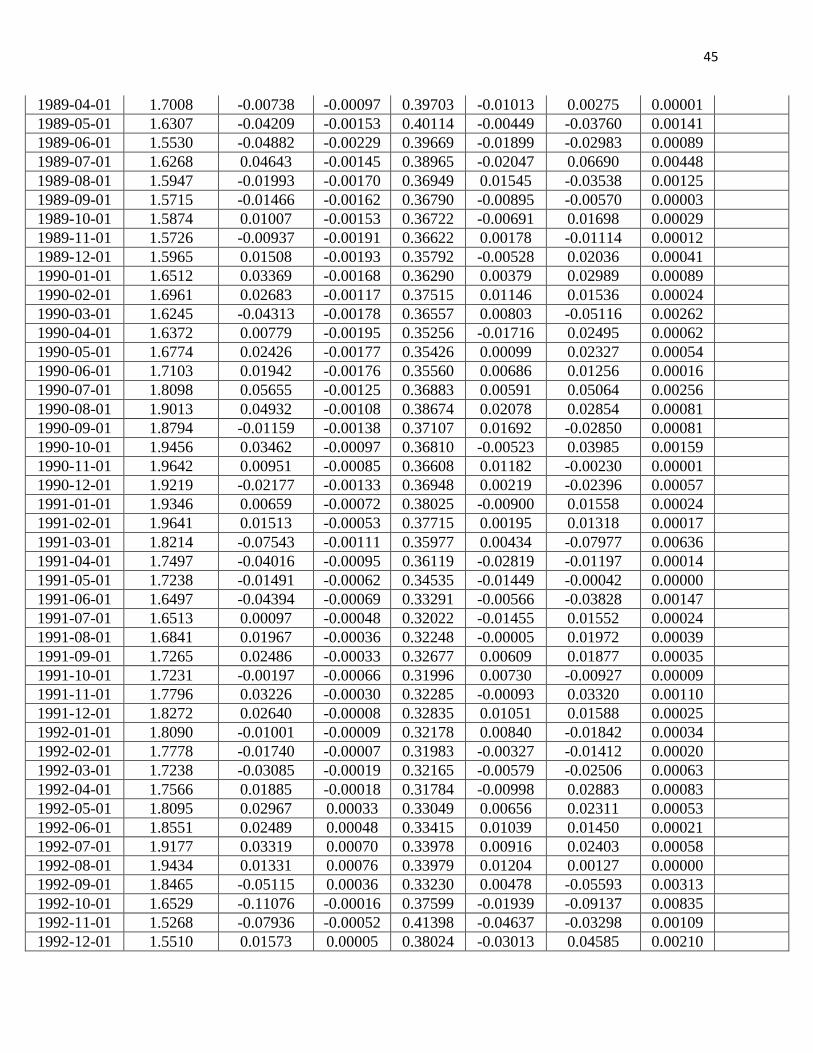
45
1989-04-01 1.7008 -0.00738 -0.00097 0.39703 -0.01013 0.00275 0.00001
1989-05-01 1.6307 -0.04209 -0.00153 0.40114 -0.00449 -0.03760 0.00141
1989-06-01 1.5530 -0.04882 -0.00229 0.39669 -0.01899 -0.02983 0.00089
1989-07-01 1.6268 0.04643 -0.00145 0.38965 -0.02047 0.06690 0.00448
1989-08-01 1.5947 -0.01993 -0.00170 0.36949 0.01545 -0.03538 0.00125
1989-09-01 1.5715 -0.01466 -0.00162 0.36790 -0.00895 -0.00570 0.00003
1989-10-01 1.5874 0.01007 -0.00153 0.36722 -0.00691 0.01698 0.00029
1989-11-01 1.5726 -0.00937 -0.00191 0.36622 0.00178 -0.01114 0.00012
1989-12-01 1.5965 0.01508 -0.00193 0.35792 -0.00528 0.02036 0.00041
1990-01-01 1.6512 0.03369 -0.00168 0.36290 0.00379 0.02989 0.00089
1990-02-01 1.6961 0.02683 -0.00117 0.37515 0.01146 0.01536 0.00024
1990-03-01 1.6245 -0.04313 -0.00178 0.36557 0.00803 -0.05116 0.00262
1990-04-01 1.6372 0.00779 -0.00195 0.35256 -0.01716 0.02495 0.00062
1990-05-01 1.6774 0.02426 -0.00177 0.35426 0.00099 0.02327 0.00054
1990-06-01 1.7103 0.01942 -0.00176 0.35560 0.00686 0.01256 0.00016
1990-07-01 1.8098 0.05655 -0.00125 0.36883 0.00591 0.05064 0.00256
1990-08-01 1.9013 0.04932 -0.00108 0.38674 0.02078 0.02854 0.00081
1990-09-01 1.8794 -0.01159 -0.00138 0.37107 0.01692 -0.02850 0.00081
1990-10-01 1.9456 0.03462 -0.00097 0.36810 -0.00523 0.03985 0.00159
1990-11-01 1.9642 0.00951 -0.00085 0.36608 0.01182 -0.00230 0.00001
1990-12-01 1.9219 -0.02177 -0.00133 0.36948 0.00219 -0.02396 0.00057
1991-01-01 1.9346 0.00659 -0.00072 0.38025 -0.00900 0.01558 0.00024
1991-02-01 1.9641 0.01513 -0.00053 0.37715 0.00195 0.01318 0.00017
1991-03-01 1.8214 -0.07543 -0.00111 0.35977 0.00434 -0.07977 0.00636
1991-04-01 1.7497 -0.04016 -0.00095 0.36119 -0.02819 -0.01197 0.00014
1991-05-01 1.7238 -0.01491 -0.00062 0.34535 -0.01449 -0.00042 0.00000
1991-06-01 1.6497 -0.04394 -0.00069 0.33291 -0.00566 -0.03828 0.00147
1991-07-01 1.6513 0.00097 -0.00048 0.32022 -0.01455 0.01552 0.00024
1991-08-01 1.6841 0.01967 -0.00036 0.32248 -0.00005 0.01972 0.00039
1991-09-01 1.7265 0.02486 -0.00033 0.32677 0.00609 0.01877 0.00035
1991-10-01 1.7231 -0.00197 -0.00066 0.31996 0.00730 -0.00927 0.00009
1991-11-01 1.7796 0.03226 -0.00030 0.32285 -0.00093 0.03320 0.00110
1991-12-01 1.8272 0.02640 -0.00008 0.32835 0.01051 0.01588 0.00025
1992-01-01 1.8090 -0.01001 -0.00009 0.32178 0.00840 -0.01842 0.00034
1992-02-01 1.7778 -0.01740 -0.00007 0.31983 -0.00327 -0.01412 0.00020
1992-03-01 1.7238 -0.03085 -0.00019 0.32165 -0.00579 -0.02506 0.00063
1992-04-01 1.7566 0.01885 -0.00018 0.31784 -0.00998 0.02883 0.00083
1992-05-01 1.8095 0.02967 0.00033 0.33049 0.00656 0.02311 0.00053
1992-06-01 1.8551 0.02489 0.00048 0.33415 0.01039 0.01450 0.00021
1992-07-01 1.9177 0.03319 0.00070 0.33978 0.00916 0.02403 0.00058
1992-08-01 1.9434 0.01331 0.00076 0.33979 0.01204 0.00127 0.00000
1992-09-01 1.8465 -0.05115 0.00036 0.33230 0.00478 -0.05593 0.00313
1992-10-01 1.6529 -0.11076 -0.00016 0.37599 -0.01939 -0.09137 0.00835
1992-11-01 1.5268 -0.07936 -0.00052 0.41398 -0.04637 -0.03298 0.00109
1992-12-01 1.5510 0.01573 0.00005 0.38024 -0.03013 0.04585 0.00210
46
1993-01-01 1.5325 -0.01200 0.00005 0.37411 0.00593 -0.01793 0.00032
1993-02-01 1.4395 -0.06260 -0.00029 0.37577 -0.00480 -0.05781 0.00334
1993-03-01 1.4617 0.01530 -0.00031 0.36539 -0.02319 0.03849 0.00148
1993-04-01 1.5447 0.05523 0.00001 0.36869 0.00565 0.04958 0.00246
1993-05-01 1.5477 0.00194 0.00005 0.36501 0.02021 -0.01827 0.00033
1993-06-01 1.5082 -0.02585 -0.00011 0.36362 0.00060 -0.02645 0.00070
1993-07-01 1.4955 -0.00846 0.00000 0.36219 -0.00937 0.00091 0.00000
1993-08-01 1.4914 -0.00275 -0.00003 0.36259 -0.00309 0.00035 0.00000
1993-09-01 1.5248 0.02215 0.00017 0.36209 -0.00082 0.02297 0.00053
1993-10-01 1.5023 -0.01487 0.00009 0.35789 0.00802 -0.02288 0.00052
1993-11-01 1.4808 -0.01441 0.00022 0.35628 -0.00508 -0.00934 0.00009
1993-12-01 1.4913 0.00707 0.00039 0.35291 -0.00470 0.01176 0.00014
1994-01-01 1.4923 0.00067 0.00012 0.35738 0.00264 -0.00197 0.00000
1994-02-01 1.4792 -0.00882 0.00003 0.35716 0.00027 -0.00909 0.00008
1994-03-01 1.4919 0.00855 0.00036 0.35845 -0.00280 0.01135 0.00013
1994-04-01 1.4823 -0.00646 0.00040 0.35496 0.00343 -0.00989 0.00010
1994-05-01 1.5042 0.01467 0.00055 0.35375 -0.00173 0.01640 0.00027
1994-06-01 1.5262 0.01452 0.00096 0.35161 0.00612 0.00840 0.00007
1994-07-01 1.5467 0.01334 0.00094 0.35556 0.00610 0.00724 0.00005
1994-08-01 1.5422 -0.00291 0.00124 0.35236 0.00594 -0.00885 0.00008
1994-09-01 1.5661 0.01538 0.00151 0.34586 0.00050 0.01488 0.00022
1994-10-01 1.6064 0.02541 0.00144 0.35458 0.00689 0.01852 0.00034
1994-11-01 1.5892 -0.01076 0.00168 0.35634 0.01073 -0.02150 0.00046
1994-12-01 1.5587 -0.01938 0.00188 0.34357 -0.00182 -0.01756 0.00031
1995-01-01 1.5746 0.01015 0.00216 0.33363 -0.00431 0.01446 0.00021
1995-02-01 1.5720 -0.00165 0.00175 0.34423 0.00525 -0.00690 0.00005
1995-03-01 1.6002 0.01778 0.00125 0.32411 0.00071 0.01707 0.00029
1995-04-01 1.6073 0.00443 0.00138 0.34480 0.00751 -0.00308 0.00001
1995-05-01 1.5874 -0.01246 0.00107 0.34314 0.00259 -0.01505 0.00023
1995-06-01 1.5948 0.00465 0.00062 0.32703 -0.00345 0.00810 0.00007
1995-07-01 1.5952 0.00025 0.00078 0.34405 0.00238 -0.00213 0.00000
1995-08-01 1.5668 -0.01796 0.00075 0.34444 0.00084 -0.01880 0.00035
1995-09-01 1.5590 -0.00499 0.00037 0.35157 -0.00595 0.00096 0.00000
1995-10-01 1.5779 0.01205 0.00050 0.35167 -0.00126 0.01331 0.00018
1995-11-01 1.5625 -0.00981 0.00039 0.35015 0.00461 -0.01442 0.00021
1995-12-01 1.5405 -0.01418 0.00043 0.35182 -0.00302 -0.01116 0.00012
1996-01-01 1.5288 -0.00762 0.00033 0.35356 -0.00468 -0.00294 0.00001
1996-02-01 1.5360 0.00470 0.00019 0.35217 -0.00250 0.00720 0.00005
1996-03-01 1.5271 -0.00581 0.00002 0.34873 0.00166 -0.00747 0.00006
1996-04-01 1.5160 -0.00730 -0.00008 0.34741 -0.00210 -0.00519 0.00003
1996-05-01 1.5152 -0.00053 0.00005 0.34935 -0.00250 0.00197 0.00000
1996-06-01 1.5416 0.01727 0.00018 0.34942 -0.00001 0.01728 0.00030
1996-07-01 1.5530 0.00737 0.00030 0.34946 0.00634 0.00103 0.00000
1996-08-01 1.5499 -0.00200 0.00032 0.34814 0.00288 -0.00488 0.00002
1996-09-01 1.5593 0.00605 0.00059 0.34480 -0.00009 0.00614 0.00004

47
1996-10-01 1.5863 0.01717 0.00065 0.34818 0.00275 0.01441 0.00021
1996-11-01 1.6623 0.04680 0.00089 0.35536 0.00699 0.03981 0.00158
1996-12-01 1.6639 0.00096 0.00043 0.34360 0.01651 -0.01554 0.00024
1997-01-01 1.6585 -0.00325 0.00040 0.34404 0.00073 -0.00398 0.00002
1997-02-01 1.6256 -0.02004 -0.00006 0.33950 -0.00116 -0.01887 0.00036
1997-03-01 1.6096 -0.00989 -0.00017 0.33566 -0.00690 -0.00299 0.00001
1997-04-01 1.6293 0.01216 -0.00015 0.33051 -0.00342 0.01559 0.00024
1997-05-01 1.6322 0.00178 0.00008 0.33717 0.00418 -0.00240 0.00001
1997-06-01 1.6449 0.00775 0.00018 0.33617 0.00078 0.00697 0.00005
1997-07-01 1.6694 0.01478 0.00030 0.33689 0.00291 0.01188 0.00014
1997-08-01 1.6035 -0.04028 -0.00033 0.33177 0.00457 -0.04485 0.00201
1997-09-01 1.6013 -0.00137 -0.00024 0.32598 -0.01337 0.01200 0.00014
1997-10-01 1.6330 0.01960 -0.00060 0.31845 -0.00104 0.02064 0.00043
1997-11-01 1.6889 0.03366 -0.00045 0.31794 0.00579 0.02787 0.00078
1997-12-01 1.6597 -0.01744 -0.00048 0.31556 0.01015 -0.02759 0.00076
1998-01-01 1.6350 -0.01499 -0.00039 0.31418 -0.00587 -0.00912 0.00008
1998-02-01 1.6408 0.00354 -0.00073 0.32579 -0.00562 0.00916 0.00008
1998-03-01 1.6619 0.01278 -0.00073 0.32081 0.00041 0.01237 0.00015
1998-04-01 1.6723 0.00624 -0.00060 0.32469 0.00355 0.00269 0.00001
1998-05-01 1.6382 -0.02060 -0.00038 0.32080 0.00162 -0.02222 0.00049
1998-06-01 1.6504 0.00742 -0.00007 0.30294 -0.00631 0.01373 0.00019
1998-07-01 1.6437 -0.00407 -0.00018 0.30604 0.00209 -0.00616 0.00004
1998-08-01 1.6342 -0.00580 -0.00017 0.30591 -0.00142 -0.00438 0.00002
1998-09-01 1.6823 0.02901 -0.00020 0.30681 -0.00198 0.03099 0.00096
1998-10-01 1.6944 0.00717 -0.00047 0.29473 0.00808 -0.00092 0.00000
1998-11-01 1.6611 -0.01985 -0.00063 0.29348 0.00147 -0.02132 0.00045
1998-12-01 1.6708 0.00582 -0.00027 0.29454 -0.00611 0.01194 0.00014
1999-01-01 1.6498 -0.01265 -0.00036 0.29249 0.00134 -0.01399 0.00020
1999-02-01 1.6276 -0.01355 -0.00028 0.29128 -0.00397 -0.00958 0.00009
1999-03-01 1.6213 -0.00388 -0.00028 0.29112 -0.00422 0.00034 0.00000
1999-04-01 1.6089 -0.00768 0.00000 0.28796 -0.00111 -0.00656 0.00004
1999-05-01 1.6154 0.00403 0.00036 0.26786 -0.00170 0.00573 0.00003
1999-06-01 1.5950 -0.01271 -0.00027 0.30511 0.00096 -0.01367 0.00019
1999-07-01 1.5751 -0.01255 -0.00005 0.32763 -0.00421 -0.00834 0.00007
1999-08-01 1.6058 0.01930 0.00021 0.32156 -0.00382 0.02313 0.00053
1999-09-01 1.6247 0.01170 0.00014 0.32581 0.00643 0.00528 0.00003
1999-10-01 1.6572 0.01981 0.00038 0.32994 0.00424 0.01557 0.00024
1999-11-01 1.6205 -0.02239 -0.00002 0.32470 0.00641 -0.02881 0.00083
1999-12-01 1.6132 -0.00451 -0.00024 0.31814 -0.00736 0.00285 0.00001
2000-01-01 1.6404 0.01672 -0.00022 0.30959 -0.00162 0.01834 0.00034
2000-02-01 1.6000 -0.02494 -0.00004 0.32154 0.00534 -0.03028 0.00092
2000-03-01 1.5799 -0.01264 -0.00026 0.33600 -0.00864 -0.00401 0.00002
2000-04-01 1.5823 0.00152 -0.00039 0.33253 -0.00459 0.00611 0.00004
2000-05-01 1.5090 -0.04743 -0.00089 0.32716 -0.00040 -0.04704 0.00221
2000-06-01 1.5092 0.00013 -0.00121 0.30254 -0.01556 0.01569 0.00025

48
2000-07-01 1.5076 -0.00106 -0.00153 0.27494 -0.00149 0.00043 0.00000
2000-08-01 1.4889 -0.01248 -0.00139 0.29268 -0.00170 -0.01078 0.00012
2000-09-01 1.4336 -0.03785 -0.00197 0.30338 -0.00576 -0.03209 0.00103
2000-10-01 1.4506 0.01179 -0.00180 0.28967 -0.01277 0.02456 0.00060
2000-11-01 1.4258 -0.01724 -0.00177 0.28972 0.00164 -0.01889 0.00036
2000-12-01 1.4629 0.02569 -0.00163 0.28683 -0.00657 0.03226 0.00104
2001-01-01 1.4775 0.00993 -0.00172 0.28660 0.00564 0.00429 0.00002
2001-02-01 1.4525 -0.01707 -0.00118 0.30340 0.00184 -0.01890 0.00036
2001-03-01 1.4445 -0.00552 -0.00107 0.28439 -0.00592 0.00040 0.00000
2001-04-01 1.4348 -0.00674 -0.00109 0.28313 -0.00265 -0.00409 0.00002
2001-05-01 1.4265 -0.00580 -0.00080 0.27495 -0.00265 -0.00315 0.00001
2001-06-01 1.4020 -0.01732 -0.00103 0.28603 -0.00269 -0.01464 0.00021
2001-07-01 1.4148 0.00909 -0.00108 0.28121 -0.00595 0.01504 0.00023
2001-08-01 1.4372 0.01571 -0.00114 0.27648 0.00138 0.01433 0.00021
2001-09-01 1.4638 0.01834 -0.00093 0.28435 0.00353 0.01480 0.00022
2001-10-01 1.4501 -0.00940 -0.00134 0.28015 0.00380 -0.01320 0.00017
2001-11-01 1.4356 -0.01005 -0.00156 0.27007 -0.00410 -0.00595 0.00004
2001-12-01 1.4413 0.00396 -0.00135 0.27660 -0.00413 0.00809 0.00007
2002-01-01 1.4322 -0.00633 -0.00129 0.27411 -0.00021 -0.00613 0.00004
2002-02-01 1.4227 -0.00666 -0.00113 0.26767 -0.00282 -0.00383 0.00001
2002-03-01 1.4230 0.00021 -0.00131 0.28198 -0.00319 0.00340 0.00001
2002-04-01 1.4429 0.01389 -0.00142 0.27309 -0.00136 0.01525 0.00023
2002-05-01 1.4598 0.01164 -0.00151 0.26536 0.00218 0.00947 0.00009
2002-06-01 1.4837 0.01624 -0.00164 0.25523 0.00133 0.01491 0.00022
2002-07-01 1.5565 0.04790 -0.00129 0.26646 0.00304 0.04486 0.00201
2002-08-01 1.5368 -0.01274 -0.00106 0.25945 0.01137 -0.02411 0.00058
2002-09-01 1.5563 0.01261 -0.00025 0.16715 -0.00238 0.01499 0.00022
2002-10-01 1.5575 0.00077 0.00017 0.00785 0.00027 0.00050 0.00000
2002-11-01 1.5711 0.00869 0.00010 0.04398 0.00013 0.00856 0.00007
2002-12-01 1.5863 0.00963 0.00028 0.05180 0.00073 0.00889 0.00008
2003-01-01 1.6175 0.01948 0.00097 0.03517 0.00131 0.01817 0.00033
2003-02-01 1.6079 -0.00595 0.00074 0.06373 0.00198 -0.00793 0.00006
2003-03-01 1.5825 -0.01592 0.00017 0.04274 -0.00009 -0.01584 0.00025
2003-04-01 1.5739 -0.00545 0.00013 0.04660 -0.00061 -0.00484 0.00002
2003-05-01 1.6224 0.03035 0.00061 0.04235 0.00038 0.02997 0.00090
2003-06-01 1.6609 0.02345 0.00085 0.05706 0.00258 0.02087 0.00044
2003-07-01 1.6221 -0.02364 0.00067 0.03644 0.00153 -0.02517 0.00063
2003-08-01 1.5939 -0.01754 0.00034 0.05286 -0.00091 -0.01662 0.00028
2003-09-01 1.6155 0.01346 0.00059 0.05634 -0.00040 0.01386 0.00019
2003-10-01 1.6792 0.03867 0.00102 0.06501 0.00189 0.03678 0.00135
2003-11-01 1.6897 0.00623 0.00097 0.07172 0.00375 0.00249 0.00001
2003-12-01 1.7516 0.03598 0.00126 0.07761 0.00175 0.03423 0.00117
2004-01-01 1.8255 0.04132 0.00161 0.11718 0.00583 0.03550 0.00126
2004-02-01 1.8673 0.02264 0.00164 0.13854 0.00737 0.01527 0.00023
2004-03-01 1.8261 -0.02231 0.00152 0.12396 0.00433 -0.02664 0.00071

49
2004-04-01 1.8031 -0.01268 0.00129 0.13515 -0.00173 -0.01095 0.00012
2004-05-01 1.7860 -0.00953 0.00112 0.13461 -0.00059 -0.00894 0.00008
2004-06-01 1.8279 0.02319 0.00124 0.12343 0.00006 0.02312 0.00053
2004-07-01 1.8438 0.00866 0.00132 0.12823 0.00429 0.00437 0.00002
2004-08-01 1.8203 -0.01283 0.00107 0.12694 0.00217 -0.01500 0.00023
2004-09-01 1.7937 -0.01472 0.00077 0.12363 -0.00082 -0.01391 0.00019
2004-10-01 1.8077 0.00777 0.00096 0.12998 -0.00095 0.00873 0.00008
2004-11-01 1.8607 0.02890 0.00135 0.12871 0.00235 0.02655 0.00070
2004-12-01 1.9286 0.03584 0.00147 0.15947 0.00608 0.02977 0.00089
2005-01-01 1.8797 -0.02568 0.00128 0.12957 0.00593 -0.03161 0.00100
2005-02-01 1.8871 0.00393 0.00120 0.12659 -0.00206 0.00598 0.00004
2005-03-01 1.9043 0.00907 0.00125 0.12667 0.00175 0.00733 0.00005
2005-04-01 1.8961 -0.00432 0.00131 0.12644 0.00246 -0.00678 0.00005
2005-05-01 1.8559 -0.02143 0.00108 0.13184 0.00051 -0.02194 0.00048
2005-06-01 1.8177 -0.02080 0.00091 0.14365 -0.00216 -0.01863 0.00035
2005-07-01 1.7507 -0.03756 0.00075 0.16392 -0.00266 -0.03490 0.00122
2005-08-01 1.7944 0.02465 0.00106 0.13262 -0.00392 0.02858 0.00082
2005-09-01 1.8064 0.00667 0.00098 0.13586 0.00433 0.00234 0.00001
2005-10-01 1.7651 -0.02313 0.00087 0.13579 0.00178 -0.02490 0.00062
2005-11-01 1.7349 -0.01726 0.00085 0.14119 -0.00241 -0.01485 0.00022
2005-12-01 1.7458 0.00626 0.00098 0.13510 -0.00135 0.00761 0.00006
2006-01-01 1.7686 0.01298 0.00103 0.13759 0.00189 0.01108 0.00012
2006-02-01 1.7480 -0.01172 0.00098 0.13394 0.00271 -0.01443 0.00021
2006-03-01 1.7442 -0.00218 0.00103 0.13315 -0.00053 -0.00164 0.00000
2006-04-01 1.7680 0.01355 0.00114 0.13194 0.00085 0.01270 0.00016
2006-05-01 1.8687 0.05539 0.00142 0.14878 0.00344 0.05195 0.00270
2006-06-01 1.8435 -0.01358 0.00125 0.11820 0.00780 -0.02137 0.00046
2006-07-01 1.8443 0.00043 0.00129 0.11850 -0.00032 0.00075 0.00000
2006-08-01 1.8941 0.02664 0.00146 0.11829 0.00151 0.02513 0.00063
2006-09-01 1.8839 -0.00540 0.00126 0.11100 0.00422 -0.00962 0.00009
2006-10-01 1.8765 -0.00394 0.00088 0.09585 0.00036 -0.00430 0.00002
2006-11-01 1.9125 0.01900 0.00107 0.09852 0.00068 0.01832 0.00034
2006-12-01 1.9629 0.02601 0.00129 0.10842 0.00335 0.02266 0.00051
2007-01-01 1.9587 -0.00214 0.00142 0.10244 0.00409 -0.00623 0.00004
2007-02-01 1.9589 0.00010 0.00150 0.09773 0.00129 -0.00119 0.00000
2007-03-01 1.9474 -0.00589 0.00133 0.10124 0.00134 -0.00723 0.00005
2007-04-01 1.9879 0.02058 0.00151 0.09790 0.00093 0.01965 0.00039
2007-05-01 1.9842 -0.00186 0.00142 0.09544 0.00338 -0.00525 0.00003
2007-06-01 1.9867 0.00126 0.00131 0.09358 0.00114 0.00012 0.00000
2007-07-01 2.0355 0.02427 0.00185 0.10723 0.00198 0.02228 0.00050
2007-08-01 2.0110 -0.01211 0.00172 0.09924 0.00412 -0.01623 0.00026
2007-09-01 2.0184 0.00367 0.00159 0.09961 0.00038 0.00329 0.00001
2007-10-01 2.0449 0.01304 0.00145 0.08678 0.00177 0.01127 0.00013
2007-11-01 2.0701 0.01225 0.00168 0.10738 0.00308 0.00916 0.00008
2007-12-01 2.0161 -0.02643 0.00159 0.09223 0.00272 -0.02915 0.00085
50
2008-01-01 1.9702 -0.02303 0.00134 0.10945 -0.00155 -0.02148 0.00046
2008-02-01 1.9646 -0.00285 0.00124 0.10992 -0.00129 -0.00155 0.00000
2008-03-01 2.0015 0.01861 0.00136 0.10702 0.00105 0.01755 0.00031
2008-04-01 1.9816 -0.00999 0.00144 0.10402 0.00338 -0.01337 0.00018
2008-05-01 1.9650 -0.00841 0.00129 0.11108 0.00018 -0.00859 0.00007
2008-06-01 1.9664 0.00071 0.00134 0.11191 0.00040 0.00031 0.00000
2008-07-01 1.9888 0.01133 0.00148 0.11079 0.00156 0.00976 0.00010
2008-08-01 1.8865 -0.05281 0.00079 0.10260 0.00196 -0.05476 0.00300
2008-09-01 1.7973 -0.04844 0.00035 0.15615 -0.00790 -0.04054 0.00164
2008-10-01 1.6862 -0.06381 0.00002 0.22144 -0.01071 -0.05310 0.00282
2008-11-01 1.5327 -0.09545 -0.00077 0.33333 -0.02204 -0.07341 0.00539
2008-12-01 1.4854 -0.03135 -0.00064 0.33286 -0.03241 0.00106 0.00000
2009-01-01 1.4462 -0.02674 -0.00069 0.33932 -0.01133 -0.01541 0.00024
2009-02-01 1.4422 -0.00277 -0.00065 0.33655 -0.00965 0.00688 0.00005
2009-03-01 1.4170 -0.01763 -0.00074 0.33675 -0.00167 -0.01596 0.00025
2009-04-01 1.4712 0.03754 -0.00044 0.32514 -0.00617 0.04371 0.00191
2009-05-01 1.5418 0.04687 -0.00001 0.34853 0.01307 0.03380 0.00114
2009-06-01 1.6369 0.05985 0.00043 0.37982 0.01823 0.04162 0.00173
2009-07-01 1.6378 0.00055 0.00005 0.36399 0.02183 -0.02128 0.00045
2009-08-01 1.6532 0.00936 0.00009 0.36269 0.00029 0.00907 0.00008
2009-09-01 1.6323 -0.01272 -0.00018 0.35767 0.00317 -0.01589 0.00025
2009-10-01 1.6212 -0.00682 0.00005 0.36704 -0.00462 -0.00220 0.00000
2009-11-01 1.6599 0.02359 0.00024 0.36555 -0.00226 0.02585 0.00067
2009-12-01 1.6226 -0.02273 -0.00018 0.35557 0.00821 -0.03094 0.00096
2010-01-01 1.6158 -0.00420 0.00012 0.36205 -0.00811 0.00391 0.00002
2010-02-01 1.5618 -0.03399 -0.00013 0.36276 -0.00165 -0.03234 0.00105
2010-03-01 1.5058 -0.03651 -0.00038 0.37633 -0.01317 -0.02334 0.00054
2010-04-01 1.5332 0.01803 0.00028 0.36042 -0.01288 0.03091 0.00096
2010-05-01 1.4669 -0.04421 -0.00029 0.35879 0.00618 -0.05039 0.00254
2010-06-01 1.4768 0.00673 -0.00009 0.34384 -0.01529 0.02202 0.00048
2010-07-01 1.5304 0.03565 0.00029 0.34711 0.00263 0.03303 0.00109
2010-08-01 1.5661 0.02306 0.00066 0.34620 0.01301 0.01005 0.00010
2010-09-01 1.5591 -0.00448 0.00034 0.35573 0.00854 -0.01302 0.00017
2010-10-01 1.5867 0.01755 0.00068 0.35792 -0.00092 0.01847 0.00034
2010-11-01 1.5961 0.00591 0.00040 0.36607 0.00683 -0.00092 0.00000
2010-12-01 1.5595 -0.02320 0.00019 0.36402 0.00234 -0.02554 0.00065
2011-01-01 1.5782 0.01192 0.00053 0.35986 -0.00781 0.01973 0.00039
2011-02-01 1.6124 0.02144 0.00067 0.36267 0.00499 0.01644 0.00027
2011-03-01 1.6159 0.00217 0.00067 0.36024 0.00839 -0.00622 0.00004
2011-04-01 1.6379 0.01352 0.00080 0.35999 0.00158 0.01194 0.00014
2011-05-01 1.6332 -0.00287 0.00087 0.35676 0.00569 -0.00857 0.00007
2011-06-01 1.6219 -0.00694 0.00068 0.36118 -0.00035 -0.00659 0.00004
2011-07-01 1.6158 -0.00377 0.00057 0.36002 -0.00193 -0.00184 0.00000
2011-08-01 1.6356 0.01218 0.00058 0.35644 -0.00076 0.01294 0.00017
2011-09-01 1.5771 -0.03642 0.00038 0.35378 0.00468 -0.04111 0.00169
51
2011-10-01 1.5768 -0.00019 0.00054 0.34600 -0.01206 0.01187 0.00014
2011-11-01 1.5806 0.00241 0.00050 0.34707 0.00044 0.00197 0.00000
2011-12-01 1.5587 -0.01395 0.00044 0.34709 0.00128 -0.01523 0.00023
2012-01-01 1.5524 -0.00405 0.00049 0.34651 -0.00435 0.00030 0.00000
2012-02-01 1.5804 0.01788 0.00063 0.34541 -0.00077 0.01865 0.00035
2012-03-01 1.5824 0.00126 0.00047 0.34416 0.00662 -0.00536 0.00003
2012-04-01 1.6000 0.01106 0.00050 0.34300 0.00094 0.01012 0.00010
2012-05-01 1.5924 -0.00476 0.00033 0.33976 0.00409 -0.00885 0.00008
2012-06-01 1.5556 -0.02338 -0.00020 0.33182 -0.00178 -0.02160 0.00047
2012-07-01 1.5593 0.00238 0.00012 0.34873 -0.00803 0.01041 0.00011
2012-08-01 1.5722 0.00824 0.00004 0.35228 0.00088 0.00736 0.00005
2012-09-01 1.6126 0.02537 0.00026 0.35575 0.00319 0.02218 0.00049
2012-10-01 1.6080 -0.00286 0.00009 0.35112 0.00900 -0.01186 0.00014
2012-11-01 1.5968 -0.00699 -0.00001 0.35057 -0.00101 -0.00598 0.00004
2012-12-01 1.6145 0.01102 -0.00003 0.34683 -0.00246 0.01348 0.00018