Çukurova university institute of natural and applied ... · Çukurova university . institute of...
TRANSCRIPT
ÇUKUROVA UNIVERSITY INSTITUTE OF NATURAL AND APPLIED SCIENCE
MSc THESIS Can Onur TOKUNÇ MODELING OF A SHUNT ACTIVE POWER FILTER WITH EPLL BASED CONTROL METHOD FOR MITIGATION OF POWER QUALITY PROBLEMS CAUSED BY INDUCTION FURNACES
DEPARTMENT OF ELECTRICAL AND ELECTRONICS ENGINEERING
ADANA, 2010

ABSTRACT
MSc THESIS
MODELING OF A SHUNT ACTIVE POWER FILTER WITH EPLL BASED CONTROL METHOD FOR MITIGATION OF POWER QUALITY
PROBLEMS CAUSED BY INDUCTION FURNACES
Can Onur TOKUNÇ
ÇUKUROVA UNIVERSITY
INSTITUTE OF NATURAL AND APPLIED SCIENCES DEPARTMENT OF ELECTRICAL AND ELECTRONICS ENGINEERING
Supervisor : Asst. Prof. Dr.K. Çağatay BAYINDIR : Year: 2010, Pages:147 Jury : Asst. Prof. Dr.K.Çağatay BAYINDIR : Prof. Dr. Mehmet TÜMAY : Yrd. Doç. Dr. Ramazan ÇOBAN
Modern induction furnaces become popular with the development of power
electronic converters. Current source coreless induction furnaces are used in metal melting processes because of the advantage of power circuit for high power applications. Besides the advantages, current source coreless induction furnace has unfamiliar power quality problems such as varying harmonics and interharmonics. In this thesis a current source coreless induction furnace is modeled and power quality problems are presented. A shunt active power filter with EPLL based control method together with detuned harmonic filters for reactive power compensation is proposed to mitigate the power quality problems caused by current source coreless induction furnace. Performance of the proposed method is evaluated with case studies using PSCAD / EMTDC. Key Words: Three phase shunt active filter, Induction furnace, enhanced phase
locked loop, power quality, interharmonics
I
ÖZ
YÜKSEK LİSANS
İNDÜKSİYON OCAKLARININ NEDEN OLDUĞU GÜÇ KALİTESİ PROBLEMLERİNİ AZALTMAK İÇİN PARALEL AKTİF GÜÇ
FİLTRESİNİN EPLL TABANLI KONTROL METODU İLE MODELLENMESİ
Can ONUR TOKUNÇ
ÇUKUROVA ÜNİVERSİTESİ
FEN BİLİMLERİ ENSTİTÜSÜ ELEKTRİK ELEKTRONİK MÜHENDİSLİGİ ANABİLİM DALI
Danışman : Yrd. Doç. Dr.K. Çağatay BAYINDIR : Yıl: 2010 Sayfa:147 Jüri : Yrd. Doç. Dr.K. Çağatay BAYINDIR : Prof. Dr. Mehmet TÜMAY : Yrd. Doç. Dr. Ramazan ÇOBAN
Güç elektroniği dönüştürücülerinin gelişmesiyle modern indüksiyon ocakları popüler hale gelmektedir. Akım beslemeli çekirdeksiz indüksiyon ocakları büyük güçteki uygulamalarda güç devresinin avantajından dolayı metal eritme proseslerinde kullanılmaktadır. Akım beslemeli indüksiyon ocakları bu avantajlarının yanında alışkın olunmayan değişken harmonikler ve ara harmonikler gibi güç kalitesi problemleri vardır.
Bu tezde akım kaynaklı çekirdeksiz indüksiyon ocağı modellenmekte ve güç kalitesi problemleri sunulmaktadır. Akım beslemeli çekirdeksiz indüksiyon ocağından kaynaklanan güç kalitesi problemlerini azaltmak için EPLL kontrol metotlu paralel aktif güç filtresi ile reaktif güç kompansazyonu için pasif harmonik filtresi önerilmektedir.
Önerilen metodun performansı PSCAD/EMTDC programında farklı durum çalışmalarıyla değerlendirilmektedir. Anahtar Sözcükler: Üç faz aktif filtre, indüksiyon ocağı, geliştirilmiş faz kilitlemeli
döngü, güç kalitesi, ara harmonik
II

III
ACKNOWLEDGEMENTS
First of all it is a pleasure to thanks both Prof. Dr. Mehmet Tümay and Asst.
Prof. Dr. K.Çağatay Bayındır who made this thesis possible with their understanding
and giving me a chance to choose subject in parallel with my working area and
unforgettable contribution.
I would like to express my deepest gratitude to my supervisor Asst. Prof. Dr.
K.Çağatay Bayındır not only for his guidance, criticism, encouragements and also for
his useful suggestions and continuous confidence in me. He has made available his
support in a number of ways to improve and finalize this thesis.
I owe special thanks to Adnan Tan for his companionship and cooperation
during my study. I could have never completed this thesis without his support and
generous help.
I would like to thanks for accepting to be the members of examining
committee for my thesis.
I would like to show my gratitude also to my manager Mr. N. Savaş Seçen,
chief engineer Mr. Harun Tokmak and colleagues for their understanding, patience
and continuous support during my study.
I would like to thank MSc. Ahmet Teke, Mehmet Uğraş Cuma for their
suggestions, encouragement and valuable technical discussion.
I wish to thanks to my closest friends for their understanding and support
during my hard times.
Finally I would like to express my dippiest thanks to my lovely family my
mother Semra Tokunç and my father Hakkı Tokunç and my brother Okan Tokunç
without whose support I would have never been able to aspire for this level of
education .
CONTENTS PAGE
ABSTRACT..................................................................................................................I
ÖZ ............................................................................................................................... II
ACKNOWLEDGEMENTS ....................................................................................... III
CONTENTS............................................................................................................... IV
LIST OF TABLES... .................................................................................................VI
LIST OF FIGURES.. .…. ..…................................................................................. VIII
LIST OF SYMBOLS .............................................................................................. XIV
LIST OF ABBREVATIONS.................................................................................... XVI
1. INTRODUCTION.................................................................................................... 1
2. STEEL PRODUCTION METHODS AND TURKEY IRON AND STEEL
INDUSTRY.................................................................................................................. 7
2.1. Steel Production Methods ................................................................................. 7
2.1.1. The Primary Steel Production ................................................................. 8
2.1.2. The Secondary Steel Production ........................................................... 13
2.1.2.1 Electric Arc Furnace.................................................................... 13
2.1.2.2 Induction Furnace ....................................................................... 16
2.2. Turkey Iron And Steel Industry....................................................................... 18
3. INDUCTION FURNACE OPERATION, POWER QUALITY PROBLEMS AND
SOLUTIONS ............................................................................................................. 21
3.1. Induction Furnace Operation........................................................................... 21
3.2 Power Quality Problems And Solutions........................................................... 30
3.2.1 Power Quality Problems ........................................................................ 30
3.2.2 Solutions................................................................................................. 37
3.2.2.1 Passive Filtering.......................................................................... 37
3.2.2.2 Choose a Different Type of Furnace Power Supply.................... 39
3.2.2.3 Active Filtering ........................................................................... 39
3.2.2. 4 Reconfiguring Feeders ............................................................... 40
3.2.2. 5 Modify Induction Furnace ......................................................... 41
3.2.2.6 Feed from Transmission.............................................................. 41
IV

4. INDUCTION FURNACE MODELING ............................................................... 43
4.1 Induction Furnace Modeling............................................................................ 43
4.2 Simulation Results of Induction Furnace......................................................... 52
5. OPERATION PRINCIPLE AND MODELING OF PROPOSED SHUNT ACTIVE
POWER FILTER........................................................................................................ 63
5.1 Operation Principle of Shunt Active Power Filter ........................................... 63
5.2 Available Control Methods of Shunt Active Filters ......................................... 67
5.2.1 Current Reference Generation Techniques ............................................ 69
5.2.1.1 p-q Method.................................................................................. 69
5.2.1.2 Discrete Fourier Transform (DFT) Control ................................ 71
5.2.1.3 Synchronous Reference Frame Method (SRF) ........................... 72
5.2.2 Current Control Techniques ................................................................... 73
5.2.2.1 Hysteresis Current Control.......................................................... 73
5.2.2.2 Triangle-Comparison PWM control............................................ 73
5.2.2.3 Space vector modulation (SVM)................................................. 74
5.3 Proposed Control Strategy for Shunt Active Power Filter ............................... 74
5.3.1 Reference Generation Method ............................................................... 74
5.3.1.1 Enhanced Phase Lock Loop(EPLL) Block ................................. 78
5.3.1.2 Symmetrical Component(SC) Block .......................................... 82
5.3.1.3 Reactive Current Calculation Block ........................................... 90
5.3.1.4 DC Link Control Block............................................................... 93
5.3.2 Current Controller .................................................................................. 96
5.4 Passive Filter .................................................................................................... 97
6. CASE STUDIES AND DISCUSSIONS.............................................................. 103
6.1 Case 1 ............................................................................................................. 105
6.2 Case 2 ............................................................................................................. 114
6.3 Case 3 ............................................................................................................. 124
6.4 Discussions..................................................................................................... 133
7. CONCLUSIONS.................................................................................................. 137
REFERENCES......................................................................................................... 141
CIRRICULUM VITAE ............................................................................................ 147
V

VI
LIST OF TABLES PAGE
Table 3.1 Basis For Harmonic Current Limits Based On IEEE 519-1992 ................ 35
Table 3.2 Current Distortion Limit For General Distribution Systems (120V Through
69000V) ............................................................................................................. 36
Table 3.3 Voltage Distortion Limits ........................................................................... 36
Table 4.1 The Power Circuit Specifications............................................................... 44
Table 5.1 The Power Circuit Specifications of Passive Filters ................................ 101
Table 6.1 Performance Comparisons Among Study Cases ...................................... 134

VII
LIST OF FIGURES PAGE
Figure 1.1 Crude Steel Production Processes (Ecofys, 2009)...................................... 3
Figure 1.2 Block Diagram of An Actual Induction Heating Furnace .......................... 4
Figure 2.1 General Block Diagram of The Steel Production ....................................... 8
Figure 2.2 Processes For Steel Production................................................................. 10
Figure 2.3 More Detail Scheme of The Oxygen Steel Process Chain ....................... 12
Figure 2.4 Single-Lines of Various Eaf Types (Burch, 2008). ................................... 14
Figure 2.5 Typical Melt Cycle Components (Burch, 2008)....................................... 15
Figure 2.6 Channel Type Induction Furnace (Web) ................................................... 17
Figure 2.7 Coreless Type Induction Furnace (Web) .................................................. 18
Figure 2.8 Location of Iron And Steel Plants On The Turkish Electricity
Transmission System................................................................................ 20
Figure 3.1 Block Diagram of A Modern Induction Furnace With A Current- Source
Inverter ..................................................................................................... 23
Figure 3.2 Typical Electronic Power Supply And Induction-Melt Furnace (Rudnev Et
Al., 1999). ................................................................................................ 24
Figure 3.3 Voltage-Fed Power Supply Driving A Series-Resonant Furnace Circuit . 25
Figure 3.4 Current-Fed Power Supply Driving A Parallel-Resonant Furnace Circuit26
Figure 3.5 Block Diagram of Induction Furnace System .......................................... 26
Figure 3.6 Typical Components of A Coreless Induction Furnace (Ahmed, 2009). .. 28
Figure 3.7 The Geometric Shape of The Furnace (Ahmed, 2009)............................. 30
Figure 3.8 Typical 12-Pulse Bridge Rectifier Configuration With Phase- Shifting
Transformers ............................................................................................ 31
Figure 3.9 Typical Spectrum of Induction Furnace Current (Dugan Et Al., 1999).... 33
Figure 3.10 Passive Tuned Filters: (A) Single Tuned, And (B) Double Tuned ......... 37
Figure 3.11 Passive High-Pass Filters: (A) First-Order, (B) Second-Order .............. 38
Figure 4.1 The Power Circuit of 10MVA Current Source Induction Furnace ........... 44
Figure 4.2 Equivalent Circuit of Transformer............................................................ 46
Figure 4.3 Equivalent Circuit of Coreless Induction Furnace.................................... 46
Figure 4.4 Coreless Induction Furnace Equivalent Circuit........................................ 46
VIII

Figure 4.5 Pscad Model of Induction Furnace ........................................................... 48
Figure 4.6 12-Pulses Bridge Rectifier Configuration With Phase- Shifting
Transformers of Induction Furnace Model .............................................. 49
Figure 4.7 Current Fed Converter of Pscad Model .................................................... 50
Figure 4.8 PSCAD Model of Parallel Resonance Circuit .......................................... 51
Figure 4.9 DC-AC Inverter Control Blocks............................................................... 51
Figure 4.10 Three Phase Source Current of The Network......................................... 52
Figure 4.11 Three Phase Source Voltage of The Network ......................................... 53
Figure 4.12 Phase A Source Current of The Network................................................ 53
Figure 4.13 Phase A Source Voltage of The Network................................................ 54
Figure 4.14 Induction Furnace Apparent Power (MVA)............................................ 54
Figure 4.15 Induction Furnace Current...................................................................... 55
Figure 4.16 Induction Furnace Voltage ...................................................................... 55
Figure 4.17 Induction Furnace DC Ripple Current at t=0.5s..................................... 56
Figure 4.18 Induction Furnace Operating Frequency .................................. 56 at t=0.5s
Figure 4.19 Induction Furnace DC Ripple Current ................................... 57 at t=49.5s
Figure 4.20 Induction Furnace Operating Frequency ................................ 57 at t=49.5s
Figure 4.21 Harmonic Spectrum of Induction Furnace at t=0.7s............................... 58
Figure 4.22 Operating Frequency of Induction Furnace at t=0.7s ............................. 58
Figure 4.23 Harmonic Spectrum of Induction Furnace at t=1.7s............................... 59
Figure 4.24 Operating Frequency of Induction Furnace at t=1.7s ............................. 59
Figure 4.25 Harmonic Spectrum of Induction Furnace at t=3.7s............................... 60
Figure 4.26 Operating Frequency of Induction Furnace at t=3.7s ............................. 60
Figure 4.27 Harmonic Spectrum of Induction Furnace at t=4.95s............................. 61
Figure 4.28 Operating Frequency of Induction Furnace at t=4.95s ........................... 61
Figure 4.29 Harmonic Spectrum of Induction Furnace at t=7.5s............................... 62
Figure 5.1 Shunt APF Connected to The Nonlinear Load ......................................... 64
Figure 5.2 Basic Compensation Principle And Shapes of The Load, Source, And
Filter Current............................................................................................ 65
Figure 5.3 The Power Circuit of Current Fed Active Power Filter............................ 66
Figure 5.4 The Power Circuit of Voltage Fed Active Power Filter ............................ 67
IX
Figure 5.5 Diagram Illustrating Components of The Shunt Connected Active Power
Filter(BAYINDIR, 2006) ......................................................................... 68
Figure 5.6 Calculation Block Diagram of P-Q Method ............................................. 69
Figure 5.7 Principle of The Synchronous Reference Frame Method......................... 72
Figure 5 8 Block Diagram of Control Circuit ............................................................ 75
Figure 5.9 Power Circuit of PSCAD Model .............................................................. 76
Figure 5.10 Overall Block Diagram of Control in PSCAD Model............................ 77
Figure 5.11 Block Diagram of Enhanced Phase Locked Loop .................................. 78
Figure 5.12 Epll Block of PSCAD Model For Current Signal .................................. 79
Figure 5.13 Inside of EPLL Block of PSCAD Model................................................ 79
Figure 5.14 EPLL Block For Voltage Signal ............................................................. 80
Figure 5.15 Inside of EPLL Block For Voltage Signal .............................................. 80
Figure 5.16 EPLL Blocks For Three Phase Current .................................................. 81
Figure 5.17 EPLL Blocks For Three Phase Voltage................................................... 82
Figure 5.18 SC Blocks In PSCAD Model.................................................................. 83
Figure 5.19 Block Diagram of The Structure to Estimate The Instantaneous
Symmetrical Components Defined By (5.14)....................................... 86
Figure 5.20 Block Diagram of The Structure To Estimate The Instantaneous
Symmetrical Components Defined By (5.15)....................................... 87
Figure 5.21 Block Diagram of The Structure To Estimate The Instantaneous
Symmetrical Components Defined By (5.16).......................................... 88
Figure 5.22 Block Diagram of The Structure To Estimate Instantaneous Positive .......
............................................... 89
Sequence Components Defined By (5.19)
Figure 5.23 Symmetrical Components Block of PSCAD Model .............................. 90
Figure 5.24 Second Stage EPLL Block...................................................................... 91
Figure 5.25 Block Diagram of The Reactive Current Extraction Unit ...................... 92
Figure 5.26 Block Diagram of The Reactive Current Extraction of PSCAD Model. 93
Figure 5.27 Inside of The Reactive Current Extraction Block................................... 93
Figure 5.28 Block Diagram of The DC Link Control ................................................ 94
Figure 5.29 DC Link Control Block of PSCAD Model............................................. 94
Figure 5.30 Inside of DC Link Control Block of PSCAD Model.............................. 95
X

Figure 5.31 Reference Signal..................................................................................... 95
Figure 5.32 PWM Block For PSCAD Model ............................................................ 96
Figure 5.33 Inside of The PSCAD Block................................................................... 97
Figure 5.34 Combination of Shunt Active Filter And Passive Filter ......................... 98
Figure 5.35 Passive Filter Models of The PSCAD .................................................... 99
Figure 5.36 Passive Filter Control Block of The PSCAD ....................................... 100
Figure 6.1 Power Circuit of Modeled System.......................................................... 104
Figure 6.2 Three Phase Source Current of The Network......................................... 105
Figure 6.3 Three Phase Load Current of The Network............................................ 106
Figure 6. 4 Phase A Source Current of The Network............................................... 106
Figure 6.5 Phase A Load Current of The Network................................................... 107
Figure 6.6 Phase A Load And Source Current of The Network............................... 107
Figure 6.7 Three Phase Source Voltage of The Network ......................................... 108
Figure 6.8 Phase A Source Voltage of The Network................................................ 108
Figure 6.9 Total Harmonic Distortion of Load Current of The Network................. 109
Figure 6.10 Total Harmonic Distortion of Source Current of The Network............ 109
Figure 6.11 The DC Link Voltage of The Active Power Filter ................................ 110
Figure 6.12 The Reactive Power of The Source And Load Waveform.................... 110
Figure 6.13 The Secondary Side Injected Current Rms Value of APF .................... 111
Figure 6.14 The Primary Side Injected Current Rms Value of APF ........................ 111
Figure 6.15 Input Signal of EPLL Circuit................................................................ 112
Figure 6.16 Error Signal Calculated By EPLL ........................................................ 112
Figure 6.17 Output Signal of Signal of EPLL Circuit.............................................. 113
Figure 6.18 Reference Signal Generated By Control Circuit .................................. 113
Figure 6.19 Reference Signal And APF Current Signal........................................... 114
Figure 6.20 Three Phase Source Current of The Network....................................... 115
Figure 6.21 Three Phase Load Current of The Network.......................................... 115
Figure 6.22 Phase A Source Current of The Network.............................................. 116
Figure 6.23 Phase A Load Current of The Network................................................. 116
Figure 6.24 Phase A Load And Source Current of The Network............................. 117
Figure 6.25 Three Phase Source Current of The Network....................................... 117
XI

Figure 6.26 Phase A Source Voltage of The Network.............................................. 118
Figure 6.27 Total Harmonic Distortion of Load Current of The Network............... 118
Figure 6.28 Total Harmonic Distortion of Source Current of The Network............ 119
Figure 6.29 The DC Link Voltage of The Active Power Filter ................................ 119
Figure 6.30 The Reactive Power of The Source And Load Waveform.................... 120
Figure 6.31 The Secondary Side Injected Current Rms Value of APF .................... 121
Figure 6.32 The Primary Side Injected Current Rms Value of APF ........................ 121
Figure 6.33 Input Signal of EPLL Circuit................................................................ 122
Figure 6.34 Error Signal Calculated By EPLL ........................................................ 122
Figure 6.35 Output Signal of EPLL Circuit ............................................................. 123
Figure 6.36 Reference Signal Generated By The Control Circuit ........................... 123
Figure 6.37 Reference Signal and APF Current Signal............................................ 124
Figure 6.38 Three Phase Source Current of The Network....................................... 124
Figure 6.39 Three Phase Load Current of The Network.......................................... 125
Figure 6.40 Phase A Source Current of The Network.............................................. 125
Figure 6.41 Phase A Load Current of The Network................................................. 126
Figure 6.42 Phase A Load and Source Current of The Network.............................. 126
Figure 6.43 Three Phase Source Voltage of The Network ....................................... 127
Figure 6.44 Phase A Source Voltage of The Network.............................................. 127
Figure 6.45 Total Harmonic Distortion of Load Current of The Network............... 128
Figure 6.46 Total Harmonic Distortion of Source Current of The Network............ 128
Figure 6.47 The DC Link Voltage of The Active Power Filter ................................ 129
Figure 6.48 The Reactive Power of The Source and Load Waveform..................... 129
Figure 6.49 The Secondary Side Injected Current Rms Value of APF .................... 130
Figure 6.50 The Primary Side Injected Current Rms Value of APF ........................ 130
Figure 6.51 Input Signal of EPLL Circuit................................................................ 131
Figure 6.52 Error Signal Calculated By EPLL ........................................................ 131
Figure 6.53 Output Signal of EPLL Circuit ............................................................. 132
Figure 6.54 Reference Signal Generated By The Control Circuit ........................... 132
Figure 6.55 Reference Signal and APF Current Signal............................................ 133
XII

XIII
LIST OF SYMBOLS
Vc Capacitor voltage
Vmax Maximum voltage
fo Operating frequency
Ic Compensating current
IL Load current
P1 Instantaneous Real power
q1 Instantaneous Imaginary power
α Alfa component
β Beta component
IS Source current
ia Phase A current
ib Phase B current
ic Phase C current
Va Phase A voltage
Vb Phase B voltage
Vc Phase C voltage
p D.C. component of real power
p~ A.C component of real power.
q D.C. component of imaginary power
q~ A.C. component of imaginary power
iF Current reference signal
iL+ Positive sequence current
iL- Negative sequence current
iL0 Zero sequence current
id d-q frame d component current
iq d-q frame q component current
Vfa Phase A voltage fundamental component
V-a Phase A voltage negative sequence component
XIV
Vha Phase A voltage negative harmonic component
V+ Instantaneous positive-sequence components of the voltage
I+ Instantaneous positive-sequence components of the current
Ø Phase displacement between voltage and current
ia+ Active component of fundamental current
ir+ Reactive component of fundamental current
Fa Phasors of phase A
VDC Capacitor voltage of active filter
Qc Capacitive power
V Nominal line voltage
Xc Capacitive impedance
FL Line frequency
C filter capacitor
FR Resonance frequency
L filter inductance
A Amplitude
VREF Reference value of capacitor voltage
XV

LIST OF ABBREVATIONS
DRI Direct Reduced Iron
EAF Electric Arc Furnace
BOF Basic Oxygen Furnace
AC Alternating Current
DC Direct current
EU European Union
IF Induction Furnace
LMF Ladle melt furnace
PQ Power Quality
IEC International Electrotechnical Commission
UPS Uninterruptable Power Supply
IEEE The Institute of Electrical and Electronics Engineers
PCC Point of common coupling
SCR Short Circuit Ratio
TDD Total demand distortion
IGBT insulated gate bipolar transistor
APF Active Power Filter
DVR Dynamic voltage restorer
UPQC Unified Power Quality Conditioner
PWM Pulse Width Modulation
GTO Gate Turn Off THYRİSTOR
SAPF Shunt active power filter
NPC neutral-point-clamped
PLL Phase locked loop
FFT Fast Fourier Transform
IRP Instantaneous Reactive Power Compensation
HPF High Pass Filter
LPF Low Pass Filter
SVM Space vector modulation
XVI

XVII
DFT Discrete Fourier Transform
EPLL Enhanced Phase Locked Loop
SC Symmetrical component
VSI Voltage Source Inverter
RMS root mean square
pu per unit
PI Proportional Integral

1. INTRODUCTION Can Onur TOKUNÇ
1. INTRODUCTION
Steel is crucial to the development of any modern economy and is considered
to be the backbone of human civilisation. The level of per capita consumption of
steel is treated as an important index of the level of socioeconomic development and
living standards of the people in any country. It is a product of a large and
technologically complex industry having strong forward and backward linkages in
terms of material flows and income generation. All major industrial economies are
characterized by the existence of a strong steel industry and the growths of many of
these economies have been largely shaped by the strength of their steel industries in
their initial stages of development.
The Turkish iron and steel sector, in existence since the late 1930’s, is
growing rapidly, swiftly making Turkey one of the largest producers of crude steel in
the world. In 2006, Turkey reached an annual production of 23.3 million tons of
crude steel, which increased to 25.6 million tons in 2007 – enough to place it as the
11th largest producer worldwide and third in Europe.
The new level of crude steel is 78 percent higher than it was in 2001,
representing a huge boon for the industry. Turkey has also proven to be a good
consumer of iron and steel, with consumption up to 18.5 million tons – a 110 percent
increase since 2001(Istanbul Chamber Of Commerce,2008).
The steel industry is the largest energy-consuming industry in the world.
Currently, energy represents about 20% of the total cost of producing steel and is
rising. The increasing cost of energy and even its current and future availability have
led to the need to refocus attention on energy intensity in steel production (American
Iron And Steel Industry Institute, 2005).
The iron and steel sector covers the production of crude steel via the primary
and secondary production routes, including the pre-production steps coke making,
sintering and pelletisation, as well as further processing of ferrous metals.
The production of crude steel is in principle carried out via two routes,
differing as well in the metallurgical process, energy input and process emissions as
in the quality and application purpose of the products. Starting from iron ore, BOF
1

1. INTRODUCTION Can Onur TOKUNÇ
crude steel is produced via the production of hot metal in a blast furnace and its
following conversion to crude steel in a basic oxygen furnace, while EAF steel is
produced by the smelting of scrap or direct reduced iron in an electric arc furnace.
The production of BOF steel requires two preceding processes, namely coke
making and sintering. The process of coke making is the conversion of coal to coke
by heating of coal in absence of air (or oxygen) to remove the volatile components
and other substances like tars, which will be contained in coke oven gas. In the
sintering process, iron ores of different grain size are agglomerated together with
additives to create a material feed for the blast furnace with improved permeability
and reducibility. Hot metal is most commonly produced in blast furnaces that are fed
with sinter, coke and additives. To make best possible use of the heat of roughly
1600°C, hot metal is conveyed as fast as possible to the basic oxygen furnace, where
its conversion to crude steel takes place. Oxygen is blown through molten hot metal
in the BOF in order to drive out the carbon content. Scrap is added to the BOF to be
able to control the reaction and keep the temperature within limits.
Alternatively to the blast furnace process iron ore can also be converted into
metallic iron in a direct reduction process. The product yielded is often referred to as
“direct reduced iron (DRI)” or “sponge iron”. Direct reduced iron is used instead of
scrap as input for electric arc furnaces (ECOFYS, 2009).
2

1. INTRODUCTION Can Onur TOKUNÇ
Figure 1.1 Crude steel production processes (ECOFYS, 2009)
In the electric steel process, the heat required is obtained not by oxygen
combustion of the accompanying elements in the pig iron, but from electrical energy.
The conversion of electrical energy into heat can be achieved by an electric or,
induction furnace. Electric steel processes are based on the use of scrap, with small
amounts.
Over 90 % of all electric steel produced is by the use of the A.C. electric arc
furnace. Three graphite electrodes carry the current through the furnace roof into the
charge of metal. The electric arc formed melts the charge at temperatures up to
3500°C. The Furnace has the following essential components: the vessel or shell
with a furnace door and a tapping hole; the roof which can be removed for charging;
electrode arms which support the electrodes; tilting equipment for emptying the
furnace; the furnace transformer; and the measuring and control equipment (Quass
et.al, 2007). The flicker and harmonics generated by electric arc furnaces present a
problem that is well known to both the steel industry and electrical utilities. The
familiar methods to completely resolve that power quality problems are to install a
dynamic static reactive power compensation device (SVC).
3

1. INTRODUCTION Can Onur TOKUNÇ
One of the most economic ways of producing steel is made through the use of
induction furnaces. Usually a typical induction furnace is designed with a topology
formed by an AC – DC converter (rectifier), a filter and a DC – AC converter
(inverter). Converters are highly used in industrials. Often these converters that are
used in the induction heating furnaces have a three phase rectifier and a single phase
inverter. In these converters, load is coil of induction heating furnace that can be
controlled in the form of parallel and series with a capacitor bank. If changing
current of switches of inverters are varied by changing current load naturally. The
block diagram of induction furnace is shown in Figure1.2.
Figure 1.2 Block diagram of an actual induction heating furnace
The problem with this kind of furnaces, from an electrical point of view, is
the creation of a considerable harmonic distortion. The cause of the distortion is
within the induction furnace design and operation. An induction furnace works
melting the scrap using a medium frequency magnetic field created by a coil. The
coil is fed by the medium frequency AC current supplied by an inverter which is fed
by a DC current converter connected to the AC distribution network supply.
As the created distortion is very high and affects the voltage supplied by the
distribution network, it is highly possible that other loads supplied from the same
network will be affected. In this case, it is necessary to have corrective actions in
order to fulfill the legislation concerning voltage harmonic distortion.
Some power electronic loads are capable of producing currents over a whole
range of frequencies, which has brought about increased interest in interharmonics.
The electronically-controlled induction furnace is, perhaps, the epitome of such a
load. This type of furnace has also become popular with small- to medium-sized
casting operations that can be served from distribution systems. Traditional methods
for solving harmonic problems did not work. Power quality analyzers not designed to
4
1. INTRODUCTION Can Onur TOKUNÇ
display interharmonics gave confusing readings. Significant utility and consulting
manpower was required to diagnose and solve the problem.
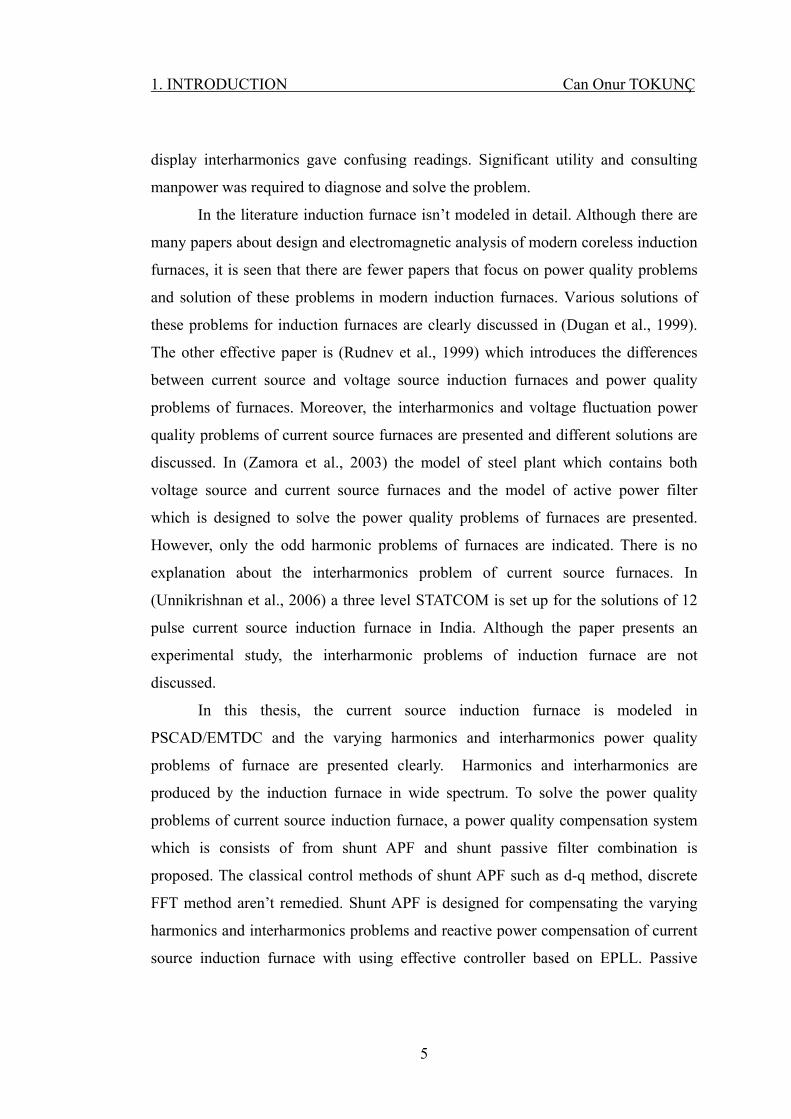
In the literature induction furnace isn’t modeled in detail. Although there are
many papers about design and electromagnetic analysis of modern coreless induction
furnaces, it is seen that there are fewer papers that focus on power quality problems
and solution of these problems in modern induction furnaces. Various solutions of
these problems for induction furnaces are clearly discussed in (Dugan et al., 1999).
The other effective paper is (Rudnev et al., 1999) which introduces the differences
between current source and voltage source induction furnaces and power quality
problems of furnaces. Moreover, the interharmonics and voltage fluctuation power
quality problems of current source furnaces are presented and different solutions are
discussed. In (Zamora et al., 2003) the model of steel plant which contains both
voltage source and current source furnaces and the model of active power filter
which is designed to solve the power quality problems of furnaces are presented.
However, only the odd harmonic problems of furnaces are indicated. There is no
explanation about the interharmonics problem of current source furnaces. In
(Unnikrishnan et al., 2006) a three level STATCOM is set up for the solutions of 12
pulse current source induction furnace in India. Although the paper presents an
experimental study, the interharmonic problems of induction furnace are not
discussed.
In this thesis, the current source induction furnace is modeled in
PSCAD/EMTDC and the varying harmonics and interharmonics power quality
problems of furnace are presented clearly. Harmonics and interharmonics are
produced by the induction furnace in wide spectrum. To solve the power quality
problems of current source induction furnace, a power quality compensation system
which is consists of from shunt APF and shunt passive filter combination is
proposed. The classical control methods of shunt APF such as d-q method, discrete
FFT method aren’t remedied. Shunt APF is designed for compensating the varying
harmonics and interharmonics problems and reactive power compensation of current
source induction furnace with using effective controller based on EPLL. Passive
5
1. INTRODUCTION Can Onur TOKUNÇ
6
filter which is formed from 4 - step is designed for reactive power compensation to
reduce the ratings of shunt APF.
The content of the thesis is arranged as follows:
After this introductory chapter, Chapter 2 Steel Production Methods and
Turkey Iron and Steel Industry are discussed.
In chapter 3, Induction furnace operation, power quality problems and
solutions are deeply explained.
In chapter 4, Operation principles of induction furnace are deeply discussed
and modeling of induction furnace is presented.
In chapter 5, Operation principle of shunt active filter and detuned passive
filter are explained, proposed control algorithm is deeply analyzed, proposed shunt
active filter and passive filter are modeled.
In chapter 6, Simulation results and different case studies are presented.
In chapter 7, the important conclusions of the study are explained.

2. STEEL PRODUCTION METHODS Can Onur TOKUNÇ
2. STEEL PRODUCTION METHODS AND TURKEY IRON AND STEEL
INDUSTRY
2.1. Steel Production Methods
Steel is used widely in all sectors of modern society, which could not exist
without steel. Steel is also a globally manufactured and traded commodity.
Production levels have been quite stable in industrialized countries, but demand has
increased massively in developing countries. Annual production of steel increased to
more than 1000 million tones for the first time in 2004. The year 2004 was also
noteworthy because, Chinese steel production and use surpassed production and use
in the second biggest market, the European Union (EU).
Globally, the construction sector is the biggest steel user followed by other
structural steelworks, mechanical engineering, car manufacturing and metal goods.
The construction sector has a large share especially in urbanizing developing
economies. Despite current global regression, most sectors using steel are still
growing and the general market situation for the steel sector on a global scale is
positive.
Approximately one-third of all manufactured steel is internationally traded,
but transfer distances are usually not long due to relatively high transfer costs. Low
value products are least profitable to transfer, but highly specified products can be
traded across very long distances. This is why most of the new capacity is built near
where there is new demand.
Steel production technology is mature and well-established. During the last
decades, there have been no major innovations, and it is likely that the next
generation of steel producing technologies will require more than 20 years of
research. At the same time, other drivers have changed quickly. The most significant
changes have been sharply increasing steel demand, the beginning of greenhouse gas
emission regulation and soaring prices of both raw material and products.
Other materials can replace steel in certain products, e.g., aluminum in cars or
wood in buildings, but currently these options are minor and the steel industry have
replied to these challenges by designing specific steel alloys for these purposes.
7

2. STEEL PRODUCTION METHODS Can Onur TOKUNÇ
Overall, customer-specific steel quality and products are the competitive advantage
of many western steel mills (Lindroos, 2009).
Currently, there are two main routes for the production of steel: production of
primary steel using iron ores and scrap and production of secondary steel using scrap
as the main raw material. A wide variety of steel products are produced by the
industry, ranging from slabs and ingots to thin sheets, which are used in turn by a
large number of manufacturing industries (Price et al.,2001).Steel production
requires several steps that can be accomplished with different processes. Both the
input material of each step and the process substantially affect the total energy
consumed during production.
Different parts of steel manufacturing processes are usually very closely
integrated at a plant level. Every installation has a unique combination of process
integrations, fuels, raw materials, etc. This intricate issue can again be simplified. To
sum up, steel can be produced by two processes: basic oxygen furnace (BOF) or
electric arc furnace (EAF). Figure 2.1 shows the general block diagram of the steel
production (Lindroos, 2009).
Figure 2.1 General Block diagram of the steel production
2.1.1. The Primary Steel Production
In essence, all primary iron and steel production processes are based on the
same chemical reactions. In iron ore, iron is presented in its oxidized form. In iron
8

2. STEEL PRODUCTION METHODS Can Onur TOKUNÇ
9
reduction processes, a reducing agent, based on carbon or hydrogen, removes the
oxygen from the iron. This removal can take place either above or below the melting
point of the ore and the reduced iron.
Reduction above the melting point results in pig iron. Above the melting
point, most of the gangue materials segregate from the liquid iron, and float upon it.
Because of the high temperature and the liquid state of the iron, carbon readily
dissolves in the pig iron, resulting in typical carbon contents between 4 and 6%.
Reduction and dissolution of some of the gangue material may result in silicon and
manganese contents of about 1%, depending on the ore composition and process
conditions. In addition, pig iron contains some sulphur and phosphorus.
Oxygen blowing converts the pig iron to steel by oxidation of the carbon,
silicon, and phosphorus. The carbon escapes mainly as carbon monoxide, while the
oxidized silicon, sulphur and phosphorus segregate into the slag. This segregation
process is enhanced by addition of flux materials, such as lime.
Reduction below the melting point results in directly reduced iron (DRI),
which retains the original shape of the ore, and includes the gangue material present
in the ore. At the temperature of reduction, the carbon of the reducing agent hardly
dissolves in the iron; therefore DRI contains virtually no carbon. For conversion of
DRI to steel, removal of the gangue material is necessary. Moreover, the carbon
content has to be adjusted to the required amount. Therefore, melting the DRI is
necessary to convert the DRI to steel.
Although the chemical reactions involved in the various steel production
methods are very similar, steel producing installations and the flows therein are very
different. Therefore, the various production routes have different demands with
regard to resources. Iron ore occurs as lump ore and fine ore, and the latter is often
processed into sinter or pellets. Both natural gas and coal are used as reducing
agents. The blast furnace requires the conversion of an important share of the coal to
coke. The demands with regard to the resources and necessary pre-processing steps
strongly influence costs, energy-use and emissions of the various routes leading from
ore to steel.
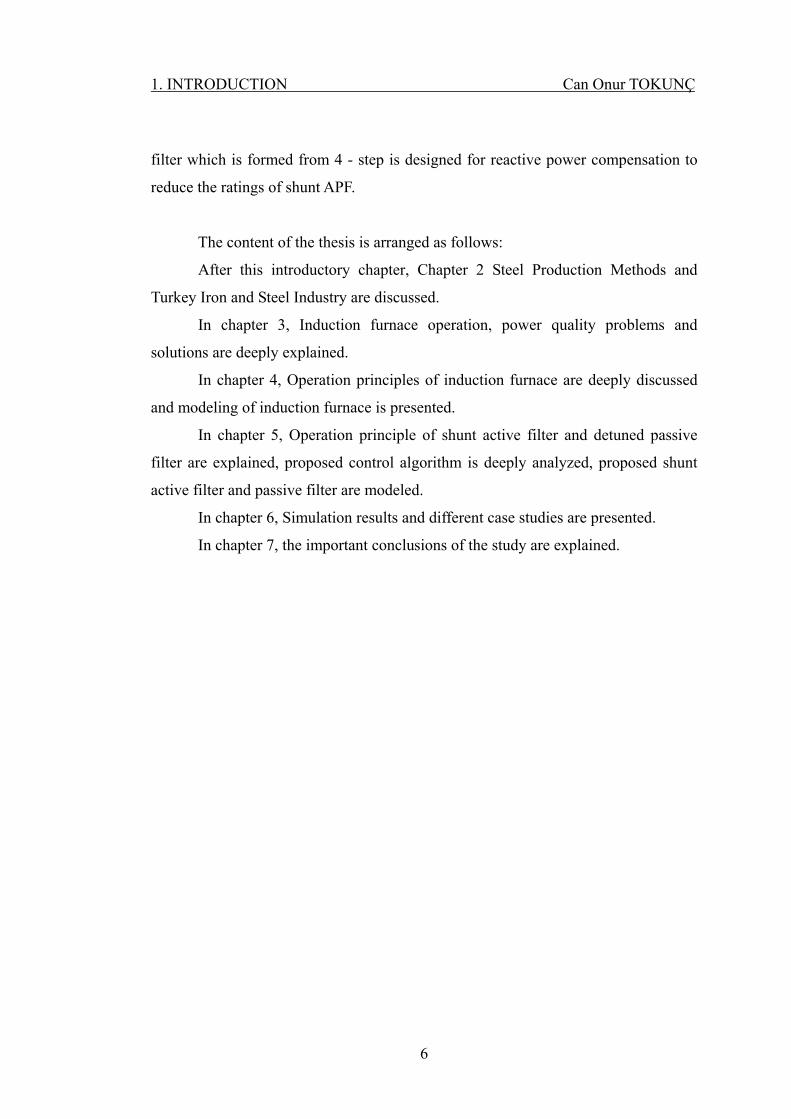
Figure 2.2 shows processes for steel production.
2. STEEL PRODUCTION METHODS Can Onur TOKUNÇ
Figure 2.2 Processes for steel production
10

2. STEEL PRODUCTION METHODS Can Onur TOKUNÇ
The oxygen steel production chain starts from iron ore, which is pelletized or
sintered and fed into the blast furnace with coke and air. Iron ore is a mixture of iron
and oxygen, and the most common form of iron ore is hematite (Fe2O3). Taking the
oxygen out of iron is called reducing. There is theoretical minimum for required
reduction agents, but it can be made with fuels containing only carbon or hydrogen.
In modern technology, the reducing is done mostly with carbon monoxide
(CO), which burns with oxygen from iron ore and forms carbon dioxide (CO2). One
source of the study concluded that the theoretical minimum of CO2 emissions from
the reduction of iron ore without hydrogen is 1415 kgCO2/ tone of reduced iron. The
emissions of the best available technology were around 1500 kgCO2/ tone of
reduced iron.
Small amounts of carbon monoxide can be replaced with hydrogen from oil
or natural gas. Hydrogen and oxygen from iron ore form only water, which allows
smaller emissions than represented emission limits with only coal.
After a blast furnace, reduced iron (pig iron) is shifted to a basic oxygen
furnace (BOF), where it is converted to steel. In order to change or improve the
properties of steel, various additives are fed in alongside the hot metal. Stainless
steel, for example, contains chromium at least 11.5% of its mass. Basic oxygen
furnaces can use also scrap steel to replace some pig iron. After the steel converter,
liquid steel is cast, rolled and finished for use.
In the oxygen steel process, the blast furnace is, by far, the largest CO2
emitter. The reduction process of iron ore is a source of over 90% of oxygen steel
greenhouse gas emissions. Future technologies will be more efficient, but existing
blast furnaces will be the dominant technology for at least 20 or 30 years. There are
also several other possibilities to decrease emissions below announced limits, for
example natural gas or charcoal.
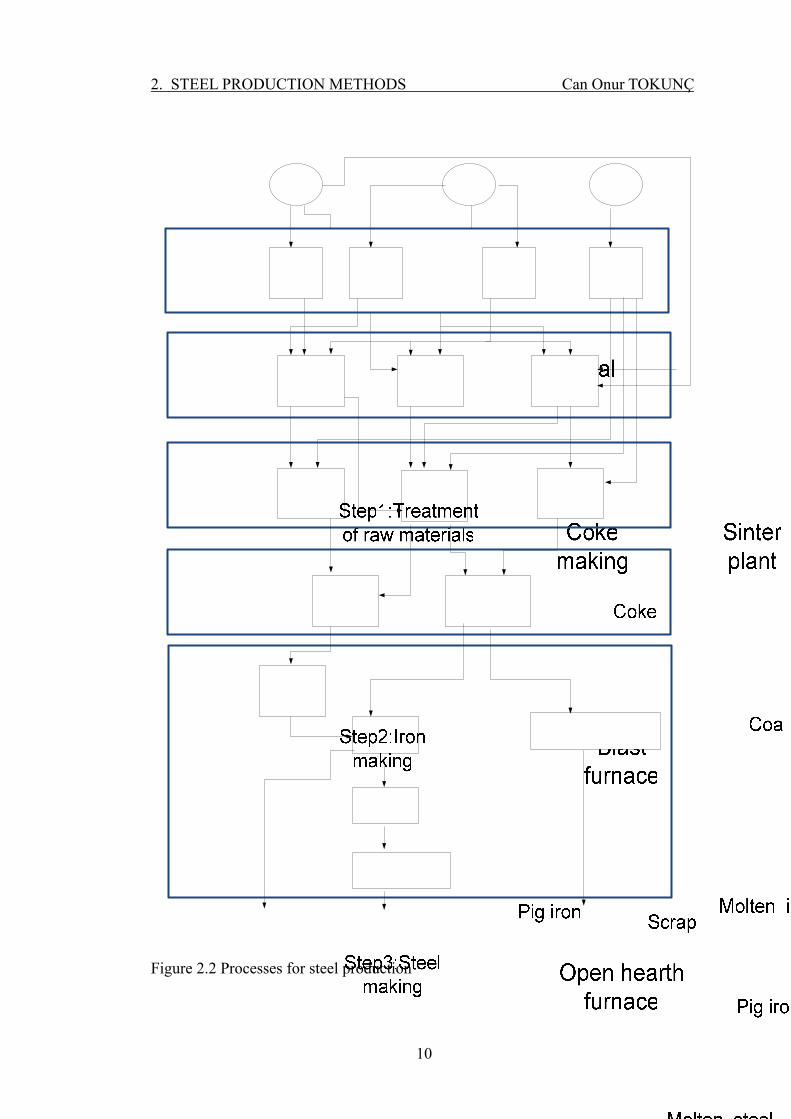
Figure 2.3 presents a more detailed scheme of the oxygen steel process, but it
still lacks many processes, inputs and other details. Installations may include only a
part of, or the entire, processes chain: for example, they may buy or produce the coke
or iron pellets, and the installation may handle further processing itself or sell the
crude steel. In addition, blast furnace gas and coke oven gas are burned to produce
11
2. STEEL PRODUCTION METHODS Can Onur TOKUNÇ
power and heat, but the power plant may be owned by the steel producer or other
company, and the steel installation may use all or just a part of the produced power
and heat. These variations create a multitude of installation boundaries and a
problematic definition of a sector boundary in sectoral approaches (Lindroos, 2009).
Figure 2.3 more detail scheme of the oxygen steel process chain
The blast furnace is the most energy-intensive step in an integrated steel mill
and requires about 11-15 GJ per tones of pig iron produced. Of this amount
approximately 7 GJ is used for the chemical reduction of iron ore to pig iron. In
addition, energy input is required to raise the temperature to a level at which the
chemical reduction can thermodynamically proceed at a sufficient rate. Carbon (from
energy sources such as coal or coke) is used both as the reducing agent and as the
energy input. The reducing agent (feedstock energy use) may constitute up to 50% of
12

2. STEEL PRODUCTION METHODS Can Onur TOKUNÇ
the total energy demand of an integrated steel mill. Accounting for which proportion
of energy input results in energy-related emissions and which results in process
related emissions is ongoing (ANNEX I EXPERT GROUP, 2001).
2.1.2. The Secondary Steel Production
Secondary, or scrap based, production of steel is very straightforward.
Melting steel scrap results in liquid steel, which can be shaped in the desired forms
by casting, rolling and finishing (Lankford, 1985). Secondary steel is produced in an
electric arc furnace (EAF) or in an induction furnace (IF) using scrap. The secondary
steel industry includes so-called “mini-mills”, which make relatively simple products
from low-priced scrap. In secondary steel production, the scrap is melted and refined,
using a strong electric current. Several process variations exist, using both AC or DC
currents, and fuels can be injected to reduce electricity use. Steel making based on
external scrap (scrap from outside the steel sector) requires less than half as much
primary energy as steel made from ore(Price et al.,2001).
2.1.2.1 Electric Arc Furnace
Electric arc furnaces (EAFs) are widely used in steelmaking and in smelting
of nonferrous metals. The EAF is the central process of the so-called mini-mills,
which produce steel mainly from scrap.
The electrical components in an EAF are fairly straightforward. The basic
alternating current (AC) EAF consists of an EAF transformer and three carbon
electrodes. These electrodes are connected to the EAF transformer secondary bus via
short multiple runs of large conductor. Also, there are two variations of the EAF that
see frequent usage today. The basic AC EAF now often has a multi-tapped series
reactor in the circuit connected to the EAF transformer high-side connections. The
other possible configuration is a direct current (DC) EAF. This version has a
thyristor controlled power converter connected to the secondary of the EAF
transformer and the output of this converter is connected between a single furnace
13
2. STEEL PRODUCTION METHODS Can Onur TOKUNÇ
electrode and a plate in the bottom of the furnace shell. Most DC EAF’s use a 12-
pulse power converter but there are some exceptions.
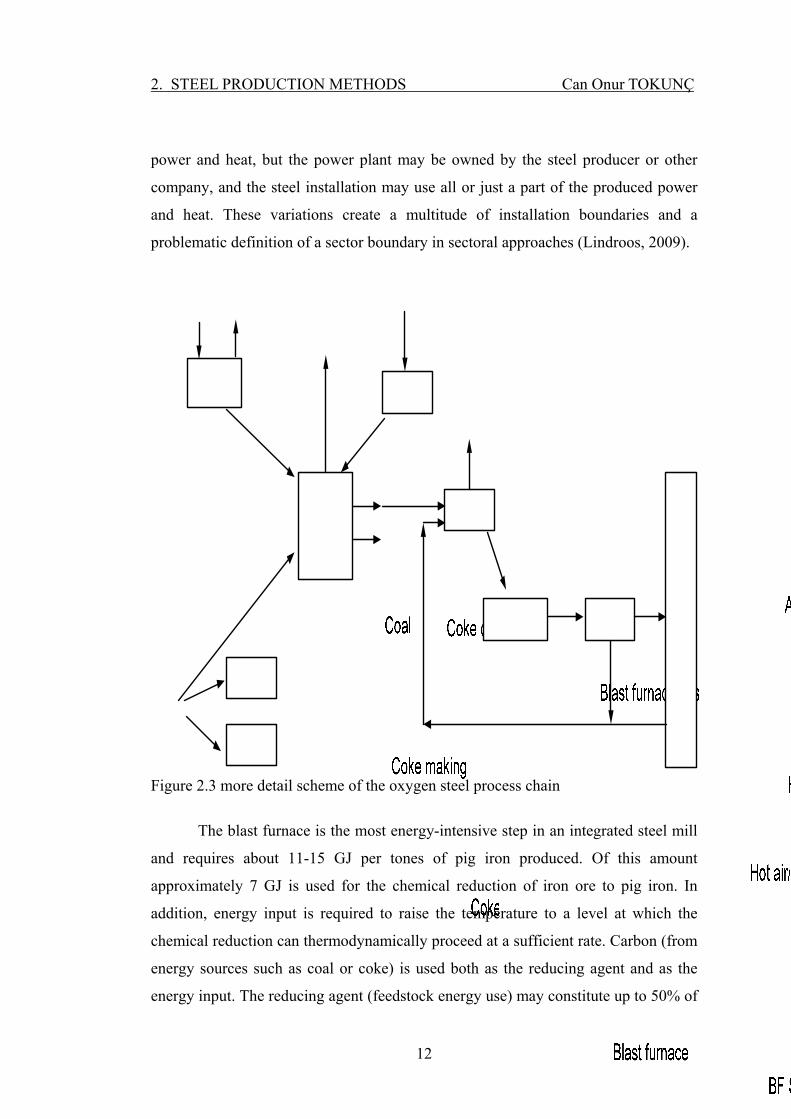
One additional furnace type is the ladle melt furnace (LMF). This type
furnace is used strictly for adjusting the molten metal temperature and/or metal
chemistry. An LMF almost always has just a basic configuration. All these possible
configurations are illustrated in Figure 2.4.
Figure 2.4 Single-lines of various EAF types (Burch, 2008).
Regardless of the configuration used, the actual operation of the EAF is the
same. A graphical representation is illustrated in Figure 2.5. Scrap metal is placed in
the furnace shell and the electrodes (or electrode in the case of a DC EAF), are
lowered into the shell. The scrap metal completes the electrical circuit between the
three phases causing basically an intentional short-circuit. The resulting heat due to
this short circuit in turn melts the scrap into a molten state. This initial phase of
melting is called the bore-in stage. During bore-in, the scrap starts out as various
14

2. STEEL PRODUCTION METHODS Can Onur TOKUNÇ
assorted sizes placed in a random fashion into the shell. As the scrap melts, the
remaining scrap collapses into the molten metal causing further melting. It is these
collapses, called cave-ins, that contribute to the worse flicker caused by an EAF. As
the scrap caves in, the scrap will move far enough from one or more electrodes such
that the arc is extinguished. Each furnace electrode can be independently controlled
hydraulically by a current sensing circuit. Once this circuit senses a loss or drop in
current through that electrode, the hydraulics will move the electrode toward the
scrap to reignite the arc. This action of striking an arc, extinguishing the arc, and re-
striking the arc occurs over and over in a random manner for each electrode during
the bore-in phase of melting. From an electrical perspective, this same process is the
source of wide power swings on the utility grid which translate into potentially large
voltage swings resulting in flicker.
Figure 2.5 Typical melt cycle components (Burch, 2008)
Once the initial load of scrap, or charge, has melted some two things happen.
The power swings will settle down as more molten metal is in the shell. This results
in a much smoother operation. Also, the furnace shell will now accommodate a
15

2. STEEL PRODUCTION METHODS Can Onur TOKUNÇ
second charge or load of scrap. When the second charge is added, there will again be
an initial period of bore-in to reduce the new scrap to molten metal. Once all the
scrap is molten, the EAF enters what is called the refining stage of the melt.
Sometimes this is referred to as the flat bath stage. During this stage, the power level
if fairly constant and the resulting voltage swings and flicker will be at a minimum.
While the above process is typical of all EAF’s, the type of EAF used can
limit both the power swings and the resulting flicker. By placing a series reactor in
series with the EAF, as explained above, the power swings can be reduced during the
bore-in phase. This is the predominate practice now for AC EAF operation. Also, the
use of DC converter technology to provide DC power to the furnace electrode also
reduces the resulting power swings and flicker (Burch, 2008).
2.1.2.2 Induction Furnace
The electric induction furnace differs from the electric arc furnace in that the
metal is heated by induced electric current within the charge rather than by an arc.
Induction furnaces are generally smaller than electric arc furnaces, and often they are
used in iron and steel foundries and for special purposes such as melting under
vacuum or in an inert atmosphere, and melting of relatively high-purity charge
materials. The induction furnace is also used in combination with the cupola or EAF
for increasing the metal temperature and as a holding furnace. Induction furnaces are
used to a limited extent for melting special grades of steel. Steel castings also are
made by some producers of steel ingots (Fenton, 2005).
The two most common induction melting furnace designs are the coreless and
channel furnaces.
Channel type induction furnaces basically consist of a vessel to which one or
more inductors are attached. The inductor is actually a transformer whereby the
secondary winding is formed with the help of a loop of liquid metal confined in a
closed refractory channel. In the furnace the energy is transformed from the power
system at line frequency through a power supply to the inductor and converted into
heat. One advantage of this type of furnace is that the vessel or upper case can be
16
2. STEEL PRODUCTION METHODS Can Onur TOKUNÇ
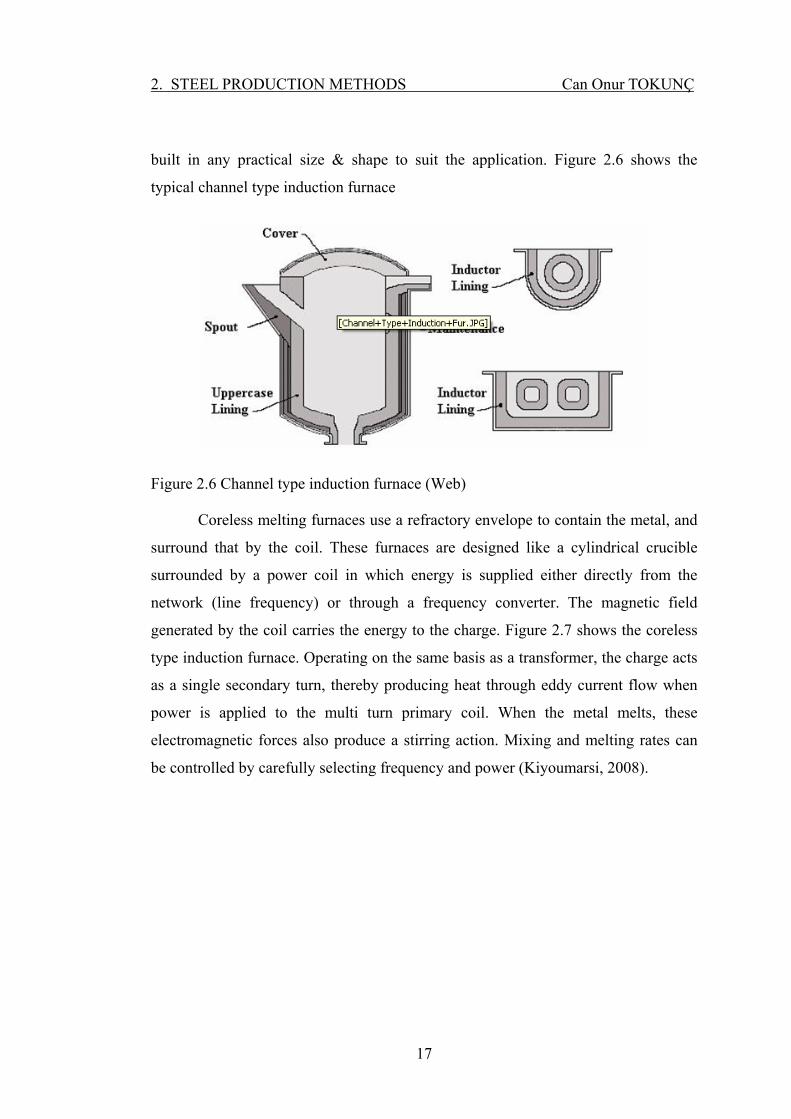
built in any practical size & shape to suit the application. Figure 2.6 shows the
typical channel type induction furnace
Figure 2.6 Channel type induction furnace (Web)
Coreless melting furnaces use a refractory envelope to contain the metal, and
surround that by the coil. These furnaces are designed like a cylindrical crucible
surrounded by a power coil in which energy is supplied either directly from the
network (line frequency) or through a frequency converter. The magnetic field
generated by the coil carries the energy to the charge. Figure 2.7 shows the coreless
type induction furnace. Operating on the same basis as a transformer, the charge acts
as a single secondary turn, thereby producing heat through eddy current flow when
power is applied to the multi turn primary coil. When the metal melts, these
electromagnetic forces also produce a stirring action. Mixing and melting rates can
be controlled by carefully selecting frequency and power (Kiyoumarsi, 2008).
17

2. STEEL PRODUCTION METHODS Can Onur TOKUNÇ
Figure 2.7 Coreless Type Induction Furnace (Web)
2.2. Turkey Iron And Steel Industry
Turkish steel industry, which has born when the first integrated iron and steel
plant of the country Karabuk Iron and Steel Works (KARDEMIR) has started
operation in 1939, has gain acceleration after Eregli Iron and Steel Works
(ERDEMİR) and Iskenderun Iron and Steel Works (ISDEMIR) started to operate in
years 1965 and 1975, respectively. Takeover of ISDEMIR by ERDEMIR on
condition to transformation to flat production was the highest noteworthy
development of the sector in the latest years. While the establishment of electrical
arc furnace plants, which were started to be established with the affect of economical
liberation moves starting from 1980’s, form the most important building structure of
the sectorial development, Turkish iron and steel industry shows big development in
the last 20 years by means of both production and quality and become one of the
most important steel producer countries. Turkey, which has produced 2.4 million
tons of steel in 1980, increased its production to 9.3 million tons in 1990 and 14.3
million tons in 2000. Turkey has produced 25.75 million tons of steel in 2007 and it
has become the 11th largest steel producer country of the world. Turkey, as a fast
growing country in steel sector, has maintained its high growing rate in 2008 despite
the effects of world financial crisis and the country increased its production by 4,1%
18
2. STEEL PRODUCTION METHODS Can Onur TOKUNÇ
to 26.81 million tons. Turkish steel exports has reached 2.5 billion USD record value
in August 2008, and then became 2.2 billion in September, 1.2 billion in October,
824 million in November, 860 million in December.
Turkey was the world’s 11th
steel producer with a total production of 20.9
million tonnes in 2005, accounting for 2.0% of total world steel production. It ranked
12th
in 2004 with a total production of 20.5 million tones and a growth rate of 12%
over 2003. In the early 1980s, three government-owned integrated steel producers
controlled a substantial majority of the capacity. Over the past two decades,
significant capacity has been added through private mini-mill investments. As a
result, Turkey has become one of the major players in the global steel market.
The industry consists of three main types of players: Integrated steel
producers, mini-mills using electrical arc furnaces (EAF) and processors. Currently,
3 integrated plants and 16 electrical arc furnaces operate in the sector. Processors
import semis or purchase them from integrated steel producers and mini-mills. With
the exception of one cold rolling company that produces flat products and a few
companies producing specialized products such as spring steel, most of these players
are sub-scale rolling mills supplying low-value-added, often very substandard, long
products to the construction industry (Anonymous, 2006).
Today its electricity demand is nearly one tenth of the installed generation
capability of 40 GW in the country. Steel production in Turkey is based on extensive
use of arc and ladle furnaces in most of the plants, which is the cause of power
quality problems at those locations of the Turkish Electricity Transmission System.
Power quality (PQ) of electric arc furnaces (EAF) has been investigated
previously by some other researchers Arc furnace characterization of one plant has
been achieved in terms of PQ parameters given in the IEC standard 61000-4--30.
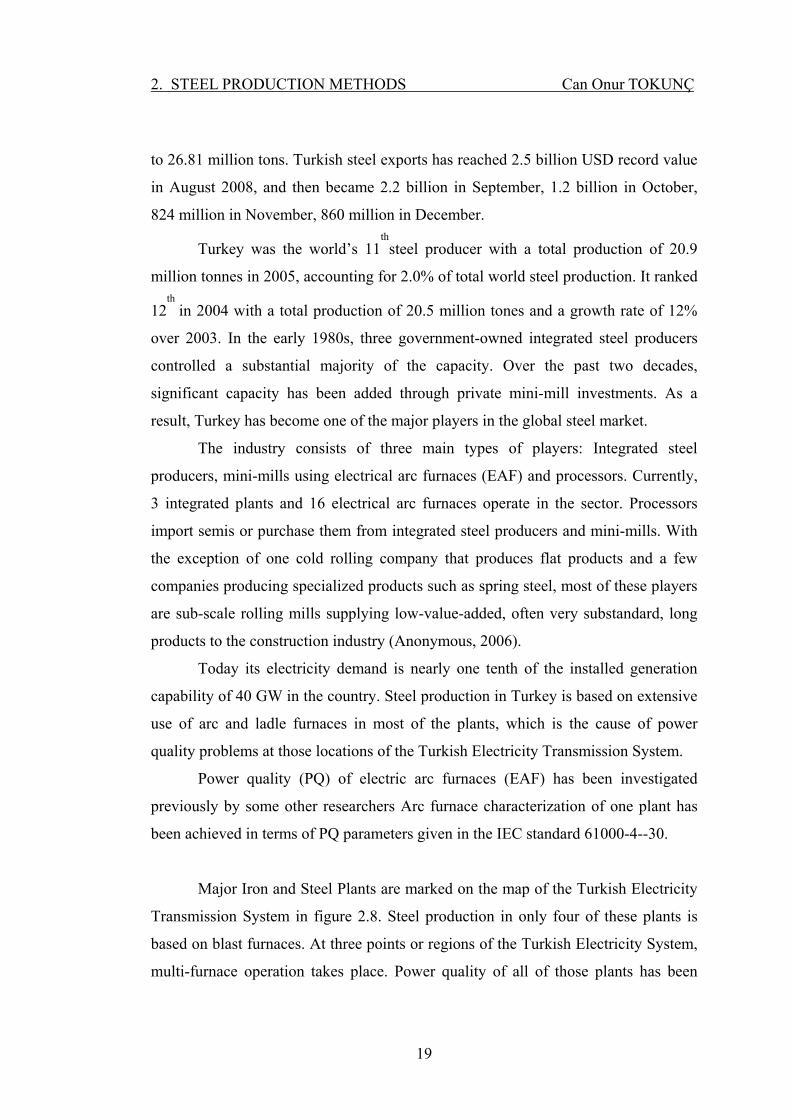
Major Iron and Steel Plants are marked on the map of the Turkish Electricity
Transmission System in figure 2.8. Steel production in only four of these plants is
based on blast furnaces. At three points or regions of the Turkish Electricity System,
multi-furnace operation takes place. Power quality of all of those plants has been
19

2. STEEL PRODUCTION METHODS Can Onur TOKUNÇ
20
investigated based on the field measurements carried out according to IEC 61000-4-
30 for Class B performance by using the mobile monitoring systems((Salor et al.,
2010).
By the end of year 2009, 50 MVAR STATCOM prototype has been made
ready for commissioning at Sincan Transformer Substation. And also medium
voltage active filter prototype has been successfully commissioned at TEİAŞ
Denizli-2 Transformer Substation. Measurements with transient events and
harmonics measurement systems have been started.
Figure 2.8 Location of iron and steel plants on the Turkish Electricity Transmission System

3. INDUCTION FURNACE OPERATION Can Onur TOKUNÇ
3. INDUCTION FURNACE OPERATION, POWER QUALITY PROBLEMS
AND SOLUTIONS
3.1. Induction Furnace Operation
Today, power quality studies are becoming a growing concern. The most
important parameters which affect power quality are harmonics, voltage instability
and reactive power burden. They cause low system efficiency, poor power factor,
cause disturbance to other consumers and interference in the nearly communication
networks. The increased problems in power networks impose to identify the sources
of power quality deterioration (Iagar et al., 2009).
As technology advances, the electrical loads are multiplying in numbers and
complexity. This throws tremendous challenge to the quality of power supply
system. Power electronic converters are examples of such types of loads. Steel mills,
which employ induction furnaces for melting scrap iron is one of the industrial areas
where the use of such power converters is inevitable. The tuned filters or passive
compensators are the traditional solution for harmonics issues. Since they are tuned
for a fixed frequency they are not affective for varying harmonics spectrum. The
induction furnace is a typical example of load, which generates harmonics in
different spectrum based on the configuration of the controlled rectifier i.e., 12-pulse
for heating mode or 6-pulse for sintering mode. Passive filters are also susceptible to
sinking the harmonics injected by other loads in the grid. To overcome these
shortcomings of passive filters various active power filter configurations have been
reported (Unnikrishnan et al., 2006).
When capacitors are placed on distribution systems, there will always be one
or more frequencies at which the system could resonate. While there are often
harmonic-producing loads on the systems, there have been relatively few instances
where severe resonances have occurred. Only I-2% of all feeders have harmonic
voltage distortion exceeding limits. The solution to resonances is generally to change
capacitor sizes or move the banks so that the system is tuned away from troublesome
harmonics.
21

3. INDUCTION FURNACE OPERATION Can Onur TOKUNÇ
Induction heating is a well established widespread technology, which finds
application in a large variety of industrial production processes. Since the basic
principles of the technology are well known for many years, the competition in the
market is very strong and the success among competitors is determined by the
improvement of processes for obtaining better quality, higher fabrication rate of
products and the reduction of cost of the installations (Lupi, 2003). Induction heating
equipments do not introduce dust and noise emissions in operation, but cause power
quality problems in the electric power system.
Since the 1970s, induction has been the number one method of melting in
non-ferrous metal foundries and an important tool in iron foundries. New technology
is improving induction power supplies, furnace refractory linings, heat recovery, and
overall system control. In the last ten years, the use of induction melting has
increased by as much as 20% per year, making it the fastest growing electric
technology in metals production. Over time, induction may even surpass
conventional use of electric arc furnaces in both tons of production and kilowatt-
hours of energy use (Rudnev et al., 1999). The problem with this kind of furnaces,
from an electrical point of view, is the creation of a considerable harmonic distortion.
The cause of the distortion is within the induction furnace design and operation.
An induction furnace works melting the scrap using a medium frequency
magnetic field created by a coil. The coil is fed by the medium frequency AC current
supplied by an inverter which is fed by a DC current converter connected to the AC
distribution network supply. The principle of an induction furnace is based on the
principle of a transformer. The induction coil represents the primary winding and the
melting material represents the secondary winding of transformer (Zamora et al.,
2003).
Modem induction furnaces use electronic power converters to supply a
variable frequency to the furnace induction coil. Figure 3.1 shows the block diagram
of the modern induction furnace. The frequency at the melting coil varies to match
the type of material being melted and the amount of material in the furnace. The
furnace coil and capacitor basically form a resonant circuit and the dc-to-ac inverter
drives the circuit to keep it in resonance. Thus, all the reactive power for the coil is
22

3. INDUCTION FURNACE OPERATION Can Onur TOKUNÇ
supplied by the capacitor. The inductance of the coil varies depending on the type,
temperature, and amount of material. This results in a varying operating frequency
for the furnace. The typical range of frequencies for a steel- melting furnace of the
type encountered in this case is 150 - 300 Hz (Dugan et al., 1999).
Figure 3.1 Block diagram of a modern induction furnace with a current- source inverter
The power supply of an induction-melt furnace provides both the power and
control required to properly melt metal. Early induction melting was carried out at
line frequency, with power provided by a special transformer and tuning circuits.
Switching capacitors provided power factor adjustment, and changing transformer
taps regulated the power level. For maximum melting power, the resonant frequency
of a tuned LC circuit had to be matched to the line frequency. This condition limited
the coil current and therefore the efficiency of the furnace because the 50-Hz line
frequency results in relatively high penetration into the melt and excessive stirring.
Also, early induction-melt furnaces were single-phase loads, which draw heavily
from only one phase of a three-phase system and limit the power available from the
utility service (Rudnev et al., 1999).
The advent of large-scale solid-state power supplies has greatly improved
induction melting. Three-phase converters can be operated at a high power factor,
thereby increasing the practical power ratings in a typical application. These power
supplies also precisely control frequency and the depth of penetration to efficiently
melt the material without over-stirring. The process is more efficient because the
variable frequency power supplies are able to match the varying electrical
characteristics of different metals during melting. The electronic power supply that is
23
3. INDUCTION FURNACE OPERATION Can Onur TOKUNÇ
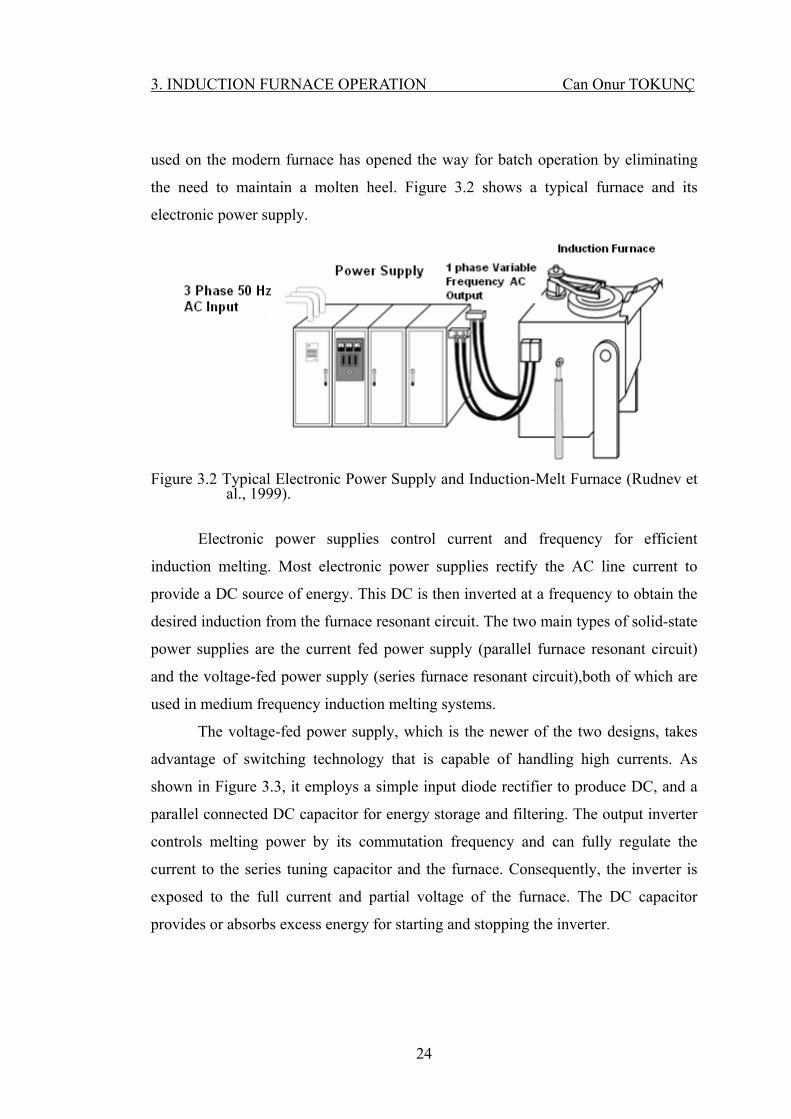
used on the modern furnace has opened the way for batch operation by eliminating
the need to maintain a molten heel. Figure 3.2 shows a typical furnace and its
electronic power supply.
Figure 3.2 Typical Electronic Power Supply and Induction-Melt Furnace (Rudnev et
al., 1999).
Electronic power supplies control current and frequency for efficient
induction melting. Most electronic power supplies rectify the AC line current to
provide a DC source of energy. This DC is then inverted at a frequency to obtain the
desired induction from the furnace resonant circuit. The two main types of solid-state
power supplies are the current fed power supply (parallel furnace resonant circuit)
and the voltage-fed power supply (series furnace resonant circuit),both of which are
used in medium frequency induction melting systems.
The voltage-fed power supply, which is the newer of the two designs, takes
advantage of switching technology that is capable of handling high currents. As
shown in Figure 3.3, it employs a simple input diode rectifier to produce DC, and a
parallel connected DC capacitor for energy storage and filtering. The output inverter
controls melting power by its commutation frequency and can fully regulate the
current to the series tuning capacitor and the furnace. Consequently, the inverter is
exposed to the full current and partial voltage of the furnace. The DC capacitor
provides or absorbs excess energy for starting and stopping the inverter.
24

3. INDUCTION FURNACE OPERATION Can Onur TOKUNÇ
Dc
capa
cito
r
Figure 3.3 Voltage-Fed Power Supply Driving a Series-Resonant Furnace Circuit
As shown in Figure 3.4, the basic current-fed converter uses a phase-
controlled rectifier to convert AC to DC and to regulate the voltage on the DC link.
When current is flowing in the DC link, the two series connected inductors provide
energy storage and filtering. Consequently, a starter circuit is needed to energize
these inductors, and a crowbar circuit is used to discharge them when the melt is
complete. The inverter commutates or reverses the current to obtain the desired
output frequency, which, along with varying the rectifier output voltage, controls the
melting power.
Current-fed designs have been around longer and take advantage of rugged
and economical switching-device technology. The inverter is exposed to the full
furnace voltage. However, it only sees about 10% of the furnace resonant current
because the reactive component of the furnace current bypasses the inverter via the
parallel tuning capacitor. Consequently, the current-fed power supply has less control
over the furnace current than the voltage-fed power supply.
One side effect of using a phase-controlled rectifier in the current-fed power
supply is voltage notching. The line voltage is notched because a momentary line-to-
line fault occurs as each phase rectifier device is turned on before the other phase
device has commutated off. Depth of the notch depends on the circuit impedance
between furnace transformer and the rectifier. Width depends on the timing between
turn-on and turn-off. Notches are more severe near the converter, as illustrated in the
25
3. INDUCTION FURNACE OPERATION Can Onur TOKUNÇ
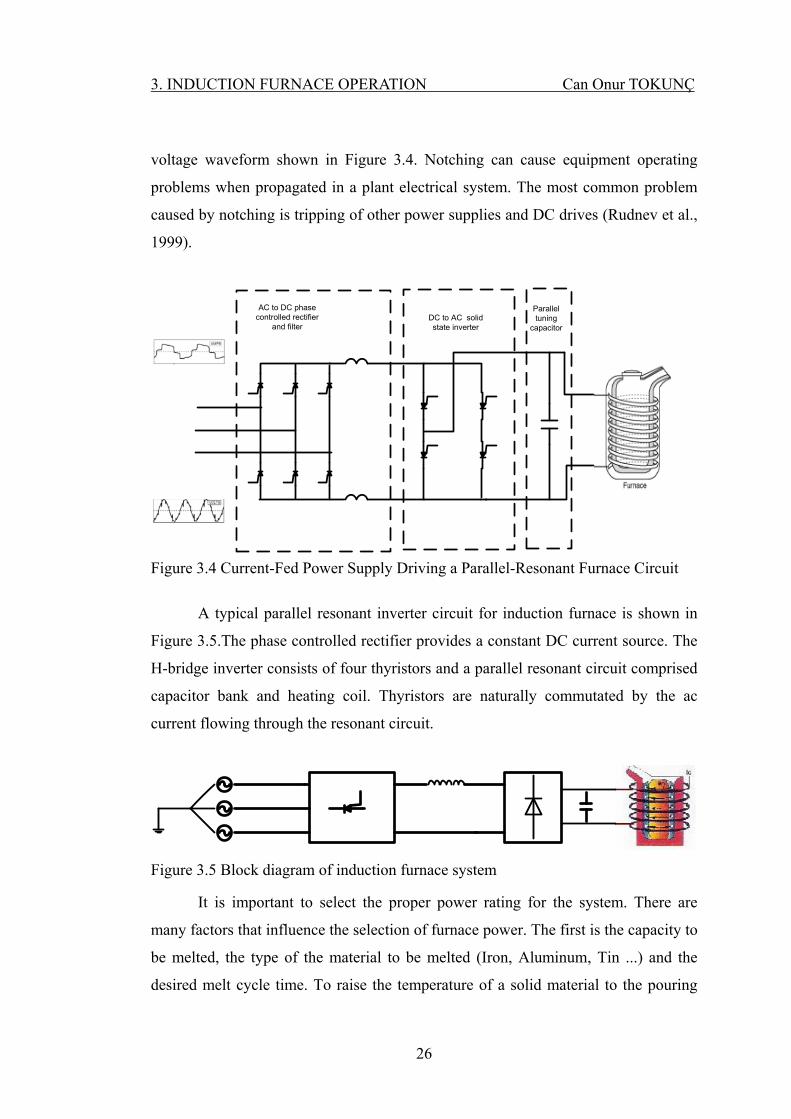
voltage waveform shown in Figure 3.4. Notching can cause equipment operating
problems when propagated in a plant electrical system. The most common problem
caused by notching is tripping of other power supplies and DC drives (Rudnev et al.,
1999).
DC to AC solid state inverter
Paralleltuning
capacitor
AC to DC phase controlled rectifier
and filter
Figure 3.4 Current-Fed Power Supply Driving a Parallel-Resonant Furnace Circuit
A typical parallel resonant inverter circuit for induction furnace is shown in
Figure 3.5.The phase controlled rectifier provides a constant DC current source. The
H-bridge inverter consists of four thyristors and a parallel resonant circuit comprised
capacitor bank and heating coil. Thyristors are naturally commutated by the ac
current flowing through the resonant circuit.
Figure 3.5 Block diagram of induction furnace system
It is important to select the proper power rating for the system. There are
many factors that influence the selection of furnace power. The first is the capacity to
be melted, the type of the material to be melted (Iron, Aluminum, Tin ...) and the
desired melt cycle time. To raise the temperature of a solid material to the pouring
26

3. INDUCTION FURNACE OPERATION Can Onur TOKUNÇ
temperature, energy must be put into it based upon the characteristics of its solid
specific heat, latent heat of fusion, and liquid specific heat. An improperly designed
system that has an undersized power supply will reduce the efficiency of the overall
system and reduce the weight of metal that can be melted per kWh applied. This
could result in the inability for the system to reach the required pour temperature
There are two types of induction furnaces. The first is coreless and the second
is called channel. The coreless induction furnace has copper coils that are protected
by a steel and magnetic shield and kept cool by water circulating from a special
tower. A layer of refractory, or difficult to melt material, is placed above the coils and
heated to the desired temperature. A crucible, which is a melting pot made of heat
resistant material, is above the refractory. The metal to be melted is placed inside the
crucible and the heat produced by the electromagnetic charge melts the scrap.
The channel induction furnace can also be called a core induction furnace. It
functions very similarly to the coreless furnace, except for the addition of a heated
core. Channel furnaces were originally used as molten metal holders, but have been
found useful in the melting of lower melt temperature metals.
Both types of induction furnaces produce a natural stirring motion when the
metal is molten. The pull of the magnetic fields and electrical currents cause the
materials to sway in different directions. This stirring is essential to maintaining the
integrity of the metal. The coreless furnace creates a more violent stirring, while the
channel is known to have less turbulence at the surface.
The principle of melting in induction furnace is that the electrical coil
surrounding the cylindrical crucible acts as primary and the metallic charge as
secondary. When an electrical current is passed through the primary coil the
electromagnetic field causes induced current to flow through the metallic charge
making it melt.
When the electrical current is switched on, the eddy currents developed
between primary copper coil and heavier secondary current in the metallic charges
melt in the charge to the desired temperature. The charge is placed in this crucible
and it acts as the secondary winding. The crucible is surrounded by several turns of
water cooled copper tubing which carries the high frequency primary current. The
27

3. INDUCTION FURNACE OPERATION Can Onur TOKUNÇ
charge consists of sponge iron, pig iron, Ms-scrap. After reaching temperature the
gangue material present in the charge comes out in the form of slag and float in the
molten bath. The slags are removed through tapping and manually.
The coreless induction furnace consists basically of a crucible, inductor coil,
and shell, cooling system and tilting mechanism.
The crucible is formed from refractory material, which the furnace coils is
lined with. This crucible holds the charge material and subsequently the melt. The
choice of refractory material depends on the type of charge, i.e. acidic, basic or
neutral. In this design a neutral refractory is used and based on effectiveness,
availability and practical application in Nigerian foundries, zirconium oxide (ZrO2)
is implored. The durability of the crucible depends on the grain size, ramming
technique, charge analysis and rate of heating and cooling the furnace (Ahmed,
2009). Figure 3.6 shows typical components of a coreless induction furnace.
Figure 3.6 Typical Components of a Coreless Induction Furnace (Ahmed, 2009).
28

3. INDUCTION FURNACE OPERATION Can Onur TOKUNÇ
The inductor coil is a tubular copper coil with specific number of turns. An
alternating current (A.C) passes through it and magnetic flux is generated within the
conductor. The magnetic flux generated induces eddy currents that enable the heating
and subsequently the melting process in the crucible. In order to eliminate electrical
breakdown the turns are insulated by wrapping with mica tape, this serve as a good
insulator.
The shell is the outer part of the furnace. This houses the crucible and the
inductor coils, and has higher thermal capacity. It is made of rectangular parallel
piped with low carbon steel plate and joined at the corners by edge carriers from
angular pieces and strips of non-magnetic metal.
The cooling system is a through-one-way- flow system with the tubular
copper coils connected to water source through flexible rubber hoses. The inlet is
from the top while the outlet is at the bottom. The cooling process is important
because the circuit of the furnace appears resistive, and the real power is not only
consumed in the charged material but also in the resistance of the coil. This coil loss
as well as the loss of heat conducted from the charge through the refractory crucible
requires the coil to be cooled with water as the cooling medium to prevent undue
temperature rise of the copper coils.
Tilting of the furnace is to effect pouring of the melt as a last operational
activity before casting. Since this furnace is of small capacity, a manually operated
tilting mechanism is adopted. The furnace is hinged on at the spout edge with a shaft
and bearings. At one side to the bearing is pinion and gear system to give a gear
reduction, so that when the handle is turned clockwise, the furnace is tilted to achieve
a maximum angle of 90 degrees for complete pouring of the molten metal (Bala,
2005).
Rather than just a furnace, a coreless induction furnace is actually an energy
transfer device where energy is transferred directly from an induction coil into the
material to be melted through the electromagnetic field produced by the induction
coil.
29

3. INDUCTION FURNACE OPERATION Can Onur TOKUNÇ
The geometric shape of the furnace is shown in figure 3.7. The shape of the
crucible is cylindrical. The internal diameter of the crucible (the diameter of melt)
and the height of melt are determined by the furnace capacity (Ahmed, 2009).
Figure 3.7 The geometric shape of the furnace (Ahmed, 2009)
3.2 Power Quality Problems And Solutions
3.2.1 Power Quality Problems
Sometimes thought to be a panacea for the induction melting process, modern
solid state power supplies have actually been a mixed blessing for achieving
compatibility with the electric utility system. Large three-phase power supplies for
furnaces, while providing economies of scale with higher productions levels, also
bring large fluctuating load currents with varying levels of harmonic distortion.
These varying furnace currents can affect distribution line-voltage regulation and
quality.
30
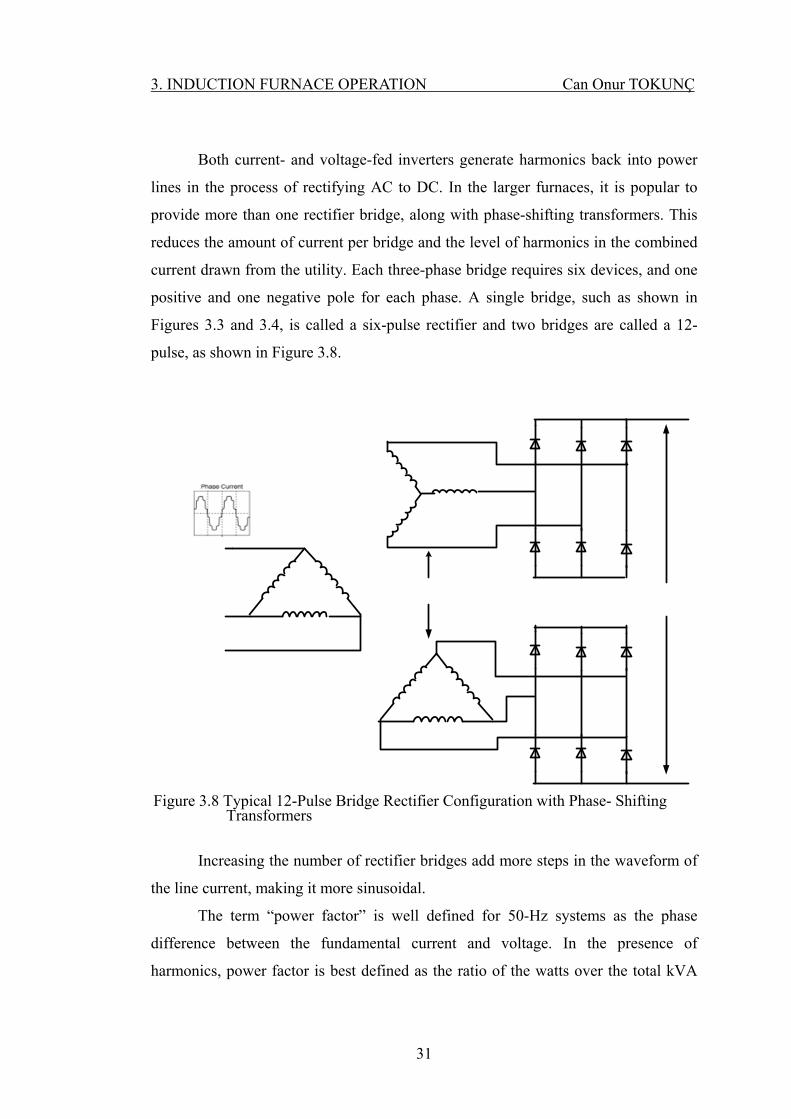
3. INDUCTION FURNACE OPERATION Can Onur TOKUNÇ
Both current- and voltage-fed inverters generate harmonics back into power
lines in the process of rectifying AC to DC. In the larger furnaces, it is popular to
provide more than one rectifier bridge, along with phase-shifting transformers. This
reduces the amount of current per bridge and the level of harmonics in the combined
current drawn from the utility. Each three-phase bridge requires six devices, and one
positive and one negative pole for each phase. A single bridge, such as shown in
Figures 3.3 and 3.4, is called a six-pulse rectifier and two bridges are called a 12-
pulse, as shown in Figure 3.8.
Figure 3.8 Typical 12-Pulse Bridge Rectifier Configuration with Phase- Shifting
Transformers
Increasing the number of rectifier bridges add more steps in the waveform of
the line current, making it more sinusoidal.
The term “power factor” is well defined for 50-Hz systems as the phase
difference between the fundamental current and voltage. In the presence of
harmonics, power factor is best defined as the ratio of the watts over the total kVA
31
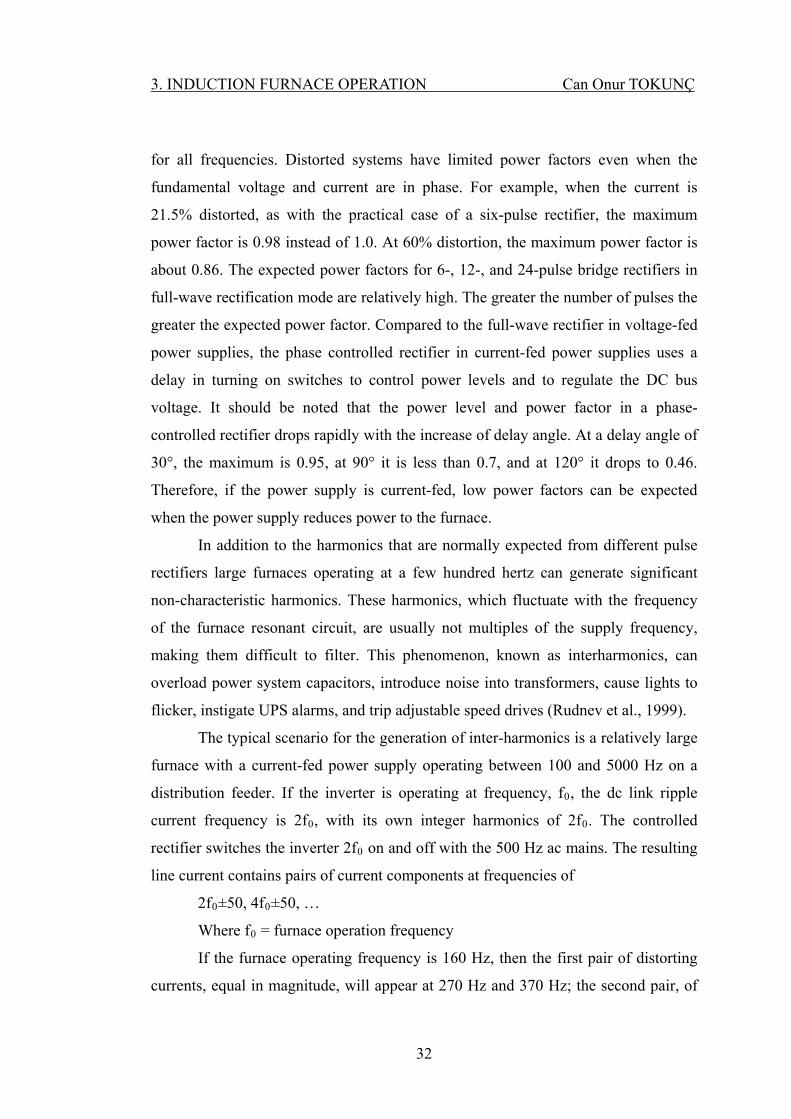
3. INDUCTION FURNACE OPERATION Can Onur TOKUNÇ
for all frequencies. Distorted systems have limited power factors even when the
fundamental voltage and current are in phase. For example, when the current is
21.5% distorted, as with the practical case of a six-pulse rectifier, the maximum
power factor is 0.98 instead of 1.0. At 60% distortion, the maximum power factor is
about 0.86. The expected power factors for 6-, 12-, and 24-pulse bridge rectifiers in
full-wave rectification mode are relatively high. The greater the number of pulses the
greater the expected power factor. Compared to the full-wave rectifier in voltage-fed
power supplies, the phase controlled rectifier in current-fed power supplies uses a
delay in turning on switches to control power levels and to regulate the DC bus
voltage. It should be noted that the power level and power factor in a phase-
controlled rectifier drops rapidly with the increase of delay angle. At a delay angle of
30°, the maximum is 0.95, at 90° it is less than 0.7, and at 120° it drops to 0.46.
Therefore, if the power supply is current-fed, low power factors can be expected
when the power supply reduces power to the furnace.
In addition to the harmonics that are normally expected from different pulse
rectifiers large furnaces operating at a few hundred hertz can generate significant
non-characteristic harmonics. These harmonics, which fluctuate with the frequency
of the furnace resonant circuit, are usually not multiples of the supply frequency,
making them difficult to filter. This phenomenon, known as interharmonics, can
overload power system capacitors, introduce noise into transformers, cause lights to
flicker, instigate UPS alarms, and trip adjustable speed drives (Rudnev et al., 1999).
The typical scenario for the generation of inter-harmonics is a relatively large
furnace with a current-fed power supply operating between 100 and 5000 Hz on a
distribution feeder. If the inverter is operating at frequency, f0, the dc link ripple
current frequency is 2f0, with its own integer harmonics of 2f0. The controlled
rectifier switches the inverter 2f0 on and off with the 500 Hz ac mains. The resulting
line current contains pairs of current components at frequencies of
2f0±50, 4f0±50, …
Where f0 = furnace operation frequency
If the furnace operating frequency is 160 Hz, then the first pair of distorting
currents, equal in magnitude, will appear at 270 Hz and 370 Hz; the second pair, of
32
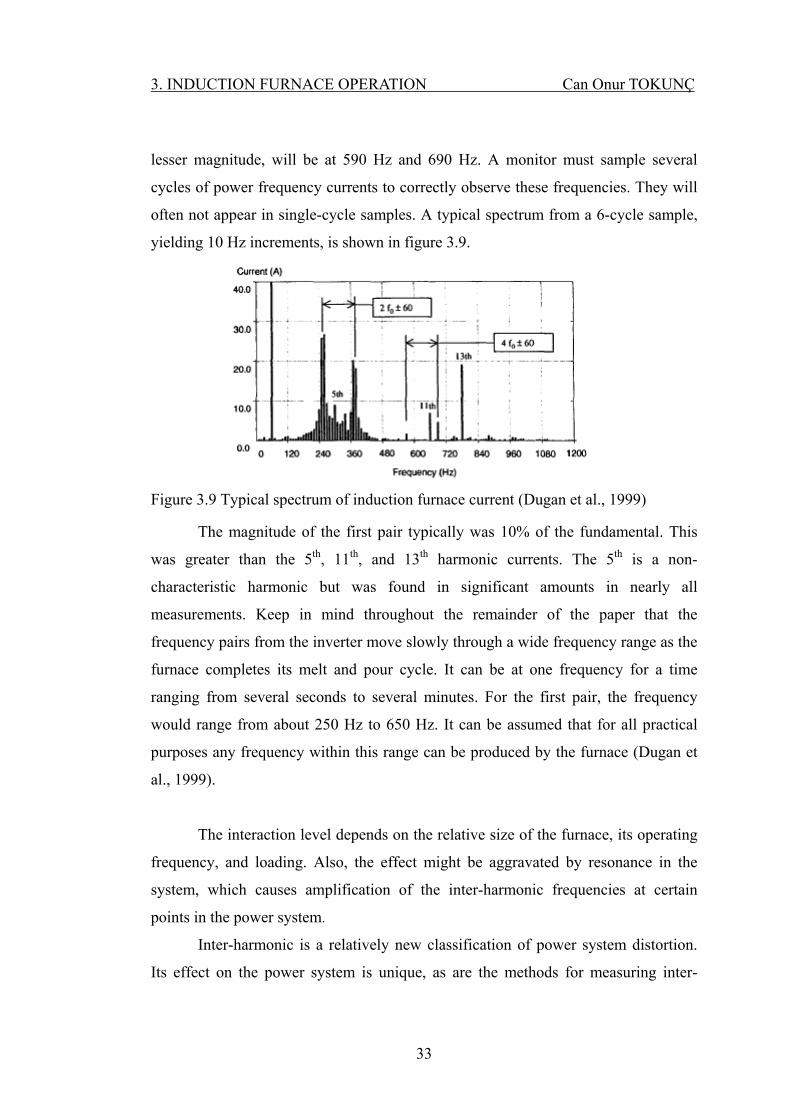
3. INDUCTION FURNACE OPERATION Can Onur TOKUNÇ
lesser magnitude, will be at 590 Hz and 690 Hz. A monitor must sample several
cycles of power frequency currents to correctly observe these frequencies. They will
often not appear in single-cycle samples. A typical spectrum from a 6-cycle sample,
yielding 10 Hz increments, is shown in figure 3.9.
Figure 3.9 Typical spectrum of induction furnace current (Dugan et al., 1999)
The magnitude of the first pair typically was 10% of the fundamental. This
was greater than the 5th, 11th, and 13th harmonic currents. The 5th is a non-
characteristic harmonic but was found in significant amounts in nearly all
measurements. Keep in mind throughout the remainder of the paper that the
frequency pairs from the inverter move slowly through a wide frequency range as the
furnace completes its melt and pour cycle. It can be at one frequency for a time
ranging from several seconds to several minutes. For the first pair, the frequency
would range from about 250 Hz to 650 Hz. It can be assumed that for all practical
purposes any frequency within this range can be produced by the furnace (Dugan et
al., 1999).
The interaction level depends on the relative size of the furnace, its operating
frequency, and loading. Also, the effect might be aggravated by resonance in the
system, which causes amplification of the inter-harmonic frequencies at certain
points in the power system.
Inter-harmonic is a relatively new classification of power system distortion.
Its effect on the power system is unique, as are the methods for measuring inter-
33

3. INDUCTION FURNACE OPERATION Can Onur TOKUNÇ
harmonics and mitigating its effects. Inter-harmonics can be thought of as voltage or
current components that are not related to fundamental frequency or to integer-
harmonic components of the system. As furnace power supplies become more
sophisticated, the frequencies of the current they draw are less likely to be limited to
harmonics of the fundamental.
The equipment that causes inter-harmonics includes induction furnaces,
static-frequency converters, cycloconverters, induction motors that drive shakers, and
DC arc furnaces. Generally, any equipment that draws a load current that pulsates
asynchronously with the fundamental power system frequency generates inter-
harmonics. In the case of induction melting, the variable frequency of the furnace is
likely to cause interharmonics in the power system. The typical impacts on other
equipment are flickering lights or computer screens, tripping of certain power
electronic equipment, and heating in the power system similar to the heating caused
by harmonic currents.
Standards are still emerging on this subject. IEEE 519-1992 indirectly
addresses interharmonics in the discussion on cycloconverters. A future IEEE
standard is expected to provide general technical descriptions of the phenomenon,
methods of measurement, and guidelines for limits. The IEC 61000-2-1 currently
defines the inter-harmonic environment, and IEC 61000-4-7 describes a
measurement technique. Even with these standards, agreement among popular
harmonic monitors does not exist. If a monitor can detect inter-harmonics, the most
common result is an under-registration of the inter-harmonic levels (Rudnev et al.,
1999).
Another international standards and conformity assessment body,
International Electro technical Commission (IEC), produced a standard, IEC 61000-
3-6, which also provides guidelines to address harmonics issue with sets of steady
state limits. Both standards are in common where the limits were derived based on a
basic principle of insuring voltage quality and shared responsibility between utility
and customer. Both lay the responsibility on consumer to limit the penetration of
current harmonic into power system while utility company is responsible to limit
harmonic voltage at point of common coupling (PCC). According to IEEE definition,
34
3. INDUCTION FURNACE OPERATION Can Onur TOKUNÇ
point of common coupling is a point anywhere in the entire system where utility and
consumer can have access for direct measurement and the indices is meaningful to
both(Izhar et al.,2003)(Halpin,2005).
IEEE has come out with a guidelines and standard regarding harmonics in the
IEEE standard 519-1992 “IEEE Recommended Practices and Requirements for
Harmonic Control in Electrical Power Systems”. The Standard is a guide in
designing of power systems with nonlinear loads. The limits set are for steady-state
operation and recommended for worst case scenario. The quality of power is
observed at point of common coupling (PCC) which is the interface between source
and loads.
The standard generally provide information and guidelines on sources of
harmonics, resonant condition due to harmonics, frequency response and modeling
for transmission and distribution system, effect of harmonic, balanced and
unbalanced system, measurements and steady state limits. The voltage distortion
limits are used as a system design values set for worst case scenario in a normal
condition. However, the worst case scenario is normally referred to maximum
current harmonic penetration. Fluctuation of harmonic impedance in the system can
also cause an increase in harmonic voltage. This study looks at varying factors of
harmonic impedance within a distribution network and compare with harmonic
voltage distortion limit at point of common coupling using design components values
and maximum current harmonic penetration from a single source. Table 3.1, 3.2 and
3.3 are the harmonic current and voltage limits from IEEE 519-1992 standard.
Table 3.1 Basis for harmonic current limits based on IEEE 519-1992 SCR at PCC Maximum individual Frequency
Harmonic voltage (%)
10 2.5-3.0%
20 2.0-2.5%
50 1.0-1.5%
100 0.5-1.0%
1000 0.05-0.10%
35

3. INDUCTION FURNACE OPERATION Can Onur TOKUNÇ
Table 3.2 Current distortion limit for general distribution systems (120V through 69000V)
ISC/IL <11
[%]
11≤h<17
[%]
17≤h<23
[%]
23≤h<35
[%]
35≤h
[%]
TDD
[%]
<20 4.0 2.0 1.5 0.6 0.3 5.0
20<50 7.0 3.5 2.5 1.0 0.5 8.0
50<100 10.0 4.5 4.0 1.5 0.7 12.0
100<1000 12.0 5.5 5.0 2.0 1.0 15.0
>1000 15.0 7.0 6.0 2.5 1.4 20.0
Even harmonic are limited to 25% of the odd harmonic limits above
Table 3.3 Voltage Distortion Limits
Bus Voltage at PCC Individual Voltage Distortion
(%)
Total Voltage Distortion
(%)
69kv and below 3.0 5.0
69.001kv through 161kv 1.5 2.5
161.00kv and above 1.0 1.5
Another standard for harmonic is IEC 61000-3-6. A paper by Halpin (2005)
provides comparisons between IEEE and IEC standards, both similarities and
differences. The paper touched on areas such as driving principle, harmonic voltage
limits, current harmonic limits, even-order harmonic, non-characteristic harmonic,
time-varying harmonic and inter-harmonic. Both standards aim at a similar goal
which is to ensure voltage quality with the main principle of shared responsibility
between utility and customer. IEC provide comprehensive limits on time-varying
harmonic compared to IEEE. The IEC time-varying harmonic limit is based on
percentiles, e.g. 95th and 99th for very short time (3 second) and short time (10
minute) aggregate measurements (Halpin, 2005).
36
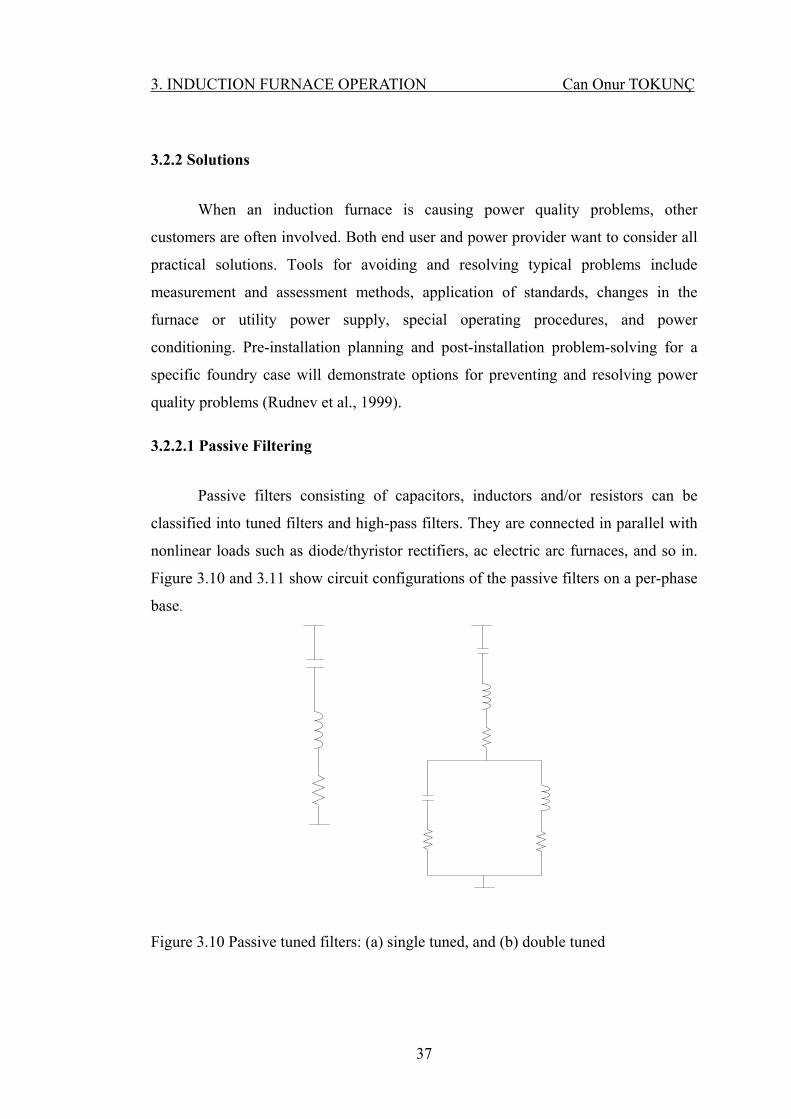
3. INDUCTION FURNACE OPERATION Can Onur TOKUNÇ
3.2.2 Solutions
When an induction furnace is causing power quality problems, other
customers are often involved. Both end user and power provider want to consider all
practical solutions. Tools for avoiding and resolving typical problems include
measurement and assessment methods, application of standards, changes in the
furnace or utility power supply, special operating procedures, and power
conditioning. Pre-installation planning and post-installation problem-solving for a
specific foundry case will demonstrate options for preventing and resolving power
quality problems (Rudnev et al., 1999).
3.2.2.1 Passive Filtering
Passive filters consisting of capacitors, inductors and/or resistors can be
classified into tuned filters and high-pass filters. They are connected in parallel with
nonlinear loads such as diode/thyristor rectifiers, ac electric arc furnaces, and so in.
Figure 3.10 and 3.11 show circuit configurations of the passive filters on a per-phase
base.
Figure 3.10 Passive tuned filters: (a) single tuned, and (b) double tuned
37
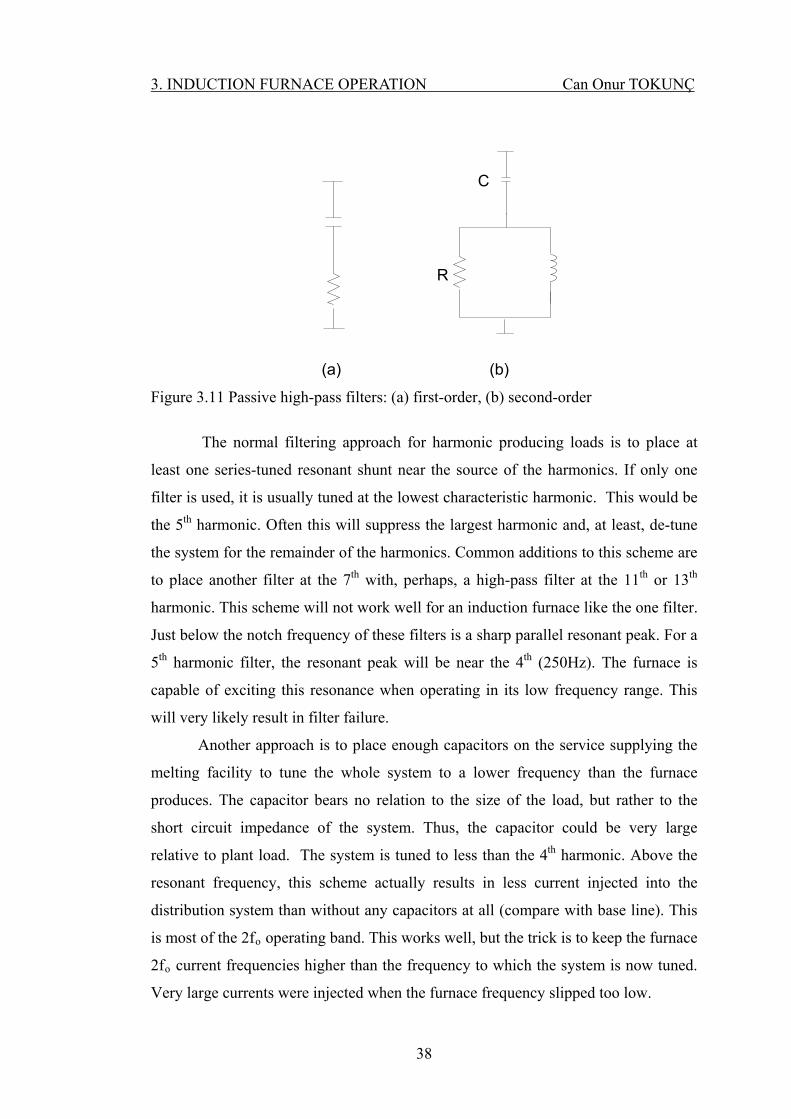
3. INDUCTION FURNACE OPERATION Can Onur TOKUNÇ
R
C
(a) (b) Figure 3.11 Passive high-pass filters: (a) first-order, (b) second-order
The normal filtering approach for harmonic producing loads is to place at
least one series-tuned resonant shunt near the source of the harmonics. If only one
filter is used, it is usually tuned at the lowest characteristic harmonic. This would be
the 5th harmonic. Often this will suppress the largest harmonic and, at least, de-tune
the system for the remainder of the harmonics. Common additions to this scheme are
to place another filter at the 7th with, perhaps, a high-pass filter at the 11th or 13th
harmonic. This scheme will not work well for an induction furnace like the one filter.
Just below the notch frequency of these filters is a sharp parallel resonant peak. For a
5th harmonic filter, the resonant peak will be near the 4th (250Hz). The furnace is
capable of exciting this resonance when operating in its low frequency range. This
will very likely result in filter failure.
Another approach is to place enough capacitors on the service supplying the
melting facility to tune the whole system to a lower frequency than the furnace
produces. The capacitor bears no relation to the size of the load, but rather to the
short circuit impedance of the system. Thus, the capacitor could be very large
relative to plant load. The system is tuned to less than the 4th harmonic. Above the
resonant frequency, this scheme actually results in less current injected into the
distribution system than without any capacitors at all (compare with base line). This
is most of the 2fo operating band. This works well, but the trick is to keep the furnace
2fo current frequencies higher than the frequency to which the system is now tuned.
Very large currents were injected when the furnace frequency slipped too low.
38

3. INDUCTION FURNACE OPERATION Can Onur TOKUNÇ
The drawbacks of this approach are cost of the capacitors and very poor
voltage regulation. Also, the utility may not be able to accommodate the excess
reactive power. This approach may be ruled out if other loads of this service bus will
not tolerate the voltage variation.
This introduces more cost to provide a sizable 3-phase reactor, but has the
advantage of providing isolation from the service bus so that other loads are
relatively unaffected. The capacitor required would be smaller, which offsets some of
the increased cost. However, the voltage regulation at the furnace will still be poor, if
not worse than placing one very large capacitor on the service bus. Fortunately,
current source inverters are less sensitive to voltage than other types of loads. One
might be able to work with the manufacturer at design time to adjust the design of
the converters and dc link to operate over a wider voltage range.
If the utility cannot accept the excess reactive power from this filtering
arrangement, one modification could be to add a shunt reactor that cancels the 50 Hz
component of the capacitor current. It would have a minor effect on the tuning of the
system, so this would also have to be taken into account.
3.2.2.2 Choose a Different Type of Furnace Power Supply
Not all induction furnace power supply designs operate in the manner
described. It is more appropriate when connected to a high capacity source, such as
directly to the transmission system. For distribution systems with many capacitors, a
design with better isolation of the furnace frequencies is more appropriate. The end
user had the option of two different kinds of furnaces. Whether this is accurate or
not, it produced only harmonic currents, which, in retrospect, would have been much
easier to deal with on a distribution system (Dugan et al., 1999).
3.2.2.3 Active Filtering
As the created distortion is very high and affects the voltage supplied by the
distribution network, it is highly possible that other loads supplied from the same
39

3. INDUCTION FURNACE OPERATION Can Onur TOKUNÇ
network will be affected. Then, it is necessary to have corrective actions in order to
fulfill the legislation concerning voltage harmonic distortion.
Among these corrective actions, active filters are one of the most effective.
This solution presents many advantages over other alternatives:
- The steel plant is composed of loads that vary fast their consumption
changing the harmonic composition. The connection and disconnection of power
electronic components changes the harmonic composition too. The filter has to be
fast.
- The active filter overcomes the resonance problems associated with the
power factor correction capacitors. Moreover, the filter can work as a dynamic
compensator of reactive power, depending on the instantaneous needs of reactive
power of the steel plant.
- The active filters can perform a load compensation of the three phases,
removing the neutral current in unbalanced systems.
Before taking any corrective action, it is necessary to evaluate the distortion
introduced by the installation into the distribution network. In this stage, simulation
has been proved to be a useful tool when evaluating the harmonic distortion. It
allows quantifying the harmonic distortion created by a system and, when a
corrective action is introduced, simulation shows the reduction in the distortion.
Hence, simulation can be used as a tool for the design of the active filter (Zamora et
al., 2003).
3.2.2. 4 Reconfiguring Feeders
An interim solution was achieved by reconfiguring the feeders to provide an
express feed without capacitor banks to a strong substation bus where there is little
impact on other customers. Commercial and industrial customers with computer
networks and power factor correction capacitors, with one exception, were moved to
other feeders. This solution was not completely satisfactory.
Reasons this approach might not work include: 1) it is not possible to
construct a configuration that avoids problems; 2) the substation bus is not
40
3. INDUCTION FURNACE OPERATION Can Onur TOKUNÇ
sufficiently stiff and other feeders are affected; 3) load growth cannot be
accommodated; 4) emergency reconfiguration not possible.
There is also the valid concern that the operation of the feeder may be turned
over to another entity in the future and the knowledge of this special feeder will be
lost.
3.2.2. 5 Modify Induction Furnace
A distribution engineer would like to see the operating frequency of the
furnace restricted to a very narrow range. This would provide much more leeway for
placing capacitors on the distribution system. One thing that can be done at design
time is to provide for more automatic switching steps in the furnace capacitor.
For the current-source inverter, increasing the dc link inductance causes a
directly proportional decrease in the magnitude of the distorting currents reaching the
ac side. There are design limitations, but this can result in a furnace design that is
much more tolerable from the perspective of the utility distribution system.
3.2.2.6 Feed from Transmission
There are potentially fewer difficulties when an induction furnace is fed
directly from transmission lines rather than through a distribution feeder. The great
advantage is that the transmission system is a much stiffer system and can absorb the
harmonic currents without causing as much voltage distortion. Induction furnace
loads are frequently very small compared to transmission capacity. Of course, this is
why some utilities choose to serve them through distribution facilities -- the load size
does not seem to justify a transmission substation. However, if the operating
difficulties are taken into consideration, the justification may be easily achieved.
Transmission systems are not impervious to problems from this type of load.
Capacitors are becoming more common at transmission levels. While the tuning of
systems today are typically fairly high so that they are not in the range that might be
excited by the furnace frequencies, other distribution substations fed from the
transmission are tuned to frequencies in the 5th - 9th harmonic range. Therefore, it is
41

3. INDUCTION FURNACE OPERATION Can Onur TOKUNÇ
42
possible that an induction furnace might excite a distribution system via the
transmission system. A radial transmission feed from a station that contains a
distribution substation would seem a good candidate for trouble.(Dugan et al., 1999).
4. INDUCTION FURNACE MODELING Can Onur TOKUNÇ
4. INDUCTION FURNACE MODELING
4.1 Induction Furnace Modeling
In this thesis the coreless induction furnace is modeled. In this type of furnace
the coil is hallow and metal scrap is charged in it for melting. Core is not present for
flux linkage between primary and secondary and hence the name. The heart of the
coreless induction furnace is the coil, which consists of a hallow section of heavy
duty, high conductivity copper tubing which is wound into a helical coil. Coil shape
is contained within a steel shell and magnetic shielding is used to prevent heating of
the supporting shell. When the charge material is molten, the interaction of the
magnetic field and the electrical currents flowing in the induction coil produce a
stirring action within the molten metal. The degree of stirring action is influenced by
the power and frequency applied as well as the size and shape of the coil and the
density and viscosity of the molten metal. The stirring action within the bath is
important as it helps with mixing of alloys and melting of turnings as well as
homogenizing of temperature throughout the furnace (Al–Shaikhli et al., 2009). The
coreless induction furnace is commonly used to melt all grades of steels and irons as
well as many non-ferrous alloys.
The power circuit of 10MVA current source induction furnace circuit is
shown in figure 4.1. It consists a phase shifting transformer with two secondaries, 12
pulse controlled rectifier, DC link inductance, H-bridge inverter, inverter output
inductance, parallel resonance capacitors and coil inductance. The primary of the
transformer fed from 31.5kV 50 Hz power network.
43

4. INDUCTION FURNACE MODELING Can Onur TOKUNÇ
Figure 4.1 The Power Circuit of 10MVA Current Source Induction Furnace
Table 4.1 shows the power circuit specifications of current source induction
furnace.
Table 4.1 The Power Circuit Specifications Transformer 12 MVA, 31.5 kV/1.2 kV -1.2kV, Δ/ Δ-Y
LDC 1 mH
RDC 1.5 Ω
LS 0.0125 mH
RS 0.5 Ω
C 5.28 mF
Rf 0.015 Ω
Lf 0.053 – 0.21 mH
The power control of furnace is achieved by controlled rectifier. Firing angle
of thyristors determine furnace power. H-bridge inverter keeps parallel resonance
circuit in the resonance by changing the operating frequency.
As shown in figure 4.1 the capacitor and the furnace coil is parallel connected
in current source circuit. To keep the parallel LC circuit in figure 4.1 at the
resonance.
44
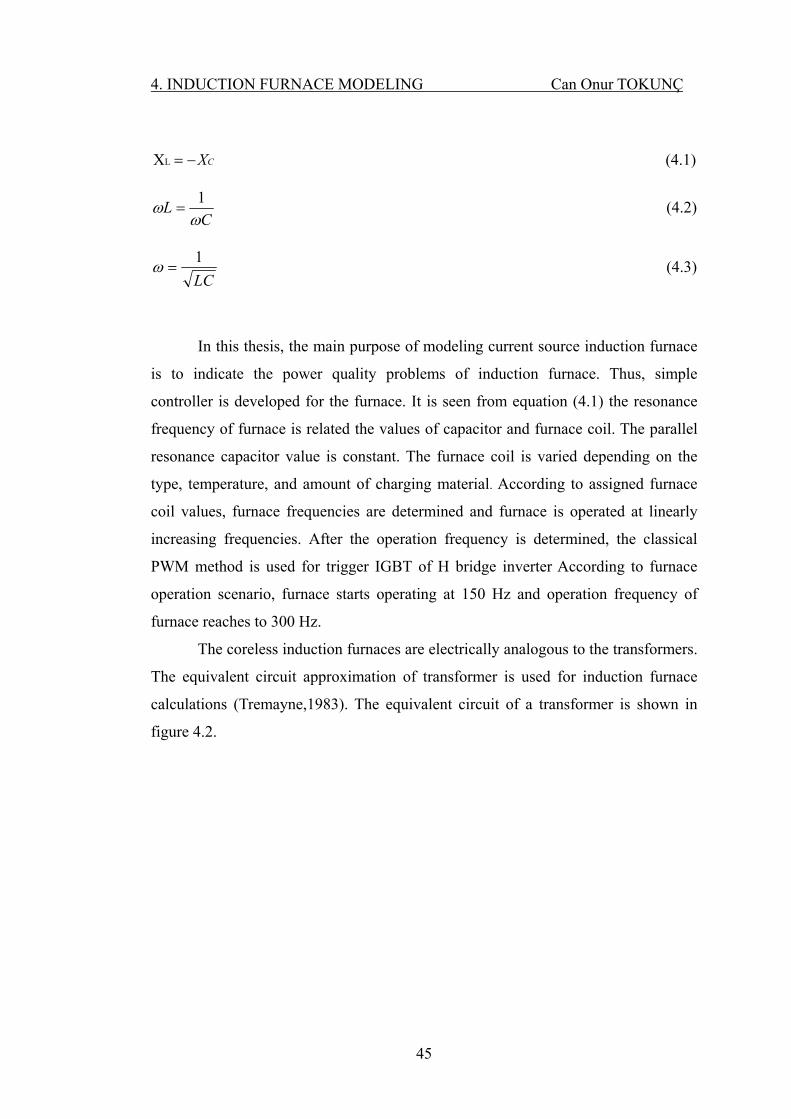
4. INDUCTION FURNACE MODELING Can Onur TOKUNÇ
CXLX (4.1)
CL
1
(4.2)
LC
1 (4.3)
In this thesis, the main purpose of modeling current source induction furnace
is to indicate the power quality problems of induction furnace. Thus, simple
controller is developed for the furnace. It is seen from equation (4.1) the resonance
frequency of furnace is related the values of capacitor and furnace coil. The parallel
resonance capacitor value is constant. The furnace coil is varied depending on the
type, temperature, and amount of charging material. According to assigned furnace
coil values, furnace frequencies are determined and furnace is operated at linearly
increasing frequencies. After the operation frequency is determined, the classical
PWM method is used for trigger IGBT of H bridge inverter According to furnace
operation scenario, furnace starts operating at 150 Hz and operation frequency of
furnace reaches to 300 Hz.
The coreless induction furnaces are electrically analogous to the transformers.
The equivalent circuit approximation of transformer is used for induction furnace
calculations (Tremayne,1983). The equivalent circuit of a transformer is shown in
figure 4.2.
45
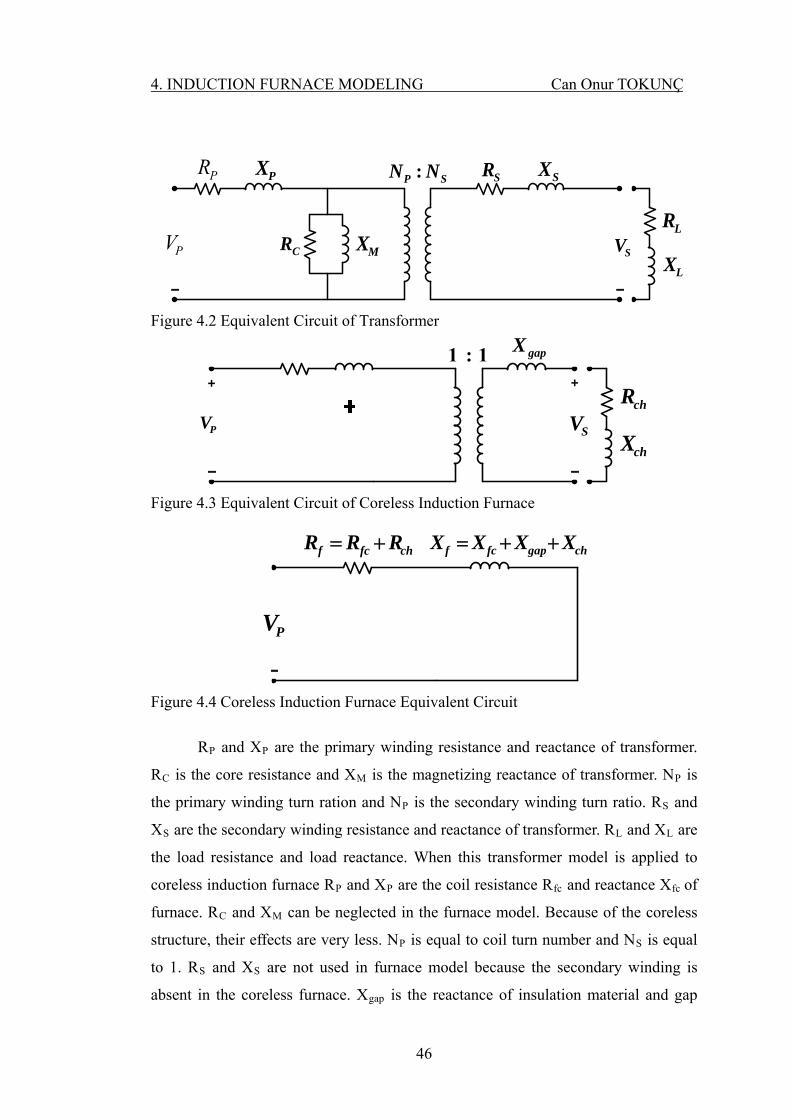
4. INDUCTION FURNACE MODELING Can Onur TOKUNÇ
PR PX
PV CR
SXSR
SVLR
LX
SP NN :
MX
Figure 4.2 Equivalent Circuit of Transformer
PVSV
chR
chX
+
+
1:1 gapX
Figure 4.3 Equivalent Circuit of Coreless Induction Furnace
chfcf RRR chgapfcf XXXX
PV
Figure 4.4 Coreless Induction Furnace Equivalent Circuit
RP and XP are the primary winding resistance and reactance of transformer.
RC is the core resistance and XM is the magnetizing reactance of transformer. NP is
the primary winding turn ration and NP is the secondary winding turn ratio. RS and
XS are the secondary winding resistance and reactance of transformer. RL and XL are
the load resistance and load reactance. When this transformer model is applied to
coreless induction furnace RP and XP are the coil resistance Rfc and reactance Xfc of
furnace. RC and XM can be neglected in the furnace model. Because of the coreless
structure, their effects are very less. NP is equal to coil turn number and NS is equal
to 1. RS and XS are not used in furnace model because the secondary winding is
absent in the coreless furnace. Xgap is the reactance of insulation material and gap
46

4. INDUCTION FURNACE MODELING Can Onur TOKUNÇ
between coil and inside of crucible. The load resistance RL and reactance XL are
equal to the charge resistance Rch and reactance Xch of coreless induction furnace.
The approximate equivalent circuit of coreless induction furnace is shown in figure
4.3. and the equivalent circuit of furnace referred to primary side is shown in the
figure 4.4. Rf is the furnace resistance which is equal to the sum of coil resistance
and charge resistance referred to primary side. Xf is the furnace reactance which is
equal to the sum of furnace coil reactance, gap reactance and load reactance.
In this thesis the simulation has been carried out using PSCAD/EMTDC.
Blocks for the simulation of the induction furnace and for calculation and
visualization of the harmonic content have been developed. Figure 4.5 shows the
PSCAD model of induction furnace. If an AC current is fed through a coil, the
electromagnetic field that is produced is constantly changing. This changing
magnetic field induces electrical current (AC) in another circuit that is held close.
This induced secondary current can be utilized to generate heat in the circuit of the
second conductor by exploring the electrical losses due to the current. These losses
are due to Hysteresis and Eddy current.
47
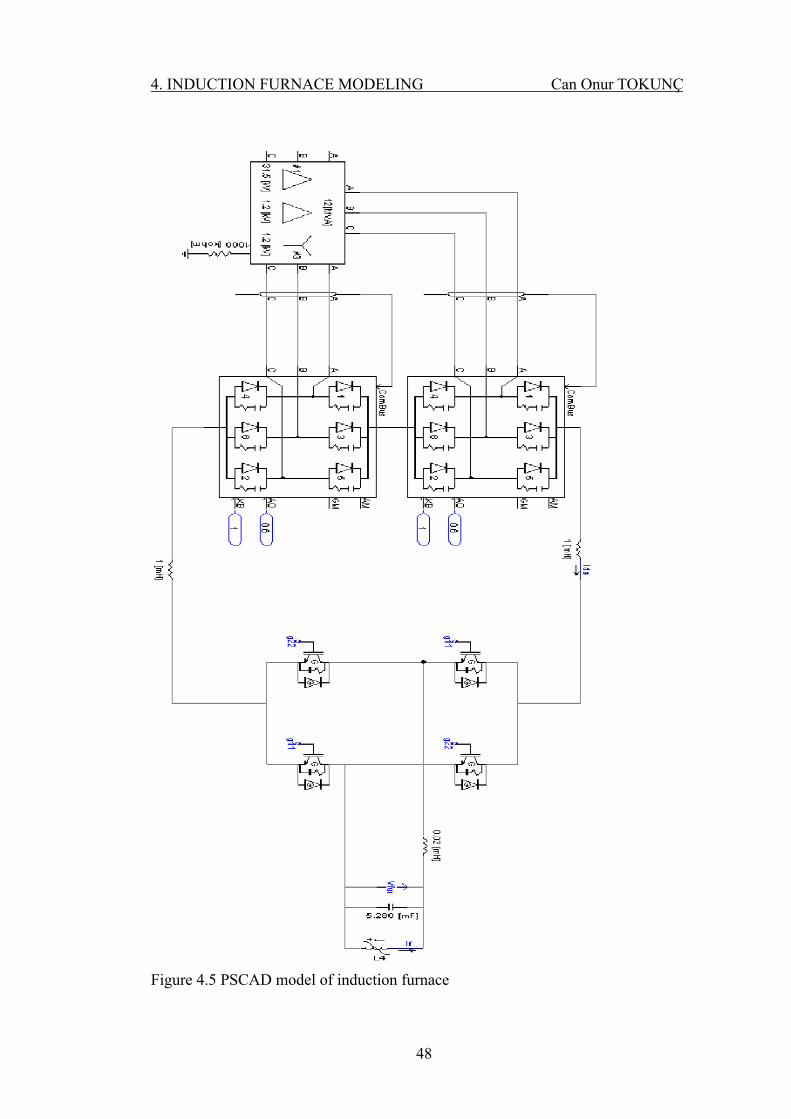
4. INDUCTION FURNACE MODELING Can Onur TOKUNÇ
Figure 4.5 PSCAD model of induction furnace
48

4. INDUCTION FURNACE MODELING Can Onur TOKUNÇ
Figure 4.6 12 h Phase- Shifting
Transformers of induction furnace model
per bridge and the level of harmonics in the combined current drawn from the
utility.
DC link, the two series connected inductors
provide energy storage and filtering.
-Pulses Bridge Rectifier Configuration wit
Incoming mains 3 phase supply from furnace transformer is rectified by full
control bridge rectifier. Six identical thyristor which are connected in bridge
configuration to convert incoming AC to corresponding DC. Thyristors are used in
phase control mode and therefore by varying firing angle, the output power can be
varied from lower level to higher level. Figure 4.6 shows the typical 12-Pulse Bridge
Rectifier Configuration with Phase shifting transformers of induction furnace model
of the PSCAD model. In the larger furnaces, it is popular to provide more than one
Rectifier Bridge, along with phase-shifting transformers. This reduces the amount of
current
Figure 4.7 show the basic current-fed converter of PSCAD model uses a
phase-controlled rectifier to convert AC to DC and to regulate the voltage on the DC
link. When current is flowing in the
12 pulse rectifier
Phase shifting transformer
49

4. INDUCTION FURNACE MODELING Can Onur TOKUNÇ
The inverter is responsible for converting high voltage DC to AC to feed it to
the load circuit. It is a single phase bridge connection of four current carrying arms.
Configuration used is called parallel inverter, as load induction melting coil and
capacitors are parallel to each other. IGBT are connected in four arms. Each arm has
serially stack IGBT in range of 3-4 depending of output voltage designed. IGBT in
diagonal pair are fired in each half cycle of medium frequency, this frequency is
determine by parallel resonant LC circuit.
Figure 4.7 Current fed converter of PSCAD model
Figure 4.8 shows the parallel resonance capacitor and variable inductance of
furnace of the PSCAD model.
DC-AC Converter
DC link
50

4. INDUCTION FURNACE MODELING Can Onur TOKUNÇ
Constant ca Variable coil pacitor
of furnace
Figure 4.8 PSCAD model of parallel resonance circuit
Figure 4.9 shows the dc-ac inverter control blocks of PSCAD model. These
PSCAD blocks generate pulse to control the dc-ac inverter .In this model PWM
method is used for control DC-AC inverter. It controls the dc ac inverter according to
the changing of furnace coil. In figure 4.9 furnace coil blocks modify the furnace coil
according to simulation time. Furnace coil block and inverter frequency control
block works coordinated. Depending on varying of simulation time, furnace coil
value and operation frequency of inverter changes. As the simulation time progress,
the coil value of the furnace decreases. Also operating frequency of the inverter
varies according to the resonance frequency formulas. So the inverter keeps to circuit
in resonance. This results in a varying operating frequency for the furnace.
0.0Magnitu
de
Phase
FreqMag
Sin
frequency
A
B Compar-ator
1.0 Magnitude
g11
g22
TIME frequency TIME furnace coil
Figure 4.9 DC-AC Inverter control blocks
51

4. INDUCTION FURNACE MODELING Can Onur TOKUNÇ
4.2 Simulation Results of Induction Furnace
In this part of thesis simulation results of proposed 10MVA current source
coreless induction furnace are presented. The induction furnace is working without
compensation system. Figure 4.10 shows the input current of the furnace. It is shown
that the furnace current is not pure sinusoidal. These current contains harmonic
component.
Figure 4.10 Three phase source current of the network
The three phase input voltage of the induction furnace is shown in figure
4.11.It is seen that there is no distortion in the voltage signal.
52
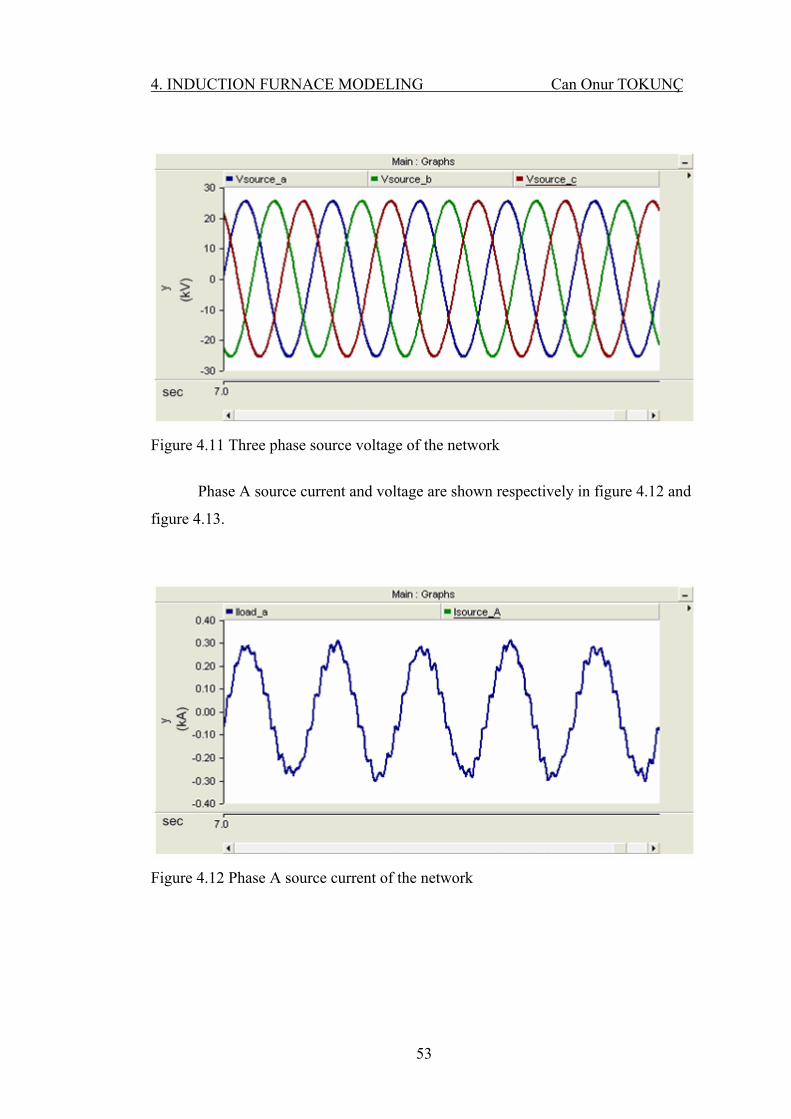
4. INDUCTION FURNACE MODELING Can Onur TOKUNÇ
Figure 4.11 Three phase source voltage of the network
Phase A source current and voltage are shown respectively in figure 4.12 and
figure 4.13.
Figure 4.12 Phase A source current of the network
53
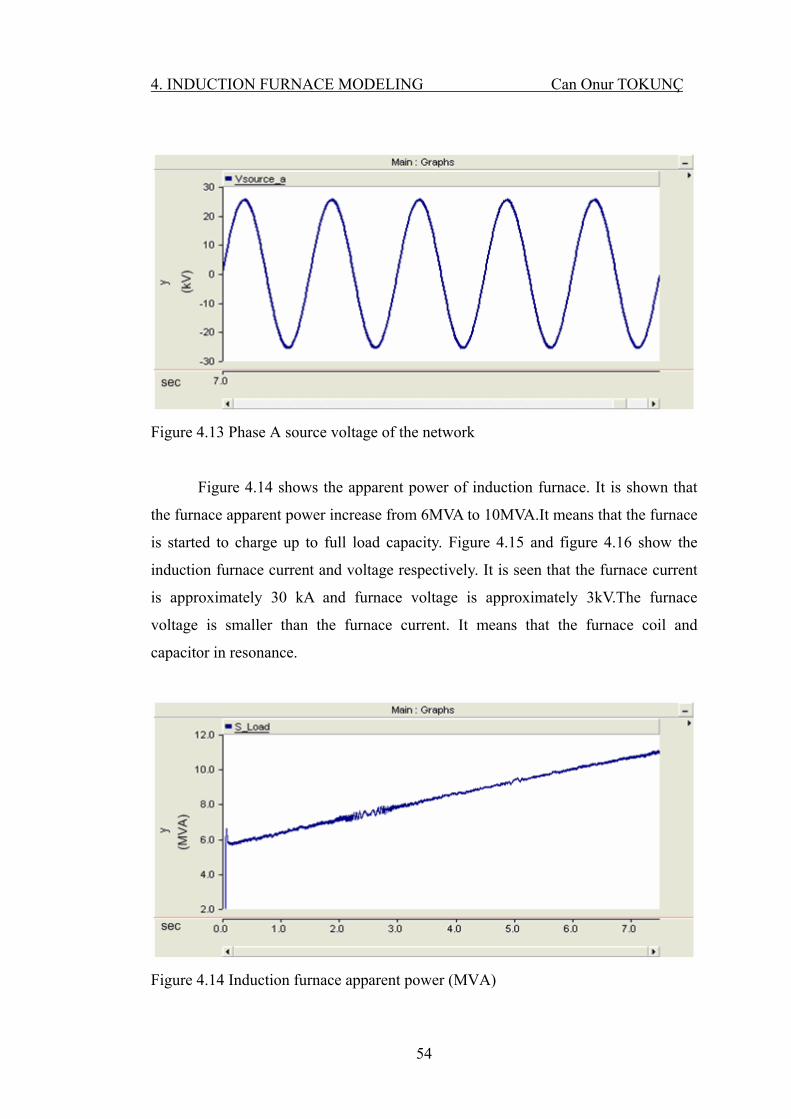
4. INDUCTION FURNACE MODELING Can Onur TOKUNÇ
Figure 4.13 Phase A source voltage of the network
Figure 4.14 shows the apparent power of induction furnace. It is shown that
the furnace apparent power increase from 6MVA to 10MVA.It means that the furnace
is started to charge up to full load capacity. Figure 4.15 and figure 4.16 show the
induction furnace current and voltage respectively. It is seen that the furnace current
is approximately 30 kA and furnace voltage is approximately 3kV.The furnace
voltage is smaller than the furnace current. It means that the furnace coil and
capacitor in resonance.
Figure 4.14 Induction furnace apparent power (MVA)
54
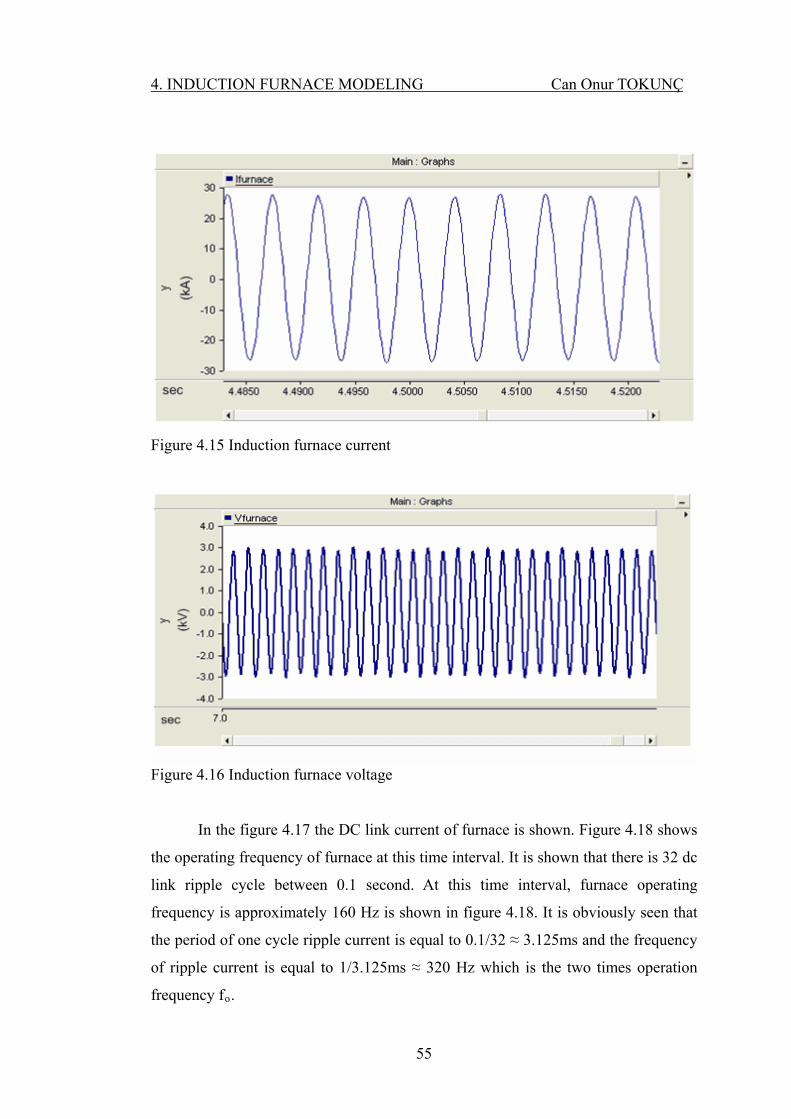
4. INDUCTION FURNACE MODELING Can Onur TOKUNÇ
Figure 4.15 Induction furnace current
Figure 4.16 Induction furnace voltage
In the figure 4.17 the DC link current of furnace is shown. Figure 4.18 shows
the operating frequency of furnace at this time interval. It is shown that there is 32 dc
link ripple cycle between 0.1 second. At this time interval, furnace operating
frequency is approximately 160 Hz is shown in figure 4.18. It is obviously seen that
the period of one cycle ripple current is equal to 0.1/32 ≈ 3.125ms and the frequency
of ripple current is equal to 1/3.125ms ≈ 320 Hz which is the two times operation
frequency fo.
55

4. INDUCTION FURNACE MODELING Can Onur TOKUNÇ
Figure 4.17 Induction furnace DC ripple current at t=0.5s
Figure 4.18 Induction furnace operating frequency at t=05s
Figure 4.19 shows the DC link current of furnace at another time period of
simulation. In figure 4.20 the operating frequency of furnace at this time interval is
shown. It is shown that there is 50 dc link ripple cycle between 0.1 second. At this
time interval, furnace operating frequency is approximately 250 Hz is shown in
figure 4.20. It is obviously seen that the period of one cycle ripple current is equal to
0.1/50 ≈ 2ms and the frequency of ripple current is equal to 1/2ms ≈ 500 Hz which is
the two times operation frequency fo.
56
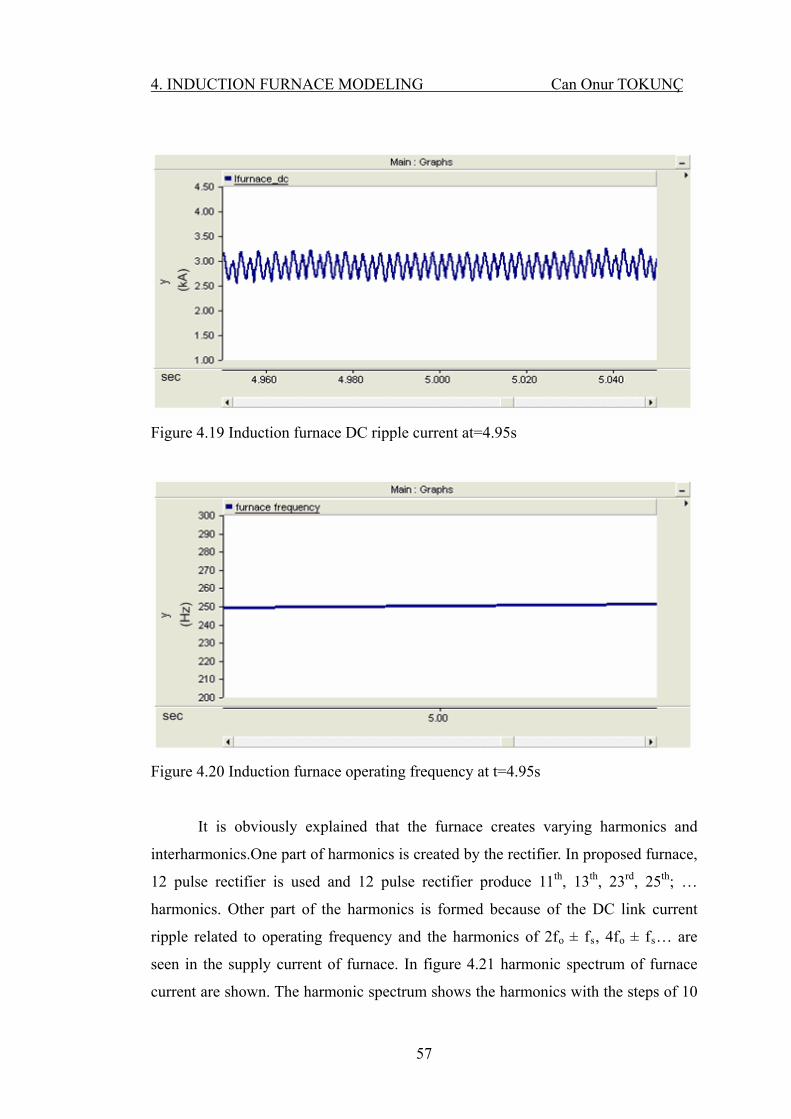
4. INDUCTION FURNACE MODELING Can Onur TOKUNÇ
Figure 4.19 Induction furnace DC ripple current at=4.95s
Figure 4.20 Induction furnace operating frequency at t=4.95s
It is obviously explained that the furnace creates varying harmonics and
interharmonics.One part of harmonics is created by the rectifier. In proposed furnace,
12 pulse rectifier is used and 12 pulse rectifier produce 11th, 13th, 23rd, 25th; …
harmonics. Other part of the harmonics is formed because of the DC link current
ripple related to operating frequency and the harmonics of 2fo ± fs, 4fo ± fs… are
seen in the supply current of furnace. In figure 4.21 harmonic spectrum of furnace
current are shown. The harmonic spectrum shows the harmonics with the steps of 10
57
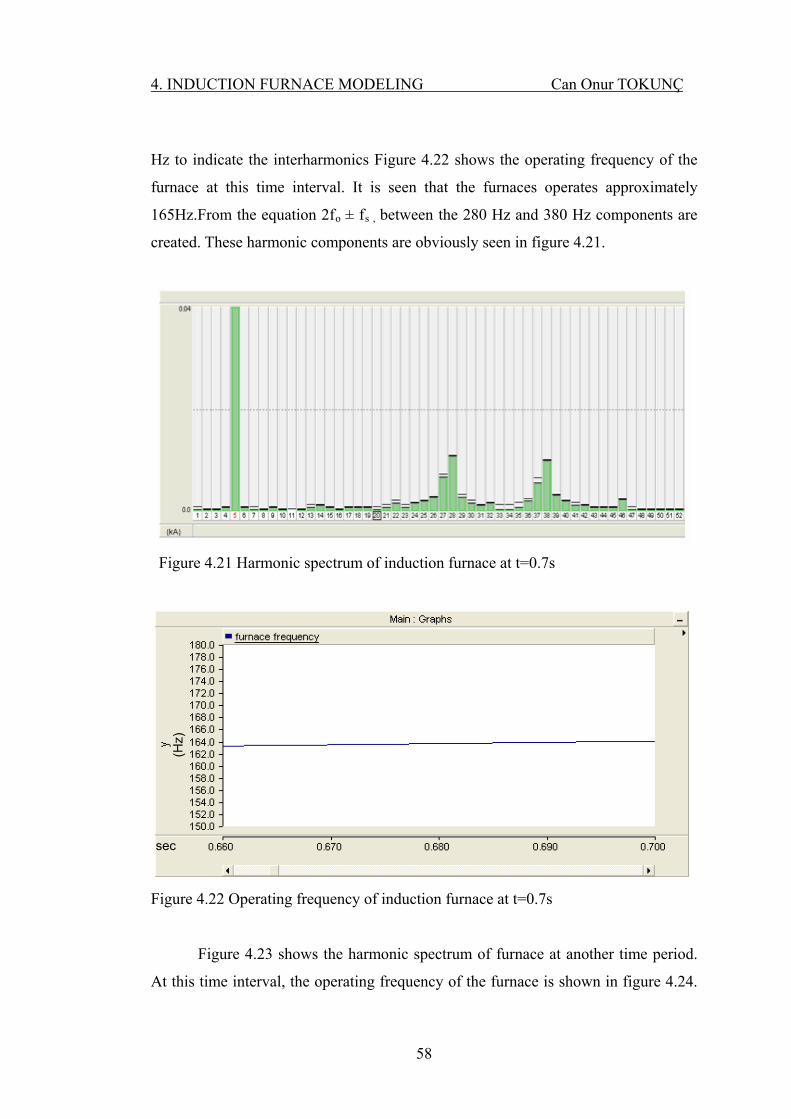
4. INDUCTION FURNACE MODELING Can Onur TOKUNÇ
Hz to indicate the interharmonics Figure 4.22 shows the operating frequency of the
furnace at this time interval. It is seen that the furnaces operates approximately
165Hz.From the equation 2fo ± fs , between the 280 Hz and 380 Hz components are
created. These harmonic components are obviously seen in figure 4.21.
Figure 4.21 Harmonic spectrum of induction furnace at t=0.7s
sec
(Hz)
Figure 4.22 Operating frequency of induction furnace at t=0.7s
Figure 4.23 shows the harmonic spectrum of furnace at another time period.
At this time interval, the operating frequency of the furnace is shown in figure 4.24.
58

4. INDUCTION FURNACE MODELING Can Onur TOKUNÇ
It is clearly shown in figure 4.24; the furnace operates approximately 185Hz. From
the equation between the 320 Hz and 420 Hz components are created. Figure 4.23
verifies the theoretical calculation.
Figure 4.23 Harmonic spectrum of induction furnace at t=1.7s
Figure 4.24 Operating frequency of induction furnace at t=1.7s
Figure 4.25 shows the harmonic spectrum of furnace at another time period.
At this time interval furnace operates at 225 Hz. It is shown that the figure 4.26.
59

4. INDUCTION FURNACE MODELING Can Onur TOKUNÇ
From the equation between the 400 Hz and 500 Hz components are created. Figure
4.25 verifies the theoretical calculation.
Figure 4.25 Harmonic spectrum of induction furnace at t=3.7s
Figure 4.26 Operating frequency of induction furnace at t=3.7s
Figure 4.27 shows the harmonic spectrum of furnace at another time period.
At this time interval furnace operates at 250 Hz. It is shown that the Figure
4.28.From the equation between the 450 Hz and 550 Hz components are created.
Figure 4.27 verifies the theoretical calculation.
60
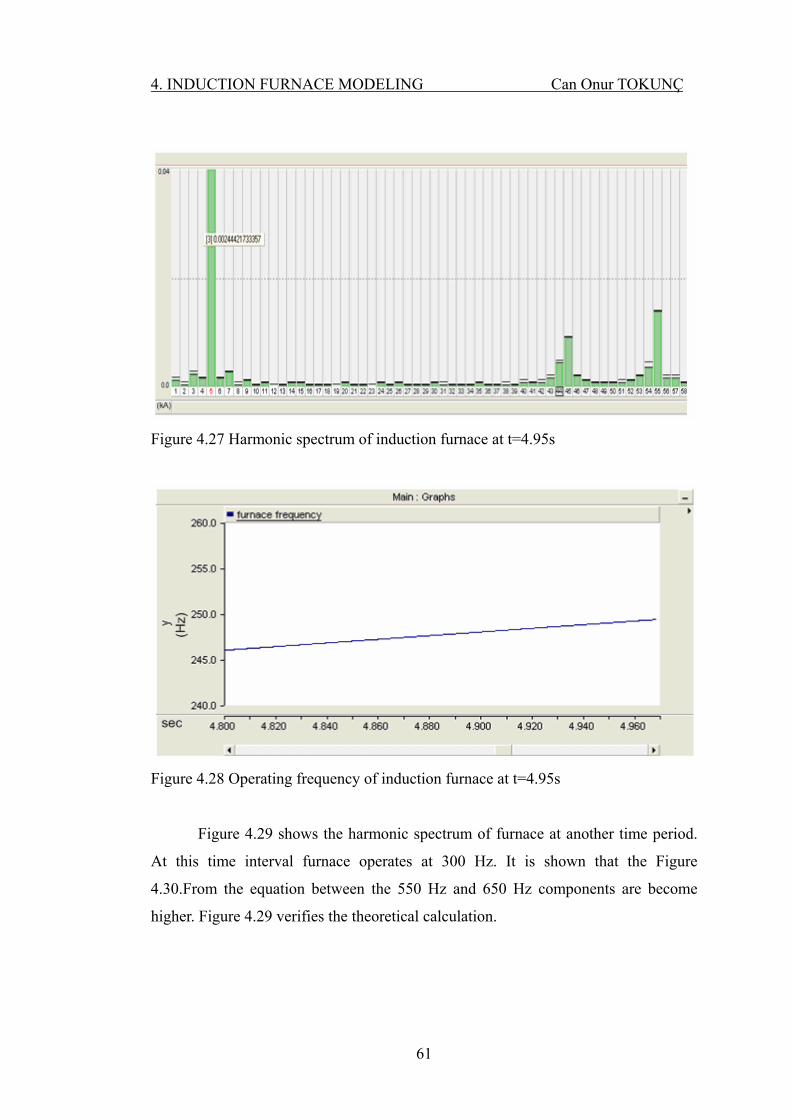
4. INDUCTION FURNACE MODELING Can Onur TOKUNÇ
Figure 4.27 Harmonic spectrum of induction furnace at t=4.95s
Figure 4.28 Operating frequency of induction furnace at t=4.95s
Figure 4.29 shows the harmonic spectrum of furnace at another time period.
At this time interval furnace operates at 300 Hz. It is shown that the Figure
4.30.From the equation between the 550 Hz and 650 Hz components are become
higher. Figure 4.29 verifies the theoretical calculation.
61
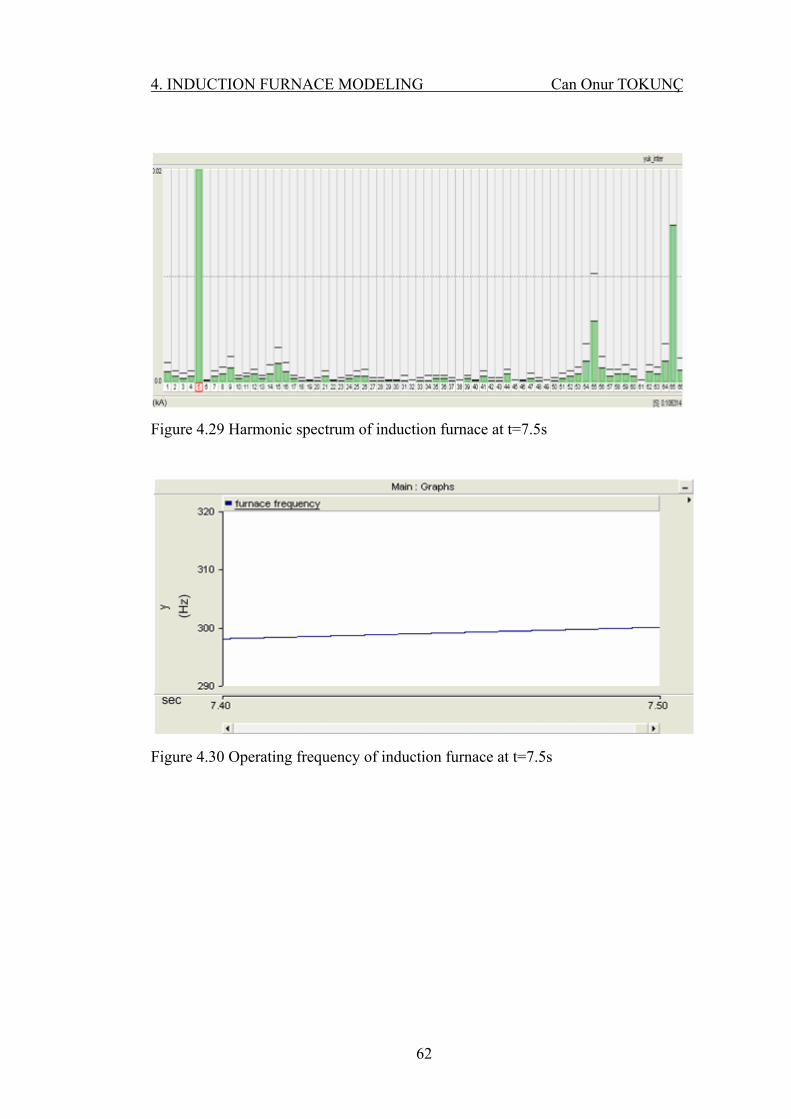
4. INDUCTION FURNACE MODELING Can Onur TOKUNÇ
62
Figure 4.29 Harmonic spectrum of induction furnace at t=7.5s
Figure 4.30 Operating frequency of induction furnace at t=7.5s
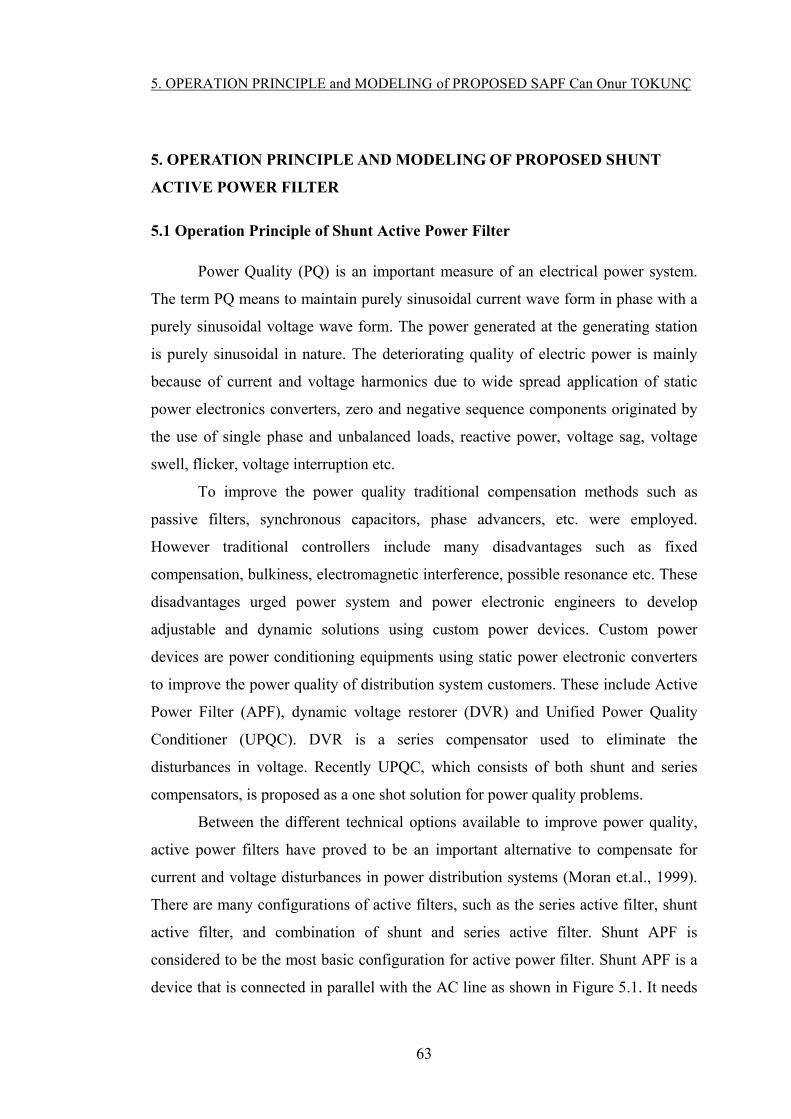
5. OPERATION PRINCIPLE and MODELING of PROPOSED SAPF Can Onur TOKUNÇ
5. OPERATION PRINCIPLE AND MODELING OF PROPOSED SHUNT
ACTIVE POWER FILTER
5.1 Operation Principle of Shunt Active Power Filter
Power Quality (PQ) is an important measure of an electrical power system.
The term PQ means to maintain purely sinusoidal current wave form in phase with a
purely sinusoidal voltage wave form. The power generated at the generating station
is purely sinusoidal in nature. The deteriorating quality of electric power is mainly
because of current and voltage harmonics due to wide spread application of static
power electronics converters, zero and negative sequence components originated by
the use of single phase and unbalanced loads, reactive power, voltage sag, voltage
swell, flicker, voltage interruption etc.
To improve the power quality traditional compensation methods such as
passive filters, synchronous capacitors, phase advancers, etc. were employed.
However traditional controllers include many disadvantages such as fixed
compensation, bulkiness, electromagnetic interference, possible resonance etc. These
disadvantages urged power system and power electronic engineers to develop
adjustable and dynamic solutions using custom power devices. Custom power
devices are power conditioning equipments using static power electronic converters
to improve the power quality of distribution system customers. These include Active
Power Filter (APF), dynamic voltage restorer (DVR) and Unified Power Quality
Conditioner (UPQC). DVR is a series compensator used to eliminate the
disturbances in voltage. Recently UPQC, which consists of both shunt and series
compensators, is proposed as a one shot solution for power quality problems.
Between the different technical options available to improve power quality,
active power filters have proved to be an important alternative to compensate for
current and voltage disturbances in power distribution systems (Moran et.al., 1999).
There are many configurations of active filters, such as the series active filter, shunt
active filter, and combination of shunt and series active filter. Shunt APF is
considered to be the most basic configuration for active power filter. Shunt APF is a
device that is connected in parallel with the AC line as shown in Figure 5.1. It needs
63

5. OPERATION PRINCIPLE and MODELING of PROPOSED SAPF Can Onur TOKUNÇ
to be sized only for the harmonic current drawn by the non-linear loads and function
as a current source to cancel the reactive and harmonic currents generated from a
group of nonlinear loads, so that the resulting total current drawn from the AC main
is sinusoidal (Rudnick et.al., 2003).
Figure 5.1 Shunt APF connected to the nonlinear load (Rudnick et.al., 2003).
In three-phase unbalanced loads it is also possible to redistribute and equalize
the mains phase-currents, providing that the total amount of active power remains the
same. In this form, the filter can solve three problems at once: a) elimination of
unwanted harmonics b) power factor compensation c) redistribution of power to
keep the system balanced.
In the practical implementation of this kind of filter, force commutated,
current-controlled voltage-source inverters are widely used. The quality and
performance of the active power filter depends mainly on three considerations a) the
design of the power inverter (semiconductors, inductances, capacitors, dc voltage); b)
the modulation method used to follow the current template (hysteresis, triangular
carrier, periodical sampling); and c) the method implemented to generate the
reference generator (Dixon et.al., 1995).
Figure 5.2 shows the basic compensation principle of the shunt active power
filter. It is controlled to draw or supply a compensating current ic from or to the
64

5. OPERATION PRINCIPLE and MODELING of PROPOSED SAPF Can Onur TOKUNÇ
utility, so that it cancels current harmonics on the ac side. Figure 5.2 shows the
different waveforms. Curve A is the load current waveform, and curve B is the
desired main current. Curve C shows the compensating current injected by the active
filter containing all the harmonics, to make the mains current sinusoidal. In this
manner a shunt active power filter can be used to eliminate current harmonics and
reactive power compensation. (Jain et.al., 2007)(Usta et. al.2006).
Figure 5.2 Basic compensation principle and shapes of the load, source, and filter current
Shunt active power filters are normally implemented with pulse-width
modulated voltage source inverters (Moran et.al.,1999). There are two types of
inverters used in the development of APF’s. Figure 5.3 shows the current-fed pulse
width modulation (PWM) inverter bridge structure. It behaves as a non-sinusoidal
current source to meet the harmonic current requirement of the nonlinear load. A
diode is used in series with the self commutating device (IGBT) for reverse voltage
blocking. However, GTO-based configurations do not need the series diode, but they
have restricted frequency of switching. They are considered sufficiently reliable but
have higher losses and require higher values of parallel ac power capacitors.
Moreover, they cannot be used in multilevel or multistep modes to improve
performance in higher ratings.
65
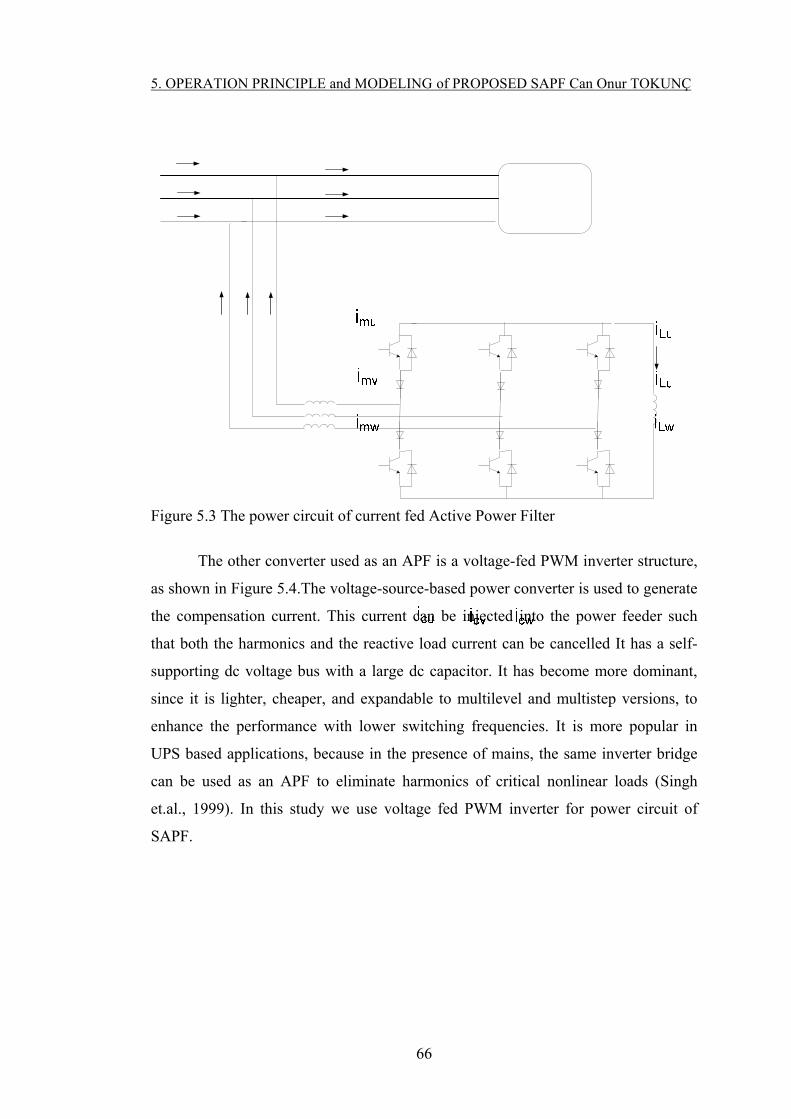
5. OPERATION PRINCIPLE and MODELING of PROPOSED SAPF Can Onur TOKUNÇ
Figure 5.3 The power circuit of current fed Active Power Filter
The other converter used as an APF is a voltage-fed PWM inverter structure,
as shown in Figure 5.4.The voltage-source-based power converter is used to generate
the compensation current. This current can be injected into the power feeder such
that both the harmonics and the reactive load current can be cancelled It has a self-
supporting dc voltage bus with a large dc capacitor. It has become more dominant,
since it is lighter, cheaper, and expandable to multilevel and multistep versions, to
enhance the performance with lower switching frequencies. It is more popular in
UPS based applications, because in the presence of mains, the same inverter bridge
can be used as an APF to eliminate harmonics of critical nonlinear loads (Singh
et.al., 1999). In this study we use voltage fed PWM inverter for power circuit of
SAPF.
66

5. OPERATION PRINCIPLE and MODELING of PROPOSED SAPF Can Onur TOKUNÇ
Figure 5.4 The power circuit of voltage fed Active Power Filter
In recent years, there has been an increasing interest in using multilevel
inverters for high power energy conversion, especially for drives and reactive power
compensation. Multilevel PWM inverters can be connected to high voltage source
without a coupling transformer. The use of neutral-point-clamped (NPC) inverters
allows equal voltage shearing of the series connected devices in each phase.
However, the neutral point potential deviates, resulting in an excess voltage stress to
either the upper or lower set of devices (Moran et.al.,1999).
Numerous types of shunt active power filters have been proposed in many
papers. Most of these papers discuss the standard and function for controlling
different topologies of APF’s. This project is concerned on a PLL based control
topology and voltage source inverter power circuit for a shunt active power filter.
5.2 Available Control Methods of Shunt Active Filters
Figure 5.5 shows the main components of a typical active power filter system
and their interconnections. Active power filter consist of power circuit and control
circuit. The operation of APF consists of two stages; detecting the harmonics current
67
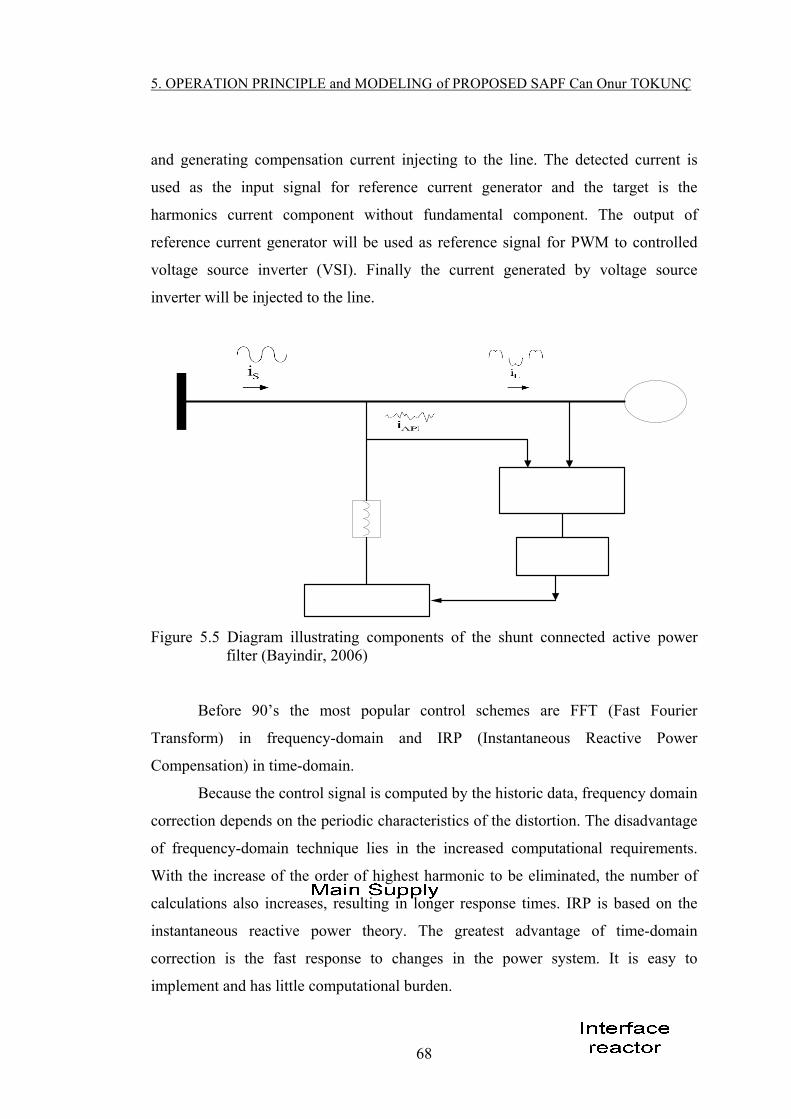
5. OPERATION PRINCIPLE and MODELING of PROPOSED SAPF Can Onur TOKUNÇ
and generating compensation current injecting to the line. The detected current is
used as the input signal for reference current generator and the target is the
harmonics current component without fundamental component. The output of
reference current generator will be used as reference signal for PWM to controlled
voltage source inverter (VSI). Finally the current generated by voltage source
inverter will be injected to the line.
Figure 5.5 Diagram illustrating components of the shunt connected active power filter (Bayindir, 2006)
Before 90’s the most popular control schemes are FFT (Fast Fourier
Transform) in frequency-domain and IRP (Instantaneous Reactive Power
Compensation) in time-domain.
Because the control signal is computed by the historic data, frequency domain
correction depends on the periodic characteristics of the distortion. The disadvantage
of frequency-domain technique lies in the increased computational requirements.
With the increase of the order of highest harmonic to be eliminated, the number of
calculations also increases, resulting in longer response times. IRP is based on the
instantaneous reactive power theory. The greatest advantage of time-domain
correction is the fast response to changes in the power system. It is easy to
implement and has little computational burden.
68
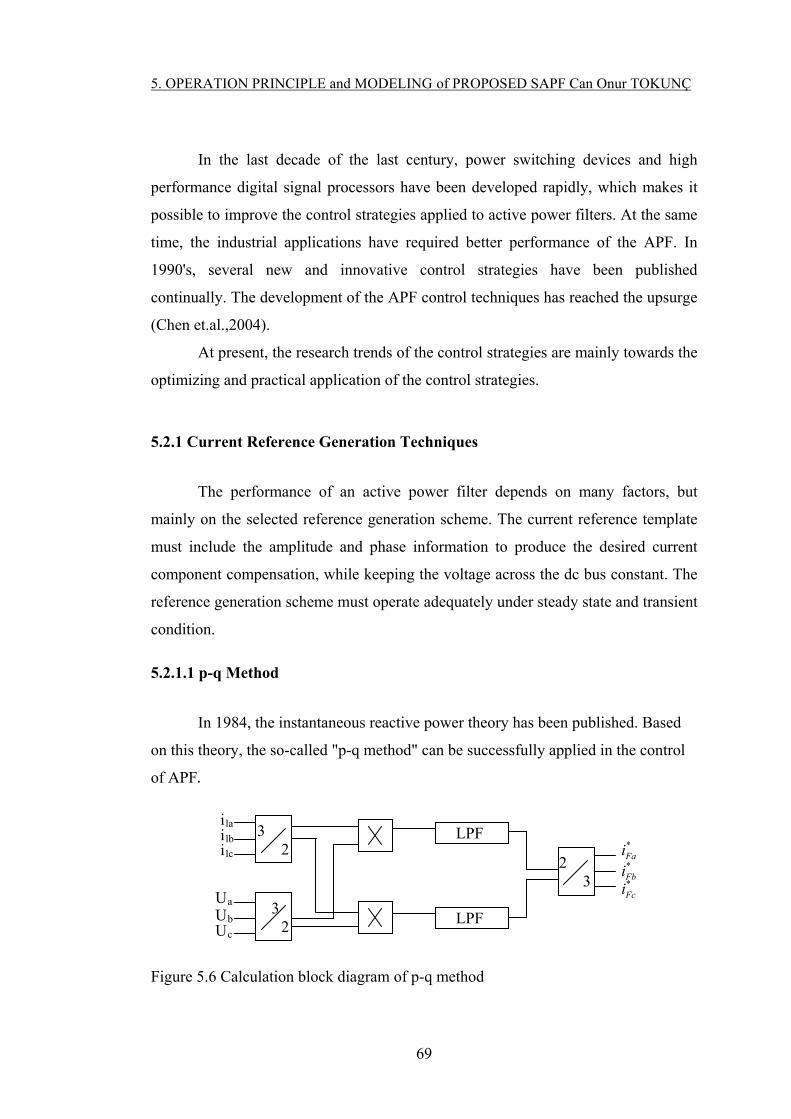
5. OPERATION PRINCIPLE and MODELING of PROPOSED SAPF Can Onur TOKUNÇ
In the last decade of the last century, power switching devices and high
performance digital signal processors have been developed rapidly, which makes it
possible to improve the control strategies applied to active power filters. At the same
time, the industrial applications have required better performance of the APF. In
1990's, several new and innovative control strategies have been published
continually. The development of the APF control techniques has reached the upsurge
(Chen et.al.,2004).
At present, the research trends of the control strategies are mainly towards the
optimizing and practical application of the control strategies.
5.2.1 Current Reference Generation Techniques
The performance of an active power filter depends on many factors, but
mainly on the selected reference generation scheme. The current reference template
must include the amplitude and phase information to produce the desired current
component compensation, while keeping the voltage across the dc bus constant. The
reference generation scheme must operate adequately under steady state and transient
condition.
5.2.1.1 p-q Method
In 1984, the instantaneous reactive power theory has been published. Based
on this theory, the so-called "p-q method" can be successfully applied in the control
of APF.
i la 3 LPF i
Figure 5.6 Calculation block diagram of p-q method
2
3 2
2 3
LPF
lb *Fai*i
i lc
Fb*Fci
Ua
Ub Uc
69

5. OPERATION PRINCIPLE and MODELING of PROPOSED SAPF Can Onur TOKUNÇ
The calculation block diagram is shown in figure 5.6. At first, the three-phase
voltage and the three-phase load currents are transformed into the static α-β frame by
the following:
3
2
1
.2/32/30
2/12/11.
3
2
u
u
u
u
u
(5.1)
3
2
1
.2/32/30
2/12/11.
3
2
l
l
l
l
l
i
i
i
i
i
(5.2)
The instantaneous real power p1 and the instantaneous imaginary power q1
are given by:
l
l
l
l
i
i
uu
uu
q
p. (5.3)
According to the instantaneous reactive power theory, p1 and q1 are
decomposed into instantaneous real and imaginary powers, respectively
llllll qqqppp ~,~ (5.4)
where p and q are the dc components corresponding to the fundamental current, and
p~ and q~ are the ac component corresponding to the harmonic current.
So the current reference signal can be achieved:
l
l
F
F
F
q
p
uu
uu
i
i
i
~
~..
2/32/1
2/32/1
01
3
21
3
2
1
(5.5)
Because the zero-sequence component is neglected in the system, the p-q
method is not accurate when the three-phase system is unbalanced or distorted.
70
5. OPERATION PRINCIPLE and MODELING of PROPOSED SAPF Can Onur TOKUNÇ
The instantaneous reactive power theory allows the possibility of different
compensation strategies:
- Compensate the instantaneous imaginary power q only. In this case the main
supplies the whole instantaneous real power p.
-Compensate the instantaneous imaginary power q plus the AC term of the
instantaneous real power p (Gonzalez et.al,1998).
5.2.1.2 Discrete Fourier Transform (DFT) Control
Discrete Fourier Transform (DFT) is a mathematical transformation for
discrete signals which gives the both the amplitude and phase information of the
desired harmonic by calculating (5.6).
N
hnnxj
N
hnnx
N
n
N
n
2sin).(.
2cos).( X
1
0
1
0
h (5.6)
hihr XjX . Xh (5.7)
22hX hihr XX ;
hr
hh
X
Xarctan (5.8)
where N is the number of samples per fundamental period; x(n) is the input
signal(voltage or current) at point n; Xh is the complex Fourier vector of the hth
harmonic of the input signal; Xhr is the real part of Xh ; Xhi is the imaginary part of
Xh . hX is the amplitude of the vector; h is the phase of the vector.
Once the harmonics are detected and isolated with (5.6) it is just a matter of
reconstruction back in time-domain to create the compensation signal for the
controller (Asiminoaei et. al.,2005).
This method is affected voltage distortions is sensitive to parameter variations
and operating conditions characteristic. The classical DFT is a widely spread
algorithm. However, it disposes by a relatively high computational burden, and thus,
it is not basically eligible for real-time applications.
71
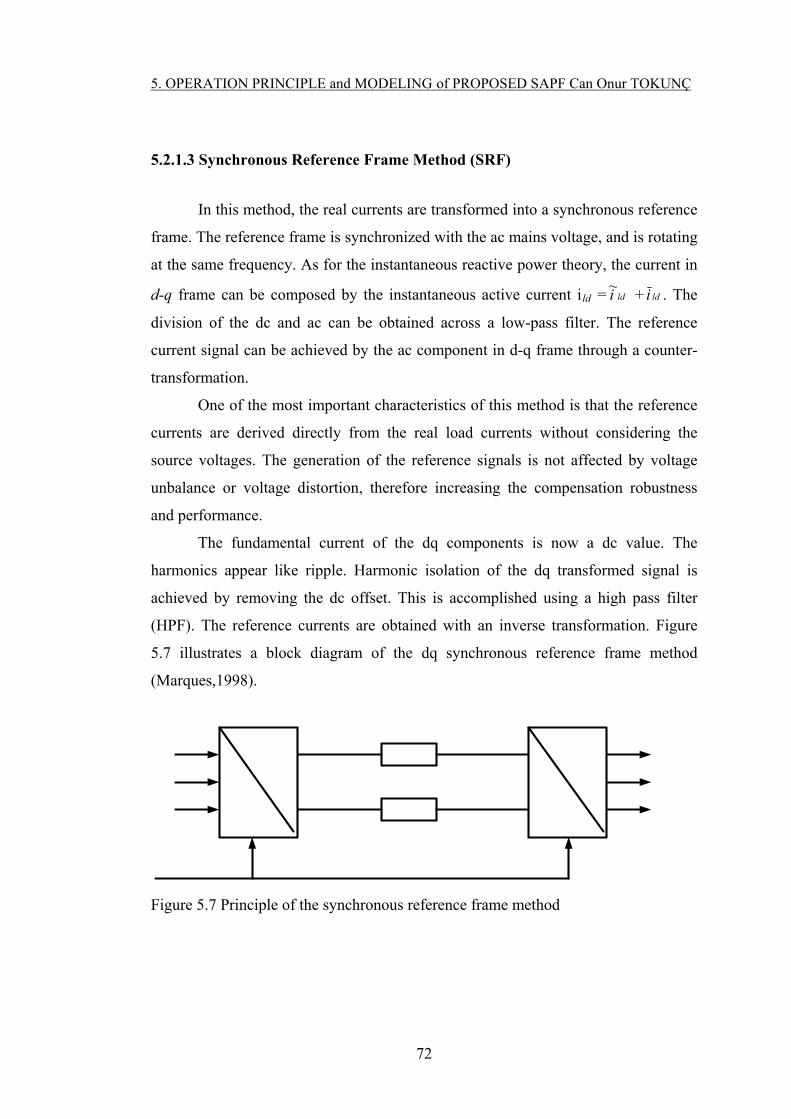
5. OPERATION PRINCIPLE and MODELING of PROPOSED SAPF Can Onur TOKUNÇ
5.2.1.3 Synchronous Reference Frame Method (SRF)
In this method, the real currents are transformed into a synchronous reference
frame. The reference frame is synchronized with the ac mains voltage, and is rotating
at the same frequency. As for the instantaneous reactive power theory, the current in
d-q frame can be composed by the instantaneous active current ild = ldi~
+ ldi . The
division of the dc and ac can be obtained across a low-pass filter. The reference
current signal can be achieved by the ac component in d-q frame through a counter-
transformation.
One of the most important characteristics of this method is that the reference
currents are derived directly from the real load currents without considering the
source voltages. The generation of the reference signals is not affected by voltage
unbalance or voltage distortion, therefore increasing the compensation robustness
and performance.
The fundamental current of the dq components is now a dc value. The
harmonics appear like ripple. Harmonic isolation of the dq transformed signal is
achieved by removing the dc offset. This is accomplished using a high pass filter
(HPF). The reference currents are obtained with an inverse transformation. Figure
5.7 illustrates a block diagram of the dq synchronous reference frame method
(Marques,1998).
Figure 5.7 Principle of the synchronous reference frame method
72
5. OPERATION PRINCIPLE and MODELING of PROPOSED SAPF Can Onur TOKUNÇ
5.2.2 Current Control Techniques
The performance of an active power filter is affected significantly by the
selection of current control techniques. To compensate for the distorted current
drawn by the rectifiers from the utility grid, the active filter and its current control
must have the capability to track sudden slope variations in the current reference,
corresponding to very high di/dt value, which makes the design of the control and the
practical implementation of the filter particularly critical. Therefore, in the active
power filter application, the choice and implementation of the current regulator is
more important for the achievement of a satisfactory performance level.
5.2.2.1 Hysteresis Current Control
The basic principle of hysteresis current control technique is that the
switching signals are derived from the comparison of the current error signal with a
fixed width hysteresis band. With simple, extreme robustness, good stability, fast
dynamic and automatic current limited characteristic, this current control technique
exhibits some unsatisfactory features. The main one is that it produces a varying
modulation frequency for the active power filter. And it is difficult to design the
input filters to the possible generation of unwanted resonance on the utility grid. That
the performance of active power filter affected by the phase current interaction is
also a negative feature and the current coupling restrict the current control technique
applied in the system with insulated neutral. In order to overcome the intrinsic
shortcomings, many improvements have been suggested.
This technique is simple and robust but has many drawbacks as a phase
current interaction and a varying modulation frequency that causes acoustic noise
and difficulty in designing input filters (Meo et.al.,2002).
5.2.2.2 Triangle-Comparison PWM control
This current control technique is also called linear current control. The
principle of the conventional triangle comparison PWM control is that the
73
5. OPERATION PRINCIPLE and MODELING of PROPOSED SAPF Can Onur TOKUNÇ
modulation signal achieved by a current regulator from the current error signal is
intersected with the triangle wave and the pulse signals obtained are to control the
switches of the converter. With analog PWM circuit, this current control technique is
with fast speed of response and simple implementation. Because the modulation
frequency equals the triangle frequency, the current loop gain crossover frequency
must be kept below the modulation frequency (Chen et.al.,2004).
5.2.2.3 Space vector modulation (SVM)
The goal of the space vector modulation is to find the appropriate switching
combinations and their duty ratios according to certain modulation scheme. The
space vector modulation operates in a complex plane divided in the six sectors
separated by a combination of conducting or non conducting switches in the power
circuit. The reference vector is used to locate two adjacent switching-state vectors
and compute the time for which each one is active. Although with the good reliability
and strong anti jamming of digital control technique, SVM is of low speed of
response caused by the inherent calculation delay (Chen et.al.,2004).
5.3 Proposed Control Strategy for Shunt Active Power Filter
5.3.1 Reference Generation Method
Extraction of signals representing harmonics, reactive current and
symmetrical components is a requirement for status evaluation, control and power-
quality monitoring/enhancement in power systems (Karimi et.al.,2004). An integral
part of an active compensation device is the detection unit which generates the
reference signals. Various methods, e.g. Discrete Fourier Transform (DFT), notch
filtering and theory of instantaneous reactive power have been presented in the
literature for this purpose (Mokhtari et.al, 2004).
In this study we use EPLL based control method for shunt active power filter
and voltage source inverter for power circuit. A paper which is written by Karimi
74
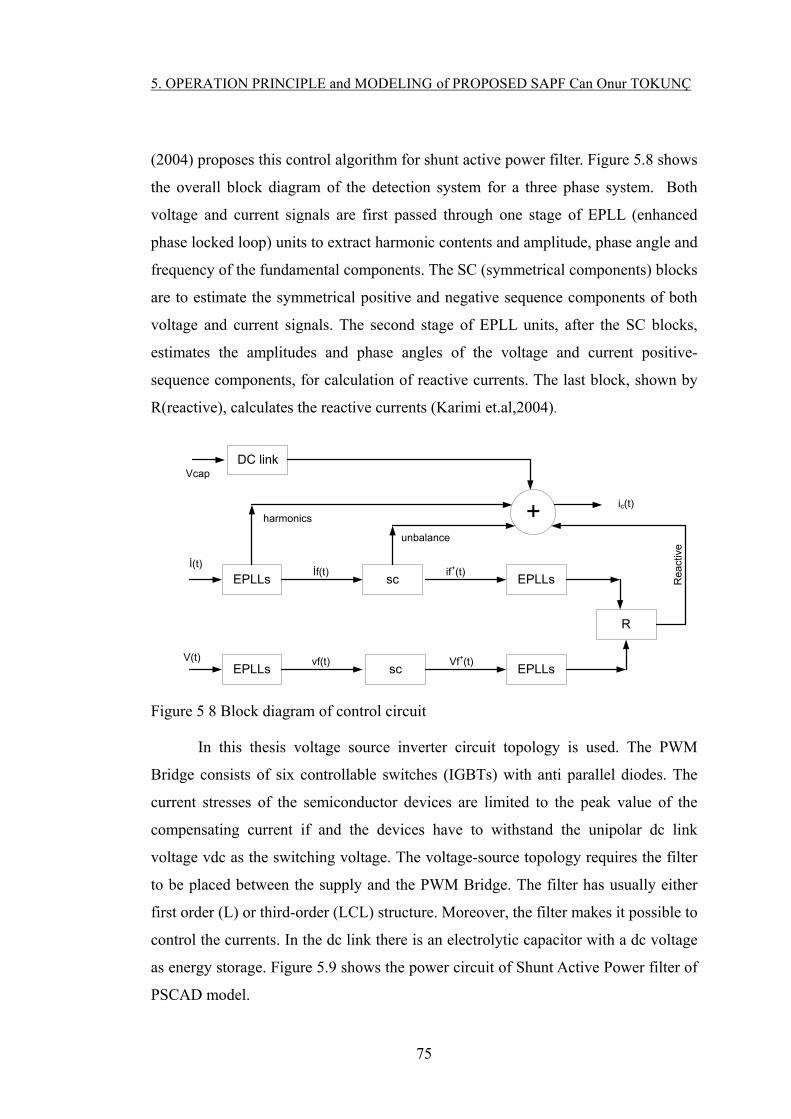
5. OPERATION PRINCIPLE and MODELING of PROPOSED SAPF Can Onur TOKUNÇ
(2004) proposes this control algorithm for shunt active power filter. Figure 5.8 shows
the overall block diagram of the detection system for a three phase system. Both
voltage and current signals are first passed through one stage of EPLL (enhanced
phase locked loop) units to extract harmonic contents and amplitude, phase angle and
frequency of the fundamental components. The SC (symmetrical components) blocks
are to estimate the symmetrical positive and negative sequence components of both
voltage and current signals. The second stage of EPLL units, after the SC blocks,
estimates the amplitudes and phase angles of the voltage and current positive-
sequence components, for calculation of reactive currents. The last block, shown by
R(reactive), calculates the reactive currents (Karimi et.al,2004).
EPLLs
EPLLs
sc
sc
EPLLs
EPLLs
R
İ(t)
V(t)
İf(t)
vf(t) Vf+(t)
if+(t)
unbalance
harmonics
ic(t)
Rea
ctiv
e
VcapDC link
Figure 5 8 Block diagram of control circuit
In this thesis voltage source inverter circuit topology is used. The PWM
Bridge consists of six controllable switches (IGBTs) with anti parallel diodes. The
current stresses of the semiconductor devices are limited to the peak value of the
compensating current if and the devices have to withstand the unipolar dc link
voltage vdc as the switching voltage. The voltage-source topology requires the filter
to be placed between the supply and the PWM Bridge. The filter has usually either
first order (L) or third-order (LCL) structure. Moreover, the filter makes it possible to
control the currents. In the dc link there is an electrolytic capacitor with a dc voltage
as energy storage. Figure 5.9 shows the power circuit of Shunt Active Power filter of
PSCAD model.
75
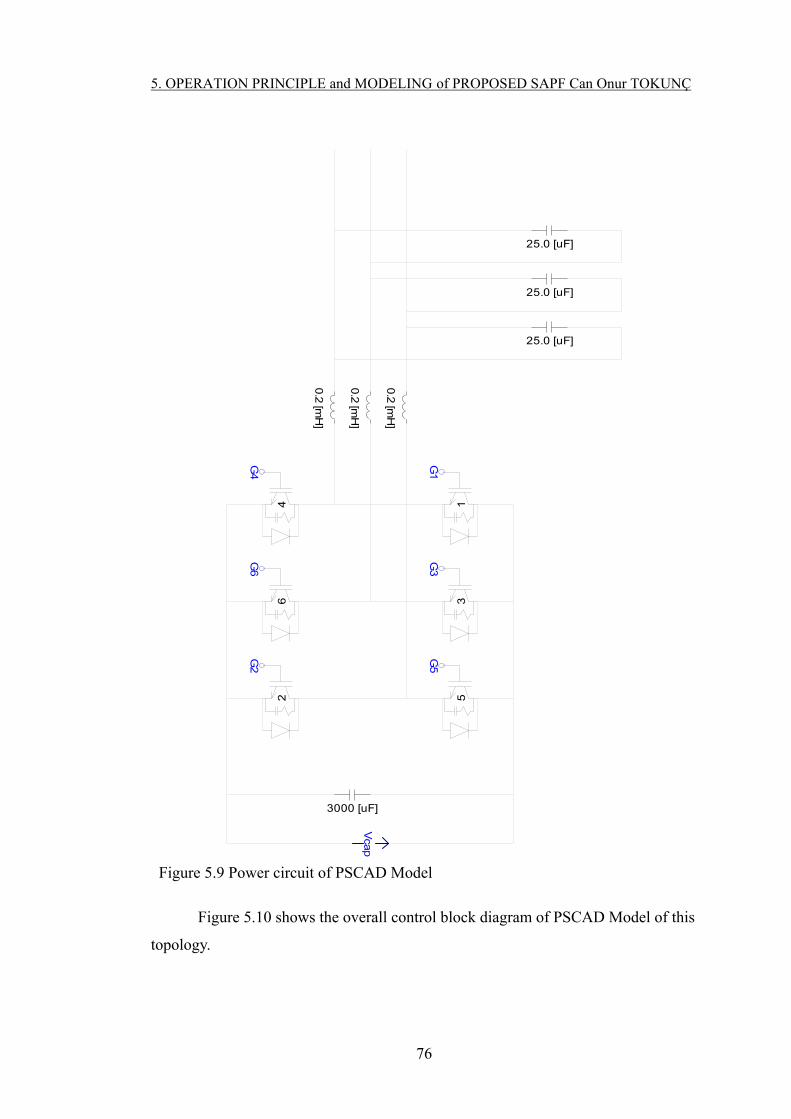
5. OPERATION PRINCIPLE and MODELING of PROPOSED SAPF Can Onur TOKUNÇ
13
5
46
2
G1
G3
G5
G4
G6
G2
3000 [uF]
0.2
[mH
]
0.2
[mH
]
0.2
[mH
]
25.0 [uF]
25.0 [uF]
25.0 [uF]
Vca
p Figure 5.9 Power circuit of PSCAD Model
Figure 5.10 shows the overall control block diagram of PSCAD Model of this
topology.
76
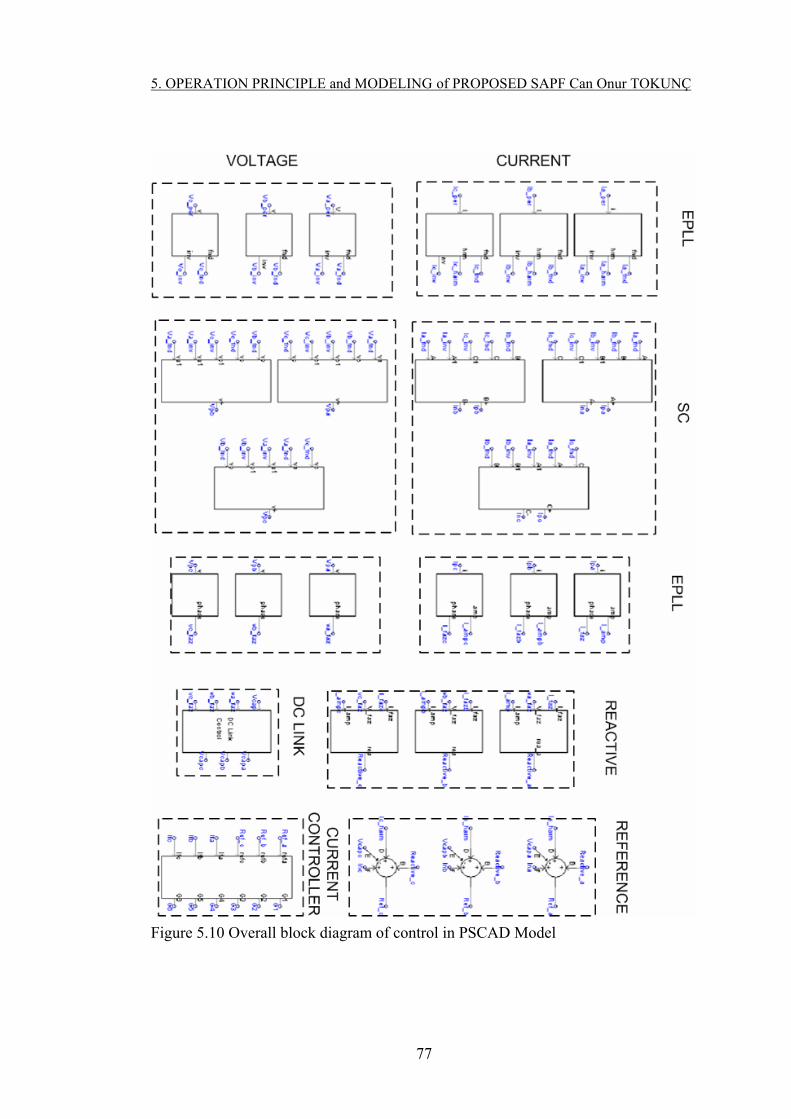
5. OPERATION PRINCIPLE and MODELING of PROPOSED SAPF Can Onur TOKUNÇ
Figure 5.10 Overall block diagram of control in PSCAD Model
77

5. OPERATION PRINCIPLE and MODELING of PROPOSED SAPF Can Onur TOKUNÇ
5.3.1.1 Enhanced Phase Lock Loop(EPLL) Block
Both voltage and current signals are first passed through the EPLL units. A
block diagram of the EPLL is shown in Figure 5.11. The EPLL receives the input
signal u(t) and provides an online estimate of the following signals (Fellow
et.al,2004).
_ synchronized fundamental component y(t)
_ Amplitude A (t) of y(t)
_ Phase angle
_ time-derivatives of amplitude, phase and frequency
_ 900 phase-shifted version of the fundamental component y(t)
Figure 5.11 Block diagram of enhanced phase locked loop
Figure 5.12 and figure 5.13 shows the EPLL block of PSCAD model for
current calculation.
78

5. OPERATION PRINCIPLE and MODELING of PROPOSED SAPF Can Onur TOKUNÇ
Ia_harm
Ia_fnd
Ia_peri1l
Ia_fndd
Ia_harm
Ia_invIa_inv
Figure 5.12 EPLL block of PSCAD model for current signal
This block receive current signal and provide fundamental component of
current signal, harmonic content of current signal and 900 phase-shifted version of
the fundamental component. Figure 5.13 shows inside of this block. We use this
block separately for each phase current.
Ia_per
Ia_fndd
Ia_harm
Ia_
inv
B
-
D + **1
*200
B
+
D +
F
+
1sT
Sin
Sin
B
+
D +
*
1sT
*
y
*200
*50
1sT
A
*
314 -1.57
Figure 5.13 Inside of EPLL block of PSCAD model
Harmonic Content
Phase Current
Fundamental Component
Inverse of fundamental component
79
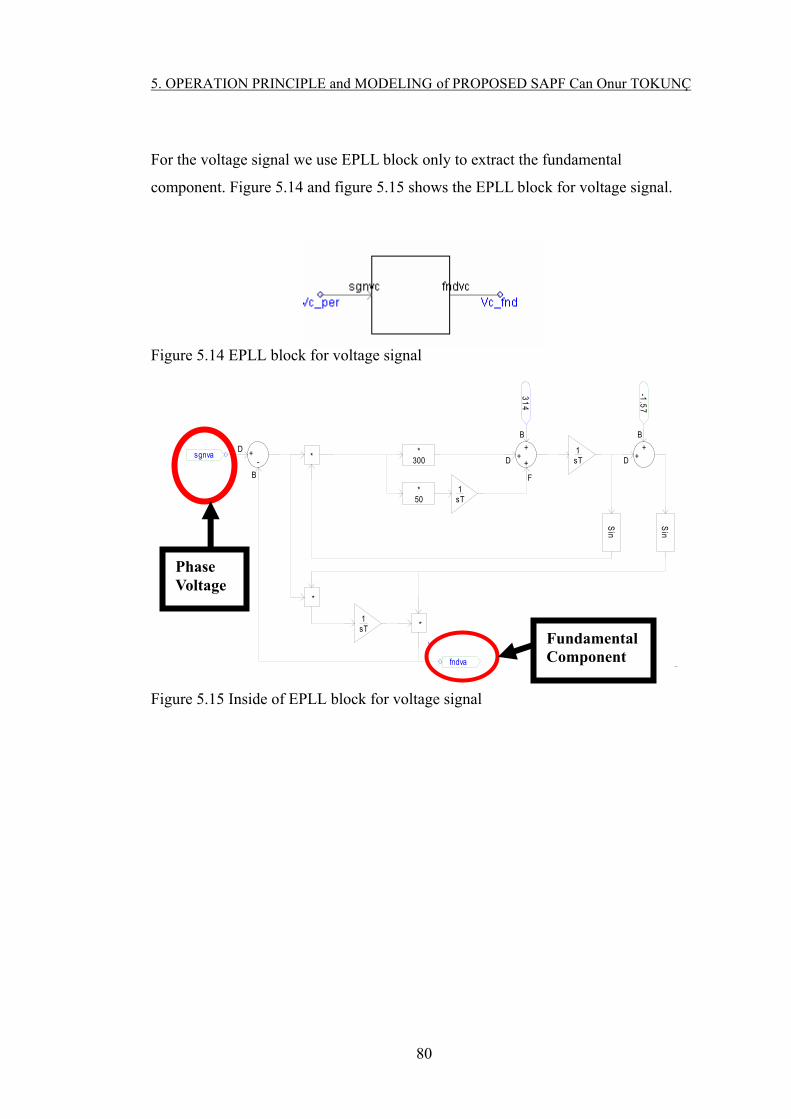
5. OPERATION PRINCIPLE and MODELING of PROPOSED SAPF Can Onur TOKUNÇ
For the voltage signal we use EPLL block only to extract the fundamental
component. Figure 5.14 and figure 5.15 shows the EPLL block for voltage signal.
Figure 5.14 EPLL block for voltage signal
sgnva
fndva
**
300
B
+
D +
F
+
1sT
Sin
31
4
Sin
B
+
D +
*
1sT
*
y
-1.5
7
B
-
D +
*50
1sT
Phase Voltage
Figure 5.15 Inside of EPLL block for voltage signal
Fundamental Component
80

5. OPERATION PRINCIPLE and MODELING of PROPOSED SAPF Can Onur TOKUNÇ
Current stage
Ia_harm
Ia_fnd
Ia_per
Ib_per
Ib_fnd
Ib_harm
Ic_per
Ic_fnd
Ic_harm
i1l
Ia_fndd
Ia_harm
Ia_invIa_inv
Ib_per
Ib_fnd
Ib_harm
Ib_invIb_inv
Ic_per
Ic_fnd
Ic_harm
Ic_invIc_inv
Harmonic
Figure 5.16 EPLL Blocks for three phase current
Current
Fundamental
Inverse of Fundamental
81

5. OPERATION PRINCIPLE and MODELING of PROPOSED SAPF Can Onur TOKUNÇ
Fundamental Voltage
Figure 5.17 EPLL Blocks for three phase voltage
Figure 5.16 and Figure 5.17 shows the three phase voltage and current EPLL
blocks of PSCAD. Figure 5.16 shows the current branch of first step EPLL blocks.
Figure 5.17 shows the voltage branch of first step EPLL blocks.
5.3.1.2 Symmetrical Component(SC) Block
After the EPLL block, the SC blocks are to estimate the symmetrical positive
and negative sequence components of both voltage and current signals.
The instantaneous positive-sequence system of a set of three-phase voltages is
defined as
tv
tv
tv
tv
tv
tv
fc
fb
fa
c
b
a
1
1
1
3
1
2
2
2
(5.9)
Where β= ej120 is a 120 degree phase shift in the time domain.
82

5. OPERATION PRINCIPLE and MODELING of PROPOSED SAPF Can Onur TOKUNÇ
It is also possible to extend the EPLL-based system to separately obtain
negative- and zero-sequence components and provide more functionally within the
control system. The instantaneous negative-sequence system is defined as
tv
tv
tv
tv
tv
tv
fc
fb
fa
c
b
a
1
1
1
3
1
2
2
2
(5.10)
Assume that v(t) and i(t) denote the load phase-voltage and current signals for
which the fundamental components and harmonics are extracted by EPLL units as:
tvV
tvV
tvV
tv
tv
tv
tvhc
vcc
hb
vbb
ha
vaa
c
b
a
sin
sin
sin
)( (5.11)
Figure 5.18 shows the symmetrical components blocks in PSCAD model.
These blocks receive fundamental three phase current signal and inverse of the two
phase current signal and provide positive sequence signal, negative sequence signal
and zero sequence signal.
Figure 5.18 SC blocks in PSCAD model.
The symmetrical components present a mathematical approach for the
analysis of an asymmetrical polyphase system (under steady-state conditions) by
transforming it into a set of symmetrical sequence networks called positive-, negative
and zero-sequence networks. The sequence networks are used for the analysis of
faults and relay protection of power systems.
83
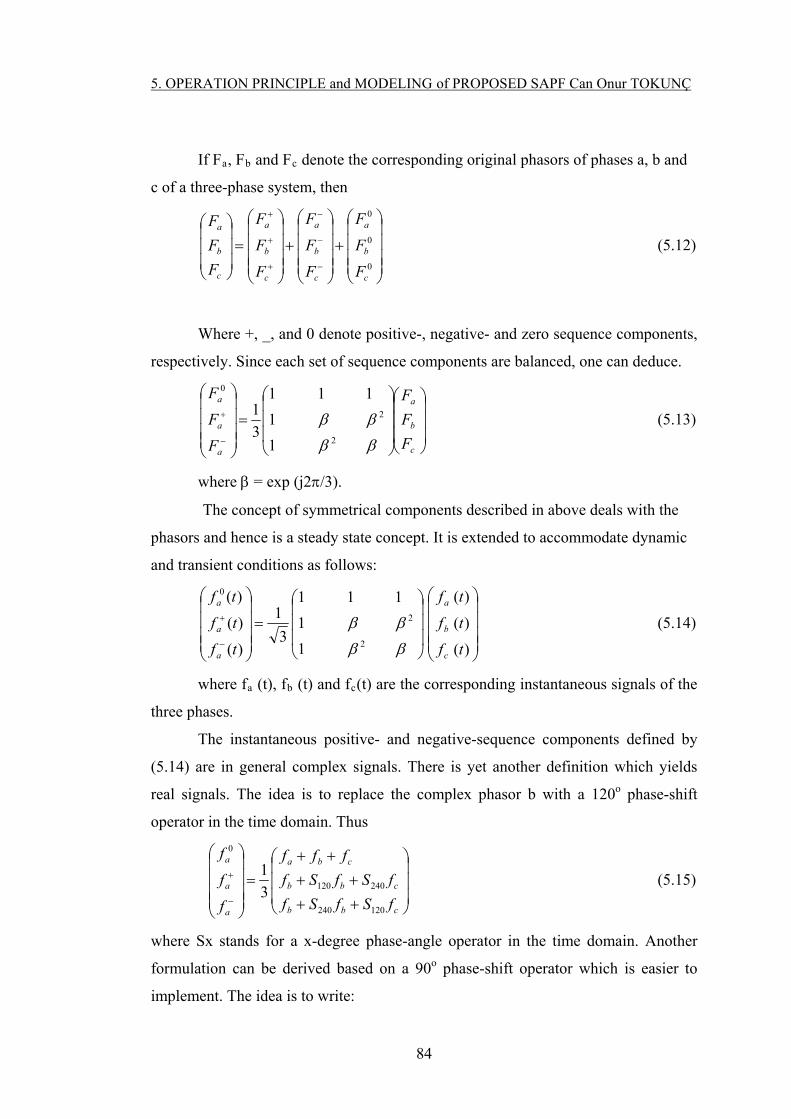
5. OPERATION PRINCIPLE and MODELING of PROPOSED SAPF Can Onur TOKUNÇ
If Fa, Fb and Fc denote the corresponding original phasors of phases a, b and
c of a three-phase system, then
(5.12)
0
0
0
c
b
a
c
b
a
c
b
a
c
b
a
F
F
F
F
F
F
F
F
F
F
F
F
Where +, _, and 0 denote positive-, negative- and zero sequence components,
respectively. Since each set of sequence components are balanced, one can deduce.
c
b
a
a
a
a
F
F
F
F
F
F
2
2
0
1
1
111
3
1 (5.13)
where = exp (j2/3).
The concept of symmetrical components described in above deals with the
phasors and hence is a steady state concept. It is extended to accommodate dynamic
and transient conditions as follows:
)(
)(
)(
1
1
111
3
1
)(
)(
)(
2
2
0
tf
tf
tf
tf
tf
tf
c
b
a
a
a
a
(5.14)
where fa (t), fb (t) and fc(t) are the corresponding instantaneous signals of the
three phases.
The instantaneous positive- and negative-sequence components defined by
(5.14) are in general complex signals. There is yet another definition which yields
real signals. The idea is to replace the complex phasor b with a 120o phase-shift
operator in the time domain. Thus
cbb
cbb
cba
a
a
a
fSfSf
fSfSf
fff
f
f
f
120240
240120
0
3
1 (5.15)
where Sx stands for a x-degree phase-angle operator in the time domain. Another
formulation can be derived based on a 90o phase-shift operator which is easier to
implement. The idea is to write:
84

5. OPERATION PRINCIPLE and MODELING of PROPOSED SAPF Can Onur TOKUNÇ
90120
2
3
2
1 jj ee
and the result is:
)(2
3)(
2
1
)(2
3)(
2
1
3
1
90
90
0
cbcbb
cbcbb
cba
a
a
a
ffSfff
ffSfff
fff
f
f
f
(5.16)
The instantaneous symmetrical components are used for dynamic
compensation, balancing and control of power systems by means of static
compensators. This concept can be defined both on a total signal (such as above) or
on a single frequency component of it (for example its fundamental component). It
can be shown that (5.15) and (5.16) are equivalent with respect to the fundamental
components.
The instantaneous symmetrical components of a three phase system fa(t),
fb(t), fc(t) are defined by (5.14) which yields complex quantities. Two alternative
definitions which yield real instantaneous symmetrical components are (5.20) and
(5.16). Although these definitions are valid for the total signals, they are usually
applied to a specific component, e.g. the fundamental components. Among the
constituting components of a signal, the fundamental component carries the most
significant pieces of information and is used for load balancing, power factor
correction and other purposes in the context of power systems. Hence, the
derivations in this section, without lose of generality, are applied to the fundamental
components.
Rewriting (5.14) for the fundamental components results in.
)sin(ˆ
)sin(ˆ
)sin(ˆ
1
1
111
3
1
)(
)(
)(
2
2
0
cc
bb
aa
a
a
a
v
v
v
tv
tv
tv
(5.17)
85
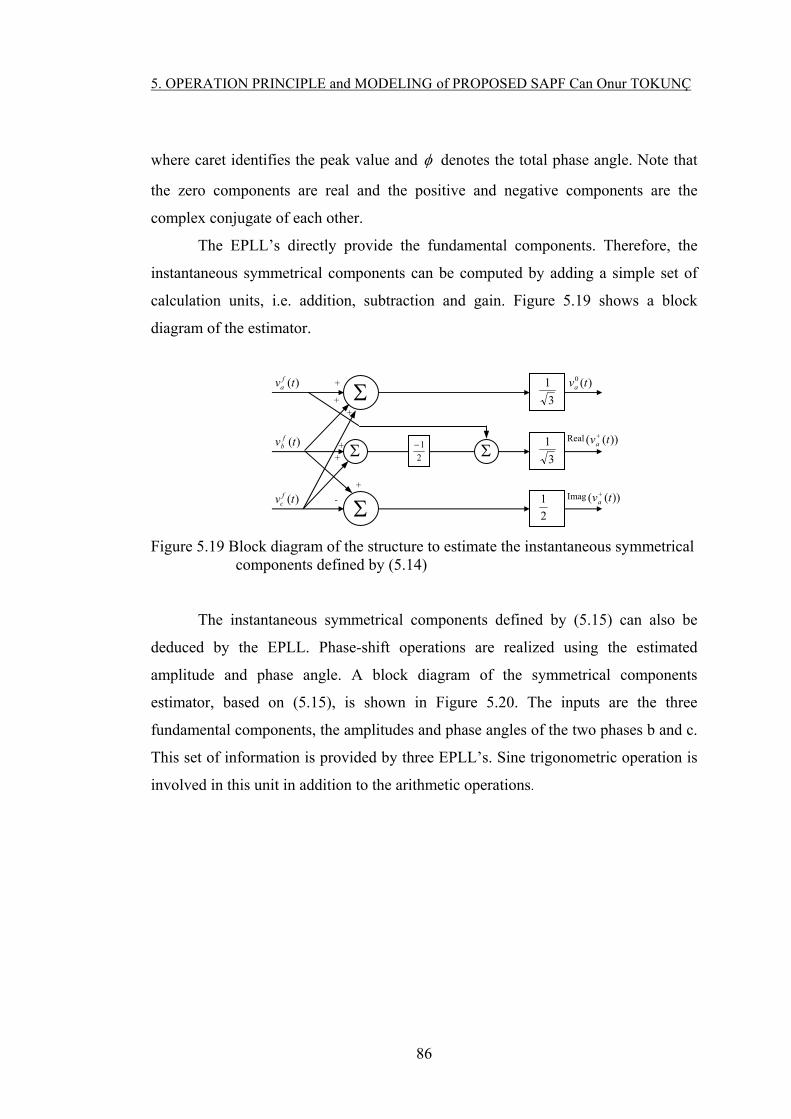
5. OPERATION PRINCIPLE and MODELING of PROPOSED SAPF Can Onur TOKUNÇ
where caret identifies the peak value and denotes the total phase angle. Note that
the zero components are real and the positive and negative components are the
complex conjugate of each other.
The EPLL’s directly provide the fundamental components. Therefore, the
instantaneous symmetrical components can be computed by adding a simple set of
calculation units, i.e. addition, subtraction and gain. Figure 5.19 shows a block
diagram of the estimator.
)(tv fa )(0 tva
3
1+
Figure 5.19 Block diagram of the structure to estimate the instantaneous symmetrical components defined by (5.14)
The instantaneous symmetrical components defined by (5.15) can also be
deduced by the EPLL. Phase-shift operations are realized using the estimated
amplitude and phase angle. A block diagram of the symmetrical components
estimator, based on (5.15), is shown in Figure 5.20. The inputs are the three
fundamental components, the amplitudes and phase angles of the two phases b and c.
This set of information is provided by three EPLL’s. Sine trigonometric operation is
involved in this unit in addition to the arithmetic operations.
)(tv fb +
3
1
Real ( ))(tva
)(tv fc -
2
1Imag ( ))(tva
2
1
++
+
+
86

5. OPERATION PRINCIPLE and MODELING of PROPOSED SAPF Can Onur TOKUNÇ
+
+
+
-
sine
sine X
X+
+
1/3
+
+ +++
+
+
+
-
sine
sine X
X 1/3
1/3
+
++
Va
^Vb
øb
Vb
Vc
^Vc
øc
Va-
Va0
Va+
X
X
X
X
Figure 5.20 Block diagram of the structure to estimate the instantaneous symmetrical components defined by (5.15)
The instantaneous symmetrical components defined by (5.16) can be obtained
using EPLL’s in a simpler manner than that of (5.15). This is due to the fact that the
EPLL automatically provides the 90o phase shifted version of the fundamental
component. A block diagram of the corresponding estimator is shown in Figure 5.21.
This structure is simpler than that of Figure 5.20 since it does not involve
trigonometric functions.
87

5. OPERATION PRINCIPLE and MODELING of PROPOSED SAPF Can Onur TOKUNÇ
-1/2
+ -
Va
Vb
S90Vb
Vc
S90Vc
K
1/3+
++
+
-
+Va
+
1/3+ +
Va-
32
1K
++
++
Va0
Figure 5.21 Block diagram of the structure to estimate the instantaneous symmetrical components defined by (5.16)
The EPLL furnishes the proposed method of estimation of the symmetrical
components with a flexible structure (Iravani et.al.,2003). For example, the time-
domain positive components, which are used in various applications, can be
extracted readily. The time-domain positive sequence system is defined as:
)(
)(
)(
1
1
1
3
1
)(
)(
)(
2
2
2
tv
tv
tv
tv
tv
tv
fc
fb
fa
c
b
a
(5.18)
Rewriting (5.18) in terms of the 90o phase-shift operator yields:
88
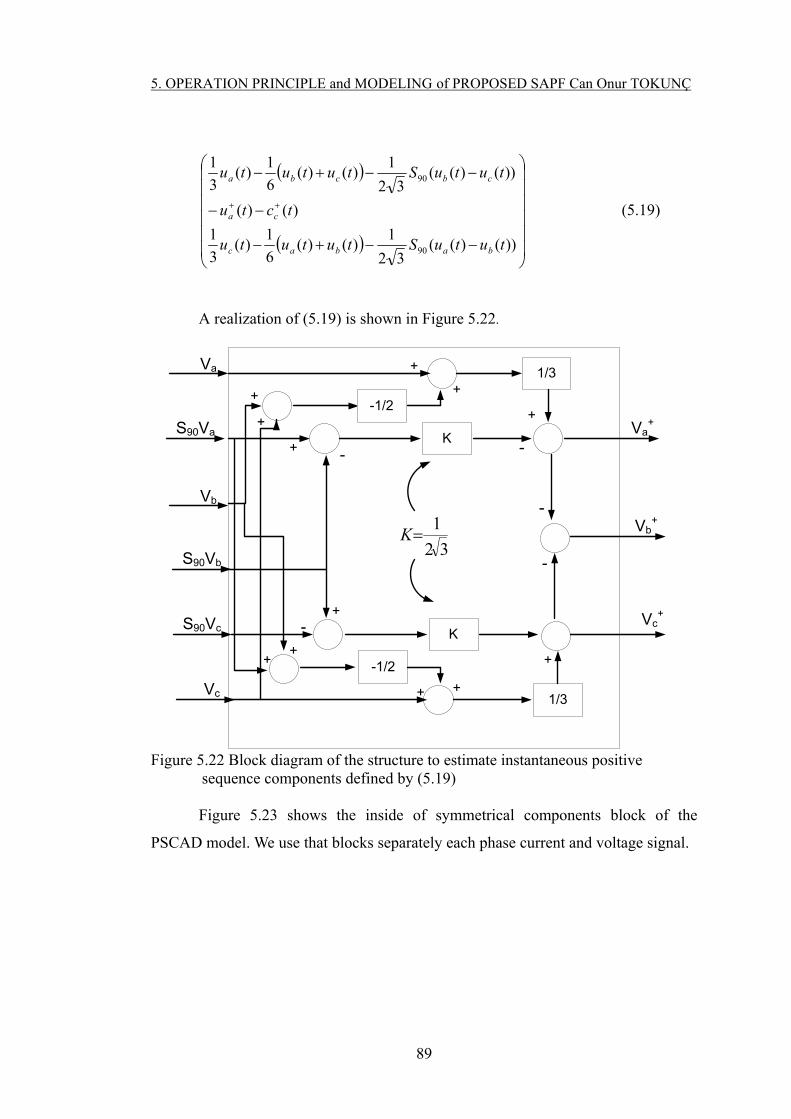
5. OPERATION PRINCIPLE and MODELING of PROPOSED SAPF Can Onur TOKUNÇ
))()((32
1)()(
6
1)(
3
1
)()(
))()((32
1)()(
6
1)(
3
1
90
90
tutuStututu
tctu
tutuStututu
babac
ca
cbcba
(5.19)
A realization of (5.19) is shown in Figure 5.22.
-1/2
+ -
Va
S90Va
Vb
S90Vb
Vc
S90Vc
K
1/3+
++
+
-
+Va
+
-1/2
K
1/3+ +
+
+
-
++
-
-Vb
+
Vc+
32
1K
Figure 5.22 Block diagram of the structure to estimate instantaneous positive sequence components defined by (5.19)
Figure 5.23 shows the inside of symmetrical components block of the
PSCAD model. We use that blocks separately each phase current and voltage signal.
89

5. OPERATION PRINCIPLE and MODELING of PROPOSED SAPF Can Onur TOKUNÇ
A
B
B1
C1
C
Aplus
Aminus
D +
F
+
*-0.5
D +
F
+
*0.333
D -
F
+
*0.28
B
+
D -
B
+
D +
. Figure 5.23 Symmetrical Components Block of PSCAD model
5.3.1.3 Reactive Current Calculation Block
The instantaneous positive-sequence components of the voltage and current
signals are also extracted by the EPLL based system, described previously and
denoted by
(5.20)
)120(sin
)120(sin
sin
)(
tV
tV
tV
tv
)120(sin
)120(sin
)(sin
)(
tI
tI
tI
ti (5.21)
Where denotes the phase displacement between the corresponding voltage
and current positive-sequence components. The current fundamental component can
be decomposed into active and reactive fundamental components as
90
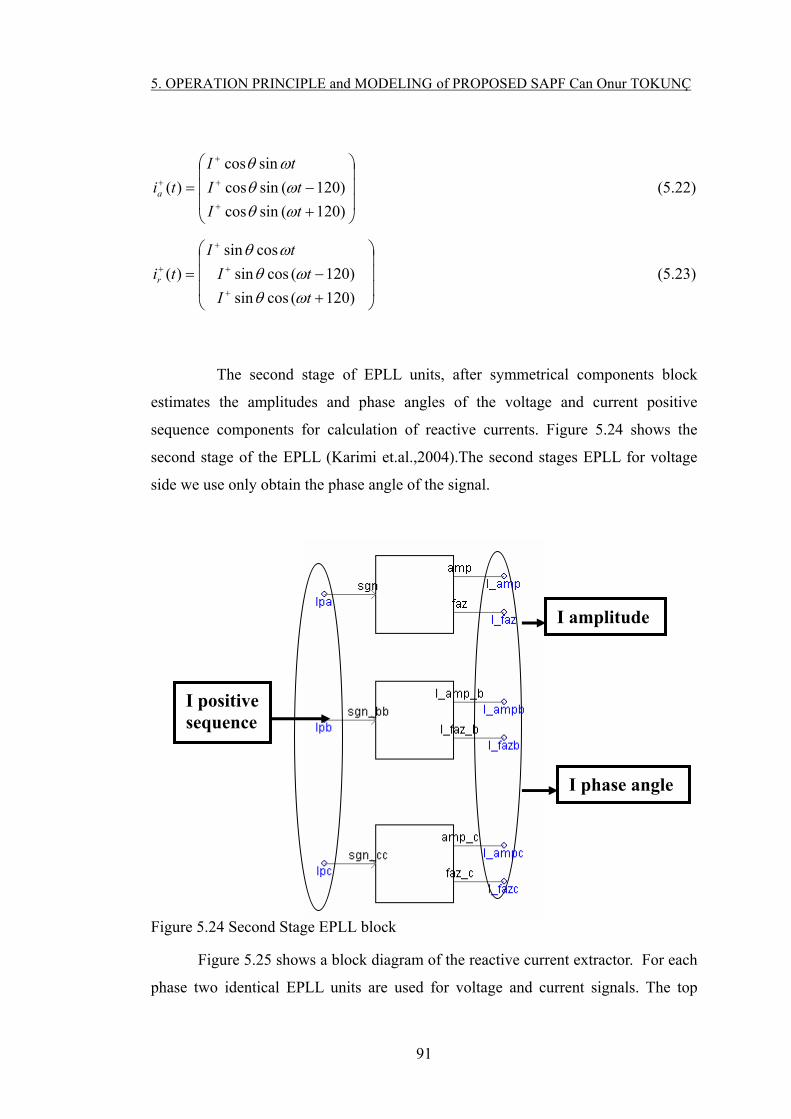
5. OPERATION PRINCIPLE and MODELING of PROPOSED SAPF Can Onur TOKUNÇ
)120(sincos
)120(sincos
sincos
)(
tI
tI
tI
tia
(5.22)
)120(cossin
)120(cossin
cossin
)(
tI
tI
tI
tir
(5.23)
The second stage of EPLL units, after symmetrical components block
estimates the amplitudes and phase angles of the voltage and current positive
sequence components for calculation of reactive currents. Figure 5.24 shows the
second stage of the EPLL (Karimi et.al.,2004).The second stages EPLL for voltage
side we use only obtain the phase angle of the signal.
Figure 5.24 Second Stage EPLL block
Figure 5.25 shows a block diagram of the reactive current extractor. For each
phase two identical EPLL units are used for voltage and current signals. The top
I positive sequence
I amplitude
I phase angle
91

5. OPERATION PRINCIPLE and MODELING of PROPOSED SAPF Can Onur TOKUNÇ
portion of the unit is used for voltage and the bottom portion is used for current
signal processing. The link between the two parts is to calculate the fundamental
reactive current component.
Figure 5.25 Block diagram of the reactive current extraction unit
Let i(t)=if(t)+ ih(t) denote the distorted load current where represents its
fundamental component which is extracted by another EPLL unit. Signal ih(t)
represents the total distortions of the current signal. The amplitude and phase angle
of the fundamental component of the current signal are also made available
at the outputs of the unit.
The fundamental component if(t)of the current signal i(t) can be written as
)()()sin()( 1 titiIti fr
fai
f (5.24)
Where ifa(t) and ifr(t) represent active and reactive components of and
expressed as
)sin()cos()( 1 vvi
fa Iti (5.25)
)cos)sin()( 1 vvif
r Iti (5.26)
92
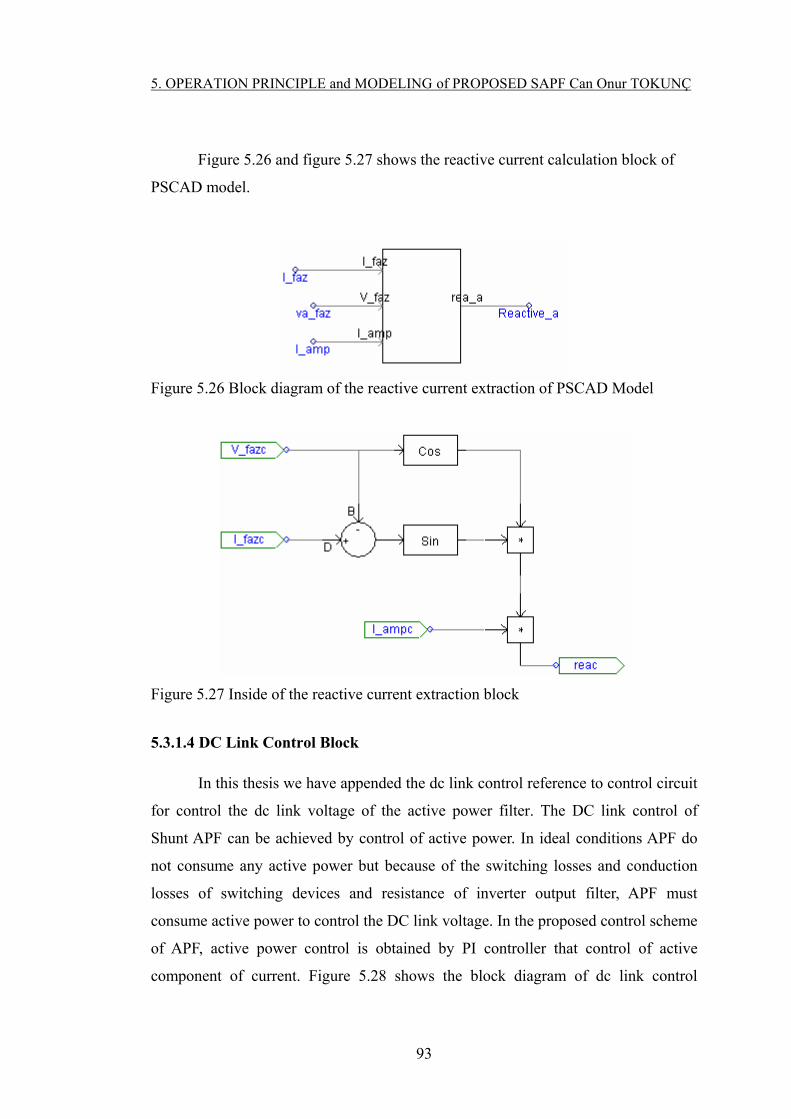
5. OPERATION PRINCIPLE and MODELING of PROPOSED SAPF Can Onur TOKUNÇ
Figure 5.26 and figure 5.27 shows the reactive current calculation block of
PSCAD model.
Figure 5.26 Block diagram of the reactive current extraction of PSCAD Model
Figure 5.27 Inside of the reactive current extraction block
5.3.1.4 DC Link Control Block
In this thesis we have appended the dc link control reference to control circuit
for control the dc link voltage of the active power filter. The DC link control of
Shunt APF can be achieved by control of active power. In ideal conditions APF do
not consume any active power but because of the switching losses and conduction
losses of switching devices and resistance of inverter output filter, APF must
consume active power to control the DC link voltage. In the proposed control scheme
of APF, active power control is obtained by PI controller that control of active
component of current. Figure 5.28 shows the block diagram of dc link control
93

5. OPERATION PRINCIPLE and MODELING of PROPOSED SAPF Can Onur TOKUNÇ
scheme. The D.C voltage across the capacitor is measured compared with reference
and the error is processed in a PI controller. This error multiplies fixed amplitude
which is pure and is in 180o phase with the source. The product forms one component
of the current reference signal. The second stage EPLL block is used for extract
voltage phase angle for each phase. Figure 5.29 shows the PSCAD block of dc link
control scheme. Figure 5.30 shows the inside of this block. Finally after we generate
dc link control signal, we add this signal to reference signal.
Figure 5.28 Block diagram of the DC link control
Figure 5.29 DC link control block of PSCAD Model
94
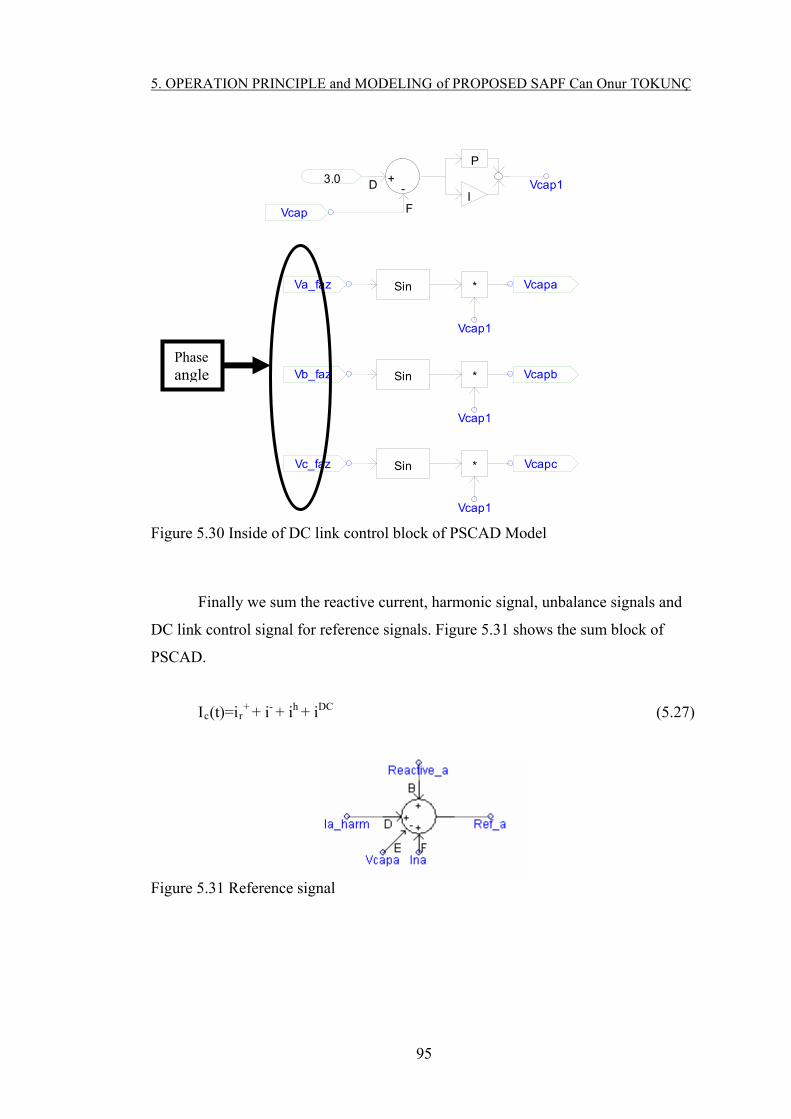
5. OPERATION PRINCIPLE and MODELING of PROPOSED SAPF Can Onur TOKUNÇ
Vcap
Va_faz
Vb_faz
Vc_faz
Vcapa
Vcapb
Vcapc
D +
F
- Vcap1
Sin *
Vcap1
Sin
Vcap1
*
Sin *
I
P
3.0
Vcap1
Phase angle
Figure 5.30 Inside of DC link control block of PSCAD Model
Finally we sum the reactive current, harmonic signal, unbalance signals and
DC link control signal for reference signals. Figure 5.31 shows the sum block of
PSCAD.
Ic(t)=ir+ + i- + ih + iDC (5.27)
Figure 5.31 Reference signal
95
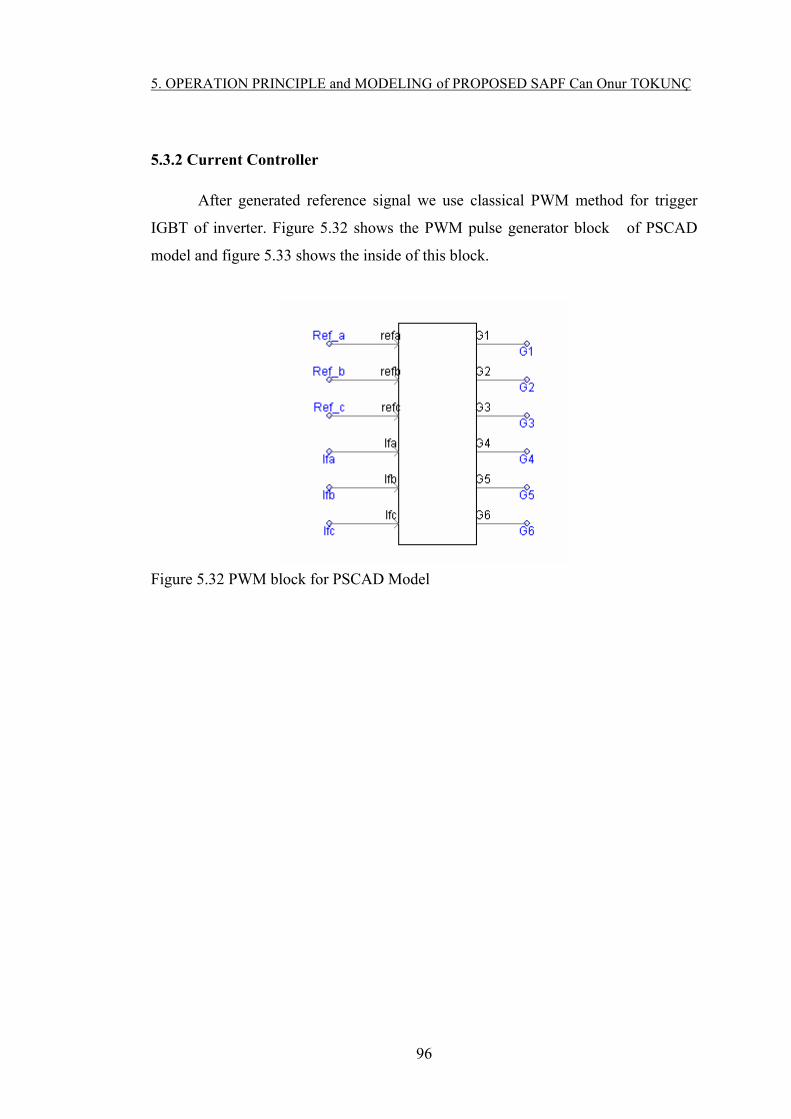
5. OPERATION PRINCIPLE and MODELING of PROPOSED SAPF Can Onur TOKUNÇ
5.3.2 Current Controller
After generated reference signal we use classical PWM method for trigger
IGBT of inverter. Figure 5.32 shows the PWM pulse generator block of PSCAD
model and figure 5.33 shows the inside of this block.
Figure 5.32 PWM block for PSCAD Model
96
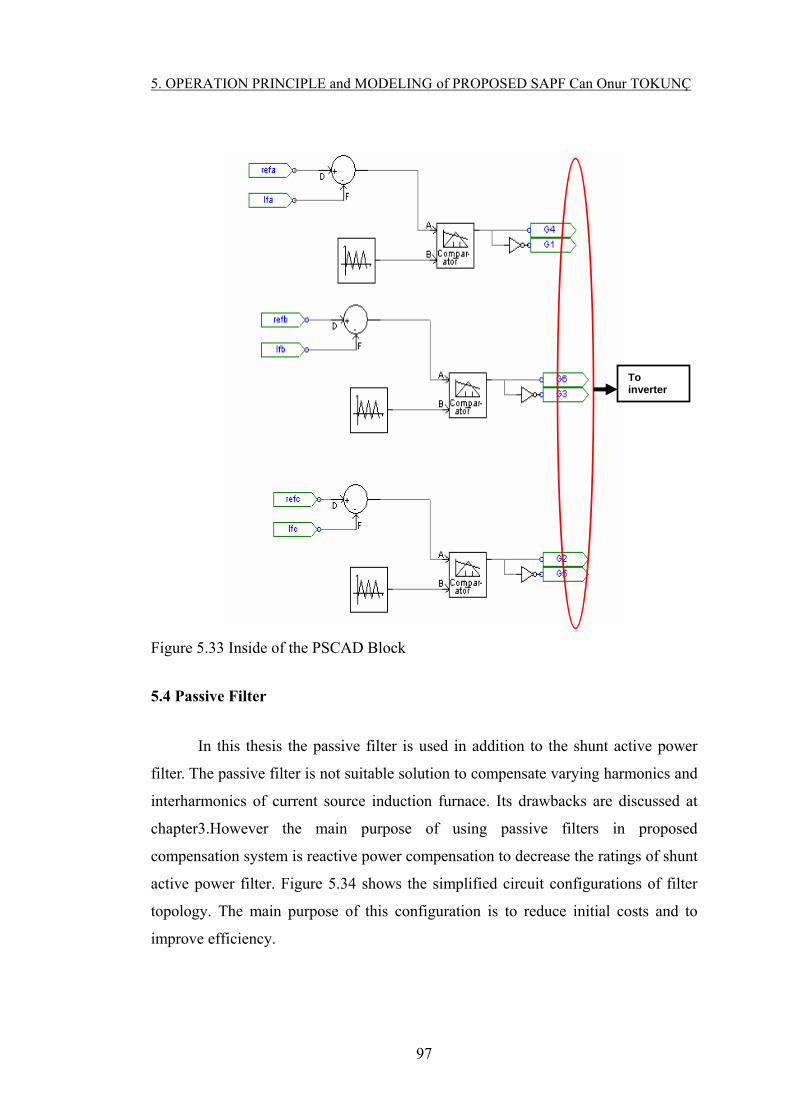
5. OPERATION PRINCIPLE and MODELING of PROPOSED SAPF Can Onur TOKUNÇ
Figure 5.33 Inside of the PSCAD Block
5.4 Passive Filter
In this thesis the passive filter is used in addition to the shunt active power
filter. The passive filter is not suitable solution to compensate varying harmonics and
interharmonics of current source induction furnace. Its drawbacks are discussed at
chapter3.However the main purpose of using passive filters in proposed
compensation system is reactive power compensation to decrease the ratings of shunt
active power filter. Figure 5.34 shows the simplified circuit configurations of filter
topology. The main purpose of this configuration is to reduce initial costs and to
improve efficiency.
To inverter
97

5. OPERATION PRINCIPLE and MODELING of PROPOSED SAPF Can Onur TOKUNÇ
Figure 5.34 Combination of shunt active filter and passive filter
Our passive filter is only designed to compensate the reactive power. Because
of induction furnace operation principle, the current harmonics is not taken into
account If only one filter is used; it is usually tuned at the lowest characteristic
harmonic. In this case, this would be the 5th harmonic. Thus, 4 - step reactive power
compensation system is designed with detuned passive filters. Detuned passive filters
are set to 215 Hz to shift the resonance point of system below the furnace operating
spectrum because the proposed current source induction furnace is operating between
150 and 300 Hz and produces harmonics and interharmonics between 250 and 600
Hz.. Figure 5.35 shows the passive filter models of PSCAD.
98
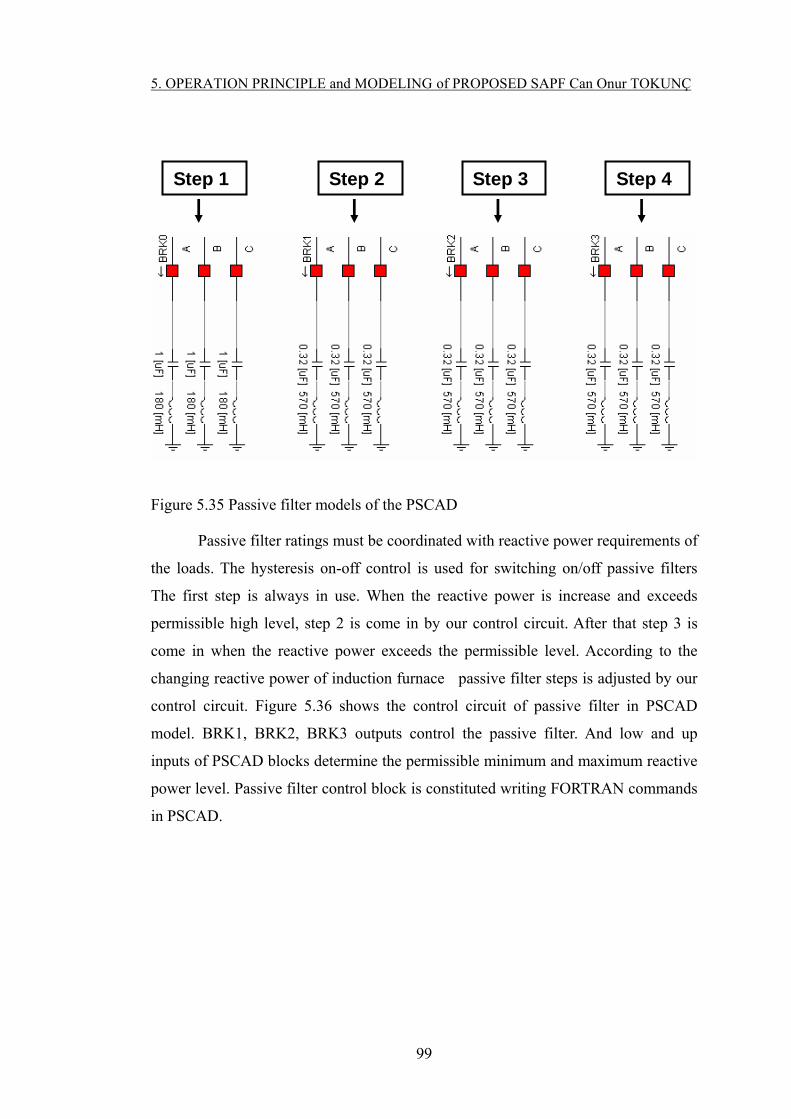
5. OPERATION PRINCIPLE and MODELING of PROPOSED SAPF Can Onur TOKUNÇ
Step 1 Step 2 Step 3 Step 4
Figure 5.35 Passive filter models of the PSCAD
Passive filter ratings must be coordinated with reactive power requirements of
the loads. The hysteresis on-off control is used for switching on/off passive filters
The first step is always in use. When the reactive power is increase and exceeds
permissible high level, step 2 is come in by our control circuit. After that step 3 is
come in when the reactive power exceeds the permissible level. According to the
changing reactive power of induction furnace passive filter steps is adjusted by our
control circuit. Figure 5.36 shows the control circuit of passive filter in PSCAD
model. BRK1, BRK2, BRK3 outputs control the passive filter. And low and up
inputs of PSCAD blocks determine the permissible minimum and maximum reactive
power level. Passive filter control block is constituted writing FORTRAN commands
in PSCAD.
99

5. OPERATION PRINCIPLE and MODELING of PROPOSED SAPF Can Onur TOKUNÇ
Figure 5.36 Passive filter control block of the PSCAD
While we determine the passive filter reactor impedance and capacitive
impedance value we can use those formulas;
CC
X
VQ
2
(5.28)
CfLjXc
.2
1
(5.29)
LCFR
2
1 (5.30)
Where;
Qc = Capacitive power which gives to line
V = Nominal line voltage
Xc = Capacitive impedance which connects to line
FL= Line frequency
100
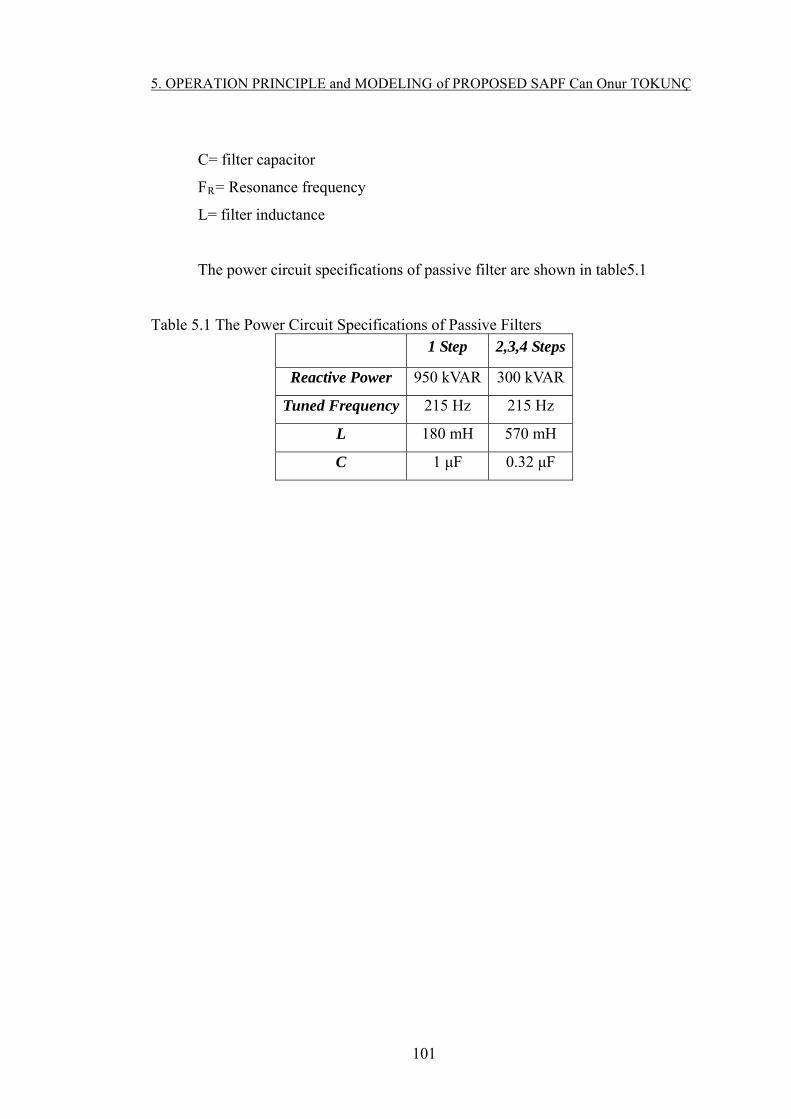
5. OPERATION PRINCIPLE and MODELING of PROPOSED SAPF Can Onur TOKUNÇ
101
C= filter capacitor
FR= Resonance frequency
L= filter inductance
The power circuit specifications of passive filter are shown in table5.1
Table 5.1 The Power Circuit Specifications of Passive Filters 1 Step 2,3,4 Steps
Reactive Power 950 kVAR 300 kVAR
Tuned Frequency 215 Hz 215 Hz
L 180 mH 570 mH
C 1 μF 0.32 μF

5. OPERATION PRINCIPLE and MODELING of PROPOSED SAPF Can Onur TOKUNÇ
102

6. CASE STUDIES AND DISCUSSIONS Can Onur TOKUNÇ
6. CASE STUDIES AND DISCUSSIONS
In chapter 4 of thesis the simulation results of furnace which indicates the
operating and power quality problems of furnace are presented. In this section of the
thesis, simulation results of proposed compensation system which solves the power
quality problems of current source induction furnace are introduced and the
performance of the system is investigated with three different case studies. In the
case studies, the current source induction furnace operates as the same scenario in the
Chapter 4.
In first case, power quality problems of current source induction furnace is
compensated with shunt APF and passive filter.In the second case power quality
problems of current source induction furnace is compensated only with shunt APF.In
the third case the power quality problems of induction furnace is compansated only
with shunt APF. In the third case the control system of the shunt APF extracts only
harmonics content.There is no reactive power compensation in the third case. The
power circuit of proposed power quality compensation system and current source
induction furnace is shown in figure 6.1.
103
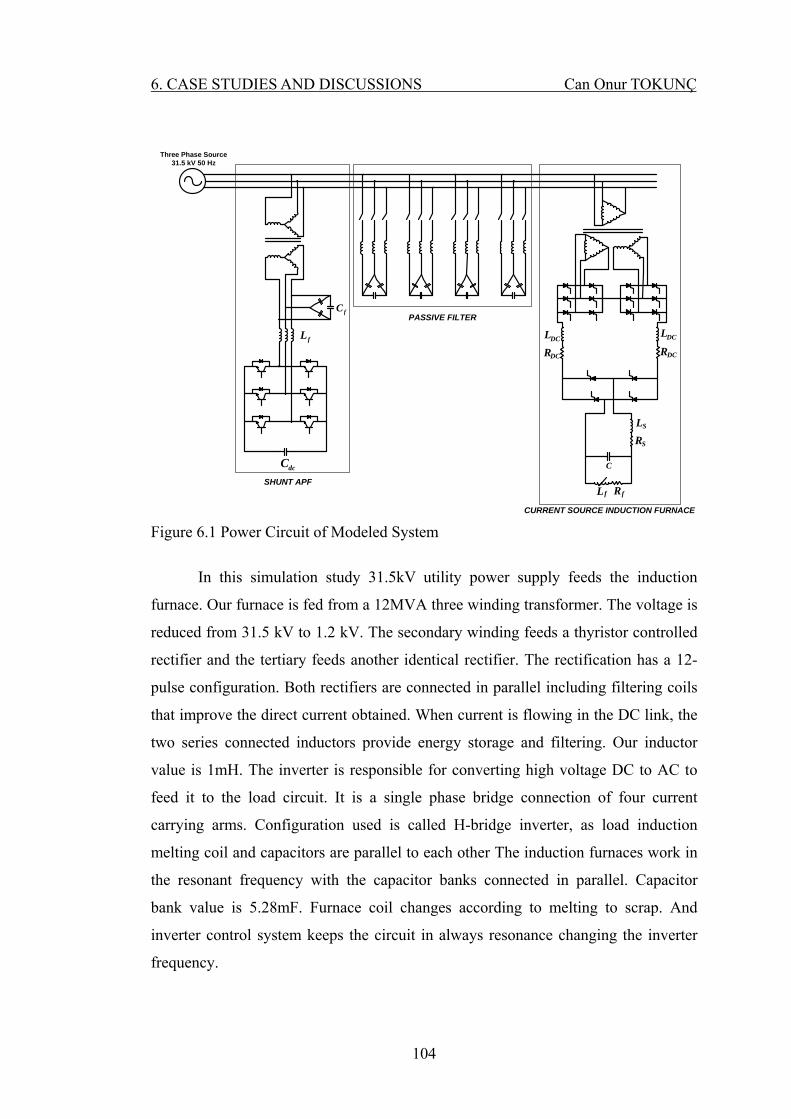
6. CASE STUDIES AND DISCUSSIONS Can Onur TOKUNÇ
fC
fL
dcC
SHUNT APF
PASSIVE FILTER
CURRENT SOURCE INDUCTION FURNACE
fRfL
C
SR
DCLDCL
DCRDCR
Three Phase Source31.5 kV 50 Hz
SL
Figure 6.1 Power Circuit of Modeled System
In this simulation study 31.5kV utility power supply feeds the induction
furnace. Our furnace is fed from a 12MVA three winding transformer. The voltage is
reduced from 31.5 kV to 1.2 kV. The secondary winding feeds a thyristor controlled
rectifier and the tertiary feeds another identical rectifier. The rectification has a 12-
pulse configuration. Both rectifiers are connected in parallel including filtering coils
that improve the direct current obtained. When current is flowing in the DC link, the
two series connected inductors provide energy storage and filtering. Our inductor
value is 1mH. The inverter is responsible for converting high voltage DC to AC to
feed it to the load circuit. It is a single phase bridge connection of four current
carrying arms. Configuration used is called H-bridge inverter, as load induction
melting coil and capacitors are parallel to each other The induction furnaces work in
the resonant frequency with the capacitor banks connected in parallel. Capacitor
bank value is 5.28mF. Furnace coil changes according to melting to scrap. And
inverter control system keeps the circuit in always resonance changing the inverter
frequency.
104
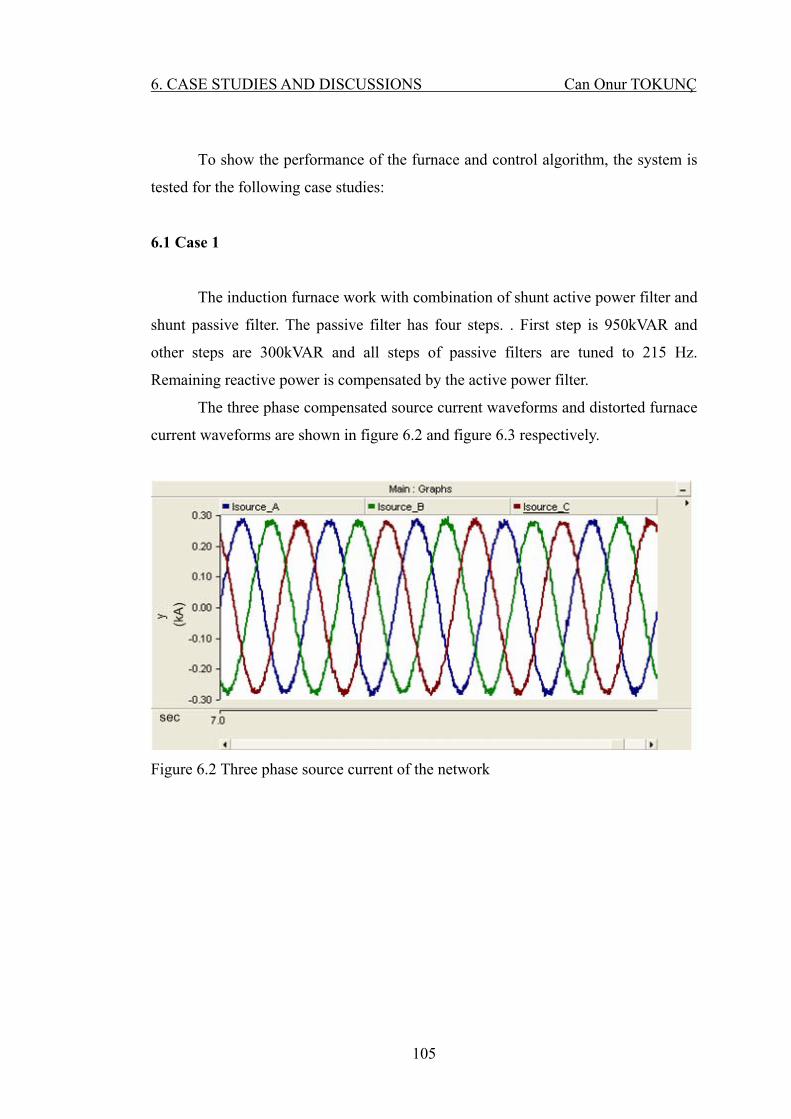
6. CASE STUDIES AND DISCUSSIONS Can Onur TOKUNÇ
To show the performance of the furnace and control algorithm, the system is
tested for the following case studies:
6.1 Case 1
The induction furnace work with combination of shunt active power filter and
shunt passive filter. The passive filter has four steps. . First step is 950kVAR and
other steps are 300kVAR and all steps of passive filters are tuned to 215 Hz.
Remaining reactive power is compensated by the active power filter.
The three phase compensated source current waveforms and distorted furnace
current waveforms are shown in figure 6.2 and figure 6.3 respectively.
Figure 6.2 Three phase source current of the network
105
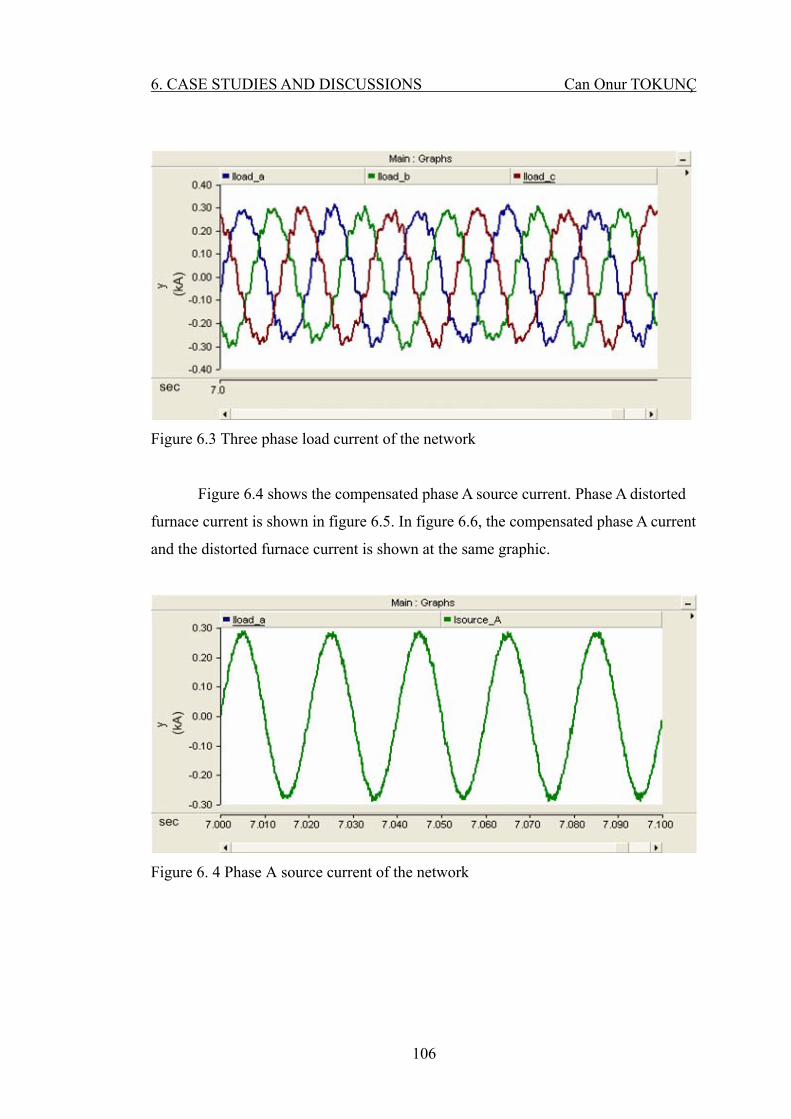
6. CASE STUDIES AND DISCUSSIONS Can Onur TOKUNÇ
Figure 6.3 Three phase load current of the network
Figure 6.4 shows the compensated phase A source current. Phase A distorted
furnace current is shown in figure 6.5. In figure 6.6, the compensated phase A current
and the distorted furnace current is shown at the same graphic.
Figure 6. 4 Phase A source current of the network
106

6. CASE STUDIES AND DISCUSSIONS Can Onur TOKUNÇ
Figure 6.5 Phase A load current of the network
Figure 6.6 Phase A load and source current of the network
Three phase source voltage is shown in figure 6.7 and phase A source voltage
is shown in figure 6.8.It is clearly seen that there is no distortion in the voltage
waveforms.
107

6. CASE STUDIES AND DISCUSSIONS Can Onur TOKUNÇ
Figure 6.7 Three phase source voltage of the network
Figure 6.8 Phase A source voltage of the network
The trend of load current THD is changed between 10% and 15% as shown in
Figure 6.9 and shunt APF decreases the source current THD below 4% as shown in
Figure 6.10.
108

6. CASE STUDIES AND DISCUSSIONS Can Onur TOKUNÇ
Figure 6.9 Total Harmonic Distortion of load current of the network
Figure 6.10 Total Harmonic Distortion of source current of the network
The DC link capacitor voltage is set to 3000V and its trend is shown in Figure
6.11.
109

6. CASE STUDIES AND DISCUSSIONS Can Onur TOKUNÇ
Figure 6.11 The DC Link voltage of the Active power filter
The trend of reactive power consumed by load, the connection point of
passive filter point and the connection point of shunt APF is shown in Figure 6.12 As
shown in figure 6.12, the reactive power of furnace increases up to 2.25MVAR with
the increase of operating frequency of furnace. It is shown that passive filters
compensate the one part of the reactive power and the other part of the reactive
power is compensated by shunt APF.
Figure 6.12 The reactive power of the source and load waveform
110

6. CASE STUDIES AND DISCUSSIONS Can Onur TOKUNÇ
The rms trend of injected current of APF is shown in figure 6.13 and figure
6.14. The Shunt APF injects approximately between 20A and 25A from 31.5kV side
of transformer. The 1 kV side of the transformer approximately 600A is injected by
the shunt active power filter.
Figure 6.13 The Secondary side injected current RMS value of APF
Figure 6.14 The Primary side injected current RMS value of APF
111

6. CASE STUDIES AND DISCUSSIONS Can Onur TOKUNÇ
The figure 6.15, figure 6.16 and figure 6.17 shows the simulation results of
EPLL used in Shunt APF. The load current measurement in figure 6.15 is applied to
the input of EPLL and EPLL creates the fundamental components of input signal in
figure 6.17 and harmonic components of input signal in figure 6.16.
Figure 6.15 Input signal of EPLL circuit
Figure 6.16 Error signal calculated by EPLL
112
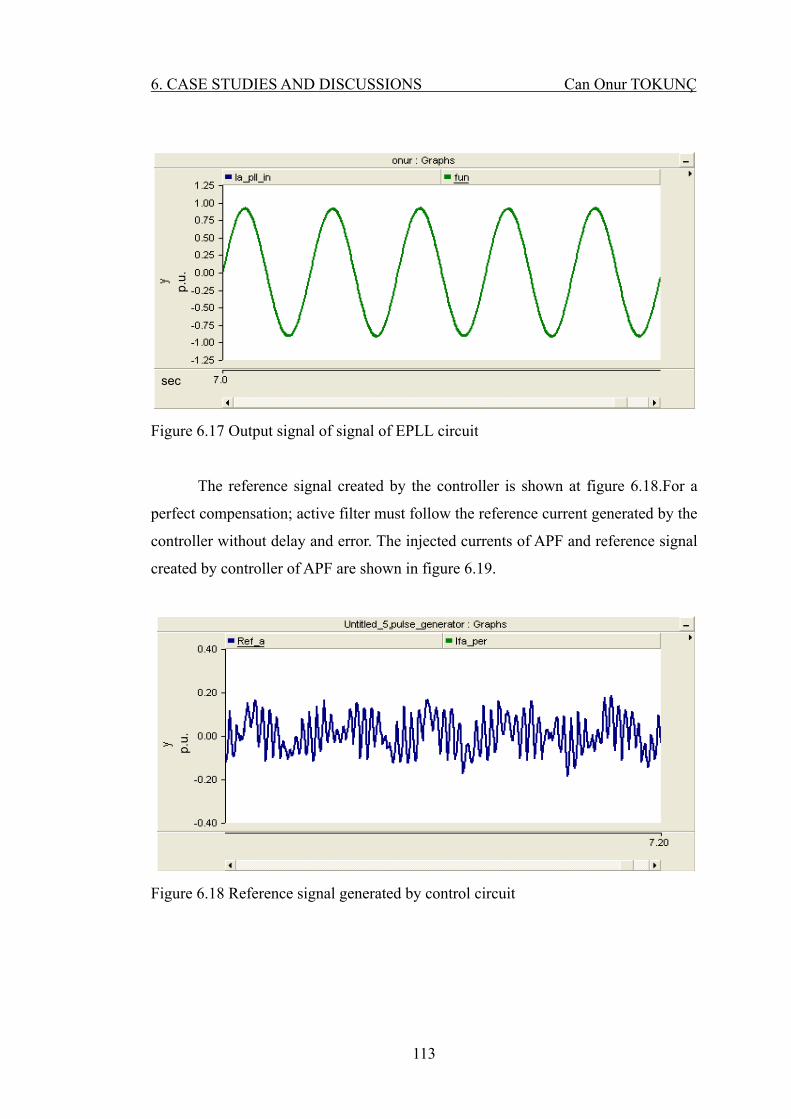
6. CASE STUDIES AND DISCUSSIONS Can Onur TOKUNÇ
sec
p.u
.
Figure 6.17 Output signal of signal of EPLL circuit
The reference signal created by the controller is shown at figure 6.18.For a
perfect compensation; active filter must follow the reference current generated by the
controller without delay and error. The injected currents of APF and reference signal
created by controller of APF are shown in figure 6.19.
p.u.
Figure 6.18 Reference signal generated by control circuit
113
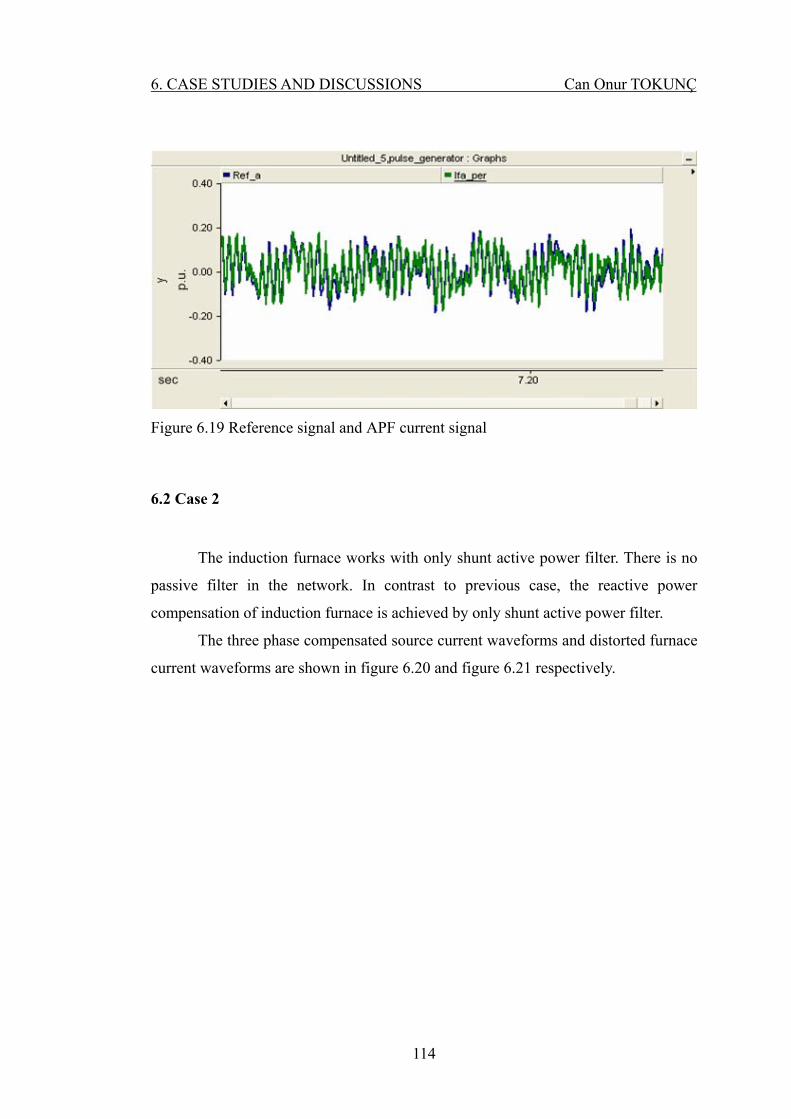
6. CASE STUDIES AND DISCUSSIONS Can Onur TOKUNÇ
Figure 6.19 Reference signal and APF current signal
6.2 Case 2
The induction furnace works with only shunt active power filter. There is no
passive filter in the network. In contrast to previous case, the reactive power
compensation of induction furnace is achieved by only shunt active power filter.
The three phase compensated source current waveforms and distorted furnace
current waveforms are shown in figure 6.20 and figure 6.21 respectively.
114
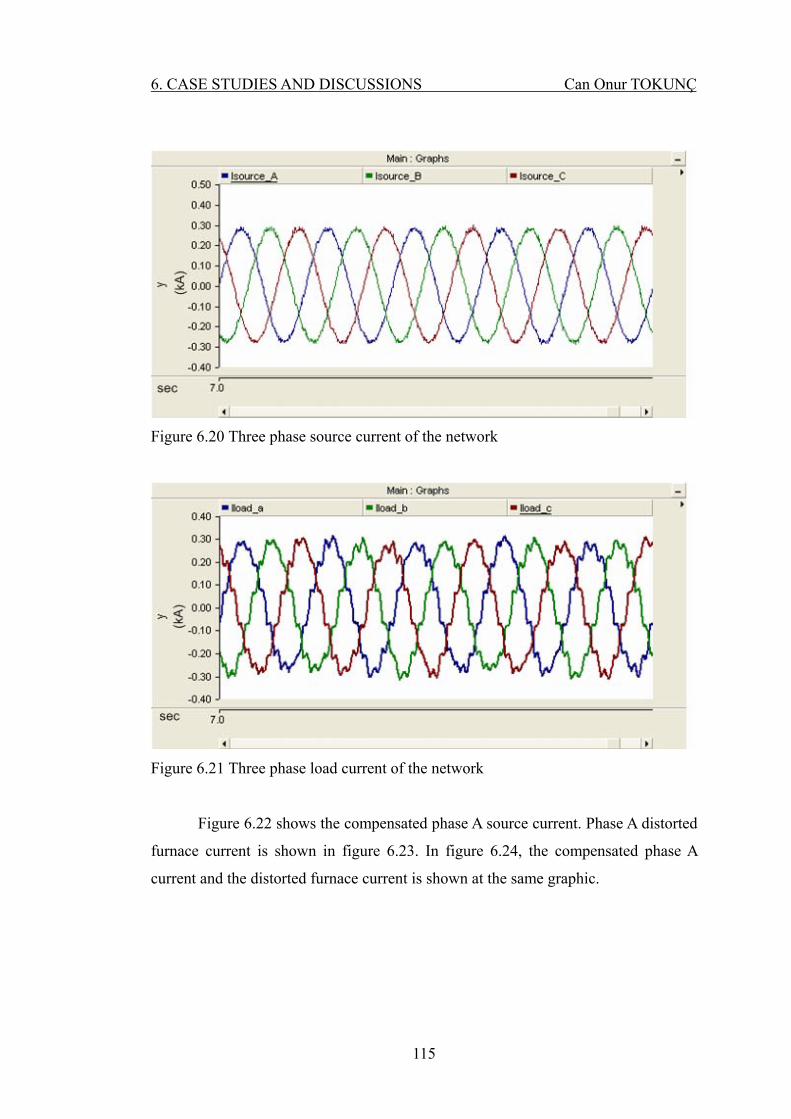
6. CASE STUDIES AND DISCUSSIONS Can Onur TOKUNÇ
Figure 6.20 Three phase source current of the network
Figure 6.21 Three phase load current of the network
Figure 6.22 shows the compensated phase A source current. Phase A distorted
furnace current is shown in figure 6.23. In figure 6.24, the compensated phase A
current and the distorted furnace current is shown at the same graphic.
115
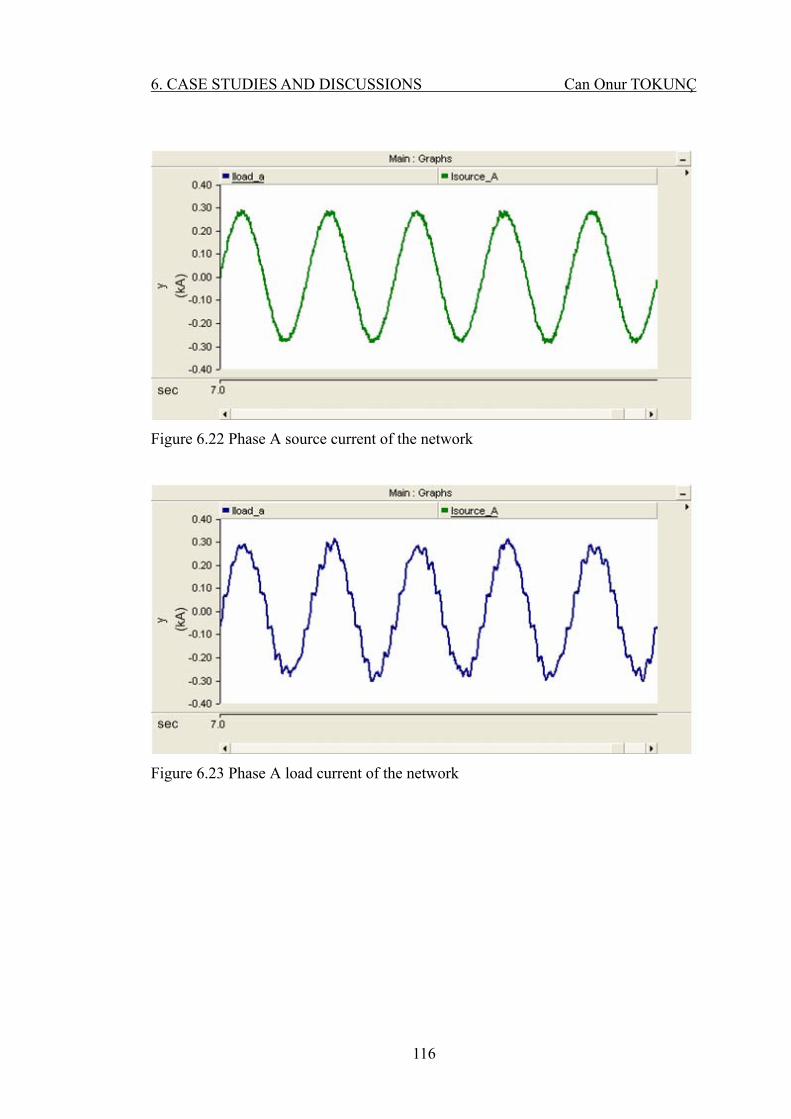
6. CASE STUDIES AND DISCUSSIONS Can Onur TOKUNÇ
Figure 6.22 Phase A source current of the network
Figure 6.23 Phase A load current of the network
116

6. CASE STUDIES AND DISCUSSIONS Can Onur TOKUNÇ
Figure 6.24 Phase A load and source current of the network
Three phase source voltage is shown in figure 6.25 and phase A source
voltage is shown in figure 6.26. It is clearly seen that there is no distortion in the
voltage waveforms.
Figure 6.25 Three phase source current of the network
117

6. CASE STUDIES AND DISCUSSIONS Can Onur TOKUNÇ
Figure 6.26 Phase A source voltage of the network
Again as the previous case, the trend of load current THD is changed
between 10% and 20% as shown in figure 6.27 and Shunt APF decreases the source
current THD below 4% as shown in figure 6.28.
Figure 6.27 Total Harmonic Distortion of load current of the network
118
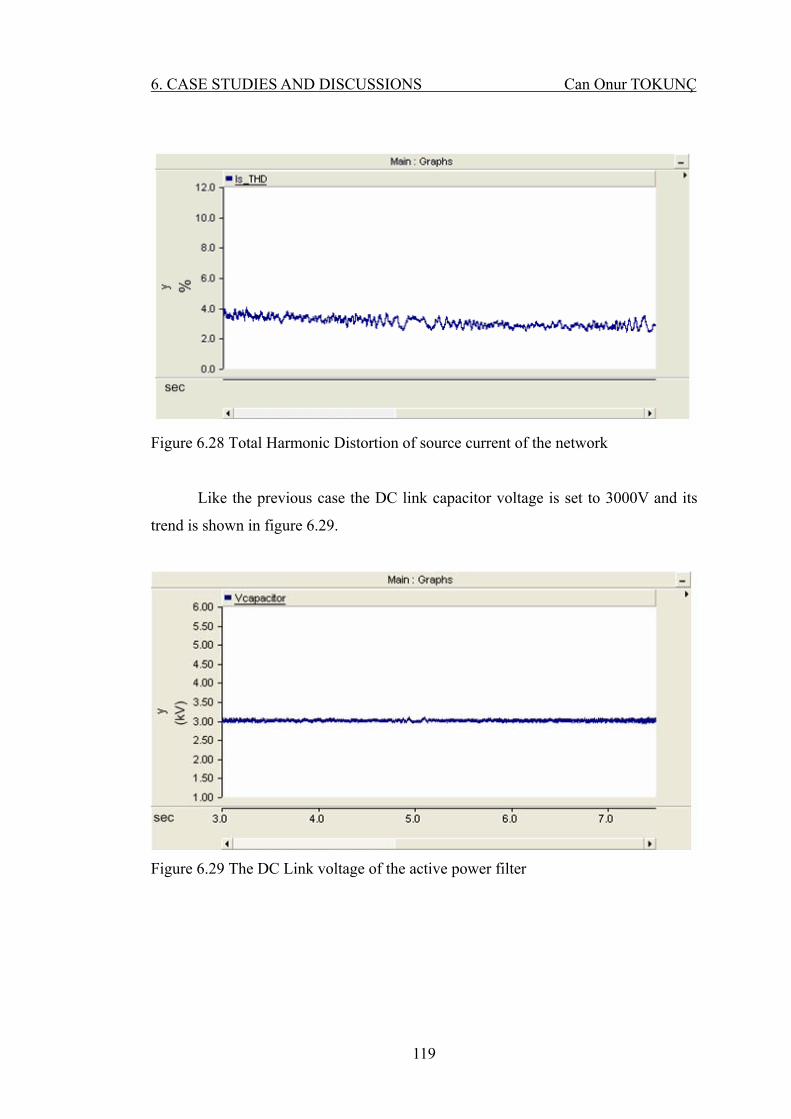
6. CASE STUDIES AND DISCUSSIONS Can Onur TOKUNÇ
Figure 6.28 Total Harmonic Distortion of source current of the network
Like the previous case the DC link capacitor voltage is set to 3000V and its
trend is shown in figure 6.29.
Figure 6.29 The DC Link voltage of the active power filter
119

6. CASE STUDIES AND DISCUSSIONS Can Onur TOKUNÇ
As shown in figure 6.30, the reactive power of furnace increases up to 2.25
MVAR with the increase of operating frequency of furnace and the Shunt APF
compensates the reactive power of furnace and nearly no reactive power is consumed
from utility as shown in figure 6.30.
Figure 6.30 The reactive power of the source and load waveform
The rms trend of injected current of APF is shown in figure 6.31 and figure
6.32. The Shunt APF injects approximately between 30A and 45A from 31.5kV side
of transformer. The 1 kV side of the transformer approximately between 900A and
1200A is injected by the shunt active power filter. It is obviously seen that the
injected current of APF is higher than the previous case. Because reactive power
compensation is achieved by shunt active power filter.
120

6. CASE STUDIES AND DISCUSSIONS Can Onur TOKUNÇ
Figure 6.31 The Secondary side injected current RMS value of APF
Figure 6.32 The Primary side injected current RMS value of APF
The figure 6.33, figure 6.34 and figure 6.35 shows the simulation results of
EPLL used in Shunt APF. The load current measurement in figure 6.33 is applied to
the input of EPLL and EPLL creates the fundamental components of input signal in
figure 6.35 and harmonic components of input signal in figure 6.34.
121

6. CASE STUDIES AND DISCUSSIONS Can Onur TOKUNÇ
Figure 6.33 Input signal of EPLL circuit
Figure 6.34 Error signal calculated by EPLL
122
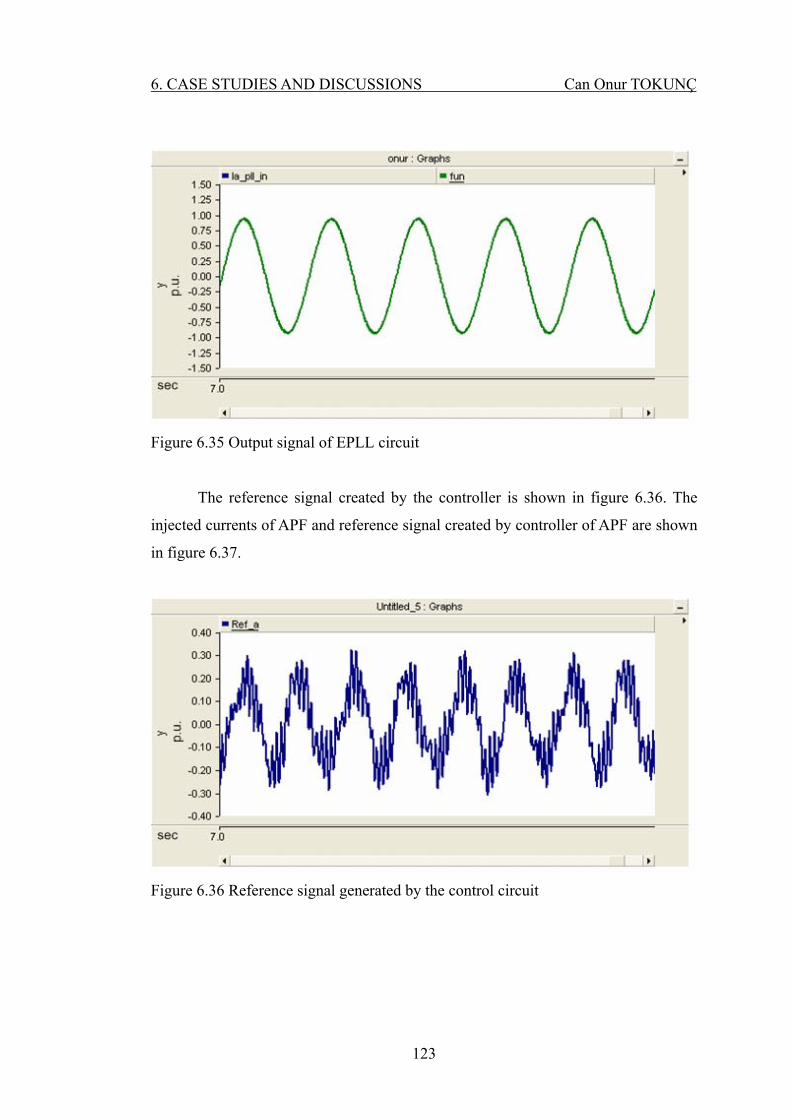
6. CASE STUDIES AND DISCUSSIONS Can Onur TOKUNÇ
Figure 6.35 Output signal of EPLL circuit
The reference signal created by the controller is shown in figure 6.36. The
injected currents of APF and reference signal created by controller of APF are shown
in figure 6.37.
Figure 6.36 Reference signal generated by the control circuit
123

6. CASE STUDIES AND DISCUSSIONS Can Onur TOKUNÇ
Figure 6.37 Reference signal and APF current signal
6.3 Case 3
The induction furnace works with only shunt active power filter. There is no
passive filter in the network. The active filter works to only compensate the harmonic
content. There is no reactive current control in the control circuit of the active power
filter.
The three phase compensated source current waveforms and distorted furnace
current waveforms are shown in figure 6.38 and figure 6.39 respectively.
Figure 6.38 Three phase source current of the network
124
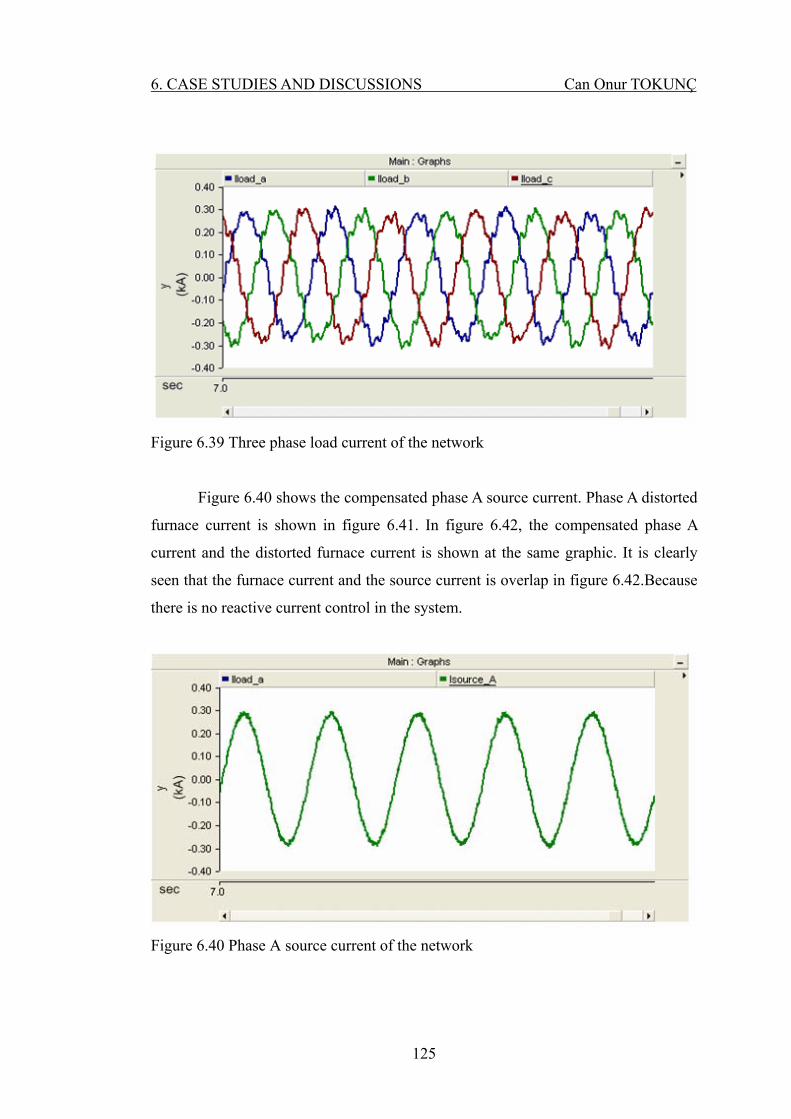
6. CASE STUDIES AND DISCUSSIONS Can Onur TOKUNÇ
Figure 6.39 Three phase load current of the network
Figure 6.40 shows the compensated phase A source current. Phase A distorted
furnace current is shown in figure 6.41. In figure 6.42, the compensated phase A
current and the distorted furnace current is shown at the same graphic. It is clearly
seen that the furnace current and the source current is overlap in figure 6.42.Because
there is no reactive current control in the system.
Figure 6.40 Phase A source current of the network
125

6. CASE STUDIES AND DISCUSSIONS Can Onur TOKUNÇ
Figure 6.41 Phase A load current of the network
Figure 6.42 Phase A load and source current of the network
Three phase source voltage is shown in figure 6.43 and phase A source
voltage is shown in figure 6.44. It is clearly seen that there is no distortion in the
voltage waveforms.
126

6. CASE STUDIES AND DISCUSSIONS Can Onur TOKUNÇ
Figure 6.43 Three phase source voltage of the network
Figure 6.44 Phase A source voltage of the network
Like the previous cases, the trend of load current THD is changed between
10% and 20% as shown in figure 6.45 and Shunt APF decreases the source current
THD below 4% as shown in figure 6.46.
127
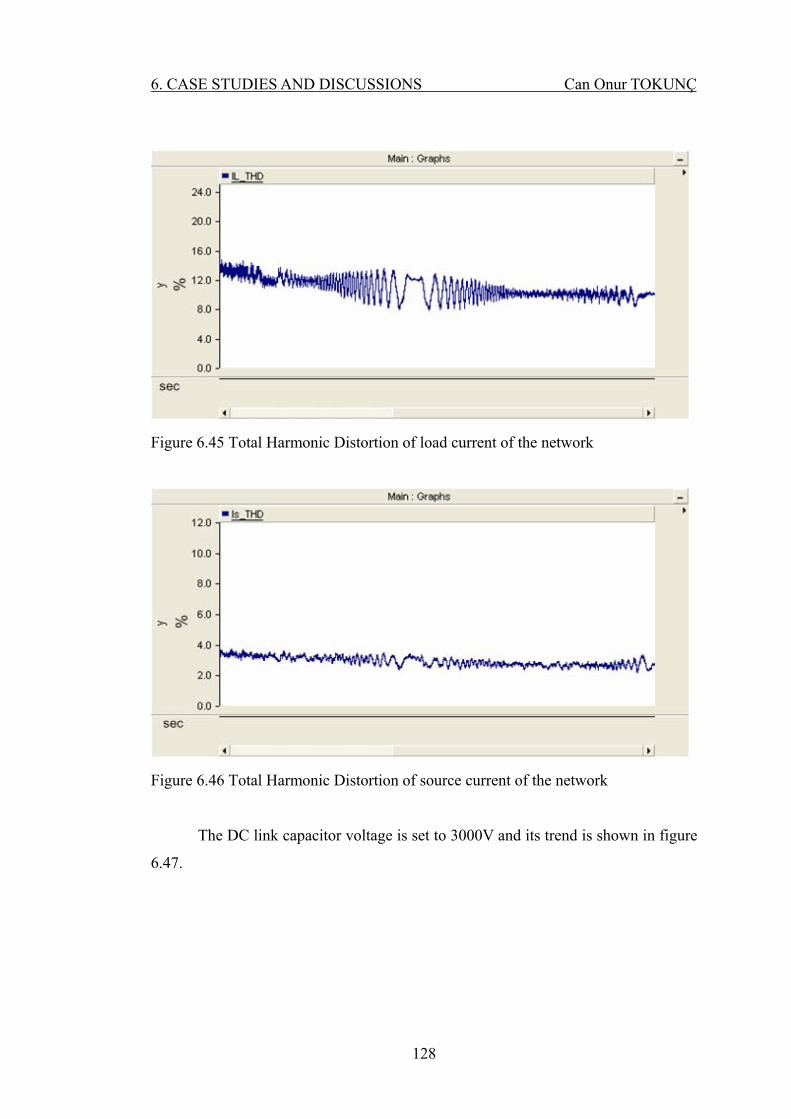
6. CASE STUDIES AND DISCUSSIONS Can Onur TOKUNÇ
Figure 6.45 Total Harmonic Distortion of load current of the network
Figure 6.46 Total Harmonic Distortion of source current of the network
The DC link capacitor voltage is set to 3000V and its trend is shown in figure
6.47.
128

6. CASE STUDIES AND DISCUSSIONS Can Onur TOKUNÇ
Figure 6.47 The DC Link voltage of the Active power filter
As shown in figure 6.48, the reactive power of furnace increases up to 2.25
MVAR with the increase of operating frequency of furnace. Because of the lack of
the reactive current control, reactive power of source increases in parallel to furnace.
Figure 6.48 The reactive power of the source and load waveform
The rms trend of injected current of APF is shown in figure 6.49 and figure
6.50. The Shunt APF injects approximately 20A from 31.5kV side of transformer.
129

6. CASE STUDIES AND DISCUSSIONS Can Onur TOKUNÇ
The 1 kV side of the transformer approximately 550A is injected by the shunt active
power filter. It is seen that first case injected current graphic resembles figure 49 and
figure 6.50.
Figure 6.49 The Secondary side injected current RMS value of APF
Figure 6.50 The Primary side injected current RMS value of APF
130
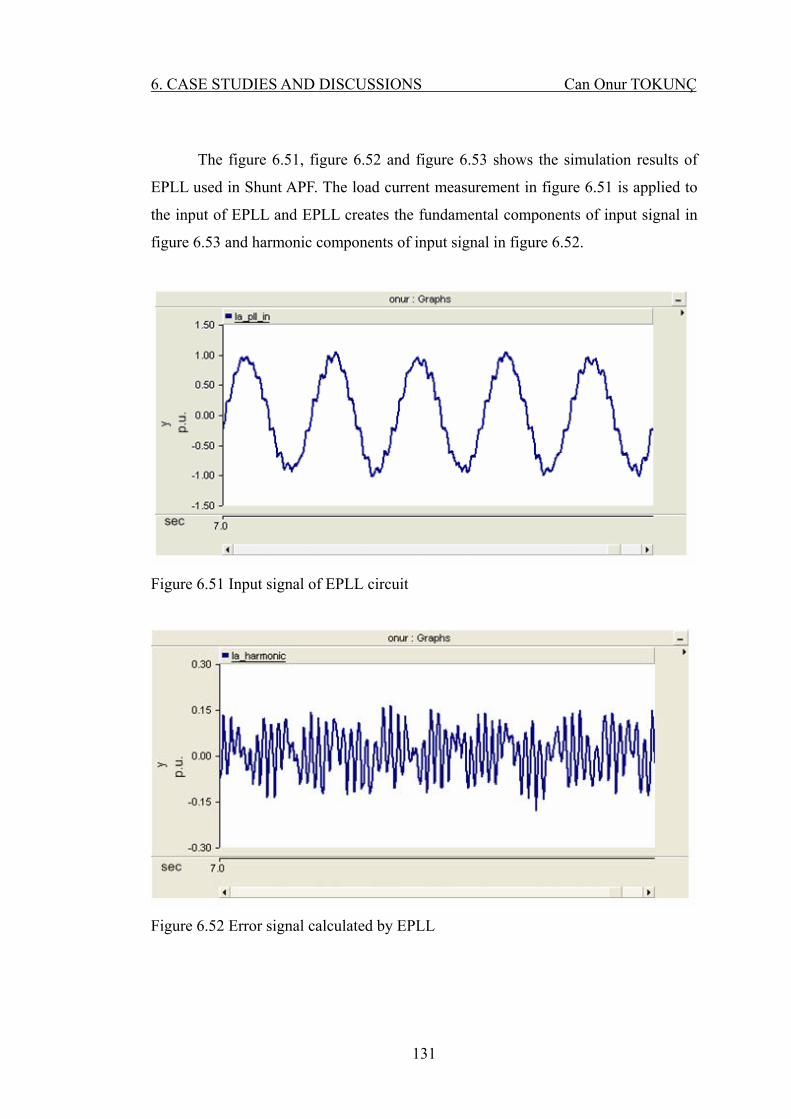
6. CASE STUDIES AND DISCUSSIONS Can Onur TOKUNÇ
The figure 6.51, figure 6.52 and figure 6.53 shows the simulation results of
EPLL used in Shunt APF. The load current measurement in figure 6.51 is applied to
the input of EPLL and EPLL creates the fundamental components of input signal in
figure 6.53 and harmonic components of input signal in figure 6.52.
Figure 6.51 Input signal of EPLL circuit
Figure 6.52 Error signal calculated by EPLL
131
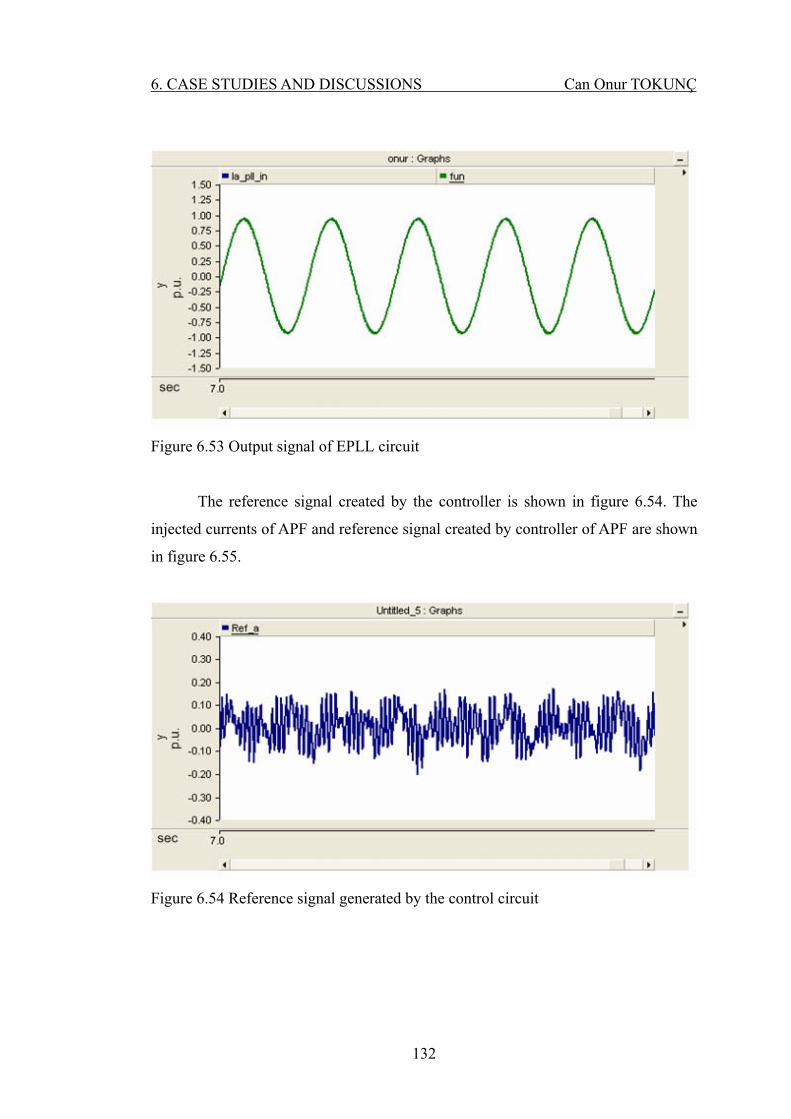
6. CASE STUDIES AND DISCUSSIONS Can Onur TOKUNÇ
Figure 6.53 Output signal of EPLL circuit
The reference signal created by the controller is shown in figure 6.54. The
injected currents of APF and reference signal created by controller of APF are shown
in figure 6.55.
Figure 6.54 Reference signal generated by the control circuit
132

6. CASE STUDIES AND DISCUSSIONS Can Onur TOKUNÇ
Figure 6.55 Reference signal and APF current signal
6.4 Discussions
In the chapter 4 of thesis, the operating principles and power quality problems
of current source induction furnace is presented clearly with simulation results. The
varying harmonics and interharmonics of induction furnace are indicated with a few
different operating frequency examples.
In the proposed power quality compensation system, shunt APF is capable of
both harmonic and reactive power compensation ability. However, passive filters are
used for reactive power compensation to decrease the power ratings of shunt APF.
In order to compare the case studies results achieved by power quality
compensation system, Table 6.1 shows the some quantities.
133

6. CASE STUDIES AND DISCUSSIONS Can Onur TOKUNÇ
Table 6.1 Performance comparisons among study cases Parameter Case 1 Case 2 Case 3
Furnace THD (%) 20-25 20-25 20-25
Source THD (%) 3 3 3
Power Rating of APF (MVA) 1.4 2.5 1.1
Compensated reactive power by APF(MVAR) 0.3 2.25 0
DC Link Voltage (kV) 3 3 3
H Bridge inverter frequency(Hz) 150-300 150-300 150-300
Simulation Time (s) 7.5 7.5 7.5
As shown from Table 6.1 the proposed Shunt APF can compensate easily the
varying harmonics and interharmonics and reactive power of current source
induction furnace without passive filters. The furnace current THD is decreased from
20-25% to below 4% and 2.25 MVAR rated reactive power of furnace is
compensated. . The rated power of Shunt APF is 2.5MVA for alone operation.
When the shunt APF and passive Filters operate together, shunt APF
compensates only the 0.3MVAR reactive power and the power rating of shunt APF
decreases to 1.4 MVA. The power ratings of APF are directly related to the
installation cost of APF.
On the other hand, the power circuit of proposed APF becomes inadequate for
the high power applications. Multilevel inverter topologies are preferred for high
power applications because of the capabilities of power electronic switching devices.
The THD level of source voltage is always kept below the standard limits by
using proposed control strategy without reactive current control. Without reactive
current control, the rated power of shunt APF is 1.1 MVA.
134

6. CASE STUDIES AND DISCUSSIONS Can Onur TOKUNÇ
In all cases the DC link voltage of the shunt APF is the set 3000V. The DC
link control circuit keeps the voltage desired level as shown table 6.1.
135

6. CASE STUDIES AND DISCUSSIONS Can Onur TOKUNÇ
136

7 CONCLUSIONS Can Onur TOKUNÇ
7. CONCLUSIONS
The aim of the thesis is to introduce the induction furnace system and develop
the power quality compensation system for current source coreless induction furnace.
The iron and steel market is large and set to grow further. Automotive,
household durables and machinery & equipment comprise the main sectors to trigger
this growth. The steel industry actively manages the use of energy. For this reason
the comprehensive literature research was carried out in order to introduce the iron
and steel industry to chapter two.
One of the most economic ways of producing steel is made through the use
of induction furnaces. Induction furnaces are most widely used type of furnace and
have become a quite popular choice for melting iron. The induction heating power
supply sends alternating current through the induction coil, which generates a
magnetic field. Induction furnaces work on the principle of a transformer. An
alternative electromagnetic field induces eddy currents in the metal which converts
the electric energy to heat without any physical contact between the induction coil
and the work piece. Induction furnace capacities range from less than one kilogram
to one hundred tones capacity. With increasing the capacity of Induction furnace
cause to draw larger currents from supply and that current also cause power quality
problems particularly weak distribution systems. Those furnaces are also major
contributors in the harmonic arena. In addition to the harmonics that are normally
expected from different pulse rectifiers large furnaces operating at a few hundred
hertz can generate significant non-characteristic harmonics. These harmonics, which
fluctuate with the frequency of the furnace resonant circuit, are usually not multiples
of the supply frequency, making them difficult to filter In chapter three induction
furnace operation principle is explained. Power quality problems generated by the
induction furnace in and their solution of major problems have been investigated by
inclusive survey. Power quality problems of current source induction furnaces are
very strange and there exist fewer researches on power quality problems on current
source induction furnaces.
137

7 CONCLUSIONS Can Onur TOKUNÇ
In chapter four of thesis the power quality problems of induction furnace is
clearly explained with the simulation results. In this chapter only the induction
furnace is connected to the network. Normal operation mode of furnace is simulated.
Our furnace operating frequency has changed between 150Hz and 300Hz.According
to melting iron the furnace operating frequency changes. The non characteristic
harmonic is observed to the 2f0±50 Hz frequency where f0 shows the induction
furnace operating frequency
As a result of the study on power quality problems of induction furnace a new
power quality conditioner has been proposed as a solution and it is introduced in
chapter five. The varying harmonics and interharmonics problem of induction
furnace are not solved with passive filter combinations or selective harmonics
elimination based APFs. In the proposed power quality system passive filter and
shunt APF combination is used. Such a combination with the passive filter makes it
possible to reduce the rating of the active filter. The main advantage of this
configuration is to reduce initial costs and to improve efficiency. Our passive filter is
only designed to compensate the reactive power. Passive filters are tuned below the
operating frequency of furnace to shift the resonance frequency of system. In order
to increase performance of active power filter enhanced phase loop lock (EPLL)
technique has been used to track distortion and generate reference signal for pulse
width modulator (PWM). Shunt APF has both harmonic and interharmonic
compensation and reactive power compensation ability.
The simulation has been performed under the carefully chosen four cases in
thirteen different conditions by using PSCAD/EMTDC to verify the performance and
operation of proposed model. The simulation results show that full reactive power
compensation, proper elimination of harmonics and control of the DC Link voltage
of the shunt active power filter is achieved. The current total harmonic distortion
values that have been obtained by simulation are in a very good level and less than
required standards. Using PSCAD/EMTDC as a simulation tool gives many
advantages and the most important advantages were rapid simulation response and
very easy operation due to visual quality.
138

7 CONCLUSIONS Can Onur TOKUNÇ
In the first case the combination of shunt active filter and shunt passive filter
was connected to the system. Connected passive filter consists of four levels. First
step compensates 950kVAR and other steps compensate 300kVAR reactive power.
All steps of passive filters are tuned to 215 Hz. Remaining reactive power is
compensated by the active power filter. The system harmonic, reactive current
compensation and DC link control of the active power filter has been achieved
satisfactorily, the total harmonic distortion is decreased approximately to
%3.5.Because of the reactive power compensation is made by the passive filter the
injected current size is acceptable level as shown chapter 6 table 6.1.
In the second case only the shunt active power filter is connected to the
network. All of the compensation is made by active filter. The system harmonic,
reactive current compensation and DC link control of the active power filter has been
achieved satisfactorily; the total harmonic distortion is decreased approximately to
%3.5.In this case all of the reactive power compensation was done by the shunt
active power filter.
In the third case the shunt active power filter is connected to the system and
control circuit of the active filter is set to compensate the harmonics and control the
DC link voltage of the active filter. There is no reactive power compensation in the
network. The system harmonic current compensation and DC link control of the
active power filter has been achieved satisfactorily.
Induction furnace is modeled in detail at first time in the literature. The
varying harmonics and interharmonics problem of induction furnace is presented
with simulation results. To solve these power quality problems, the shunt active
power filter with EPLL controller is proposed. Passive filter which is formed from 4
- step is designed for reactive power compensation to reduce the ratings of shunt
active power filter. Shunt active power filters and proposed power compensation
system is tested in three case studies. The simulation results show the ability and
success of compensation system for induction furnace. The main advantage of the
proposed control system extracts harmonic and reactive current components
independently; its structure is adaptive with respect to frequency. And also control
the DC link voltage of active power filter smoothly.
139

7 CONCLUSIONS Can Onur TOKUNÇ
140
Finally according to all literature research and simulation results, proposed
model is very suitable for implementation to 10 MVA induction furnace systems.

REFERENCES
AHMED M.M., MASOUD M., EL-SHARKAWY A.M., 2009, Design of a
Coreless Induction Furnace for Melting Iron, International Conference on
Communication, Computer and Power (ICCCP'09)
AL–SHAİKHLİ A.K.M., ABOUD A.A. , 2009, Stirring of Coreless Induction
Furnaces, Australian Journal of Basic and Applied Sciences, 3(3): 2926–
2934
AMERICAN IRON AND STEEL INDUSTRY INSTITUTE, 2005, A New
Roadmap for Transformation of Steelmaking Process
ANNEX I EXPERT GROUP, 2001. An Initial View on Methodologies for
Emission Baselines: Iron and Steel Case Study. Organization for Economic
Co-operation and Development 2001 International Energy Agency
ANONYMOUS, 2006. Iron and Steel Industry
ANONYMOUS, 2003. Overview of Iron And Steel Industry
ASIMINOAEI L., BLAABJERG. F. , HANSEN S.,2005, Evaluation of Harmonic
Detection Methods for Active Power Filter Applications, APEC 2005.
Twentieth Annual IEEE, 1:635-641
BALA K.C., 2005, Design Analysis of an Electric Induction Furnace for Melting
Aluminum Scrap, AU Journal of Technology, 9, 2:83-88
BAYINDIR, K.C., 2006. Modeling Of Custom Power Devices
BURCH R.F., 2008, Thoughts on Improving the Electric Arc Furnace Model,
IEEE Power and Energy Society General Meeting - Conversion and
Delivery of Electrical Energy in the 21st Century: 1-5
CHEN D., XİE S., 2004, Review of the control strategies applied to active power
filters. IEEE International Conference on Electric Utility Deregulation,
Restructuring and Power Technologies (DRPT2004)
DIXON J. W, GARCIA J. J., MORAN L, 1995, Control System For Three-
Phase Active Power Filter Simultaneously Compensates Power Factor and
Unbalanced Loads, IEEE Transactions on Industrial Electronics, 42,
6:636-641
141

DUGAN R.C.,CONRAD L.E., 1999, Impact of Induction Furnace Interharmonics on
Distribution Systems, IEEE Transmission and Distribution Conference,
2:791-796
ECOFYS, 2009, Methodology for the free allocation of emission allowances in the
EU ETS post 2012 .Sector report for the iron and steel industry, Fraunhofer
Institute for Systems and Innovation Research
FENTON M.D., 2005. Mineral Commodity Profiles-Iron and Steel.U.S. Geological
Survey, Reston, Virginia
GONZALEZ D., BALCELLS J., LOVERA S., LİMA R, 1998, Comparison between
Unity Power Factor and Instantaneous Power Theory Control Strategies
applied to a Three Phase Active Power Filter, Industrial Electronics
Society. Proceedings of the 24th Annual Conference of the IEEE, 2:843- 847
HALPIN S.M., 2005, Comparison of IEEE and IEC Harmonic Standards, IEEE
Power Engineering Society General Meeting: 3, 2214-2216
JAIN S.K., AGARWAL P.H.O., 2007, Design Simulation and Experimental
Investigations, on a Shunt Active Power Filter for Harmonics, and
Reactive Power Compensation, Electric Power Components and Systems
13 10:672-692
IAGAR A., POPA G.N., DINIS C.M, 2009, Assessment of Power Quality for Line
Frequency Coreless Induction Furnaces, WSEAS Transactions on Circuits
and Systems, 1, 8:115-124
IRAVANİ M.R.,KARİMİ M,GHARTEMANİ, 2003, Online estimation of Steady
state and instantaneous symmetrical components, Generation, Transmission
and Distribution, IEE Proceedings 150, 5:616-622
ISTANBUL CHAMBER OF COMMERCE, 2008. Turkey’s Iron and Steel Industry
IZHAR, HADZER M., MASRI C.M., S.IDRIS, S., 2003, A Study of The
Fundamental Principles to Power System Harmonic, Proceedings on
National Power and Energy Conference: 223 - 231
KARIMI, GHARTEMANI, M. BAKHSHAI, A.R. MOJIRI, M. 2005, Estimation of
Power System Frequency Using Adaptive Notch Filters, IEEE
Instrumentation and Measurement Technology Conference, 2:1494-1497
142
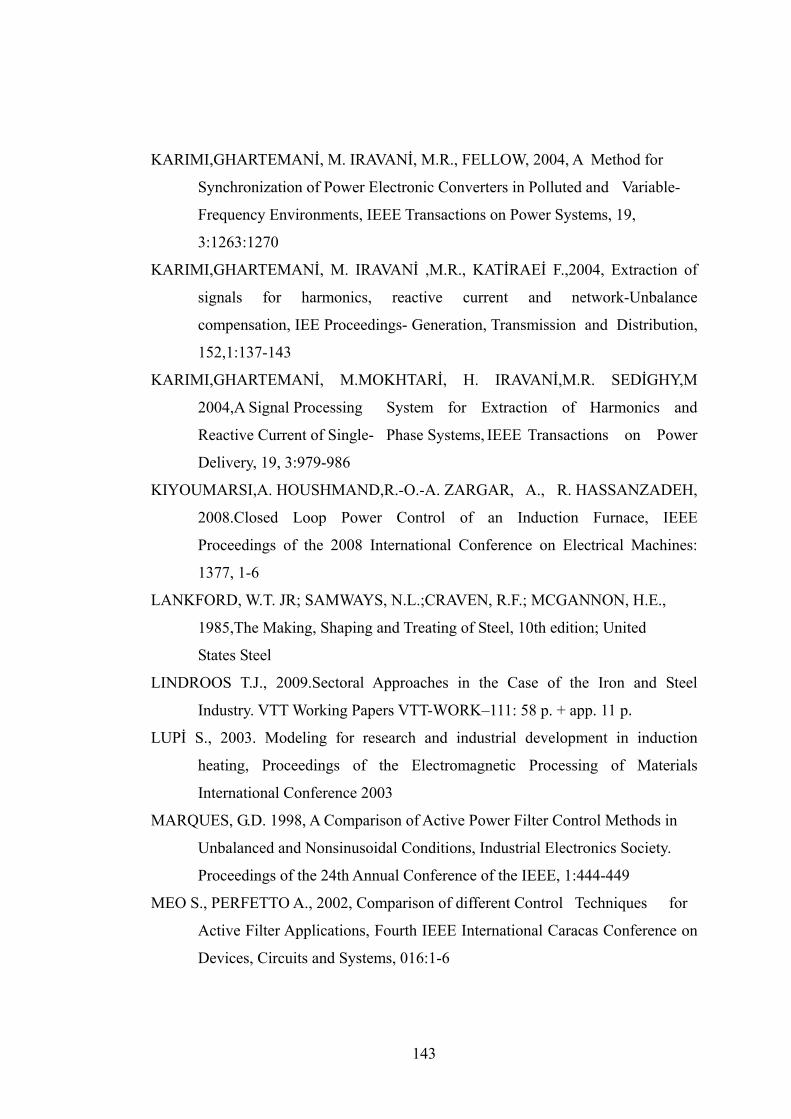
KARIMI,GHARTEMANİ, M. IRAVANİ, M.R., FELLOW, 2004, A Method for
Synchronization of Power Electronic Converters in Polluted and Variable-
Frequency Environments, IEEE Transactions on Power Systems, 19,
3:1263:1270
KARIMI,GHARTEMANİ, M. IRAVANİ ,M.R., KATİRAEİ F.,2004, Extraction of
signals for harmonics, reactive current and network-Unbalance
compensation, IEE Proceedings- Generation, Transmission and Distribution,
152,1:137-143
KARIMI,GHARTEMANİ, M.MOKHTARİ, H. IRAVANİ,M.R. SEDİGHY,M
2004,A Signal Processing System for Extraction of Harmonics and
Reactive Current of Single- Phase Systems, IEEE Transactions on Power
Delivery, 19, 3:979-986
KIYOUMARSI,A. HOUSHMAND,R.-O.-A. ZARGAR, A., R. HASSANZADEH,
2008.Closed Loop Power Control of an Induction Furnace, IEEE
Proceedings of the 2008 International Conference on Electrical Machines:
1377, 1-6
LANKFORD, W.T. JR; SAMWAYS, N.L.;CRAVEN, R.F.; MCGANNON, H.E.,
1985,The Making, Shaping and Treating of Steel, 10th edition; United
States Steel
LINDROOS T.J., 2009.Sectoral Approaches in the Case of the Iron and Steel
Industry. VTT Working Papers VTT-WORK–111: 58 p. + app. 11 p.
LUPİ S., 2003. Modeling for research and industrial development in induction
heating, Proceedings of the Electromagnetic Processing of Materials
International Conference 2003
MARQUES, G.D. 1998, A Comparison of Active Power Filter Control Methods in
Unbalanced and Nonsinusoidal Conditions, Industrial Electronics Society.
Proceedings of the 24th Annual Conference of the IEEE, 1:444-449
MEO S., PERFETTO A., 2002, Comparison of different Control Techniques for
Active Filter Applications, Fourth IEEE International Caracas Conference on
Devices, Circuits and Systems, 016:1-6
143

MOLEYKUTTY G. and KARTİK P B., 2008, Three-Phase Shunt Active Power
Filter, American Journal of Applied Sciences 5, 8: 909-916
MONTERO,M.I.M.,CADAVAL,E.L.GONZALEZ,F.B.,2007,Comparison of Control
Strategies for Shunt Active Power Filters in Three-Phase Four-Wire Systems,
IEEE Transactions On Power Electronics, 22, 1:229-236
MORAN L.,DİXON J., ESPİNOZA J.,WALLACE R.,1999, Using Active Power
Filters To Improve Power Quality, 5th Brazilian Power Electronics
Conference, COBEP’99:501–511
MOUTTOU S., NGANDUI E., SICARD P., 2001, A novel PWM Current Control
Method for AC Harmonic Elimination by Active Power Filter, Electrical
and Computer Engineering, Canadian Conference,2:793-797
QUASS U. X, FERMAN M. BRÖKER G, 2007, European Dioxin Inventory.
Electric furnace steel plant; Results: pg135-143
PRİCE L., SİNTON J., WORRELL E., PHYLİPSEN D., HU X., Lİ. J., 2001.Energy
use and carbon dioxide emissions from steel production in China. Published
in Energy 27:429-446
RUDNEV V.,LOVELESS D.,COOK R.,BLACK M.,1999, Power Quality for
Induction Melting in Metal Production, TechCommentary Electric Power
Research Institute, U.S.A
RUDNICK, H., MORAN, L., J., DIXON, 2003, Active power filters as a solution to
power quality problems in distribution Networks, IEEE Power and Energy
Magazine: 32-40
SALOR, O. GULTEKIN, B. BUHAN, S. BOYRAZOGLU, B. INAN, T.
ATALIK, T. ACIK, A. TERCIYANH, A. UNSAR, O. ALTINTAS, E.
AKKAYA, Y. OZDEMIRCI, E. CADIRCI, I. ERMIS, M., 2010. Electrical
Power Quality of Iron and steel Industry in Turkey, IEEE Transactions on
Industry Applications, 46,1:60-80
SINGH B., AL-HADDAD K., CHANDRA A., 1999, A Review of Active Filters
for Power Quality Improvement, IEEE Transactions On Industrial
Electronics, 46,5:960-971
SMS MEVAC, The Heart of Steel Making Secondary Metallurgy
144
TREMAYNE J. F., 1983, Impedance and Phase Balancing of Mains – Frequency
Induction Furnaces, IEE Proceedings on Electric Power Applications, 130,
(3), pp. 161 – 170.
UNNİKRİSHNAN A.K.,JOSEPH A.,SUBHASH J.T.G.,2006,Three level
STATCOM Based Power Quality Solution for a 4 MW Induction Furnace,
Power Electronics, Drives and Energy Systems International Conference
1-5
USTA Ö., OZDEMİR E., YUMAK K., Design and Implementation of a Three Phase
Four Wire Shunt Active Power Filter
ZAMORA I., ALBİZU I., MAZON A.J.,SAGASTABEİTİA K.J.,FERNANDEZ E.,
2003, Harmonic distortion in a steel plant with induction Furnaces,
International Conference on Renewable Energies and Power Qualıty’03
145

146

147
CIRRICULUM VITAE
Can Onur TOKUNÇ was born in Adana, Turkey, in 1983.He completed the
high school education in Adana. He received his BSc degree in Electrical and
Electronics Engineering from Çukurova University in 2005. After completion his B.S
training, he has started MSc degree in the department of Electrical and Electronics
Engineering in Çukurova University. He has been working in ISDEMIR as electric
automation maintenance engineer. His research interests are power quality, power
quality devices and control of power converters.