Çukurova university institute of natural …library.cu.edu.tr/tezler/8331.pdf · Çukurova...
TRANSCRIPT

ÇUKUROVA UNIVERSITY INSTITUTE OF NATURAL AND APPLIED SCIENCES
MSc THESIS
Serpil AĞYEL
COMPUTER SIMULATION FOR SERIES HYBRID ELECTRICAL VEHICLE
DEPARTMENT OF ELECTRICAL AND ELECTRONICS ENGINEERING
ADANA, 2011
ÇUKUROVA UNIVERSITY INSTITUTE OF NATURAL AND APPLIED SCIENCES
COMPUTER SIMULATION FOR SERIES HYBRID ELECTRICAL
VEHICLE
Serpil AĞYEL
MSc THESIS DEPARTMENT OF ELECTRICAL AND ELECTRONICS ENGINEERING We certify that the thesis titled above was reviewed and approved for the award of degree of the Master of Science by the board of jury on 10/02/2011. ……………….................... ………………………….. ……................................ Asst. Prof. Dr. Murat AKSOY Assoc. Prof. Dr. Ulus ÇEVİK Asst. Prof. Dr. Mutlu AVCI SUPERVISOR MEMBER MEMBER This MSc Thesis is written at the Department of Institute of Natural And Applied Sciences of Çukurova University. Registration Number:
Prof. Dr. İlhami YEĞİNGİL Director Institute of Natural and Applied Sciences
Not:The usage of the presented specific declarations, tables, figures, and photographs either in this
thesis or in any other reference without citiation is subject to "The law of Arts and Intellectual Products" number of 5846 of Turkish Republic

I
ABSTRACT
MSc. THESIS
COMPUTER SIMULATION FOR SERIES HYBRID ELECTRICAL VEHICLE
Serpil AĞYEL
ÇUKUROVA UNIVERSITY
INSTITUTE OF NATURAL AND APPLIED SCIENCES DEPARTMENT OF ELECTRICAL AND ELECTRONICS ENGINEERING
Supervisor : Asst. Prof. Dr. Murat AKSOY Year: 2011, Pages: 115 Jury : Assoc. Prof. Dr. Ulus ÇEVİK : Asst. Prof. Dr. Mutlu AVCI
With increasing oil price and mounting environment concerns, cleaner and sustainable energy solutions have been demanded. At present transportation constitutes a large portion of the energy consumed and pollution created. The work presented here deals with evaluation and optimisation of the tractive system in hybrid electric buses. The work is based on analytical simulation models that are verified via measurements. The subject of this thesis is the control of the load distribution between the power sources in the hybrid electric powertrain. The control problem is to choose the distribution of power from the electric buffer and primary power unit that minimizes the fuel consumption in the long run. To solve this problem the efficiency characteristics of the components in the powertrain must be considered. It is the advantage of hybrids to have the extra degree of freedom because of the buffer so that the primary power unit can be driven independent of the transient traction demand of the vehicle powertrain. Using a simple model of the power flows, energy levels and a regression model of the future driving, the resulting policy minimizes the expected fuel consumption with respect to the prediction model of the future driving conditions.
Key Words: Series Hybrid Bus, Modelling, Simulation
II
ÖZ
YÜKSEK LİSANS TEZİ
HİBRİT ELEKTRİKLİ ARAÇLAR İÇİN BİLGİSAYAR SİMULASYONU
Serpil AĞYEL
ÇUKUROVA ÜNİVERSİTESİ FEN BİLİMLERİ ENSTİTÜSÜ
ELEKTRİK – ELEKTRONİK MÜHENDİSLİĞİ ANABİLİM DALI
Danışman :Yrd. Doç. Dr. Murat AKSOY Yıl: 2011, Sayfa: 115 Jüri : Doç. Dr. Ulus ÇEVİK : Yrd. Doç. Dr. Mutlu AVCI
Yükselen yakıt ve montaj fiyatlarıyla birlikte çevresel kaygılar, daha temiz ve sürdürülebilir enerji çözümlerini talep ettirmiştir. Şu anki ulaşım çevre kirliliği yaratmakta ve çok büyük oranda da enerji tüketimi oluşturmaktadır. Burada sunulan çalışma hibrit elektrik otobüslerindeki çekiş sisteminin optimizasyonu ve evaluasyonuyla ilgilenmektedir. Bu çalışma, ölçümlerle doğrulanan analitik simülasyon modellerine dayanmaktadır. Bu tezin konusu aracın güç ihtiyacını içten yanmalı motor ve elektrik depolama ünitesi gibi farklı kaynaklardan karşılayarak uzun vadede yakıt tüketimini en düşük seviyeye indirmektir. Bu problemi çözmek için sistemdeki elemanların verim karakteristiklerinin bilinmesi ve kullanılması gerekmektedir. Hibritlerin avantajı ise elektrik depolama ünitesinin ekstra serbestlik derecesi sayesinde tahrik sistemi elemanlarının verimliliklerinin yüksek olduğu işletim bölgelerinde çalıştırılabilmeleridir. Sürücü tarafından gelecekte talep edilecek güç değerlerinin tahmininin zor olması en iyi yapma problemini güçleştirmektedir. Bu tezde hesaplamalarında kullanılmak üzere gelecek tahminleri yapılmaktadır. Güç akışlarının kontrolü, gelecek hız tahminleri ve verimli işletim bölgelerinin kullanımı yakıt tüketiminin azaltılmasına yardımcı olmuştur. Key Words: Seri Hibrit Otobüs, Modelleme, Simülasyon

III
ACKNOWLEDGEMENTS
Foremost, I would like to express my gratitude to my supervisor Asst. Prof.
Dr. Murat AKSOY. This thesis would not have been possible unless his limitless
patience, knowledge, guidance and kind support.
I would like to send my greatest thanks to Mr. Andreas BAUMANN from
TEMSA Global A.Ş. for their support, advice and time.
I am deeply grateful to Burak KİRAY, Sibel KAFTAR and Deniz
ERDOĞAN for their support and help during my studies.
I owe a great and special thanks to Yusuf IŞIKLI for his never-ending
encouragement, support and help.
Finally, I would like to thank my family for their endless love and
encouragement throughout my life.
IV
CONTENTS PAGE
ABSTRACT ............................................................................................................. I
ÖZ ........................................................................................................................... II
ACKNOWLEDGEMENTS .................................................................................... III
CONTENTS ...........................................................................................................IV
LIST OF TABLES............................................................................................... VIII
LIST OF FIGURES ................................................................................................. X
LIST OF ABBREVIATONS ................................................................................ XII
1. INTRODUCTION ................................................................................................ 1
1.1. Background .................................................................................................... 1
1.2. The Need of Hybrid Electric Vehicles ............................................................ 1
1.3. Main Results .................................................................................................. 3
2. PRELIMINARY WORK ...................................................................................... 5
2.1. Contemporary Vehicle Powertrain Technologies ............................................ 5
2.2. Internal Combustion Engine Vehicles .......................................................... 37
2.2.1. Conventional Vehicles ........................................................................ 37
2.3. Electric Vehicles ............................................................................................ 9
2.3. Hybrid Vehicles ........................................................................................... 10
2.4.1. Introduction ........................................................................................ 10
2.4.2. HEV Classifications by Power Source ................................................ 11
2.4.2.1. Internal Combustion Engine Based HEV ......................................... 11
2.4.2.2. Fuel cell Based HEV ....................................................................... 11
2.4.3. HEV Classifications by Drivetrain Architectures ................................ 12
2.4.3.1. Series hybrid.................................................................................... 12
2.4.3.2. Parallel Hybrid ................................................................................ 16
2.4.3.3. Power Split Hybrid .......................................................................... 19
2.5. Review on Hybrid Electric Vehicles Energy Storage System ........................ 21
2.5.1. Research Issues in Hybrid Electric Vehicles Design ........................... 21
2.5.2. Energy Storage System ....................................................................... 22
2.5.2.1. Sizing Considerations of Energy Storage System ............................. 22
V
2.5.2.2. ESS Power and Capacity Rating ...................................................... 23
2.5.2.3. ESS for an Electric Vehicle ............................................................. 25
2.5.2.4. ESS for a Hybrid Electric Vehicle ................................................... 26
2.5.2.5. ESS for a Plug-in Hybrid Electric Vehicle ...................................... 28
2.5.3. Advance of Energy Storage Technologies and Hydrogen Fuel Cells .. 29
2.5.3.1. Sealed Lead Acid Battery (SLA) ..................................................... 30
2.5.3.2. Nickel Metal Hydride Battery (Ni-MH) .......................................... 30
2.5.3.3. Lithium Ion Battery (Li-ion) ........................................................... 31
2.5.3.4. Ultracapacitors ............................................................................... 32
2.5.3.5. Hydrogen Fuel Cells ....................................................................... 33
3. MATERIAL AND METHOD ............................................................................ 35
3.1. Vehicle Simulation Tools ............................................................................ 35
3.2. ADvanced VehIcle SimulatOR (ADVISOR) ............................................... 35
3.2.1. ADVISOR Background ..................................................................... 35
3.2.2. ADVISOR Modeling Approaches ...................................................... 36
3.2.3. ADVISOR Interface .......................................................................... 37
3.2.4. Models in ADVISOR ........................................................................ 41
3.2.4.1. Internal Combustion Engines and PEM Fuel Cells Models ............. 41
3.2.4.2. Energy Storage Model .................................................................... 41
3.2.4.3. Electric Motor and Motor Controller Models .................................. 41
3.3. The flexible ELFA System (Electric Low Floor Axle (ELFA), .................... 42
3.3.1. Background ....................................................................................... 42
3.3.1.1. Range from hybrid drive up to pure electric drive ........................... 43
3.3.2. ELFA: advantages at a glance ............................................................ 44
3.3.2.1. Sensible: Braking energy is regenerated and stored ......................... 45
3.3.2.2. Increased degree of cost effectiveness and flexibility ...................... 45
3.3.2.3. For buses around the world: Tailored and system-based solutions ... 46
3.3.2.4. The standard: Systems with rugged induction motors ...................... 46
3.3.2.5. The alternative: Sys. with permanent-magnet synchronous motors .. 46
3.3.2.6. The generators: mechanical unit together with the traction motor ..... 47
3.3.2.7. The traction converters: Compact and can be used in a modular....... 47
VI
3.3.2.8. The open-loop control software – tailored customer solutions .......... 47
3.3.3. A real milestone for urban bus traffic.................................................. 48
3.3.4. Energy mix for ELFA applications ..................................................... 48
3.3.4.1. Hybrid drive with internal combustion engine.................................. 49
3.3.4.2. Hybrid drive with fuel cell ............................................................... 49
3.3.4.3. Battery drive .................................................................................... 50
4. RESEARCH AND DISCUSSION ...................................................................... 51
4.1 Modelling the Vehicle Dynamics in Series Hybrid System ............................ 51
4.2 Simulation Model.......................................................................................... 53
4.2.1. Introduction to the Program-model ..................................................... 54
4.2.2. User Interface of the Program ............................................................. 55
4.2.3. Program Model................................................................................... 57
4.3. Series Hybrid Vehicle Architecture .............................................................. 57
4.3.1. Mechanical Dynamics ........................................................................ 59
4.3.2. Electric Traction Motor ...................................................................... 61
4.3.3. Ultracapacitors ................................................................................... 62
4.3.3.1. Ultracapacitor Power Charts ............................................................ 62
4.3.3.2. Specification .................................................................................... 63
4.3.3.3. 125 Volt Transportation Modules .................................................... 63
4.3.3.4. Features ........................................................................................... 64
4.3.3.5. Benefits ........................................................................................... 64
4.3.3.6. Advantages In Hybrid Vehicles ....................................................... 64
4.3.3.7. Implementation ................................................................................ 65
4.3.4. ICE in Test Bench ............................................................................. 65
4.4. Series Hybrid Bus Operation ........................................................................ 66
4.4.1. UCAP State of Charge ........................................................................ 66
4.4.2. BRAKING ......................................................................................... 67
4.4.3. ACCELERATION & CRUISING ...................................................... 67
4.4.4. IDLE ................................................................................................. 68
4.5. Drive Cycles ................................................................................................ 68
4.6. Simulation Parameters.................................................................................. 69
VII
4.7. Vehicle Dynamics Results ............................................................................ 70
4.8. Optimization Method Results ....................................................................... 73
4.8.1. Classical Road drive cycles; ............................................................... 73
4.8.1.1. Case 1.............................................................................................. 73
4.8.1.2. Case 2.............................................................................................. 75
4.8.1.3. Case 3.............................................................................................. 76
4.8.2. Metropolis Drive Cycle ...................................................................... 78
4.8.2.1. Case 1.............................................................................................. 79
4.8.2.2. Case 2.............................................................................................. 80
4.8.2.3. Case 3.............................................................................................. 82
5. CONCLUSION .................................................................................................. 87
REFERENCES ....................................................................................................... 89
CURRICULUM VITAE ......................................................................................... 93
APPENDIX A: MATLAB/SIMULINK .................................................................. 94
APPENDIX B: Ultracapacitors (Maxwell Technologies, 2009) .............................. 96
VIII
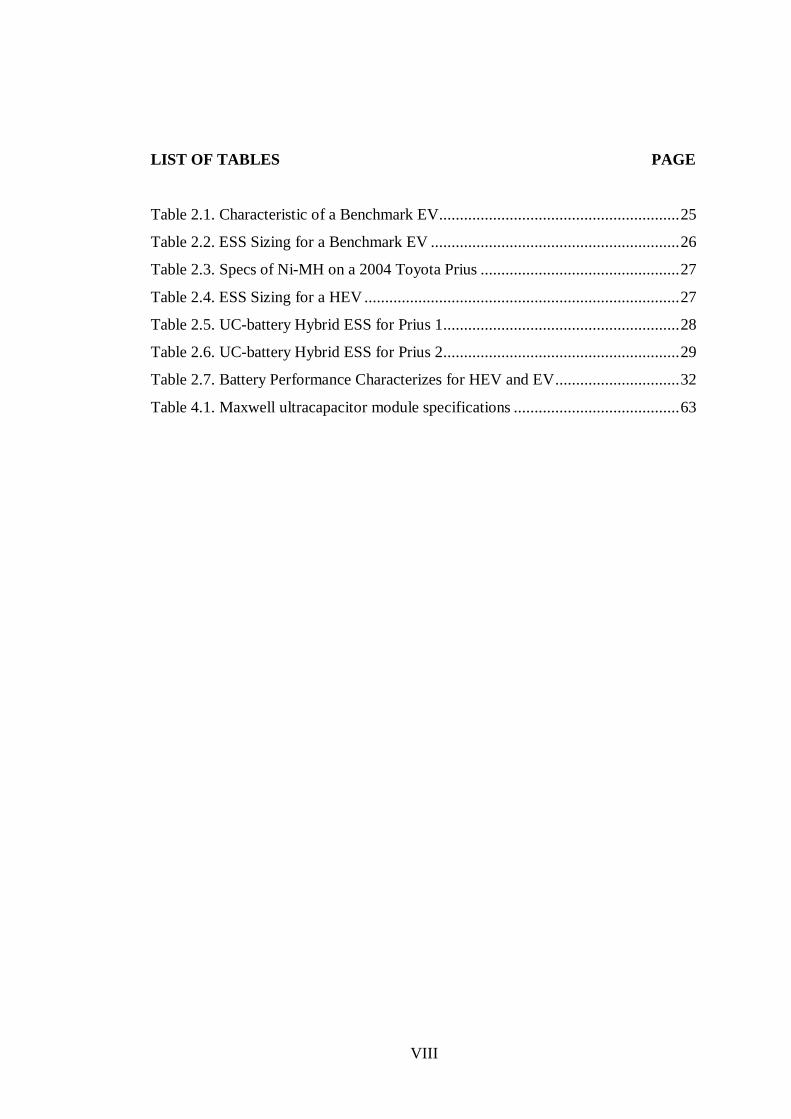
LIST OF TABLES PAGE
Table 2.1. Characteristic of a Benchmark EV .......................................................... 25
Table 2.2. ESS Sizing for a Benchmark EV ............................................................ 26
Table 2.3. Specs of Ni-MH on a 2004 Toyota Prius ................................................ 27
Table 2.4. ESS Sizing for a HEV ............................................................................ 27
Table 2.5. UC-battery Hybrid ESS for Prius 1 ......................................................... 28
Table 2.6. UC-battery Hybrid ESS for Prius 2 ......................................................... 29
Table 2.7. Battery Performance Characterizes for HEV and EV .............................. 32
Table 4.1. Maxwell ultracapacitor module specifications ........................................ 63

IX
X
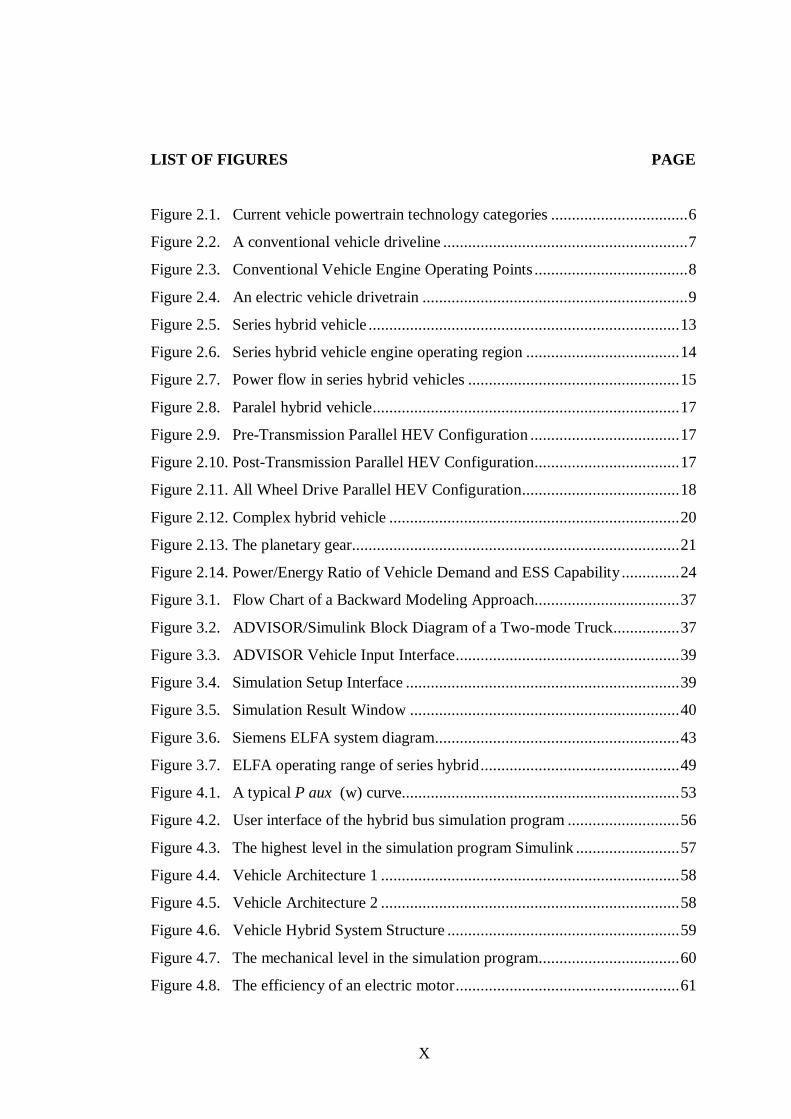
LIST OF FIGURES PAGE
Figure 2.1. Current vehicle powertrain technology categories ................................. 6
Figure 2.2. A conventional vehicle driveline ........................................................... 7
Figure 2.3. Conventional Vehicle Engine Operating Points ..................................... 8
Figure 2.4. An electric vehicle drivetrain ................................................................ 9
Figure 2.5. Series hybrid vehicle ........................................................................... 13
Figure 2.6. Series hybrid vehicle engine operating region ..................................... 14
Figure 2.7. Power flow in series hybrid vehicles ................................................... 15
Figure 2.8. Paralel hybrid vehicle .......................................................................... 17
Figure 2.9. Pre-Transmission Parallel HEV Configuration .................................... 17
Figure 2.10. Post-Transmission Parallel HEV Configuration ................................... 17
Figure 2.11. All Wheel Drive Parallel HEV Configuration ...................................... 18
Figure 2.12. Complex hybrid vehicle ...................................................................... 20
Figure 2.13. The planetary gear............................................................................... 21
Figure 2.14. Power/Energy Ratio of Vehicle Demand and ESS Capability .............. 24
Figure 3.1. Flow Chart of a Backward Modeling Approach................................... 37
Figure 3.2. ADVISOR/Simulink Block Diagram of a Two-mode Truck ................ 37
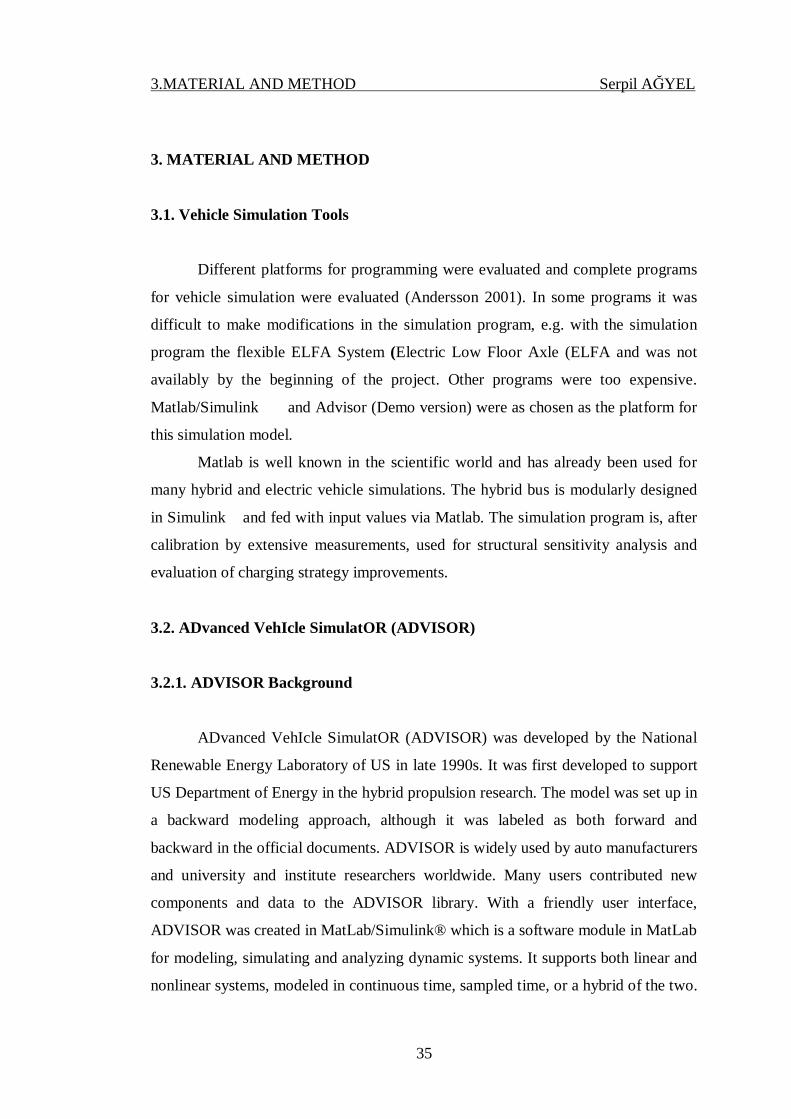
Figure 3.3. ADVISOR Vehicle Input Interface ...................................................... 39
Figure 3.4. Simulation Setup Interface .................................................................. 39
Figure 3.5. Simulation Result Window ................................................................. 40
Figure 3.6. Siemens ELFA system diagram........................................................... 43
Figure 3.7. ELFA operating range of series hybrid ................................................ 49
Figure 4.1. A typical P aux (w) curve................................................................... 53
Figure 4.2. User interface of the hybrid bus simulation program ........................... 56
Figure 4.3. The highest level in the simulation program Simulink ......................... 57
Figure 4.4. Vehicle Architecture 1 ........................................................................ 58
Figure 4.5. Vehicle Architecture 2 ........................................................................ 58
Figure 4.6. Vehicle Hybrid System Structure ........................................................ 59
Figure 4.7. The mechanical level in the simulation program .................................. 60
Figure 4.8. The efficiency of an electric motor ...................................................... 61
XI
Figure 4.9. Ultracapacitor power discharge profiles .............................................. 62
Figure 4.10. The emissions from the Cummins natural gas ICE .............................. 66
Figure 4.11. Serial Hybrid energy savings potential ................................................ 67
Figure 4.12. Classical Road Drive Cycle ................................................................. 68
Figure 4.13. Metropolis Drive Cycle ..................................................................... 69
Figure 4.14. Grade Profile used for the drive cycles Classical Road and Istanbul
City ..................................................................................................... 70
Figure 4.15. Speed, Distance and Demanded Traction Power for Classical Road
drive cycle ........................................................................................... 71
Figure 4.16. Energy Consumption with / without Regenerative Braking ................. 72
Figure 4.17. Speed, Distance and Demanded Traction Power for Metropolis
drive cycle ........................................................................................... 72
Figure 4.18. Energy Consumption with or without Regenerative Braking ............... 73
Figure 4.19. SoC, fuel consumption and generator power for Classical Road drive
cycle case 1 ......................................................................................... 74
Figure 4.20. Optimization results for Classical Road drive cycle case 1 .................. 75
Figure 4.21. Optimization results for Classical Road drive cycle case 2 .................. 76
Figure 4.22. SoC, fuel consumption and generator power for Classical Road drive
cycle Case 3 ........................................................................................ 77
Figure 4.23. Optimization results for Classical Road drive cycle Case 3 ................. 78
Figure 4.24. SoC, fuel consumption and generator power for Metropolis drive
cycle Case 1 ....................................................................................... 79
Figure 4.25. Optimization results for Metropolis drive cycle Case 1........................ 80
Figure 4.26. SoC, fuel consumption and generator power for Metropolis drive
cycle Case 2 ....................................................................................... 81
Figure 4.27. Optimization results for Metropolis drive cycle Case 2........................ 82
Figure 4.28. SoC, fuel consumption and generator power for Metropolis drive
cycle Case 3 ....................................................................................... 83
Figure 4.29. Optimization results for Metropolis drive cycle Case 3........................ 84
XII
LIST OF ABBREVIATONS
ABS : Anti-Lock Brake System
ADVISOR : ADvanced VehIcle SimulatOR
AER : All electric range
BSFC : Brake specific fuel consumption
CAN : Controller Area network
CVT : Continuously variable transmission
DOH : degree of hybridization
ELFA : Electric Low Floor Axle
ESS : Energy storage system
EV : Electric vehicle
FC : Fuel Cell
HEB : Hybrid Electric Bus
HV : Hybrid vehicle
ICE : Internal combustion engine
ICEV : Internal combustion engine vehicle
IMA : Integrated Motor Assist
L-A : Lead acid
Li-ion : Lithium Ion Battery
M/G : Motor/Generator
NCV : Net calorific value
Ni-MH : Nickel Metal Hydride
Ni-MH : Nickel Metal Hydride Battery
NREL : National Renewable Energy Laboratory
PEM : Proton Exchange Membrane
PHEV : Plug in hybrid electric vehicles
PZEV : Partial- zero-emission vehicle
SLA : Sealed Lead Acid Battery
SOC : State of Charge
TCU : Transmission control unit

XIII
UCAP : Ultracapacitor
UPS : Uninterrupted power systems
ZEV : Zero-emission vehicle
1.INTRODUCTION Serpil AĞYEL
1
1.INTRODUCTION
1.1. Background
In the more than 100 years since its inception, the internal combustion engine
vehicle (ICEV) has transformed modern civilization. Many benefits have been
derived from the freedom and convenience these vehicles have provided. The
technology has not been without its negative effects, however. For instance, the
highway and road infrastructure to accommodate the increasing number of vehicles
has placed a severe financial burden on governments for initial construction and
subsequent maintenance (Wishart, 2008). In the United States, for example, $80
billion dollars are spent each year on maintenance and upgrading of the interstate
system (Micklethwait, 2006a). Despite these drawbacks, vehicles are certain to
become even more ubiquitous in the future, especially in developing nations. It is
forecast that the number of cars per hundred people in China and India will increase
from two in 2006 to 29 and 21, respectively, by 2040, adding some 720 million new
cars to the current population (Micklethwait, 2006b).
1.2. The Need of Hybrid Electric Vehicles
Electric traction of vehicles is an old technique and has been used for
example 1894 in an electric train. Electrical motors have higher torque density than
an ICE (internal combustion engine), and thus the electrical traction system can have
a more compact design than the ICE counterpart, e.g. the electrical motor can be
mounted in the wheel. The life cycle on an electrical machine is longer than that of
an ICE, they do not need oil change and do not generate any emissions. Another
advantage in a vehicle is that they can regenerate the kinetic energy when braking.
As a traction motor, the electrical machine is more suitable than any ICE.
The problem with an electrical driven vehicle is the amount of energy that
must be brought with the vehicle to reach a reasonable driving distance. The main
energy storage is electro chemical (batteries), electro mechanical (flywheels) and

1.INTRODUCTION Serpil AĞYEL
2
electro static (super capacitors). No electric bus equipped with these energy storages
can store an amount of energy on the bus that is comparable to e.g. the energy in the
diesel tank of a pure diesel bus.
An important trend for the future of electric vehicles is the use of fuel cells
that allow for direct conversion of a high-energy medium (gas of fluid) to electricity.
In the future, the fuel cell vehicle may compete with conventional ICE vehicles.
One solution to the electrically driven vehicle’s energy storage problem is to
bring along an ICE and a generator, which can assist the electro chemical energy
storage with electric energy from chemical energy with high energy density. From a
driving distance point of a view, such a vehicle has the sameadvantages as the pure
ICE driven vehicles. From an emissions point of view the hybrid vehicle also has
similar disadvantages as the ICE driven vehicle. But, there is a small and important
difference, the ICE does not have to produce all the instantaneous power for driving,
and there is a freedom to choose operating point for the ICE to keep the state of
Charge (SOC) of the batteries within reasonable limits.
The battery assists with the difference between the total power used in the
vehicle (including tractive power) and the power produced by the ICE-driven
generator. The possibility of choosing the working points of the ICE more freely in a
hybrid vehicle makes it possible to optimise some parameters. The energy
consumption is one parameter and emissions another. To optimise the composition
and use of a hybrid electrical vehicle, it is necessary to start by defining what
qualities and performance or what combinations of these that is regarded as optimal.
Electrical hybrid vehicle can be built in any conventional type, like trucks
buses and small cars. The electrical vehicle’s qualities with a silent and emissions
free (the ICE turned off) operation are particularly interesting in the centre of the city
(Andersson, 2001).
This thesis describes a scientific evaluation of a commercial hybrid bus, with
special focus on the simulation and control of the traction system including the
batteries, combustion engine and electrical machines.
There are several commercial simulation programs available for electrohybrid
vehicles. They are often made for specific customers or for specific hybrid structures,
1.INTRODUCTION Serpil AĞYEL
3
and do not allow the kind of changes in detail and/or topology that we anticipate to
need.
For all simulation programs a lot of parameters are requested like efficiency,
consumption and emissions. The manufacturer of the components in a particular
vehicle could supply these parameters, but often the manufacturers are not willing to
supply key parameters, like the efficiency of their product. It is also required to have
a good knowledge about the components in the vehicle as well as the driving cycle.
This has been obtained in this work by measurements on the hybrid bus, both on the
bus in traffic and directly on some of its components.
1.3. Main Results
The work performed for this MSc. research began with a thorough survey of
the current trends in HV development, with a documentation of the state of the art of
hybrid vehicle research. With a clear view of the path chosen by industry to
development of this powertrain technology, the research focused on the development
of virtual prototypes of hybrid vehicle powertrains through the use of design tools.
Dynamic modelling of the selected designs is used to accurately describe the
powertrain mechanisms’ functions. Simulations are conducted to predict the
performance of the developed models. An optimization of one of the powertrain
components is performed to demonstrate the potential of optimization to improve
designs. Finally, experimental validation of the results of the modelling and
simulation is conducted to confirm or refute theoretical predictions. These steps are
crucial aspects of the development of the virtual prototype. A virtual prototype is
indispensible in the competitive industry of automotive development because it
allows for design change effects to be measured quickly and easily and without the
need to manufacture expensive physical prototypes with each change.
The authors’ main contribution with the work presented in this thesis is:
· A simulation program for a HEB (Hybrid Electric Bus), verified via measurements,
taking all major power conversion processes into account, modelling efficiency and
emissions, given a particular drives cycle and vehicle specification.

1.INTRODUCTION Serpil AĞYEL
4
· A predictive charging strategy that utilizes the repetitive nature of a bus route to
predict the power need and thus allow a smoother use of the ICE

2.PRELIMINARY WORK Serpil AĞYEL
5
2. PRELIMINARY WORK
2.1. Contemporary Vehicle Powertrain Technologies
There are three main categories of powertrain technologies: (1) ICEVs, (2)
Electric vehicles (EVs), and (3) Hybrid vehicles (HVs). The vehicles in these
categories (with appropriate names and acronyms included) are presented in Figure
2.1 below. It should be noted that experimental technologies, such as compressed air
propulsion systems, which are being pursued sporadically in research and
development have not been included in this survey.
Several of the entries in Figure 2.1 are often written to include the term
‘ESS’. ESS refers to an energy storage system, which can be a battery, an
ultracapacitor, a flywheel or a combination of the three. The flywheel technology is
rarely used in vehicular applications because of the danger associated with a large,
heavy mass spinning with considerable angular momentum being unleashed in the
event of an accident. As such, they are not included in this dissertation.
Due to the increasing problems of continued unfettered fossil fuel usage in
vehicular applications, an interest in the development of partial- and zero-emission
vehicles, known as PZEVs and ZEVs, respectively, has arisen. A PZEV is defined as
a vehicle that is 90% “cleaner” than the average new model year vehicle, while the
ZEV is 98% cleaner than the average new model year vehicle (driveclean.gov, 2006).
However, there exists considerable confusion in the literature nomenclature for
classifying the types of powertrain technologies of PZEVs and ZEVs.

2.PRELIMINARY WORK Serpil AĞYEL
6
Figure 2.1. Current vehicle powertrain technology categories
Internal Combustion Engine Vehicle
(ICEV)
Spark Ignition (SI) Vehicle
Compression Ignition (CI) Vehicle
Electric Vehicle (EV)
Battery Vehicle (BV)
Fuel Cell Vehicle (FCV)
Ultracapacitor Vehicle
(UC)
Hybrid Vehicle (HV)
Internal Combustion Engine Hybrid
Vehicle (ICEHV)
Fuel Cell Hybrid Vehicle (FCHV)
2.PRELIMINARY WORK Serpil AĞYEL
7
2.2. Internal Combustion Engine Vehicles
2.2.1. Conventional Vehicles
Although everybody is familiar with conventional vehicles, their features are
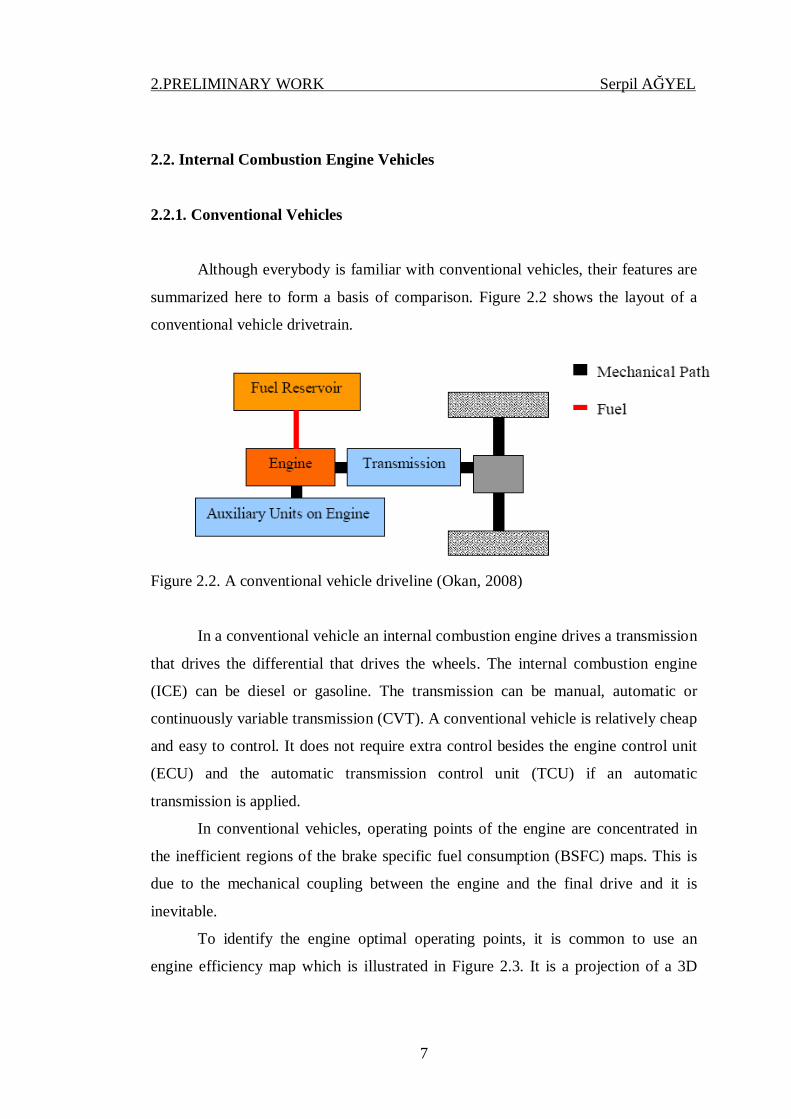
summarized here to form a basis of comparison. Figure 2.2 shows the layout of a
conventional vehicle drivetrain.
Figure 2.2. A conventional vehicle driveline (Okan, 2008)
In a conventional vehicle an internal combustion engine drives a transmission
that drives the differential that drives the wheels. The internal combustion engine
(ICE) can be diesel or gasoline. The transmission can be manual, automatic or
continuously variable transmission (CVT). A conventional vehicle is relatively cheap
and easy to control. It does not require extra control besides the engine control unit
(ECU) and the automatic transmission control unit (TCU) if an automatic
transmission is applied.
In conventional vehicles, operating points of the engine are concentrated in
the inefficient regions of the brake specific fuel consumption (BSFC) maps. This is
due to the mechanical coupling between the engine and the final drive and it is
inevitable.
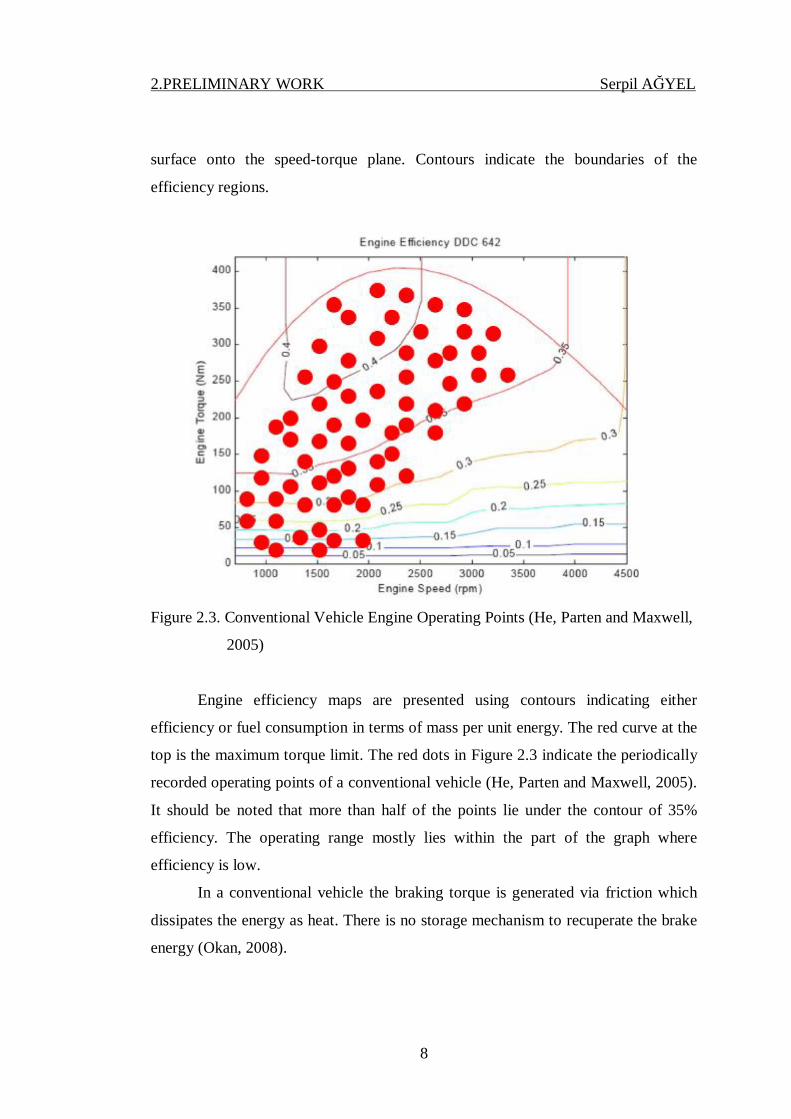
To identify the engine optimal operating points, it is common to use an
engine efficiency map which is illustrated in Figure 2.3. It is a projection of a 3D
2.PRELIMINARY WORK Serpil AĞYEL
8
surface onto the speed-torque plane. Contours indicate the boundaries of the
efficiency regions.
Figure 2.3. Conventional Vehicle Engine Operating Points (He, Parten and Maxwell,
2005)
Engine efficiency maps are presented using contours indicating either
efficiency or fuel consumption in terms of mass per unit energy. The red curve at the
top is the maximum torque limit. The red dots in Figure 2.3 indicate the periodically
recorded operating points of a conventional vehicle (He, Parten and Maxwell, 2005).
It should be noted that more than half of the points lie under the contour of 35%
efficiency. The operating range mostly lies within the part of the graph where
efficiency is low.
In a conventional vehicle the braking torque is generated via friction which
dissipates the energy as heat. There is no storage mechanism to recuperate the brake
energy (Okan, 2008).
2.PRELIMINARY WORK Serpil AĞYEL
9
2.3. Electric Vehicles
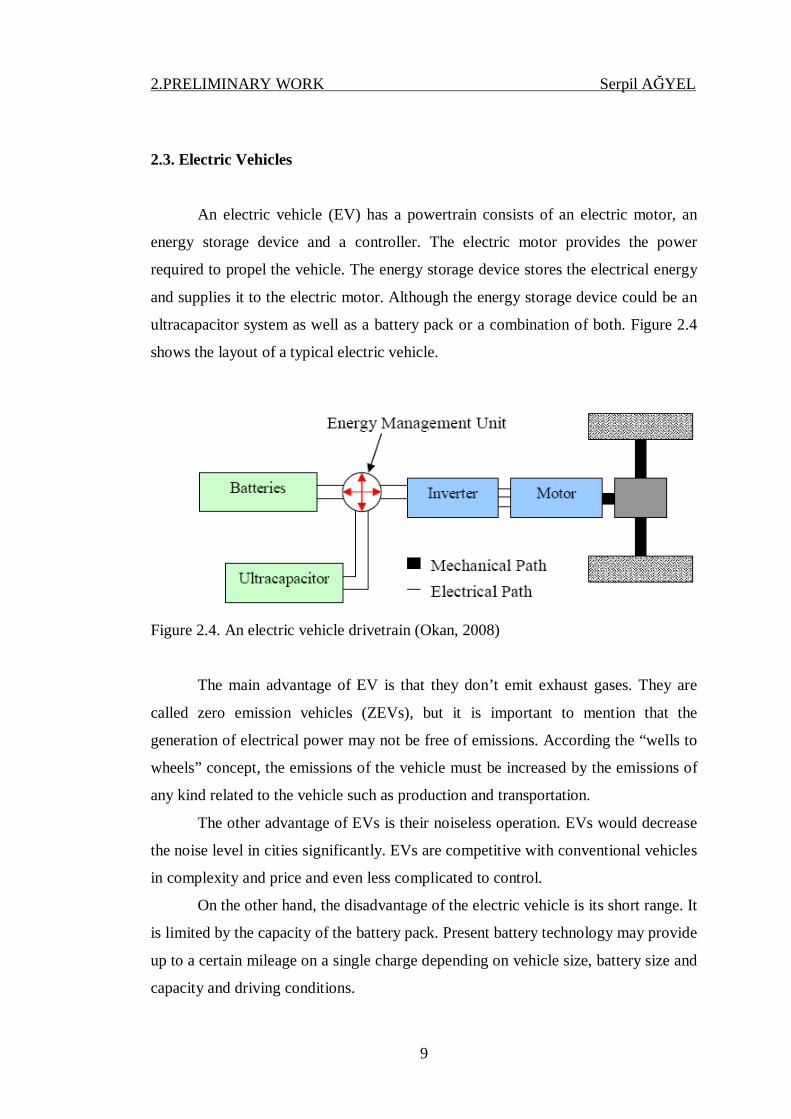
An electric vehicle (EV) has a powertrain consists of an electric motor, an
energy storage device and a controller. The electric motor provides the power
required to propel the vehicle. The energy storage device stores the electrical energy
and supplies it to the electric motor. Although the energy storage device could be an
ultracapacitor system as well as a battery pack or a combination of both. Figure 2.4
shows the layout of a typical electric vehicle.
Figure 2.4. An electric vehicle drivetrain (Okan, 2008)
The main advantage of EV is that they don’t emit exhaust gases. They are
called zero emission vehicles (ZEVs), but it is important to mention that the
generation of electrical power may not be free of emissions. According the “wells to
wheels” concept, the emissions of the vehicle must be increased by the emissions of
any kind related to the vehicle such as production and transportation.
The other advantage of EVs is their noiseless operation. EVs would decrease
the noise level in cities significantly. EVs are competitive with conventional vehicles
in complexity and price and even less complicated to control.
On the other hand, the disadvantage of the electric vehicle is its short range. It
is limited by the capacity of the battery pack. Present battery technology may provide
up to a certain mileage on a single charge depending on vehicle size, battery size and
capacity and driving conditions.
2.PRELIMINARY WORK Serpil AĞYEL
10
The short range of EVs is not actually the main problem. While conventional
vehicles can be refilled in few minutes, batteries of EVs need several hours of
charging once they were fully discharged. Consumers are not used to being without
their vehicles for hours every day. As a conclusion it may take a lot more to recharge
the batteries as it takes to fill up the fuel tank for the same trip (Okan, 2008).
2.4. Hybrid Vehicles
2.4.1. Introduction
A definition of the entity hybrid vehicle is given by Michael Tamor at Ford
Motor Company:
“A Hybrid vehicle is a conventionally fueled and operated vehicle that has
been equipped with a power train capable of implementing at least the first three of
the following four hybrid functions:
1) Engine shutdown when power demand is zero or negative.
2) Engine down-size for improved thermal efficiency
3) Regenerative braking for recovery and re-use of braking energy
4) Engine-off propulsion at low power (when engine is inefficient)”
A power train that fulfills at least the first three of the four functions above
can be composed in a number of different ways, where series hybrid, parallel hybrid
and variants of these are the most common. The ICE can be of different types, e.g.
Otto, Diesel, Stirling etc. The electric energy storage can also be of several different
types, like electro chemical (batteries), electro mechanical (flywheels) and electro
static (super capacitors). The electrical machines can also be of several different
types, although they are all rather alike in terms of efficiency (Andersson, 2001).
2.PRELIMINARY WORK Serpil AĞYEL
11
2.4.2. HEV Classifications by Power Source
There are many ways to classify hybrid electric vehicles. One way is based on
principal power sources. Two major principal power sources for HEV are ICE and
fuel cell system.
2.4.2.1. Internal Combustion Engine Based HEV
In an ICE based HEV, the engine is coupled with electric machine(s). This
modification creates integrated mechanical and electrical drive trains that merge
power from both the ICE and the electric motors to drive the vehicle. By using the
energy storage system as a power buffer, the ICE can be operated at its most efficient
condition and reduced in size while maintaining the overall performance of the
vehicle. In this type of vehicles, fossil fuel, however, is still the sole energy source to
the vehicle system, (except for plug-in HEV where electricity obtained from
electrical grid provides another power source). The charge of the battery is
maintained by the ICE and the electric machines. As a consequence of the reduced
engine size, more efficient engine operation, and recovered braking power, fuel
usage and emissions of the vehicle are considerably lower than comparable
conventional vehicles (Zhou, 2007).
2.4.2.2. Fuel cell Based HEV
A fuel cell hybrid electric vehicle operates solely on electric power. The fuel
cells continuously produce electrical power while energy storage devices buffer the
power flow in the electric power train. A fuel cell system is an electric power-
generating plant based on controlled electrochemical reactions of fuel and oxidant
[Carlson, Kopf and Sinha, 2005). In principle, fuel cells are more efficient in energy
conversion and produce zero emission. Due to many attractive features, such as low
operation temperature, compact structure, fewer corrosion concerns, and quick start-
2.PRELIMINARY WORK Serpil AĞYEL
12
up, the Proton Exchange Membrane (PEM) fuel cells serves as an ideal power plant
for automotive applications (Zhou, 2007).
2.4.3. HEV Classifications by Drivetrain Architectures
One of the most common ways to classify HEV is based on configuration of
the vehicle drivetrain. In this section, three major hybrid vehicle architectures
introduced are series, parallel and series-parallel. Until recently, many HEV in
production are either series or parallel. In terms of mechanical structure, these two
are primitive and relatively simple. A series-parallel powertrain brings in more
degrees of freedom to vehicle engine operation with added system complexity.
2.4.3.1. Series hybrid
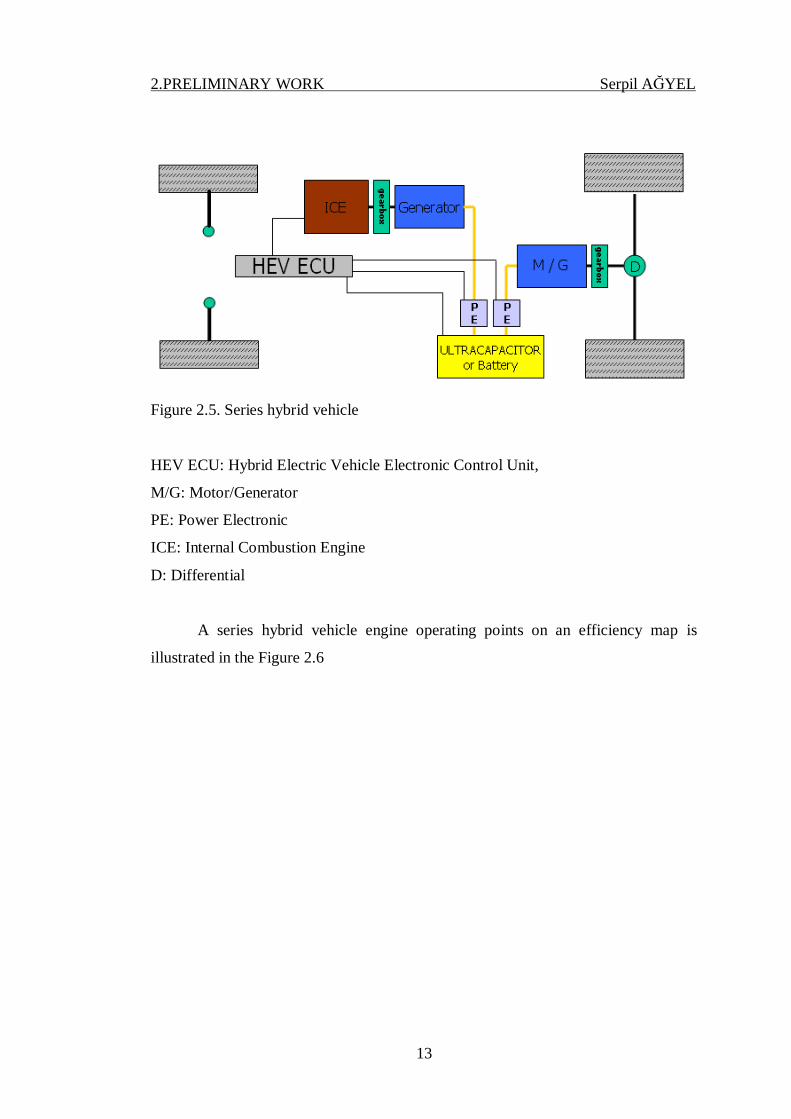
The buses in the project are series hybrids. In this combination of the hybrid
vehicles electrical machines supply all the tractive energy and there are no
mechanical connections between the ICE and the wheels. The ICE drives a generator
that charges the battery and supplies the traction motor with power, as shown in
Figure 2.5 An advantage is that the ICE can be switched off when driving the vehicle
in no-emission zones. The working point of the ICE (speed and torque) can also be
chosen freely when running the ICE. (van Mierlo, 1999).
A drawback is that the prime energy from the ICE has to pass two electrical
machines and power electronics on its way to the wheels. This makes the system
efficiency relatively low. The energy may also have to be stored in a battery, which
further reduces the system efficiency. Another drawback is that the traction motors
have to be able to convert the peak traction power.
An electrical vehicle supplied with a small ICE and generator as a range
extender can be considered a simple series hybrid vehicle. Most of the existing
hybrid buses are series hybrids. One reason is the way they run with many starts and
stops. Another reason is that electric wheel motors do not need a rear axis; this
makes it possible to design the bus with a low floor even in the back.
2.PRELIMINARY WORK Serpil AĞYEL
13
Figure 2.5. Series hybrid vehicle
HEV ECU: Hybrid Electric Vehicle Electronic Control Unit,
M/G: Motor/Generator
PE: Power Electronic
ICE: Internal Combustion Engine
D: Differential
A series hybrid vehicle engine operating points on an efficiency map is
illustrated in the Figure 2.6

2.PRELIMINARY WORK Serpil AĞYEL
14
Figure 2.6. Series hybrid vehicle engine operating region (He, Parten and Maxwell, 2005)
The fact that the engine can operate in its most efficient region compensates
the energy conversion losses and results fuel economy improvement that is
significant in the city and moderate on the highway. The design also offers
regenerative braking to capture the braking energy and store it in the battery instead
of wasting it on the brake disks in the form of heat.
The hardware of the series hybrids is more expensive than the hardware of
EV or conventional vehicles because it requires two electric machines and an engine.
In addition to that its control of it is more complicated than the control of electric and
conventional vehicles.
The control strategy is developed in such a fashion that the battery is always
charged on board, and thus the driving distance is never limited by the life of the
battery. As mentioned previously, the capacity of the battery is the biggest
disadvantage of the electric vehicle and by charging the batteries on board, this
disadvantage is eliminated. The control strategy, which causes the engine to run at a
2.PRELIMINARY WORK Serpil AĞYEL
15
desired torque and speed condition, is also supposed to ensure that the battery
remains charged to a certain level at all time.
When large amounts of power are required, the motor draws electricity from
both the electrical energy storage and the generator. A transmission is not needed at
all. Some vehicle designs have separate electric motors for each wheel. Series
hybrids can also be fitted with an ultracapacitor to store regenerative braking energy,
which can improve efficiency by minimizing the losses due to high power
transmission.
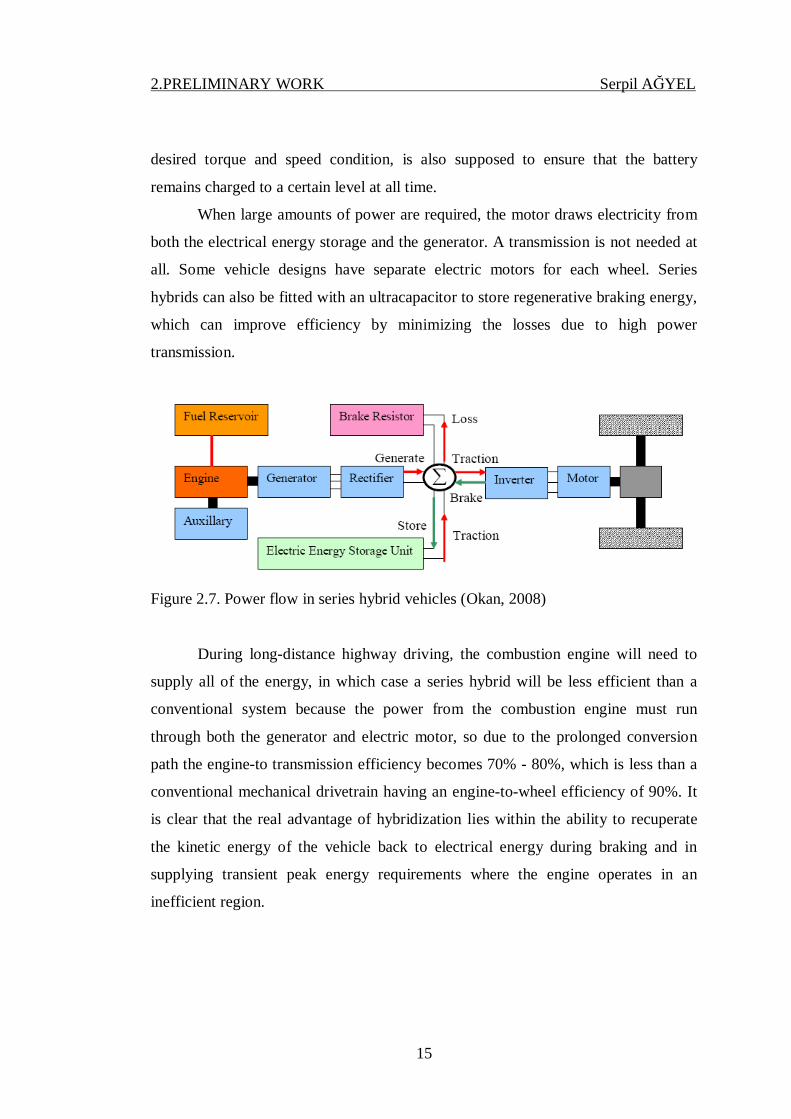
Figure 2.7. Power flow in series hybrid vehicles (Okan, 2008)
During long-distance highway driving, the combustion engine will need to
supply all of the energy, in which case a series hybrid will be less efficient than a
conventional system because the power from the combustion engine must run
through both the generator and electric motor, so due to the prolonged conversion
path the engine-to transmission efficiency becomes 70% - 80%, which is less than a
conventional mechanical drivetrain having an engine-to-wheel efficiency of 90%. It
is clear that the real advantage of hybridization lies within the ability to recuperate
the kinetic energy of the vehicle back to electrical energy during braking and in
supplying transient peak energy requirements where the engine operates in an
inefficient region.

2.PRELIMINARY WORK Serpil AĞYEL
16
2.4.3.2. Parallel Hybrid
The parallel hybrid is another HEV type that has been closely studied. In
parallel configurations, both the engine and the motor provide traction power to the
wheels, which means that the hybrid power is summed at a mechanical node to
power the vehicle. As a result, both of the engine and the motors can be downsized,
making the parallel architecture more viable with lower costs and higher efficiency.
Some early developments of parallel hybrid vehicles include the BMW 518, Citroën
Xzara Dynactive and Saxo Dynavolt, Daimler-Chrysler ESX 3, Fiat Multipla, and
the Ford Multiplia and P2000 Prodigy (Westbrook, 2001).
The parallel hybrid vehicles usually use the same gearboxes of the
counterpart conventional vehicles, either in automatic or manual transmissions.
Based on where the gearbox is introduced in the powertrain, there are two typical
parallel HEV architectures, named pre-transmission parallel and post-transmission
parallel, as shown in Figure 2.9 and Figure 2.10, respectively.
In a pre-transmission parallel HEV, the gearbox is located on the main drive
shaft after the torque coupler. Hence, gear speed ratios apply on both the engine and
the electric motor. The power flow is summed at the gearbox. On the other hand, in a
post-transmission parallel hybrid, the gearbox is located on the engine shaft prior to
the torque coupler. The gearbox speed ratios only apply on the engine. A continuous
variable transmission (CVT) can be used to replace conventional gearbox to further
improve the engine efficiency.
2.PRELIMINARY WORK Serpil AĞYEL
17
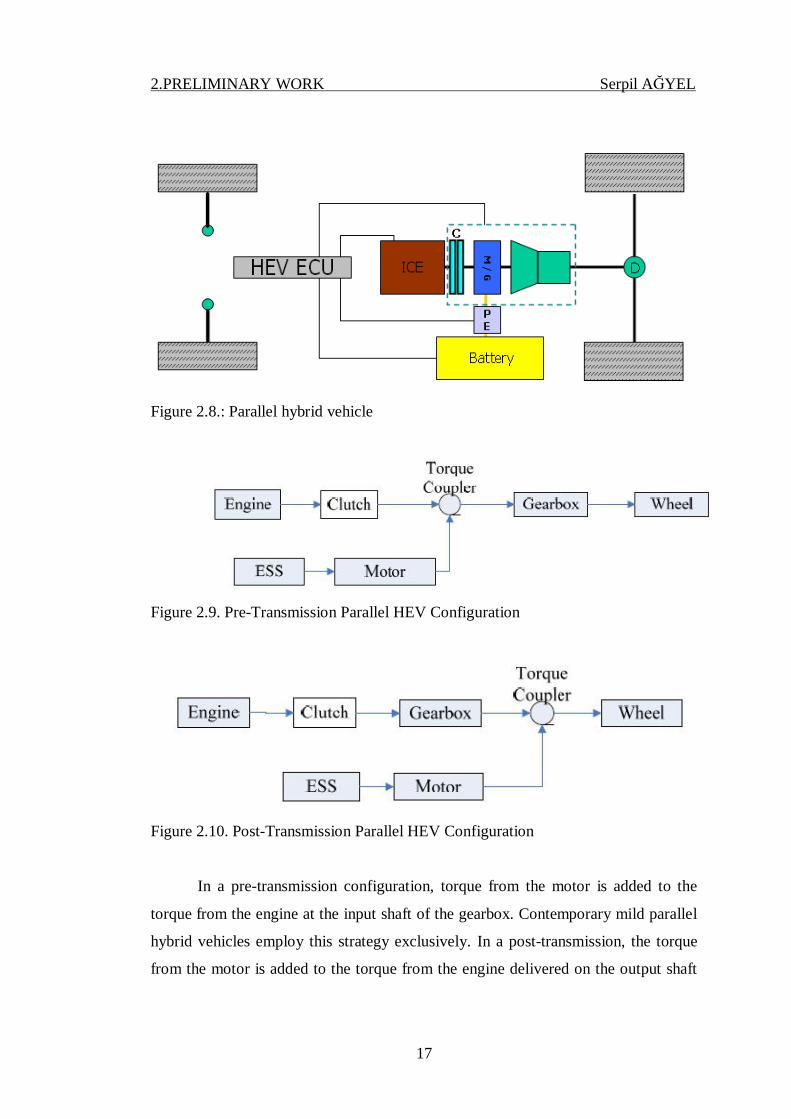
Figure 2.8.: Parallel hybrid vehicle
Figure 2.9. Pre-Transmission Parallel HEV Configuration
Figure 2.10. Post-Transmission Parallel HEV Configuration
In a pre-transmission configuration, torque from the motor is added to the
torque from the engine at the input shaft of the gearbox. Contemporary mild parallel
hybrid vehicles employ this strategy exclusively. In a post-transmission, the torque
from the motor is added to the torque from the engine delivered on the output shaft
2.PRELIMINARY WORK Serpil AĞYEL
18
of the gearbox. A disconnect device such as a clutch is used to disengage the gearbox
while running the motor independently (Miller, 2004).
Post-transmission electric hybrids can also be used in hybrid vehicles with a
higher degree of hybridization. Hydraulic power can be used on launch-assist devices
in heavy-duty trucks and commercial vehicles.
There are attempts from different perspectives to improve the operation of a
parallel HEV. One possibility is to run the vehicle on electric machine alone in city
driving while running engine power alone on highways. Most contemporary parallel
vehicles use a complex control system and special algorithms to optimize both
vehicle performance and range. The flexibility in powertrain design, in addition to
the elimination of the need for a large motor, of parallel hybrids has attracted more
interest in HEV development than the series hybrids.
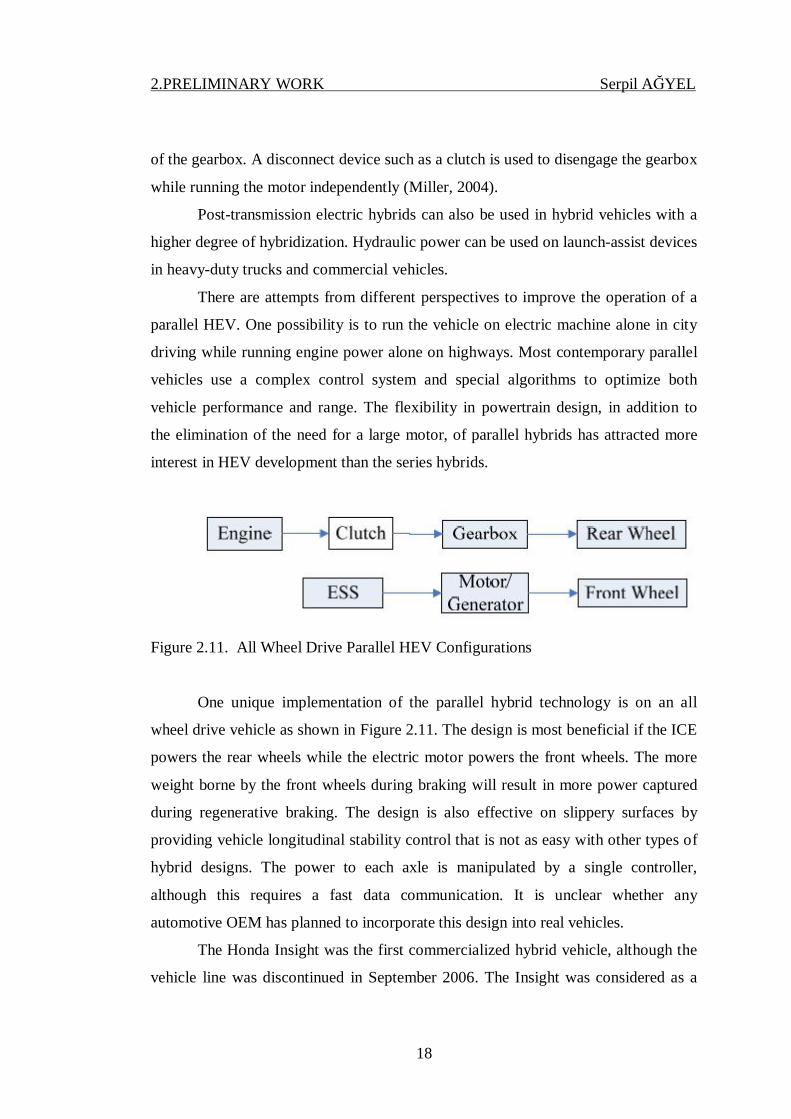
Figure 2.11. All Wheel Drive Parallel HEV Configurations
One unique implementation of the parallel hybrid technology is on an all
wheel drive vehicle as shown in Figure 2.11. The design is most beneficial if the ICE
powers the rear wheels while the electric motor powers the front wheels. The more
weight borne by the front wheels during braking will result in more power captured
during regenerative braking. The design is also effective on slippery surfaces by
providing vehicle longitudinal stability control that is not as easy with other types of
hybrid designs. The power to each axle is manipulated by a single controller,
although this requires a fast data communication. It is unclear whether any
automotive OEM has planned to incorporate this design into real vehicles.
The Honda Insight was the first commercialized hybrid vehicle, although the
vehicle line was discontinued in September 2006. The Insight was considered as a
2.PRELIMINARY WORK Serpil AĞYEL
19
test vehicle to gauge public opinion on hybrid technology, and the 18,000 USD price
tag is estimated to be 10,000 USD less than the actual production cost (Westbrook,
2001). Despite the cost distortion, the Insight never became a commercial success
largely because of its two-seater format. Honda has promised a replacement to arrive
in 2009 (Jong-Seob, Langari, and Ehsani, 2005)
The Insight is a mild-hybrid, with the electric motor being the key to the
Integrated Motor Assist (IMA) technology that boosts the engine power. The engine
is an inline 3 cylinders 0.995 litre gasoline engine that delivers 50 kW peak power at
5700 rpm, and 89 N.m peak torque at 4800 N.m with a manual transmission. When
the IMA system is activated, these numbers rise to 54.4 kW and 107 N.m for the
manual transmission and 53 kW and 121 N.m for the CVT. The electric motor is a
permanent magnet machine that supplies 10.4 kW of power at 3,000 rpm with a
manual transmission, and 9.7 kW of power at 2,000 rpm in a CVT model. The ESS
consists of 120 cells of Nickel Metal Hydride (Ni-MH) batteries of 1.2 V each, for a
total voltage of 144 V with a rated capacity of 6.0 Ah. The schematic of the Insight is
similar to Figure 2.9 on a pre-transmission parallel HEV.
2.4.3.3. Power Split Hybrid
It is possible to combine the advantages of parallel and series hybrid vehicle
(Stridsberg, 1998) or by using a planetary gearbox (Kimura, 1999), as illustrated in
Figure 2.12. Such a constellation uses two electrical machines and one ICE in
connection to a planetary gearbox.

2.PRELIMINARY WORK Serpil AĞYEL
20
Figure 2.12. Complex hybrid vehicle
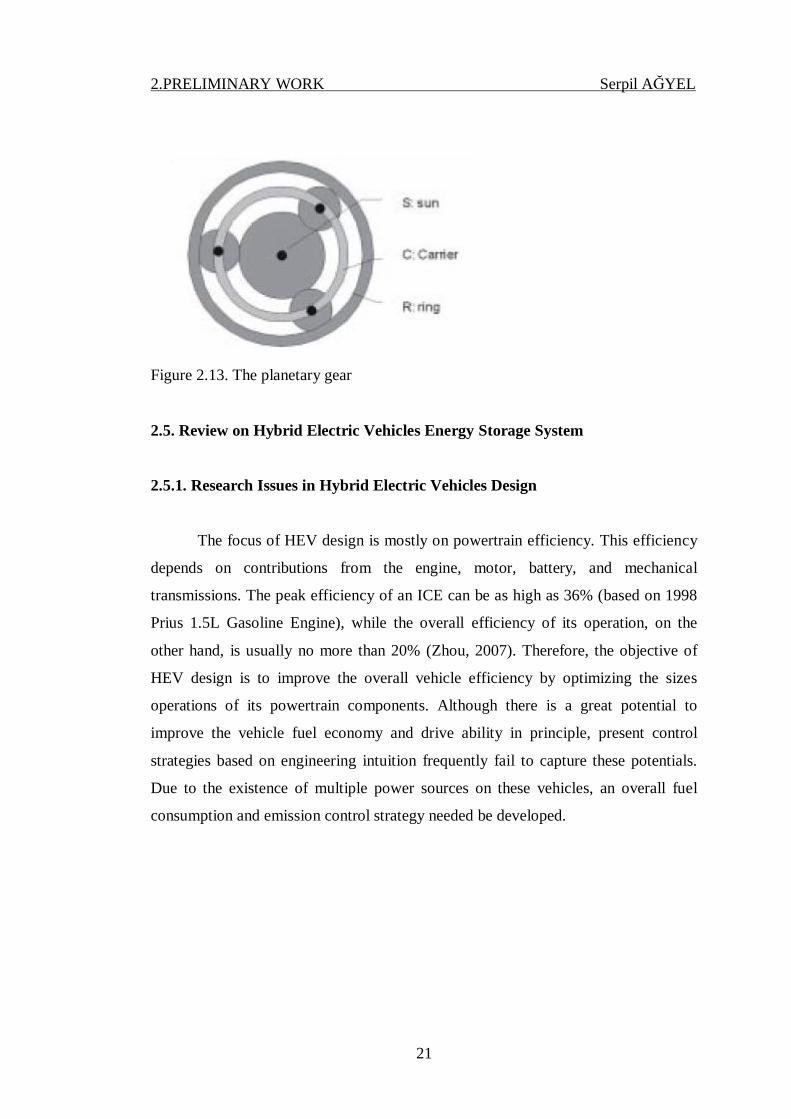
In the complex (power split) hybrids the ICE is connected to the planet carrier
wheel, see Figure 2.13. The output axis is connected to the ring wheel. The electrical
machines are connected to the solar wheel as well as the ring wheel. Both electrical
machines are connected via separate power electronics to the battery. If the
components in the drive train are well designed this technique allows the ICE to
operate at optimal torque and speed for best efficiency. Only at one specific speed all
the power from the ICE goes directly to the wheels and it acts like a parallel hybrid.
In all other cases it acts more or less like the series hybrid. The choice of
configuration depends on what performance the vehicle is designed for, and which
complexity that is desired for the drive train.
The first passenger car in series production with this type of gearbox was
Toyota Prius, with a 44 kW ICE and a 30 kW electrical motor, produced in 1998
(Hellman, Peralta and Piotrowski, 1998).
2.PRELIMINARY WORK Serpil AĞYEL
21
Figure 2.13. The planetary gear
2.5. Review on Hybrid Electric Vehicles Energy Storage System
2.5.1. Research Issues in Hybrid Electric Vehicles Design
The focus of HEV design is mostly on powertrain efficiency. This efficiency
depends on contributions from the engine, motor, battery, and mechanical
transmissions. The peak efficiency of an ICE can be as high as 36% (based on 1998
Prius 1.5L Gasoline Engine), while the overall efficiency of its operation, on the
other hand, is usually no more than 20% (Zhou, 2007). Therefore, the objective of
HEV design is to improve the overall vehicle efficiency by optimizing the sizes
operations of its powertrain components. Although there is a great potential to
improve the vehicle fuel economy and drive ability in principle, present control
strategies based on engineering intuition frequently fail to capture these potentials.
Due to the existence of multiple power sources on these vehicles, an overall fuel
consumption and emission control strategy needed be developed.
2.PRELIMINARY WORK Serpil AĞYEL
22
2.5.2. Energy Storage System
2.5.2.1. Sizing Considerations of Energy Storage System
For different types of vehicle technology, the electrical energy storage system
(ESS) is utilized differently. HEV are classified into three categories following the
types of power source: electric vehicles (EV), hybrid electric vehicles (HEV), and
plug in hybrid electric vehicles (PHEV). An EV uses ESS as the sole energy source.
Technically an EV would not be considered as a HEV; it is discussed here in order to
compare with the other two types. The ESS on an EV, usually a battery pack, is only
charged from grid electricity except for during regenerative braking. The vehicle
range with one charge is directly related to the energy capacity of the ESS. A HEV
on the other hand, has more than one energy sources. The ICE or FC is usually
hybridized with an ESS on a HEV. The ESS would be charged by the ICE or FC
during the vehicle operation according to power demand, and no external power
source is necessary to charge the ESS. A plug-in hybrid electric vehicle is also a
HEV with its ESS being charged either by the on board power source, such as ICE
and FC, or the stationary grid power.
In HEVs, the size of the ESS is determined to provide sufficient energy
storage (kWh) capacity and adequate peak power (kW) ability. In addition,
appropriate cycle life and hardware cost have to be considered. The size requirement
of ESS varies significantly depending on the characteristics of different vehicle’s
powertrains (EV, HEV and PHEV) (Balch, Burke, and Frank, 2001). This
requirement can be obtained once the vehicle is specified and the performance target
is established. However, what is less straightforward and more challenging is to find
an optimal ESS design that would satisfy the special characteristics of vehicle power
requirements. Normally, energy storage units are primarily sized by either the energy
or power capability. Charging-discharging efficiency is also considered. In this
study, a comparison of the performance characteristics (Wh/kg, Wh/L, W/kg etc.) of
various energy storage technologies for different vehicle power requirements is made
to guide the ESS design.
2.PRELIMINARY WORK Serpil AĞYEL
23
2.5.2.2. ESS Power and Capacity Rating
ESS can consist of various types of batteries, ultracapacitors, and their
combinations.
An expression 2 / 4peak oP V R= is commonly used to rate the peak power of
the battery, where oV is the nominal voltage of the battery and R is the battery’s
internal resistance. The efficiency at the peak power of the battery is relatively low
(close to 50%). A generic expression of battery power and efficiency is given by the
following equation
( ) 21 /peak oP EF V Rη= × − × (2.1)
where η is the efficiency at peak power pulse. It is assumed that the peak power
occurs when peak oV V η= × . For an efficiency of 85%, the peak power will be
reduced by 1/2 from the peak power at lower efficiency.
Ultracapacitors are also sized by power and energy. Energy storage capacity
(Wh) is usually used to size ultracapacitors due to their low specific energy (5-10
Wh/kg). The useable peak power from an ultracapacitor is given by Eq. (3.2):
( ) 29 /16 1 /peak oP V Rη= × − × (2.2)
The peak power occurs at a voltage of 3/ 4 oV , where / 3 / 4peak oI P V= . As
internal resistance of an ultracapacitor is considerably lower than that of a battery,
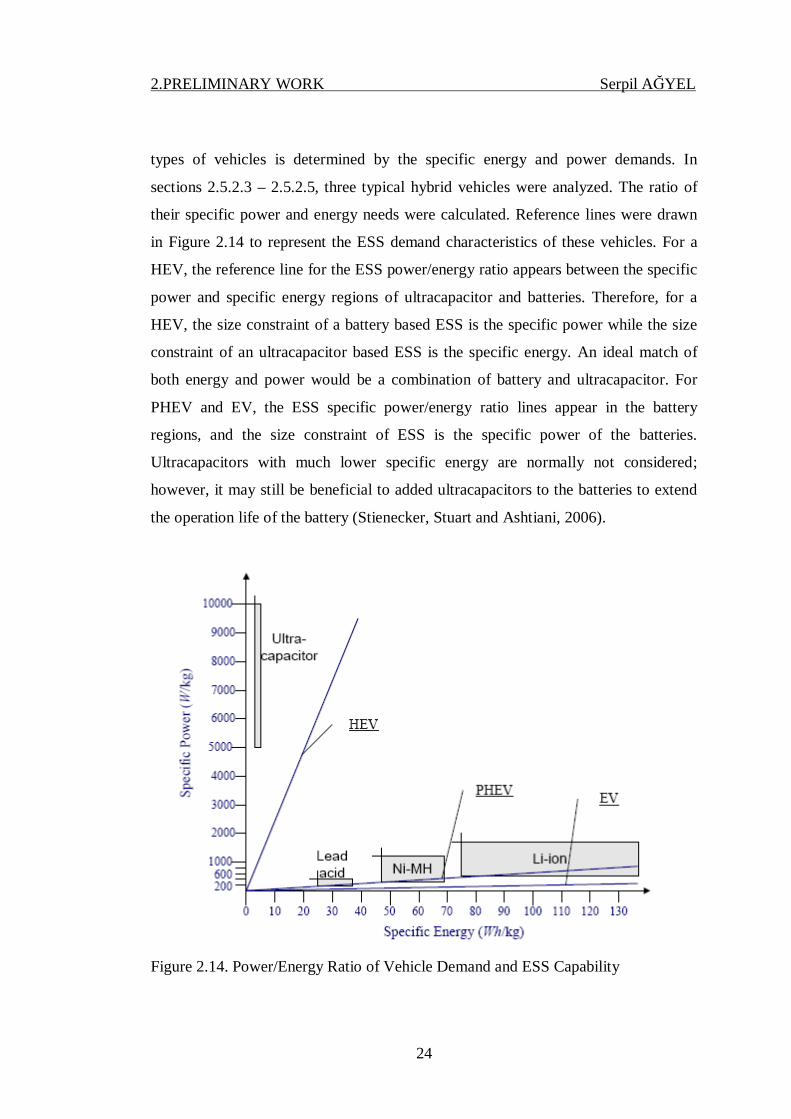
the peak power is much higher. Figure 2.14 shows specific power and energy of the
most popularly used energy storage devices, including lead acid batteries, Ni-MH
batteries, Li-ion batteries and ultracapacitors. With the differences of battery
chemistry, there are tradeoffs between energy density and power density.
The specific energy and power of the batteries thus vary over a range, as
illustrated by the shaded area shown in Figure 2.14. The size of ESS on different
2.PRELIMINARY WORK Serpil AĞYEL
24
types of vehicles is determined by the specific energy and power demands. In
sections 2.5.2.3 – 2.5.2.5, three typical hybrid vehicles were analyzed. The ratio of
their specific power and energy needs were calculated. Reference lines were drawn
in Figure 2.14 to represent the ESS demand characteristics of these vehicles. For a
HEV, the reference line for the ESS power/energy ratio appears between the specific
power and specific energy regions of ultracapacitor and batteries. Therefore, for a
HEV, the size constraint of a battery based ESS is the specific power while the size
constraint of an ultracapacitor based ESS is the specific energy. An ideal match of
both energy and power would be a combination of battery and ultracapacitor. For
PHEV and EV, the ESS specific power/energy ratio lines appear in the battery
regions, and the size constraint of ESS is the specific power of the batteries.
Ultracapacitors with much lower specific energy are normally not considered;
however, it may still be beneficial to added ultracapacitors to the batteries to extend
the operation life of the battery (Stienecker, Stuart and Ashtiani, 2006).
Figure 2.14. Power/Energy Ratio of Vehicle Demand and ESS Capability
2.PRELIMINARY WORK Serpil AĞYEL
25
2.5.2.3. ESS for an Electric Vehicle
The focus of an EV design tends to be the acceptable range with a single
charge. Therefore, the ESS is sized to meet the designed range of the vehicle. For
battery powered vehicles, the size of batteries is determined by its energy
requirements (kWh/kg) as power requirements (kW/kg) can be easily satisfied for a
reasonable vehicle acceleration performance need. The load cycles of batteries on an
EV are usually deep discharging and charging. The shortened life of deeply
discharged battery is a major consideration since the minimum battery life has to be
satisfied.
Battery charging time is another major consideration as this time is
significantly longer than refilling a gasoline tank. An alternative is to replace the
discharged battery pack with a fully charged one at a battery station with a
reasonable cost of service charge. However, certain challenges arise for battery
replacement such as weight and volume, especially for the heavier and bulkier lead-
acid batteries. Meanwhile, ultracapacitors are not likely to be employed in EV at
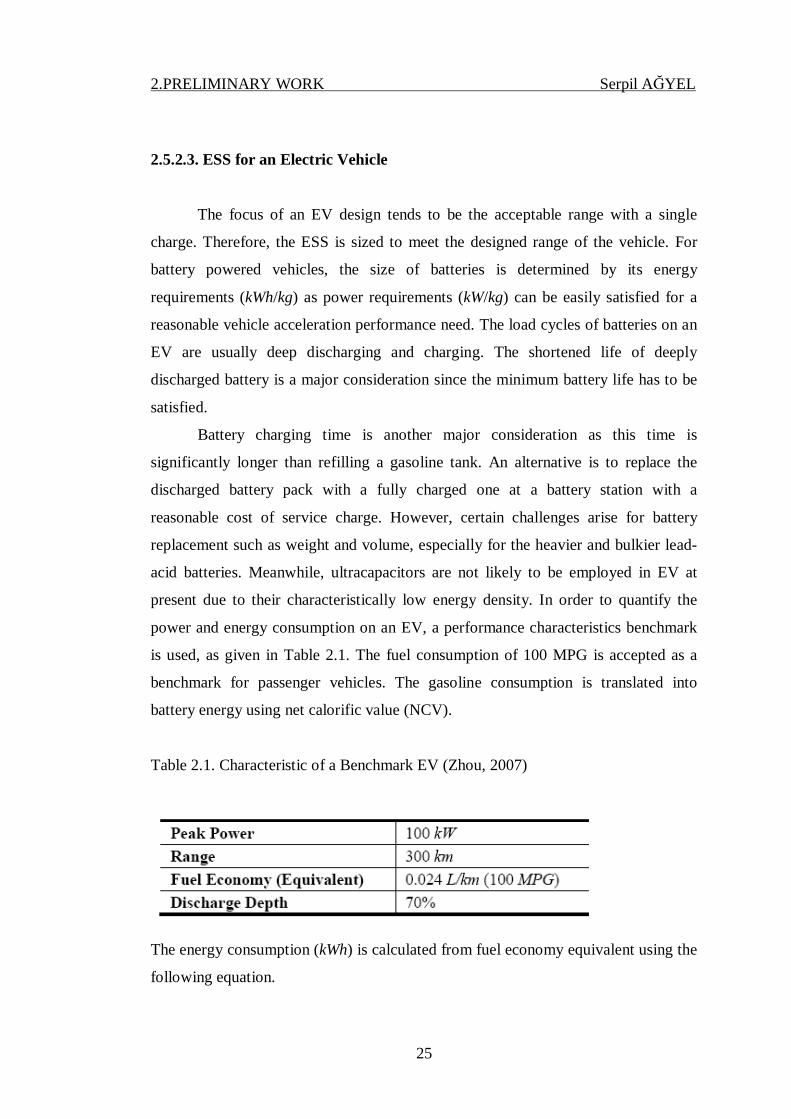
present due to their characteristically low energy density. In order to quantify the
power and energy consumption on an EV, a performance characteristics benchmark
is used, as given in Table 2.1. The fuel consumption of 100 MPG is accepted as a
benchmark for passenger vehicles. The gasoline consumption is translated into
battery energy using net calorific value (NCV).
Table 2.1. Characteristic of a Benchmark EV (Zhou, 2007)
The energy consumption (kWh) is calculated from fuel economy equivalent using the
following equation.

2.PRELIMINARY WORK Serpil AĞYEL
26
300 0.024 / 0.73 / 42,900 / 891 3600 / 0.70
km L km kg L kJ kgE kWhW s hr
× × ×= ≈
× × (2.3)
As a result, an ideal energy/power ratio of 0.89 (89 kWh/100 kW) or lower
(for longer ranged) is necessary for an EV. A reference line for the EV was drawn in
Figure 2.14. It is shown that all types of batteries are able to satisfy this power
demand with the requested energy capacity. The main criterion for sizing an EV is
energy rather than power capability. For EV applications the objective should be to
develop batteries with high energy density and acceptable power density. The weight
and capability of batteries for EV are shown in Table 2.2. As battery power is mostly
sufficient for vehicle power demand, ultracapacitors are unlikely needed to boost
power.
Table 2.2. ESS Sizing for a Benchmark EV (Zhou, 2007)
2.5.2.4. ESS for a Hybrid Electric Vehicle
For a hybrid electric vehicle (HEV) using either an engine or fuel cells as the
primary energy source, the ESS is sized differently depending on the degree of
hybridization (DOH) and power management strategy of the vehicle. As the
operation cycles of ESS on a HEV are significantly longer than on an EV, the life of
ESS therefore will be a main concern. One approach to extend battery life is
“shallow charging” which confines the battery operation at relatively narrow state-
of-charge range (5%-10%). Reference (Karden, 2007) showed shallow cycle life can
be greatly enhanced to satisfy consumer expectation on a HEV. Even though not
2.PRELIMINARY WORK Serpil AĞYEL
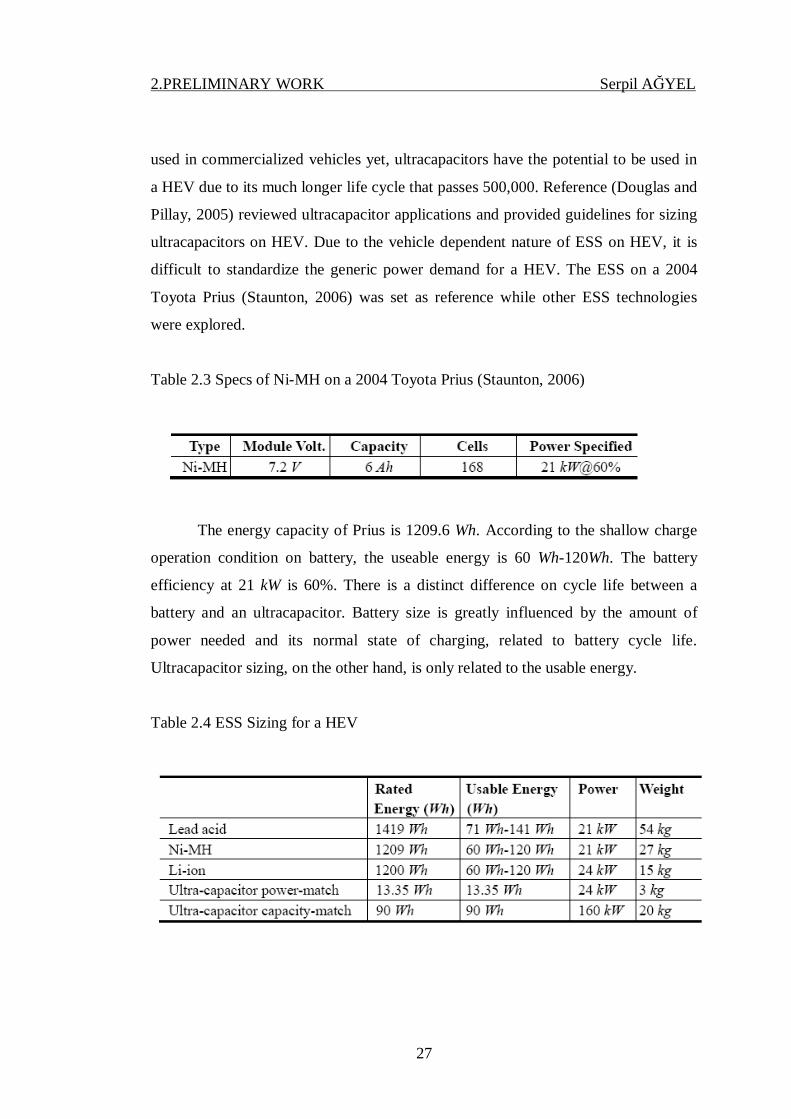
27
used in commercialized vehicles yet, ultracapacitors have the potential to be used in
a HEV due to its much longer life cycle that passes 500,000. Reference (Douglas and
Pillay, 2005) reviewed ultracapacitor applications and provided guidelines for sizing
ultracapacitors on HEV. Due to the vehicle dependent nature of ESS on HEV, it is
difficult to standardize the generic power demand for a HEV. The ESS on a 2004
Toyota Prius (Staunton, 2006) was set as reference while other ESS technologies
were explored.
Table 2.3 Specs of Ni-MH on a 2004 Toyota Prius (Staunton, 2006)
The energy capacity of Prius is 1209.6 Wh. According to the shallow charge
operation condition on battery, the useable energy is 60 Wh-120Wh. The battery
efficiency at 21 kW is 60%. There is a distinct difference on cycle life between a
battery and an ultracapacitor. Battery size is greatly influenced by the amount of
power needed and its normal state of charging, related to battery cycle life.
Ultracapacitor sizing, on the other hand, is only related to the usable energy.
Table 2.4 ESS Sizing for a HEV

2.PRELIMINARY WORK Serpil AĞYEL
28
In this case, power demand can be easily satisfied. The result of the Prius
example shown in Figure 2.14 used the same energy power ratio as that of the EV.
Ideally, a combination of battery and ultracapacitor will reach a point at which both
power and energy can be satisfied simultaneously. Table 2.5 shows a combination of
batteries and ultracapacitors which reaches the same performance characteristics with
much lower weight.
Table 2.5. UC-battery Hybrid ESS for Prius 1 (Zhou, 2007)
2.5.2.5. ESS for a Plug-in Hybrid Electric Vehicle
The only difference of a PHEV from the HEV is its larger battery that allows
energy to be charged from grid electricity. In addition to the power and energy
demand of a HEV, additional ESS capacity requirement depends on its “all electric
range” (AER). However, sizing the ESS for a PHEV is more complex for several
reasons. First, in the AER, not only the energy but also the power is a concern, since
the battery is the only source of power for most operations. Secondly, battery life is
affected by the depths of charge and discharge. The depth of discharge on a PHEV is
far more than that of a HEV with limited, shallow discharges. It is therefore more
difficult to satisfy energy and power requirements with a reasonable life expectancy
of the ESS. More detailed power and energy requirement on a parallel PHEV is
discussed in (Markel and Simpson, 2005). To further explore the ESS characteristics
of a PHEV, a hypothetical PHEV based on Prius is used.
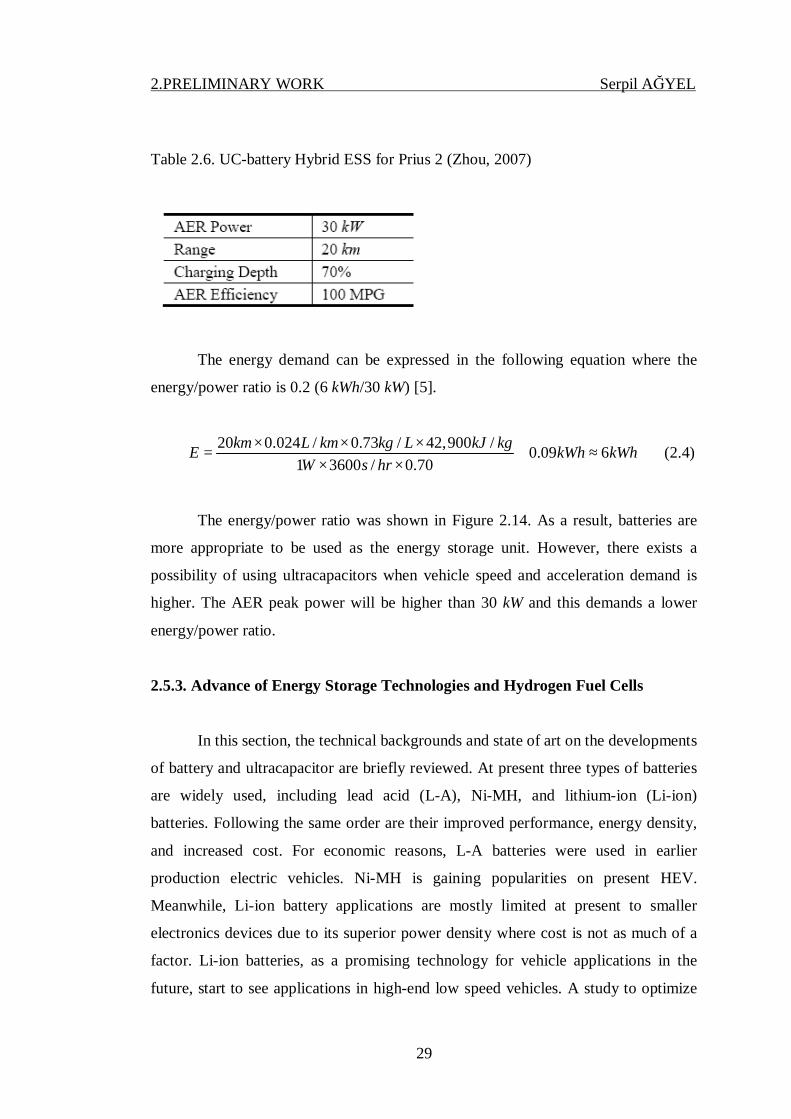
The AER power is confined at 30 kW which allows limited speed and
acceleration.
2.PRELIMINARY WORK Serpil AĞYEL
29
Table 2.6. UC-battery Hybrid ESS for Prius 2 (Zhou, 2007)
The energy demand can be expressed in the following equation where the
energy/power ratio is 0.2 (6 kWh/30 kW) [5].
20 0.024 / 0.73 / 42,900 / 0.09 61 3600 / 0.70
km L km kg L kJ kgE kWh kWhW s hr
× × ×= + ≈
× × (2.4)
The energy/power ratio was shown in Figure 2.14. As a result, batteries are
more appropriate to be used as the energy storage unit. However, there exists a
possibility of using ultracapacitors when vehicle speed and acceleration demand is
higher. The AER peak power will be higher than 30 kW and this demands a lower
energy/power ratio.
2.5.3. Advance of Energy Storage Technologies and Hydrogen Fuel Cells
In this section, the technical backgrounds and state of art on the developments
of battery and ultracapacitor are briefly reviewed. At present three types of batteries
are widely used, including lead acid (L-A), Ni-MH, and lithium-ion (Li-ion)
batteries. Following the same order are their improved performance, energy density,
and increased cost. For economic reasons, L-A batteries were used in earlier
production electric vehicles. Ni-MH is gaining popularities on present HEV.
Meanwhile, Li-ion battery applications are mostly limited at present to smaller
electronics devices due to its superior power density where cost is not as much of a
factor. Li-ion batteries, as a promising technology for vehicle applications in the
future, start to see applications in high-end low speed vehicles. A study to optimize
2.PRELIMINARY WORK Serpil AĞYEL
30
the cost and performance of batteries, considering three different vehicles, three
types of batteries, and three powertrains was carried by (Balch, Burke and Frank,
2001). As an energy storage device, batteries have a number of drawbacks, including
large size, limited power density, thermal impact, low efficiency, long charging time
and relatively short life. A summary of battery characteristics for EV applications is
shown in Table 2.7. The data was gathered from a number of sources (Ito and
Ohnishi, 2003; Horiba, 2005; Taniguchi, 2001).
2.5.3.1. Sealed Lead Acid Battery (SLA)
The sealed lead acid battery is the most common battery currently been used
to power electric bicycles, mainly due to its low cost per watt-hour. The SLA battery
is also very robust and durable when used properly. The self-discharge rate of the
SLA battery is also low, only losing ~5% of its charge per month if not used. The
SLA battery does not have a memory effect like the NiCad battery. Problems with
the SLA battery include low power and energy densities, and potential environmental
impact, where the lead electrodes and electrolyte can cause environmental harm if
not disposed properly at a recycling facility.
2.5.3.2. Nickel Metal Hydride Battery (Ni-MH)
The Ni-MH battery is the most widely used battery to power electric
automobiles at present. The Ni-MH battery has a higher energy density than a SLA
battery. Its specific energy (Wh/kg) can be up to four times that of a SLA battery; and
40% higher than Ni-Cad battery. The battery is also relatively environmentally
friendly, as it contains very mild toxic materials that can be easily recycled. The
main problem with the Ni-MH battery pack is its higher cost than a SLA battery
pack. It also takes longer time to charge a Ni-MH than a SLA or NiCad battery and
generates a large amount of heat during charging. It is also more difficult to
determine when the Ni-MH battery is fully charged than with a SLA or NiCad
battery, resulting in the need for more complicated and expensive chargers. The
2.PRELIMINARY WORK Serpil AĞYEL
31
recent effort of improving Ni-MH for HEV applications has been focused on
reducing the resistance and increasing the power capability. The trade-off will likely
be a lower energy density than those used on an EV (Karden, 2007).
2.5.3.3. Lithium Ion Battery (Li-ion)
Many automotive companies are in the process of developing advanced Li-
ion battery technologies for vehicle related applications. Much interest is focused on
high power batteries for HEV and high energy batteries for EV. For example, a
lithium-ion battery for EV will have a specific energy up to 150 Wh/kg and that of a
Ni-MH battery will be 70 Wh/kg. The major concern of using Li-ion battery on a
hybrid vehicle is the over-heating problem during recharging (Congress, 2007).
2.PRELIMINARY WORK Serpil AĞYEL
32
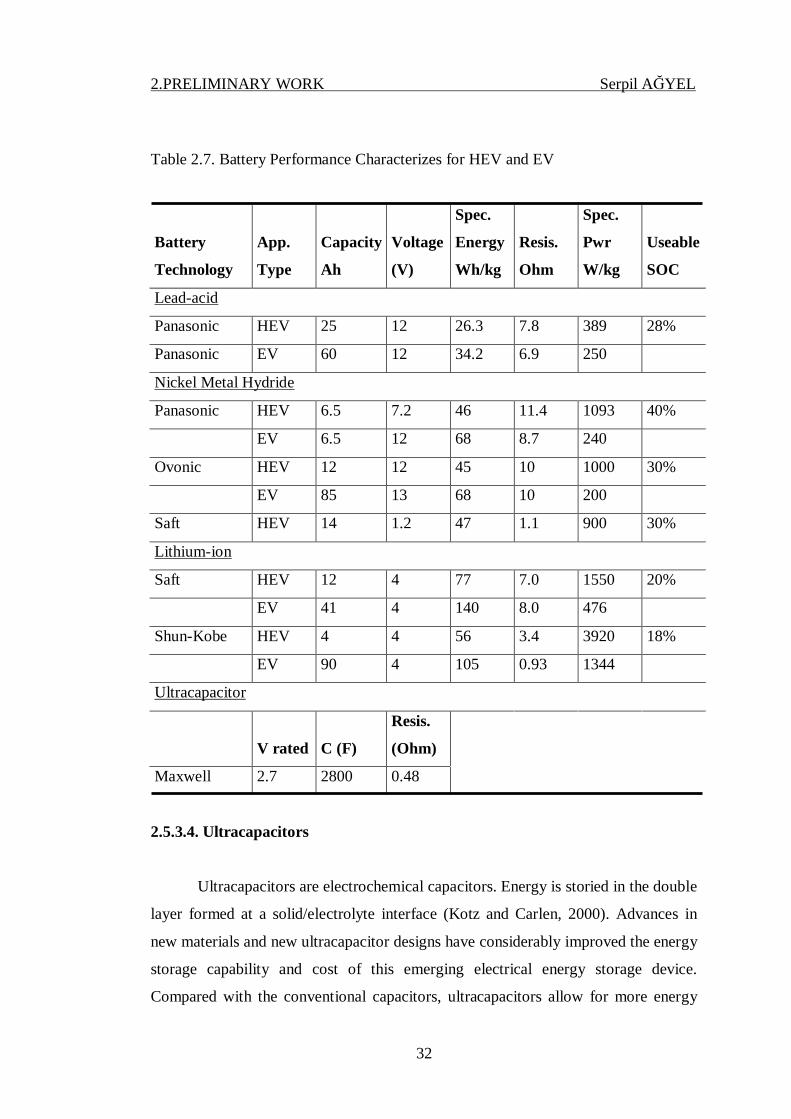
Table 2.7. Battery Performance Characterizes for HEV and EV
Battery
Technology
App.
Type
Capacity
Ah
Voltage
(V)
Spec.
Energy
Wh/kg
Resis.
Ohm
Spec.
Pwr
W/kg
Useable
SOC
Lead-acid
Panasonic HEV 25 12 26.3 7.8 389 28%
Panasonic EV 60 12 34.2 6.9 250
Nickel Metal Hydride
Panasonic HEV 6.5 7.2 46 11.4 1093 40%
EV 6.5 12 68 8.7 240
Ovonic HEV 12 12 45 10 1000 30%
EV 85 13 68 10 200
Saft HEV 14 1.2 47 1.1 900 30%
Lithium-ion
Saft HEV 12 4 77 7.0 1550 20%
EV 41 4 140 8.0 476
Shun-Kobe HEV 4 4 56 3.4 3920 18%
EV 90 4 105 0.93 1344
Ultracapacitor
V rated C (F)
Resis.
(Ohm)
Maxwell 2.7 2800 0.48
2.5.3.4. Ultracapacitors
Ultracapacitors are electrochemical capacitors. Energy is storied in the double
layer formed at a solid/electrolyte interface (Kotz and Carlen, 2000). Advances in
new materials and new ultracapacitor designs have considerably improved the energy
storage capability and cost of this emerging electrical energy storage device.
Compared with the conventional capacitors, ultracapacitors allow for more energy
2.PRELIMINARY WORK Serpil AĞYEL
33
storage for a factor of 20 times (Rufer and Barrade, 2001). Other unique
characteristics of ultracapacitors include maintenance-free operation, longer
operation cycle life, and insensitivity to environment temperature variation. The
energy density of ultracapacitors is still limited compared with batteries. The goal for
ultracapacitor development is a specific energy of 5 Wh/kg for high power discharge
(Arulepp, 2006). Carbon-carbon ultracapacitor devices are commercially available
from several companies, including Maxwell, Ness, and EPCOS. The capacitance of
their products ranges from 1000-5000 F.
An experimental test was carried on a series hybrid Ford Escort with and
without ultracapacitors as load-leveling devices for the batteries (Anstrom, 2005).
Simulations of a series hybrid bus on the same test were also carried out on PSAT
using data validated from the tests. Both experimental and simulation results suggest
significant reduction to the RMS and peak battery currents.
A method for determine the size of batteries and ultracapacitors on a fuel cell
powered SUV was presented in (Schupbach, 2003). The peak-to-average ratio was
introduced as the sizing criteria. An optimization tool in ADVISOR is used to obtain
the results. Cost analysis was also carried out. Life cycle was not considered in the
study.
2.5.3.5. Hydrogen Fuel Cells
A fuel cell system is an electric power-generating device based on controlled
electrochemical reaction of hydrogen fuel and oxidant air (Carlson, Kopf and Sinha,
2005). In principle, fuel cells are more efficient in energy conversion and much
cleaner than ICE. Due to many attractive features, such as low operation temperature,
compact structure, less corrosion concern and quick start time, the Proton Exchange
Membrane (PEM) fuel cells serve as an ideal power plant for automotive
applications. Dozens of fuel cells are bundled together to form a modular power unit,
the fuel cells stack. To satisfy the need of power on a vehicle, multiple fuel cells
stacks are connected in series. Together with various ancillary devices, fuel cells
stacks form a fuel cell power system. Over the last decades, extensive efforts have

2.PRELIMINARY WORK Serpil AĞYEL
34
been devoted to improve the performance of fuel cell system and to lower its costs.
There is also an interest in using fuel cells to build uninterrupted power systems
(UPS). Since a fuel cell system is a capable energy conversion device, rather than an
energy storage device as battery and ultracapacitor, it can continuously provide
electric power as long as the hydrogen fuel is provided, either in the form of pure
hydrogen, or reformed natural gas. This unique capability, plus its quiet operation,
zero emission and high efficiency, makes it a promising alternative to the ICE.
One weakness of a fuel cell system is its slow dynamic response to power
demand. According to an experiment (Santi, 2002), at the initial start-up, it takes 90
seconds for the fuel cells to reach a steady state; thereafter whenever there is a
change of electric power demand, it take 60 seconds for the fuel cells to readjust and
reach a new steady state. A fuel cells power system alone is not capable of dealing
with the rapid power demand change to serve as the sore power plant in the UPS
system. At present, most research applying PEM fuel cells to electric backup power
systems are limited to smaller, mobile UPS systems for computers and
communication equipments with built-in battery units to fill the need of dynamic
power demands. Several other barriers exist to the widespread use of fuel cells as the
electric power plant for an electric vehicle or backup power system. The most
obvious one among them is cost. As with any new technology, fuel cells are
expensive to develop and manufacture. The magnitude of the cost problem for
vehicles and backup power systems is exacerbated by the low cost of the incumbent
ICE and battery technologies. In order to improve the viability of fuel cells as an
alternative power plant, some method of either reducing their cost or the cost of the
total backup power system over life time is required.
3.MATERIAL AND METHOD Serpil AĞYEL
35
3. MATERIAL AND METHOD
3.1. Vehicle Simulation Tools
Different platforms for programming were evaluated and complete programs
for vehicle simulation were evaluated (Andersson 2001). In some programs it was
difficult to make modifications in the simulation program, e.g. with the simulation
program the flexible ELFA System (Electric Low Floor Axle (ELFA and was not
availably by the beginning of the project. Other programs were too expensive.
Matlab/Simulink and Advisor (Demo version) were as chosen as the platform for
this simulation model.
Matlab is well known in the scientific world and has already been used for
many hybrid and electric vehicle simulations. The hybrid bus is modularly designed
in Simulink and fed with input values via Matlab. The simulation program is, after
calibration by extensive measurements, used for structural sensitivity analysis and
evaluation of charging strategy improvements.
3.2. ADvanced VehIcle SimulatOR (ADVISOR)
3.2.1. ADVISOR Background
ADvanced VehIcle SimulatOR (ADVISOR) was developed by the National
Renewable Energy Laboratory of US in late 1990s. It was first developed to support
US Department of Energy in the hybrid propulsion research. The model was set up in
a backward modeling approach, although it was labeled as both forward and
backward in the official documents. ADVISOR is widely used by auto manufacturers
and university and institute researchers worldwide. Many users contributed new
components and data to the ADVISOR library. With a friendly user interface,
ADVISOR was created in MatLab/Simulink® which is a software module in MatLab
for modeling, simulating and analyzing dynamic systems. It supports both linear and
nonlinear systems, modeled in continuous time, sampled time, or a hybrid of the two.

3.MATERIAL AND METHOD Serpil AĞYEL
36
Systems can also be MultiMate, e.g. having different parts that are sampled or
updated at different rates.
3.2.2. ADVISOR Modeling Approaches
ADVISOR employs both backward and forward modeling approaches (Santi,
2002). A backward approach starts from a given driving cycle at the wheels, and
traces back the needed power flow through the powertrain model to find how much
each involved component has to perform. A control flow chart of a backward model
is shown in Figure 3.1. No driver behavior model is required in such a model.
Instead, the power required at the wheels of the vehicle through the time step is
calculated directly from the required speed trace (drive cycles). The required power
is then translated into torque and speed that go up stream to find the power required
at the power source, an ICE, for instance. Component by component, this power flow
is calculated backward through the drivetrain, considering losses. At the end, the use
of fuel or electric energy is computed for the given speed trace or drive cycle.
Vehicle simulations that use a forward-facing approach include a driver
model and a similar powertrain model. A driver model compares the required speed
and the present speed to decide appropriate throttle and braking commands (using a
PI controller). The throttle command is then translated into a torque demand at the
power source (engine or motors). While the brake commands will be translated to
friction torque at the wheels. The torque provided by the power source goes through
the whole drivetrain to the wheels. Vehicle speed will be calculated and sends back
to driver model as the present speed.

3.MATERIAL AND METHOD Serpil AĞYEL
37
Figure 3.1. Flow Chart of a Backward Modeling Approach
Figure 3.2 shows the Simulink diagram of a two-mode hybrid vehicle model.
The simplified function of this diagram is explained using the flow chart shown in
Figure 3.1, as a so-called backward computer model.
Figure 3.2. ADVISOR/Simulink Block Diagram of a Two-mode Truck
3.2.3. ADVISOR Interface
ADVISOR provides easy access and quick results to a trained user in vehicles
modeling through a GUI interface. Three windows would guide users from the initial
setting up toward the final results. The first window is used to enter data related to

3.MATERIAL AND METHOD Serpil AĞYEL
38
the vehicle initial setup. The second window provides several simulation options one
can select from. The last window shows selected simulation results.
In the ADVISOR vehicle input window Figure 3.3, the vehicle drivetrain
configurations (e.g. series, parallel, conventional, etc.) is specified as well as the
other key drivetrain components (Wipke, Cuddy and Burch, 1999).
Characteristic performance maps for various drivetrain components are
accessible using the associated menus. The size of a component (i.e. peak power
capability and number of modules) can be modified by editing the characteristic
values displayed in the boxes. Due to its straightforward backward approach,
ADVISOR is 2.5 to 8 times faster than forward looking approach (Guenther and
Dong, 2005). Any scalar parameter can be modified using the edit variable menu in
the lower right portion of the window. All vehicle configuration parameters can be
saved for future use. After these vehicle input characteristics are specified, the next
GUI interface is the simulation setup window.
In the ADVISOR simulation setup window as shown in Figure 3.4, a user
defines the event over which the vehicle is to be simulated. Some of the events are
driving cycle, acceleration test and other special test procedures. For example, when
a single driving cycle is selected, the speed trace can be viewed in the upper left
portion of the window and a statistical analysis of the cycle on the lower left portion.
With simulation parameters configured, simulation can be run and results will be
presented upon completion.
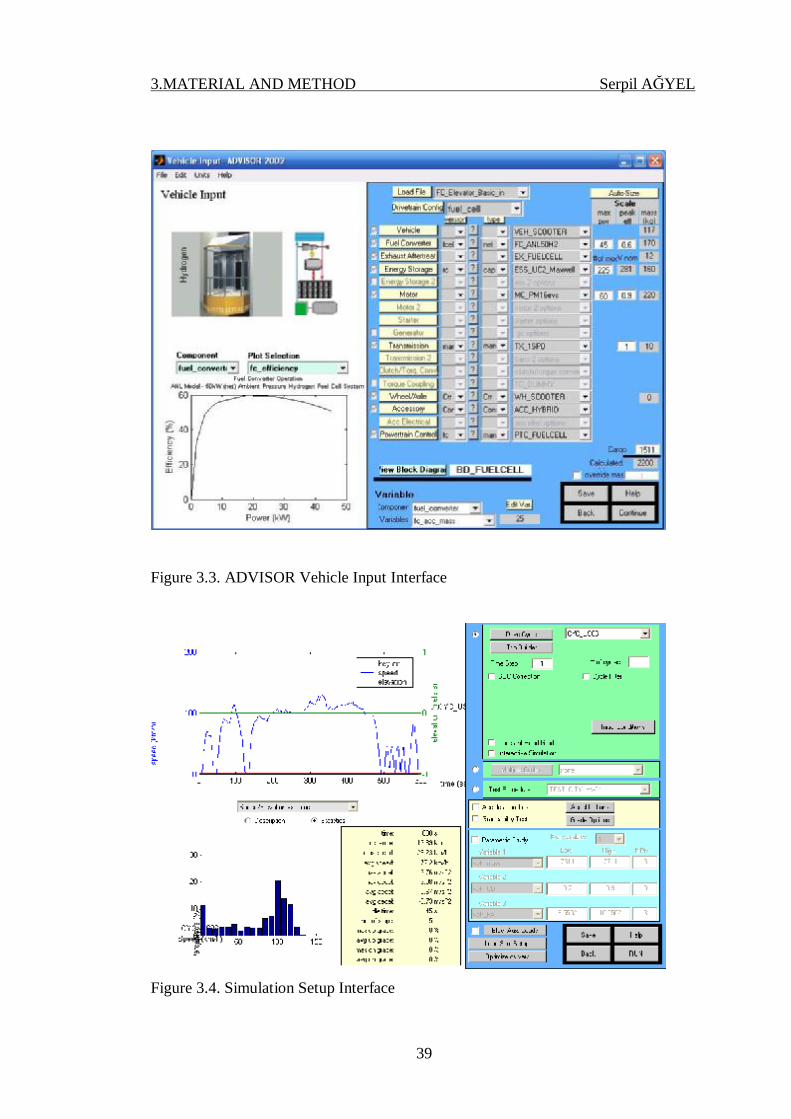
3.MATERIAL AND METHOD Serpil AĞYEL
39
Figure 3.3. ADVISOR Vehicle Input Interface
Figure 3.4. Simulation Setup Interface
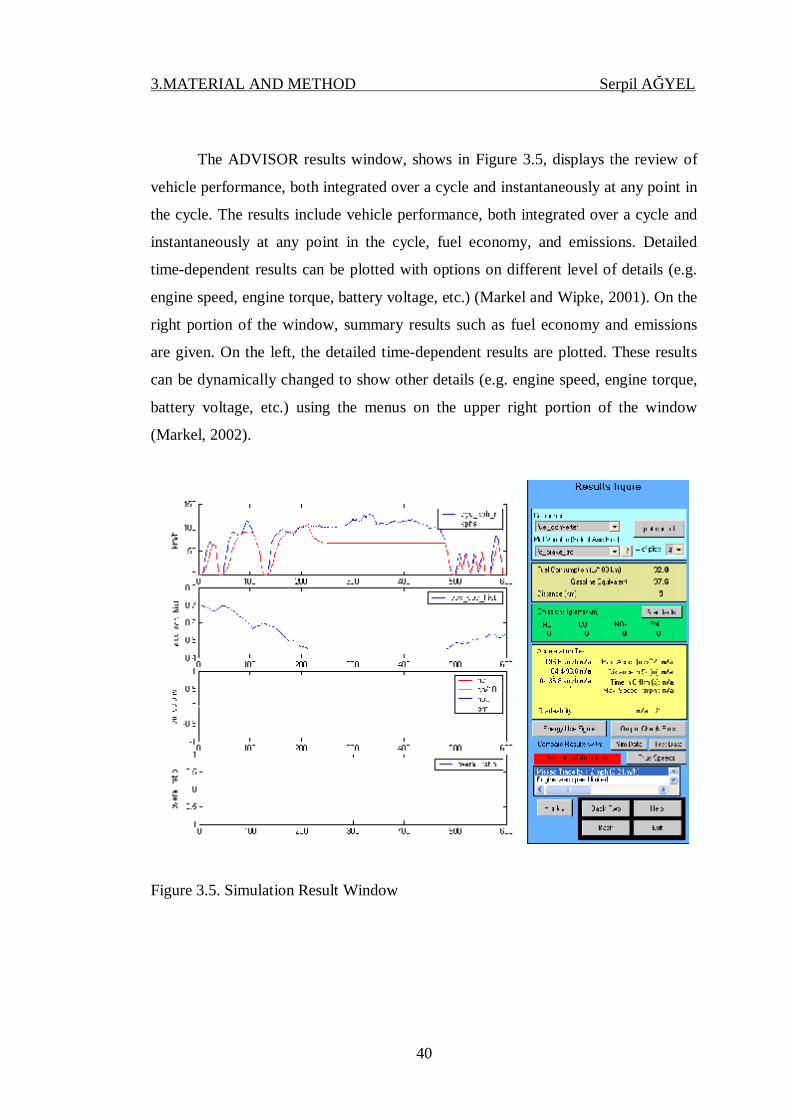
3.MATERIAL AND METHOD Serpil AĞYEL
40
The ADVISOR results window, shows in Figure 3.5, displays the review of
vehicle performance, both integrated over a cycle and instantaneously at any point in
the cycle. The results include vehicle performance, both integrated over a cycle and
instantaneously at any point in the cycle, fuel economy, and emissions. Detailed
time-dependent results can be plotted with options on different level of details (e.g.
engine speed, engine torque, battery voltage, etc.) (Markel and Wipke, 2001). On the
right portion of the window, summary results such as fuel economy and emissions
are given. On the left, the detailed time-dependent results are plotted. These results
can be dynamically changed to show other details (e.g. engine speed, engine torque,
battery voltage, etc.) using the menus on the upper right portion of the window
(Markel, 2002).
Figure 3.5. Simulation Result Window

3.MATERIAL AND METHOD Serpil AĞYEL
41
3.2.4. Models in ADVISOR
3.2.4.1. Internal Combustion Engines and PEM Fuel Cells Models
A fuel converter is used in ADVISOR to convert indirect energy from fuel
into direct energy such as electricity or kinetic energy to power the vehicle. The fuel
converter for a motorized vehicle will be an ICE or fuel cells.
There are two categories of empirical, steady-state fuel cells models in
ADVISOR. One simulates the performance of fuel cell system by mapping the
system efficiency as a function of net power output. The other represents fuel cells
performance based on a given polarization curve. Both models exclude thermal
considerations and water management. Reformer and gas compressor are not
included.
3.2.4.2. Energy Storage Model
There are several energy storage devices as build-in component models in
ADVISOR library, including lead acid batteries, nickel metal hydride batteries, Li-
ion batteries and ultracapacitors.
3.2.4.3. Electric Motor and Motor Controller Models
Several commonly used electric motors are preloaded in ADVISOR including
induction motors, permanent magnet brushless DC motors, and switched reluctance
motors. In terms of motor modeling for a vehicular drivetrain, two different
approaches are used. One is the theoretical model based on physical principles. For a
given motor geometry, material parameters and power electronics, the torque and
speed of the motor are calculated. For example, the motor model for a brushless DC
motor will be fundamentally different from the model of an induction motor.
The other modeling approach is more empirical data-driven, simply based on
the static map of the drivetrain efficiency as a function of motor torque, speed and

3.MATERIAL AND METHOD Serpil AĞYEL
42
voltage, as used at NREL. The empirical input data are obtained using a motor test
stand. The latter cannot explain how the motor functions, but present more accurate
motor performance behaviors and require much less computation, serving the system
design task better. In this work, the latter approach was used.
3.3. The flexible ELFA System (Electric Low Floor Axle (ELFA)
3.3.1. Background
Siemens ELFA system claims to reduce energy consumption by up to 40%
and allow emissions free operation in inner city areas and when buses are stationary.
It is a series hybrid system designed for high flexibility and to be highly cost
effective, and its modular design allows installation in many applications.
The ELFA traction system combines mobile energy generators, such as a
diesel generator set or fuel cells, with high performance energy storage and
regenerative braking. The use of a series hybrid principle allows a high degree of
standardization such that the same electrical traction system can be operated in a
diesel hybrid, fuel cell hybrid or battery powered electric vehicle. Therefore, a series
hybrid can be easily adapted to new developments in diesel technology, energy
storage devices and regenerative braking systems, as well as being able to utilize the
latest technology in fuel cell development. The traction drive is completely
decoupled from the energy generation source, usually a diesel engine today. This
means that the diesel engine can be mounted in the vehicles such that it does not
generate a torque reaction, and the drive torque does not have to be supported by the
vehicle chassis. This significantly reduces the amount of noise and vibration and
contributes to improved passenger comfort.
Siemens standard ELFA system uses liquid cooled AC induction motors with
power ratings from 50 kW to 180 kW, with reduction gearboxes. This can be
combined with electrical axle drive solutions and the electric motors are both
extremely reliable and efficient, and easily packaged thanks to their small
dimensions and low weights. Siemens can also incorporate permanent magnet
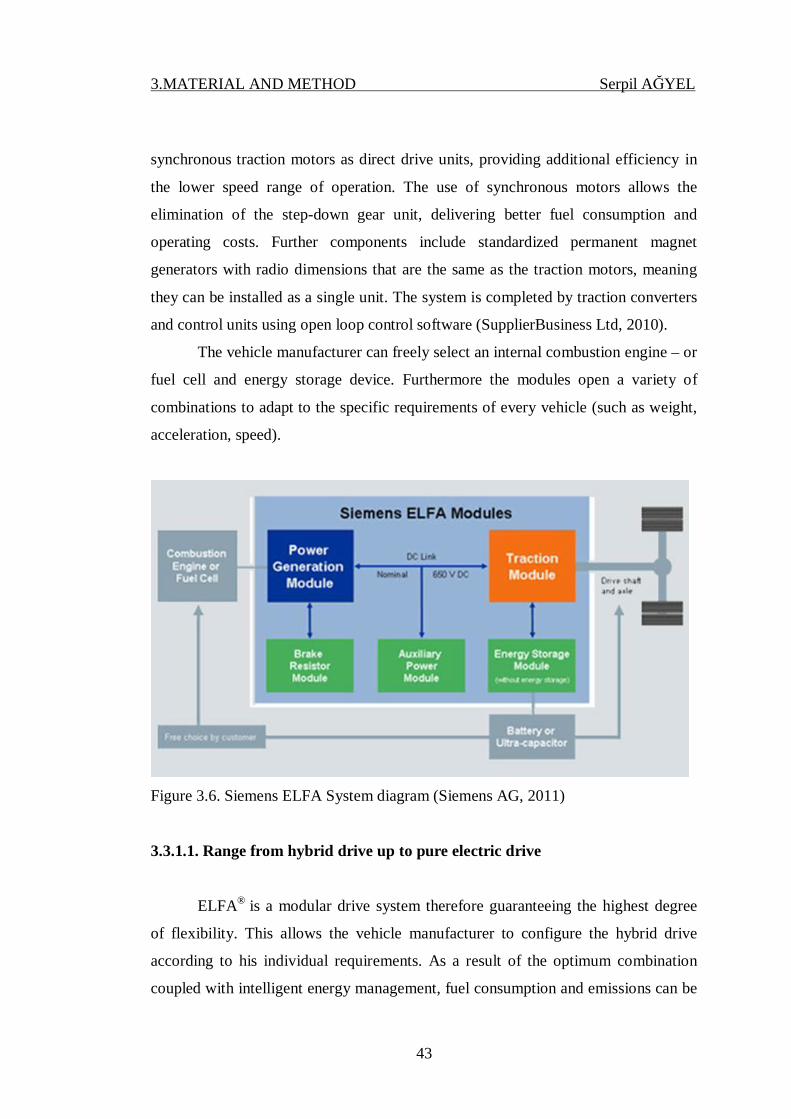
3.MATERIAL AND METHOD Serpil AĞYEL
43
synchronous traction motors as direct drive units, providing additional efficiency in
the lower speed range of operation. The use of synchronous motors allows the
elimination of the step-down gear unit, delivering better fuel consumption and
operating costs. Further components include standardized permanent magnet
generators with radio dimensions that are the same as the traction motors, meaning
they can be installed as a single unit. The system is completed by traction converters
and control units using open loop control software (SupplierBusiness Ltd, 2010).
The vehicle manufacturer can freely select an internal combustion engine – or
fuel cell and energy storage device. Furthermore the modules open a variety of
combinations to adapt to the specific requirements of every vehicle (such as weight,
acceleration, speed).
Figure 3.6. Siemens ELFA System diagram (Siemens AG, 2011)
3.3.1.1. Range from hybrid drive up to pure electric drive
ELFA® is a modular drive system therefore guaranteeing the highest degree
of flexibility. This allows the vehicle manufacturer to configure the hybrid drive
according to his individual requirements. As a result of the optimum combination
coupled with intelligent energy management, fuel consumption and emissions can be
3.MATERIAL AND METHOD Serpil AĞYEL
44
significantly reduced. Its flexible and modular system components the electric ELFA
drive system can be used in commercial vehicles such as city buses employing the
widest range of energy sources. In addition to internal combustion engines, these can
also include electrical energy sources, such as e.g. battery, ultra capacitor and fuel
cell (Siemens AG, 2010).
The decisive key to achieving significantly less energy consumption in bus
traffic: The high amount of braking energy that occurs for typical stop and go
operation. Here, savings of over 30 percent are definitely feasible – and has already
been able to be proven in various applications. This braking energy is intelligently
used with ELFA: Contrary to conventional buses where the energy is simply wasted,
with ELFA, it is converted back into electrical energy by the regenerative operation
of the traction motor and is fed into an energy storage device – i.e. in high
performance capacitors or batteries. The energy yield is enormous, especially for city
buses that are continually braking and accelerating. Depending on the bus type and
the application conditions, operating companies can profit from significant cost
savings. This makes it quite clear why an investment in an ELFA traction drive has
an extremely short payback time (Siemens AG, 2007).
3.3.2. ELFA: advantages at a glance
• Up to 40 percent less energy consumption and exhaust emission
• Emission-free operation possible in inner city areas and at bus stops
• Noticeably more quiet
• Higher degree of comfort for passengers as the bus accelerates a lot more smoothly
• Extremely reliable and low-maintenance traction systems
• All components from a single source – motor, generator, traction converter and
control
• Series hybrid system concept for maximum degree of flexibility and cost
effectiveness
• Can be adapted to all city bus types as a result of the modular design
• Proven thousands of times over
3.MATERIAL AND METHOD Serpil AĞYEL
45
3.3.2.1. Sensible: Braking energy is regenerated and stored
Always on the green route: Diesel engine operation with ELFA, the stored
braking energy is always reused when starting: The diesel engine only has to be
started at higher bus speeds or higher acceleration power. Depending on the storage
capacity of the system, the bus can also be driven purely electrically, i. e. without any
exhaust emission. This is especially important in environmentally sensitive inner city
zones and at bus stops. A diesel engine can always be operated at a speed
independent of the bus speed. This means that the engine can always be operated in a
range that has the most favorable fuel consumption.
3.3.2.2. Increased degree of cost effectiveness and flexibility
The series hybrid ELFA systems utilize the series hybrid principle a superior
concept with a whole raft of significant advantages for city buses: On one hand, the
series hybrid can be standardized. This means that the same electrical traction system
can be operated in a diesel hybrid, a fuel cell hybrid or a battery-powered vehicle.
As a consequence, a series hybrid can be easily adapted to new developments
in the area of internal combustion engines and energy storage devices – the same also
applies to leading-edge fuel cell technology. On the other hand, with the series
hybrid, the traction drive is completely decoupled from the internal combustion
engine. This means that the diesel engine can be mounted in the vehicle so that it
does not generate a torque reaction and the drive torque doesn‘t have to be supported
by the vehicle chassis. This significantly reduces the amount of noise and vibration
therefore ensuring a significantly higher degree of passenger comfort. Additional
advantages: A higher degree of latitude when designing the traction system and a
higher degree of overall flexibility. This is because only the generator depends on the
selected diesel engine. Thanks to its flexibility, the series hybrid can be perfectly
adapted to upcoming innovation in the area of energy storage devices – associated
with the future transition to Li-ion technology: More precisely – it is possible to use a
smaller diesel engine than was previously used (down-sizing).

3.MATERIAL AND METHOD Serpil AĞYEL
46
3.3.2.3. For buses around the world: Tailored and system-based solutions
With their unbeatable degree of flexibility, ELFA traction drives can be
adapted to every bus type around the world, independent of individual special
configurations and regions, climatic or topographical situations. The reason for this is
its modular design: The complete system is assembled in a modular fashion from an
extensive range of components – and is perfectly tailored to the specific requirement
profile. We also offer many alternative possibilities for the mechanical integration –
and certainly always the optimum solution for the specific project.
3.3.2.4. The standard: Systems with rugged induction motors
Rugged liquid-cooled induction motors with power ratings from 50 kW to
180 kW with reduction gearboxes are used as standard for ELFA traction systems.
Also possible: Operation with electrical axle drive solutions. The motors are
convincing thanks to their extremely high degree of reliability, high efficiency and
space-saving design thanks to their small envelope dimensions and low weight for
the particular power rating.
3.3.2.5. The alternative: Systems with permanent-magnet synchronous motors
Our latest development in the modular ELFA system: A permanent-magnet
synchronous traction motor as direct drive. This distinguishes itself due to the
efficiency that has been increased yet again in the lower speed range. Further, for this
motor, a step-down gear unit is not required. This guarantees a further improvement
in the efficiency eliminates the need to use gearbox oil – and when all is said and
done – also reduces the fuel consumption, operating costs and exhaust emission.

3.MATERIAL AND METHOD Serpil AĞYEL
47
3.3.2.6. The generators: Common mechanical unit together with the traction
motor
Permanent magnet generators are used for all of the latest ELFA traction
drive generation there are no exceptions. Their radial dimensions are exactly the
same as those of the traction motor. This means that they can be mounted as a single
unit. As a consequence, vehicle manufacturers can essentially keep their chassis
design when changing over to hybrid traction technology and install the unit in the
space previously occupied by the automatic gearbox.
3.3.2.7. The traction converters: Compact and can be used in a modular fashion
The traction converters play a key role in our ELFA traction systems. They
control the traction motors, generators and auxiliary systems. Their compact, water-
cooled aluminum frame corresponds to the environmental demands in the automobile
sector and ensures the highest power density. This in turn significantly simplifies
installation in the vehicle itself. The latest generation of traction converters
completely fulfill the requirements placed on modularity. Alternative operation with
12 V and 24-V onboard supplies is also possible without requiring any modification.
3.3.2.8. The open-loop control software – tailored customer solutions
The complete ELFA traction system is controlled using just one standard
traction converter software. A wide range of different applications can be
parameterized at the system level using this software. In addition to the basic
functions, various routines are integrated in the software – also customer-specific
higher-level software modules that in conjunction with the standard software
modules represent the system control. Using the set points from the driver, the
traction control determines the torque and speed set points for the motors, generators
and auxiliary systems – taking into account internal and external system limits. The
required system performance is also determined in the traction control. This is the
3.MATERIAL AND METHOD Serpil AĞYEL
48
input for the hybrid control that in turn determines the distribution of power between
the internal combustion engine and the energy storage device for the various
applications.
3.3.3. A real milestone for urban bus traffic
ELFA sets standards for hybrid powered city buses for bus manufactures,
passengers and local municipalities. With our innovative series hybrid traction drive,
you are benefiting from more than one hundred years of Siemens experience – the
global market leader for large drives. In other words: You can profit from maximum
reliability, highest efficiencies and a global service network whose experts are
always there to provide you with competent support.
ELFA traction drives have already proven themselves thousands of times
over. The first ones went into operation back in 1998 and in the meantime have many
mil-lions of operating hours and kilometers under their belt reliably and
economically. Together with bus manufacturers around the world, we are developing
traction drive systems for city buses. This is based on our experience and
competence in drive technology, our power of innovation and global presence and
represents cutting edge technology when it comes to ecological and economic issues
(Siemens AG, 2007).
3.3.4. Energy mix for ELFA applications
In addition to the electrical components, a hybrid drive generally comprises a
power source - such as an internal combustion engine or a fuel cell - and an energy
storage device such as a battery or an ultra capacitor. Using the ELFA traction
system, vehicle manufacturers can address all of their requirements regarding the
energy mix.
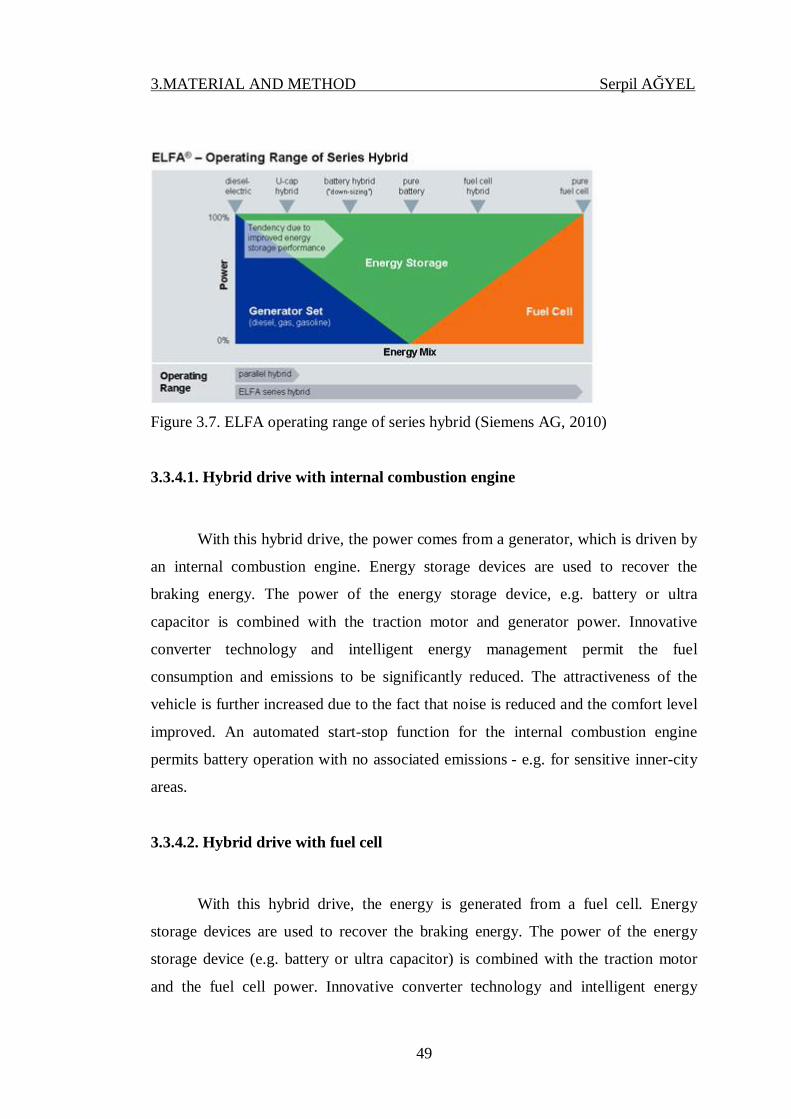
3.MATERIAL AND METHOD Serpil AĞYEL
49
Figure 3.7. ELFA operating range of series hybrid (Siemens AG, 2010)
3.3.4.1. Hybrid drive with internal combustion engine
With this hybrid drive, the power comes from a generator, which is driven by
an internal combustion engine. Energy storage devices are used to recover the
braking energy. The power of the energy storage device, e.g. battery or ultra
capacitor is combined with the traction motor and generator power. Innovative
converter technology and intelligent energy management permit the fuel
consumption and emissions to be significantly reduced. The attractiveness of the
vehicle is further increased due to the fact that noise is reduced and the comfort level
improved. An automated start-stop function for the internal combustion engine
permits battery operation with no associated emissions - e.g. for sensitive inner-city
areas.
3.3.4.2. Hybrid drive with fuel cell
With this hybrid drive, the energy is generated from a fuel cell. Energy
storage devices are used to recover the braking energy. The power of the energy
storage device (e.g. battery or ultra capacitor) is combined with the traction motor
and the fuel cell power. Innovative converter technology and intelligent energy
3.MATERIAL AND METHOD Serpil AĞYEL
50
management allow the fuel consumption to be significantly reduced. The
attractiveness of the vehicle is further increased by a significantly lower noise level
and improved levels of comfort.
3.3.4.3. Battery drive
For the battery drive, the energy is provided from just a battery. Modern high-
energy batteries have a high power density; whereby it is especially important to note
that the kinetic energy of the vehicle can be fed back into the batteries when braking.
In conjunction with the innovative ELFA drive and converter technology coupled
with an efficient concept for the auxiliaries, daily range targets for vehicles can be
achieved without any intermediate charging. The battery drive has no emissions and
also provides a very high degree of comfort as a result of the low noise levels.

4.RESEARCH AND DISCUSSION Serpil AĞYEL
51
4. RESEARCH AND DISCUSSION
4.1. Modelling the Vehicle Dynamics in Series Hybrid System
Energy management requires the knowledge of power flows between the
hybrid electric vehicle components. The overall power flow can be described by:
ICE UC TR AUX BRP P P P P= + + + (4.1)
where:
is power generated by the internal combustion engine is the power flow into/out of the energy storage (ultracapacitor) is the tractive power demanded by the driver
is the auxillary unit
ICE
UC
TR
AUX
PPPP s on the engine to run safety critical systems
is the dissipated energy through resistors if UC E is maximumBRP
Then the generator power can be defined as the net power available to
generate electricity:
G ICE AUXP P P= − (4.2)
The instantaneous tractive power required to cruise the hybrid electric vehicle
at Velocity v is defined in (Gillespie, 1992):
( )
( ) ( ) ( )
TR gxT AD roll
TR TR
dvF m F F Fdt
P t F t v t
= + + +
= (4.3)
where:
m is the vehicle mass
4.RESEARCH AND DISCUSSION Serpil AĞYEL
52
is the gravitational force
is the aerodynamic drag force is the resistive rolling force
sin is the grade
gxT
AD
roll
FFF
β
The above mentioned resistive vehicular dynamical forces are also defined in
(Gillespie, 1992):
21
0
sin
[ ]2
gxT
AD F D
roll
F mgPF mgC A D v
F mgC
β=
= +
=
(4.4)
The power loss due to resistive dynamical forces can be expressed as:
_ ( )LOSS MECHANICAL AD rollP v F F= + (4.5)
Auxiliary Power Consumption can be modelled as a function of the engine
speed as follows:
/( ) ( ) ( ) ( ) ( ) ( )AUX motoring hydrauics pneumatics A C alternatorP w P w P w P w P w P w= + + + + (4.6)
where:
/
( ) is the power consumption due to dynamics of the engine( ) is the power consumption of the suspension and brake systems
( ) is the power consumption of the air conditioner un
motoring
pneumatics
A C
P wP wP w it
( ) is the 24V alternator power demand( ) is the power consumption of the hydraulic steering system and the
hydraulic cooling system for the engine and powertrain
alternator
hydrauics
P wP w
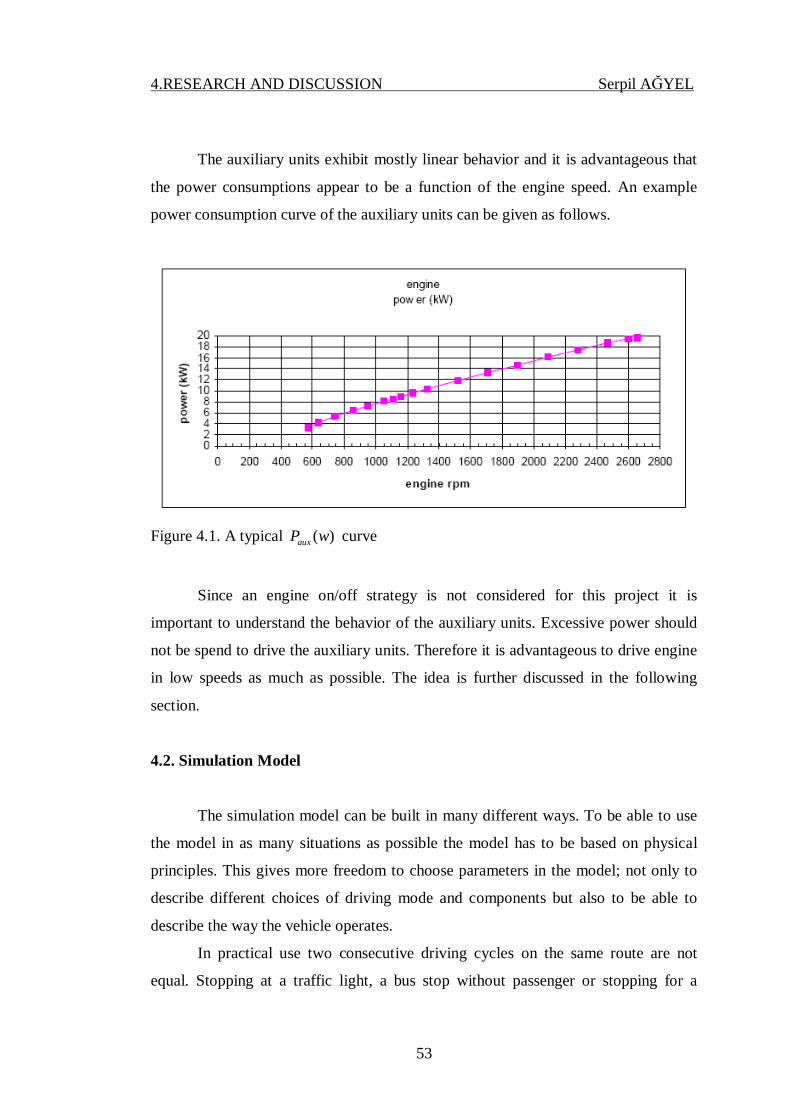
4.RESEARCH AND DISCUSSION Serpil AĞYEL
53
The auxiliary units exhibit mostly linear behavior and it is advantageous that
the power consumptions appear to be a function of the engine speed. An example
power consumption curve of the auxiliary units can be given as follows.
Figure 4.1. A typical ( )auxP w curve
Since an engine on/off strategy is not considered for this project it is
important to understand the behavior of the auxiliary units. Excessive power should
not be spend to drive the auxiliary units. Therefore it is advantageous to drive engine
in low speeds as much as possible. The idea is further discussed in the following
section.
4.2. Simulation Model
The simulation model can be built in many different ways. To be able to use
the model in as many situations as possible the model has to be based on physical
principles. This gives more freedom to choose parameters in the model; not only to
describe different choices of driving mode and components but also to be able to
describe the way the vehicle operates.
In practical use two consecutive driving cycles on the same route are not
equal. Stopping at a traffic light, a bus stop without passenger or stopping for a
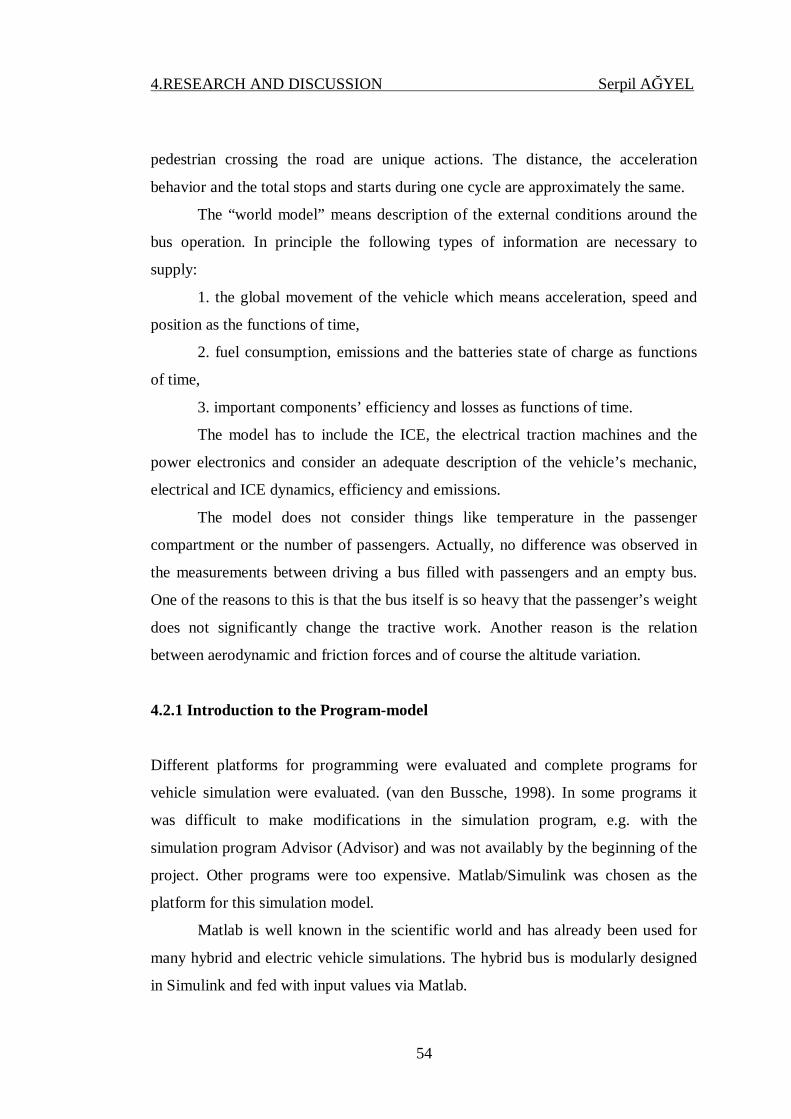
4.RESEARCH AND DISCUSSION Serpil AĞYEL
54
pedestrian crossing the road are unique actions. The distance, the acceleration
behavior and the total stops and starts during one cycle are approximately the same.
The “world model” means description of the external conditions around the
bus operation. In principle the following types of information are necessary to
supply:
1. the global movement of the vehicle which means acceleration, speed and
position as the functions of time,
2. fuel consumption, emissions and the batteries state of charge as functions
of time,
3. important components’ efficiency and losses as functions of time.
The model has to include the ICE, the electrical traction machines and the
power electronics and consider an adequate description of the vehicle’s mechanic,
electrical and ICE dynamics, efficiency and emissions.
The model does not consider things like temperature in the passenger
compartment or the number of passengers. Actually, no difference was observed in
the measurements between driving a bus filled with passengers and an empty bus.
One of the reasons to this is that the bus itself is so heavy that the passenger’s weight
does not significantly change the tractive work. Another reason is the relation
between aerodynamic and friction forces and of course the altitude variation.
4.2.1 Introduction to the Program-model
Different platforms for programming were evaluated and complete programs for
vehicle simulation were evaluated. (van den Bussche, 1998). In some programs it
was difficult to make modifications in the simulation program, e.g. with the
simulation program Advisor (Advisor) and was not availably by the beginning of the
project. Other programs were too expensive. Matlab/Simulink was chosen as the
platform for this simulation model.
Matlab is well known in the scientific world and has already been used for
many hybrid and electric vehicle simulations. The hybrid bus is modularly designed
in Simulink and fed with input values via Matlab.

4.RESEARCH AND DISCUSSION Serpil AĞYEL
55
The simulation program is, after calibration by extensive measurements, used
for structural sensitivity analysis and evaluation of charging strategy improvements.
4.2.2. User Interface of the Program
The modules in the simulated vehicle constitute of batteries, ICE, generator, electric
motor, power electronics, control block etc. Mechanical dynamics such as
aerodynamics and rolling resistance components are modelled. All the components
have been chosen to imitate the real bus and its conditions as good as possible. The
electrical machines are modelled with look-up tables with current and voltage and
efficiency as output parameter. The battery model includes a temperature depending
resistance. In the simulation model the auxiliary load is considered a constant power.
The user-defined parameter that can be specified in the simulation model is:
· Choice of bus
· Driving cycle
· Charging strategy
· Size of the certain components
The choice of a special bus, defines the default value of ICE, battery and
electric drive motor. These default parameters can then be scaled by reducing the
number of cylinders, cells or using a scale factor.

4.RESEARCH AND DISCUSSION Serpil AĞYEL
56
Figure 4.2. User interface of the hybrid bus simulation program.
The ICE simulation model includes all regulated emissions HC, CO and NOx
as well as the fuel consumption.
The simulated driving cycles use velocity as a function of time or distance.
Using velocity as a function of time can give a wrong result due to accumulated
errors. If the speed differs from the desired speed too much due to low performance
of the vehicle, the bus stop will occur at the wrong place after a while. If velocity is
used as a function of distance this problem will not appear, but there might be a
problem with the pause time at the bus stop. To make it possible for the passengers
of the simulated vehicle to get on and off the bus at the bus stop, a time delay is
added at all bus stops.
It takes 20 seconds to run a complete simulation of 1800 seconds simulation
on a hybrid bus with an average PC.
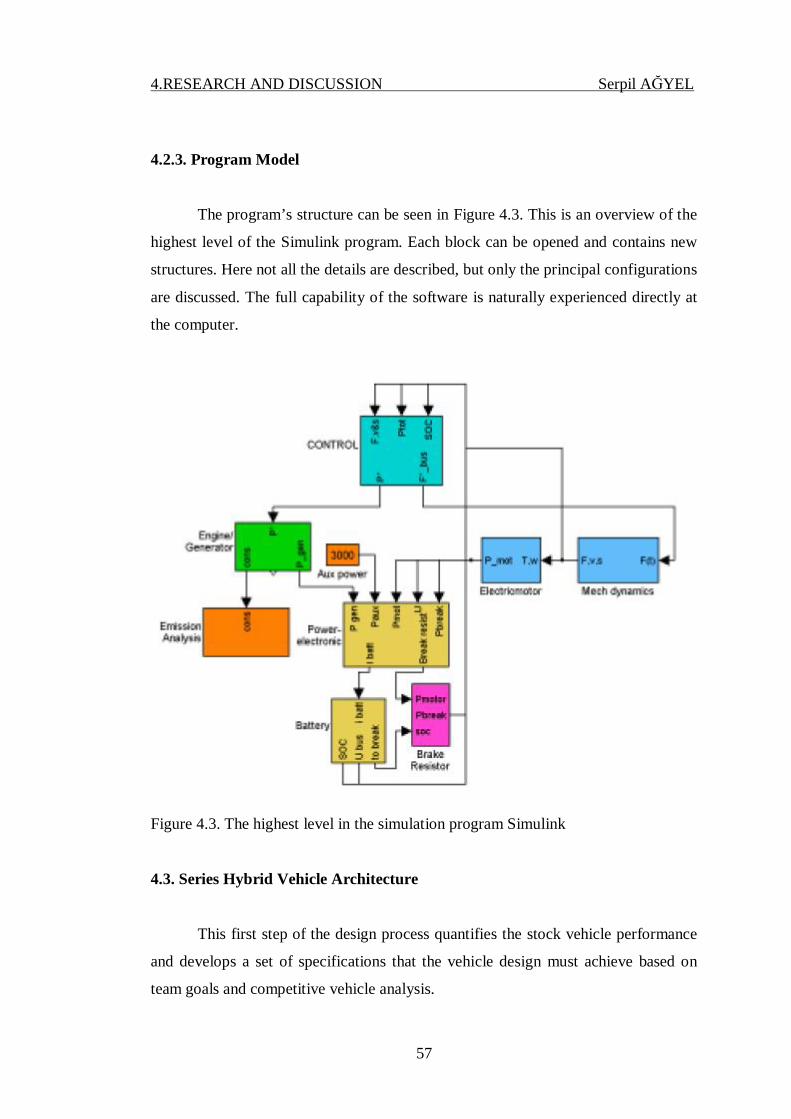
4.RESEARCH AND DISCUSSION Serpil AĞYEL
57
4.2.3. Program Model
The program’s structure can be seen in Figure 4.3. This is an overview of the
highest level of the Simulink program. Each block can be opened and contains new
structures. Here not all the details are described, but only the principal configurations
are discussed. The full capability of the software is naturally experienced directly at
the computer.
Figure 4.3. The highest level in the simulation program Simulink
4.3. Series Hybrid Vehicle Architecture
This first step of the design process quantifies the stock vehicle performance
and develops a set of specifications that the vehicle design must achieve based on
team goals and competitive vehicle analysis.
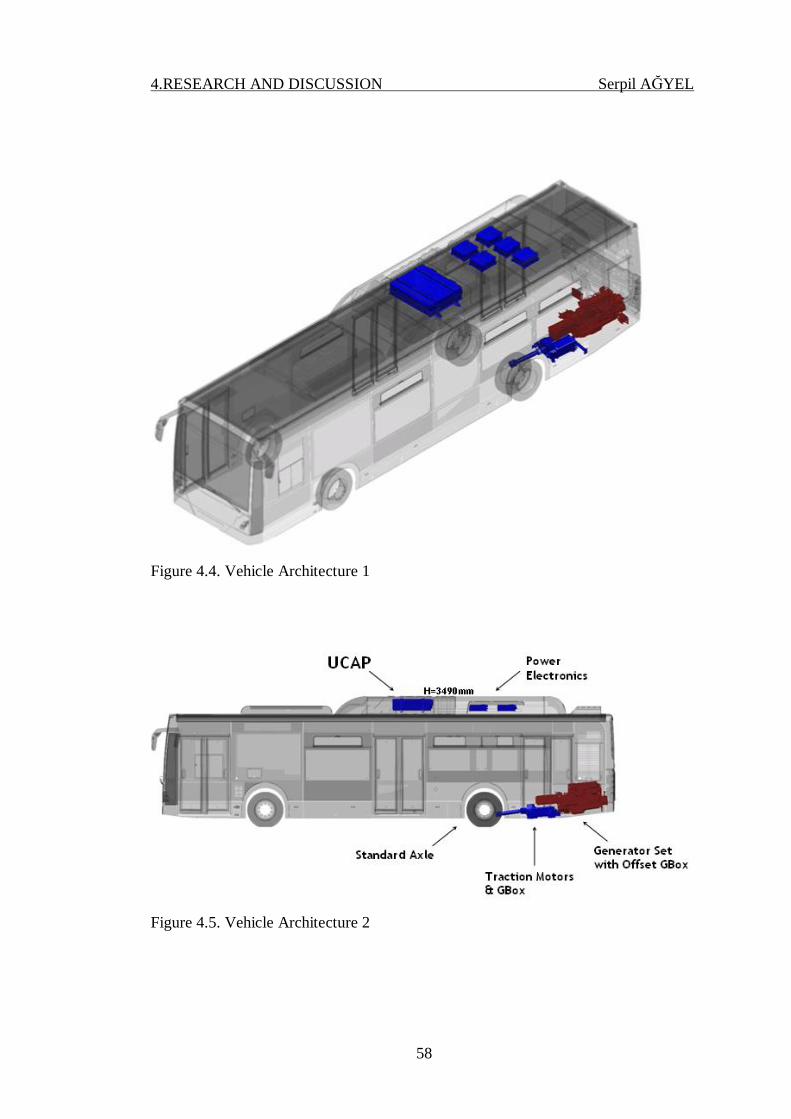
4.RESEARCH AND DISCUSSION Serpil AĞYEL
58
Figure 4.4. Vehicle Architecture 1
Figure 4.5. Vehicle Architecture 2
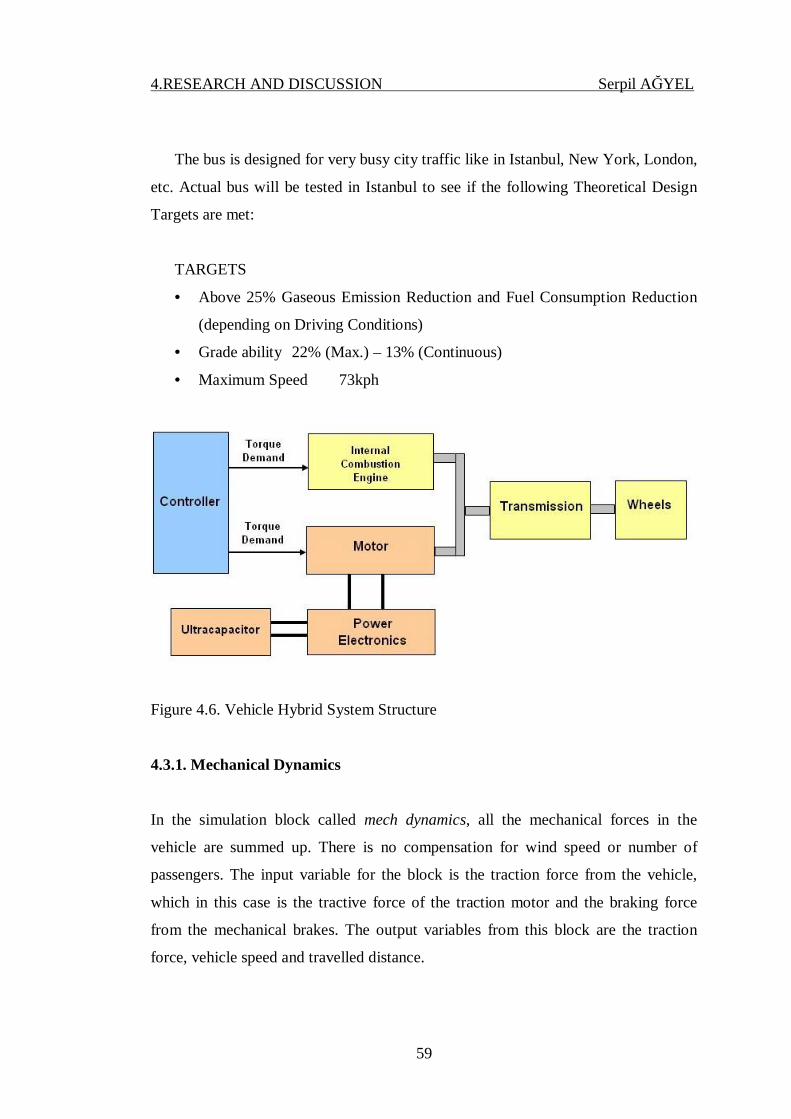
4.RESEARCH AND DISCUSSION Serpil AĞYEL
59
The bus is designed for very busy city traffic like in Istanbul, New York, London,
etc. Actual bus will be tested in Istanbul to see if the following Theoretical Design
Targets are met:
TARGETS
• Above 25% Gaseous Emission Reduction and Fuel Consumption Reduction
(depending on Driving Conditions)
• Grade ability 22% (Max.) – 13% (Continuous)
• Maximum Speed 73kph
Figure 4.6. Vehicle Hybrid System Structure
4.3.1. Mechanical Dynamics
In the simulation block called mech dynamics, all the mechanical forces in the
vehicle are summed up. There is no compensation for wind speed or number of
passengers. The input variable for the block is the traction force from the vehicle,
which in this case is the tractive force of the traction motor and the braking force
from the mechanical brakes. The output variables from this block are the traction
force, vehicle speed and travelled distance.
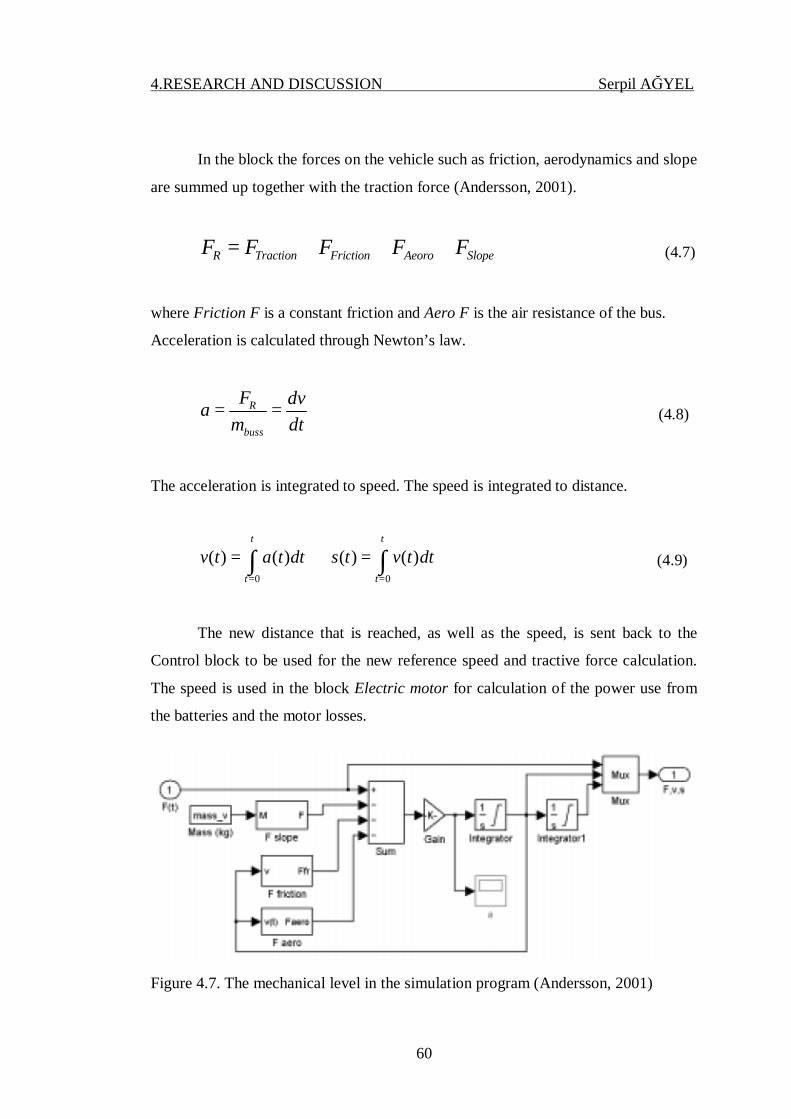
4.RESEARCH AND DISCUSSION Serpil AĞYEL
60
In the block the forces on the vehicle such as friction, aerodynamics and slope
are summed up together with the traction force (Andersson, 2001).
R Traction Friction Aeoro SlopeF F F F F= + + + (4.7)
where Friction F is a constant friction and Aero F is the air resistance of the bus.
Acceleration is calculated through Newton’s law.
R
buss
F dvam dt
= = (4.8)
The acceleration is integrated to speed. The speed is integrated to distance.
0 0
( ) ( ) ( ) ( )t t
t t
v t a t dt s t v t dt= =
= ⇒ =∫ ∫ (4.9)
The new distance that is reached, as well as the speed, is sent back to the
Control block to be used for the new reference speed and tractive force calculation.
The speed is used in the block Electric motor for calculation of the power use from
the batteries and the motor losses.
Figure 4.7. The mechanical level in the simulation program (Andersson, 2001)
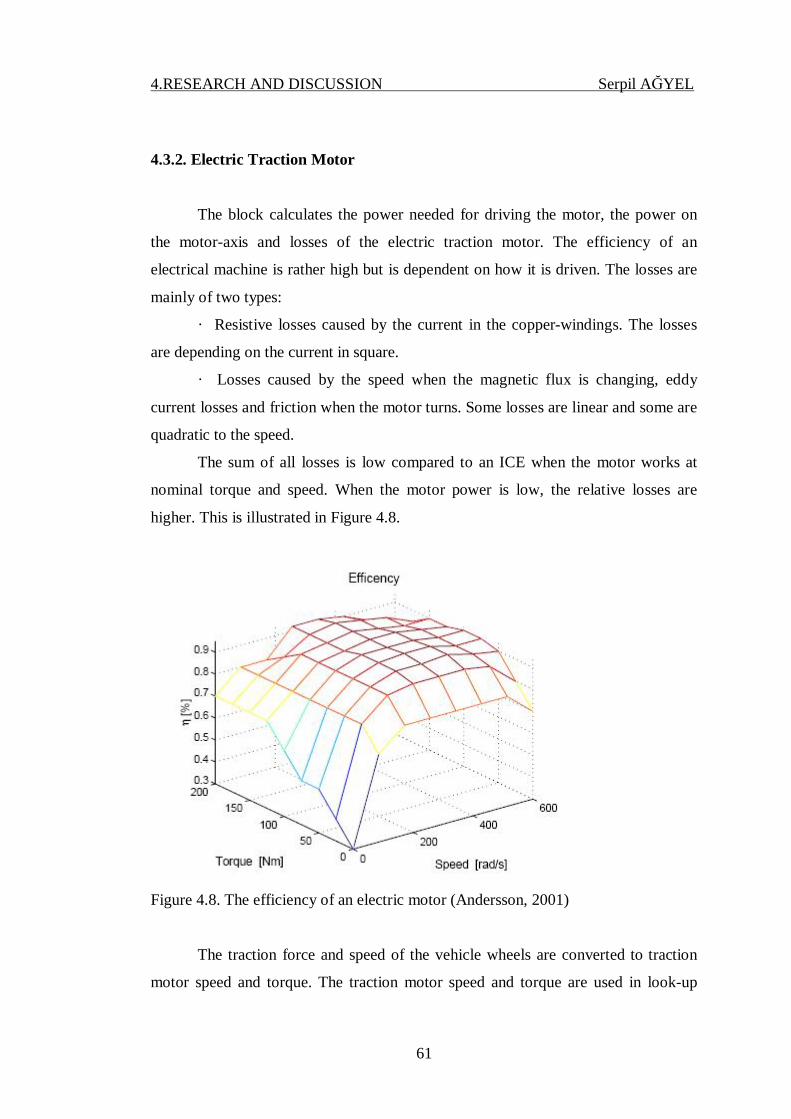
4.RESEARCH AND DISCUSSION Serpil AĞYEL
61
4.3.2. Electric Traction Motor
The block calculates the power needed for driving the motor, the power on
the motor-axis and losses of the electric traction motor. The efficiency of an
electrical machine is rather high but is dependent on how it is driven. The losses are
mainly of two types:
· Resistive losses caused by the current in the copper-windings. The losses
are depending on the current in square.
· Losses caused by the speed when the magnetic flux is changing, eddy
current losses and friction when the motor turns. Some losses are linear and some are
quadratic to the speed.
The sum of all losses is low compared to an ICE when the motor works at
nominal torque and speed. When the motor power is low, the relative losses are
higher. This is illustrated in Figure 4.8.
Figure 4.8. The efficiency of an electric motor (Andersson, 2001)
The traction force and speed of the vehicle wheels are converted to traction
motor speed and torque. The traction motor speed and torque are used in look-up

4.RESEARCH AND DISCUSSION Serpil AĞYEL
62
tables for the efficiency of the traction motor and the electric input power is
calculated. In Figure 4.8 the torque, speed and efficiency of a traction motor is
plotted. Since the efficiency of well designed traction motors are very much alike,
the same look up table for efficiency is used both for the generator and the traction
motors.
4.3.3. Ultracapacitors
4.3.3.1. Ultracapacitor Power Charts
Figure 4.9. Ultracapacitor power discharge profiles (Maxwell Technologies, 2008)
Typical profiles for constant power discharge based on product specifications
(Maxwell Technologies, 2008)
2 42
r r dc
dc
r dc
V V R PR
V V dt IRC
− − = − − (4.10)
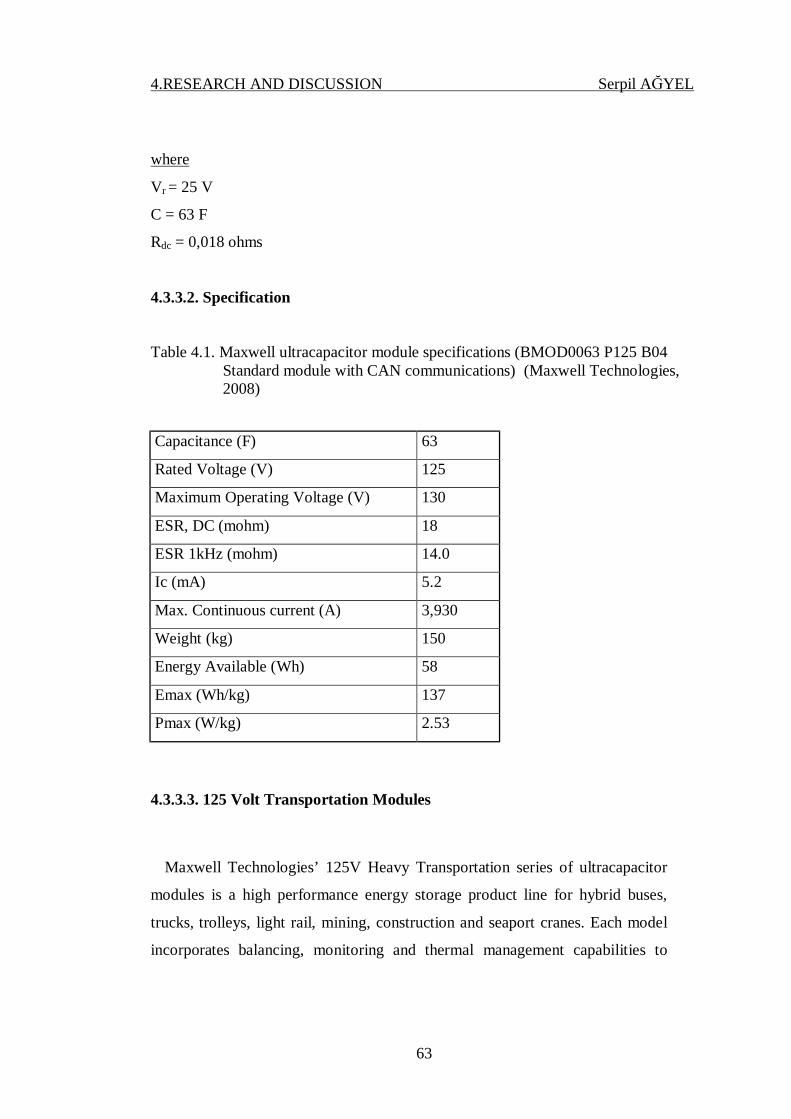
4.RESEARCH AND DISCUSSION Serpil AĞYEL
63
where
Vr = 25 V
C = 63 F
Rdc = 0,018 ohms
4.3.3.2. Specification
Table 4.1. Maxwell ultracapacitor module specifications (BMOD0063 P125 B04 Standard module with CAN communications) (Maxwell Technologies, 2008)
Capacitance (F) 63
Rated Voltage (V) 125
Maximum Operating Voltage (V) 130
ESR, DC (mohm) 18
ESR 1kHz (mohm) 14.0
Ic (mA) 5.2
Max. Continuous current (A) 3,930
Weight (kg) 150
Energy Available (Wh) 58
Emax (Wh/kg) 137
Pmax (W/kg) 2.53
4.3.3.3. 125 Volt Transportation Modules
Maxwell Technologies’ 125V Heavy Transportation series of ultracapacitor
modules is a high performance energy storage product line for hybrid buses,
trucks, trolleys, light rail, mining, construction and seaport cranes. Each model
incorporates balancing, monitoring and thermal management capabilities to
4.RESEARCH AND DISCUSSION Serpil AĞYEL
64
ensure industry-leading charge/discharge performance, high reliability and long
operational life.
4.3.3.4. Features
• Over 1 million charge/discharge cycles
• IP 65 environmental protection
• Operating temperature -40° C to +65° C
• CAN bus digital monitoring and communications
• Highest power performance available
• Temperature and voltage monitoring
• Series connection up to 1500V
4.3.3.5. Benefits
• Highest performance hybrid power systems
• Survive in nearly any weather/environmental conditions
• All in one solution with digital monitoring and built-in forced air cooling
• Digital feedback enables optimized hybrid control algorithms
4.3.3.6. Advantages In Hybrid Vehicles
• High power density
• Low impedance
• Virtually unlimited cycle life
• Rapid charging
• Reliable performance in harsh environments
4.RESEARCH AND DISCUSSION Serpil AĞYEL
65
4.3.3.7. Implementation
“An electric engine has a lot of torque at low revs —that is its main benefit —
so it's ideal for fast initial acceleration. At higher revs, once you've begun to
accelerate, nothing can beat an internal combustion engine. Our hybrid approach
combines the best characteristics of both engines.” Prof. Freymannfrom BMW
(Vahidi, 2009).
Here, the Siemens generator is driven by a Cummins ISB 6.7e5, 6.7 liter
engine modified to operate on pure hydrogen. It provides up to 184 kW of electric
power in this series hybrid to drive a Siemens ELFA drive system. Excess energy, as
well as energy recouped by regenerative braking, is stored in Maxwell
ultracapacitors.
4.3.4. ICE in Test Bench
The stationary characteristics of the ICE’s used in two dimension look-up
tables in the simulation program are based on measurements from test bench driving.
Torque (Nm) and speed (RPM) is used as the in parameter and for example NOx
emission (g/kWh) as out parameter. The bench testing gives a good knowledge about
how the ICE works in stationary operation, but is not valid when the ICE moves too
fast in torque or speed.
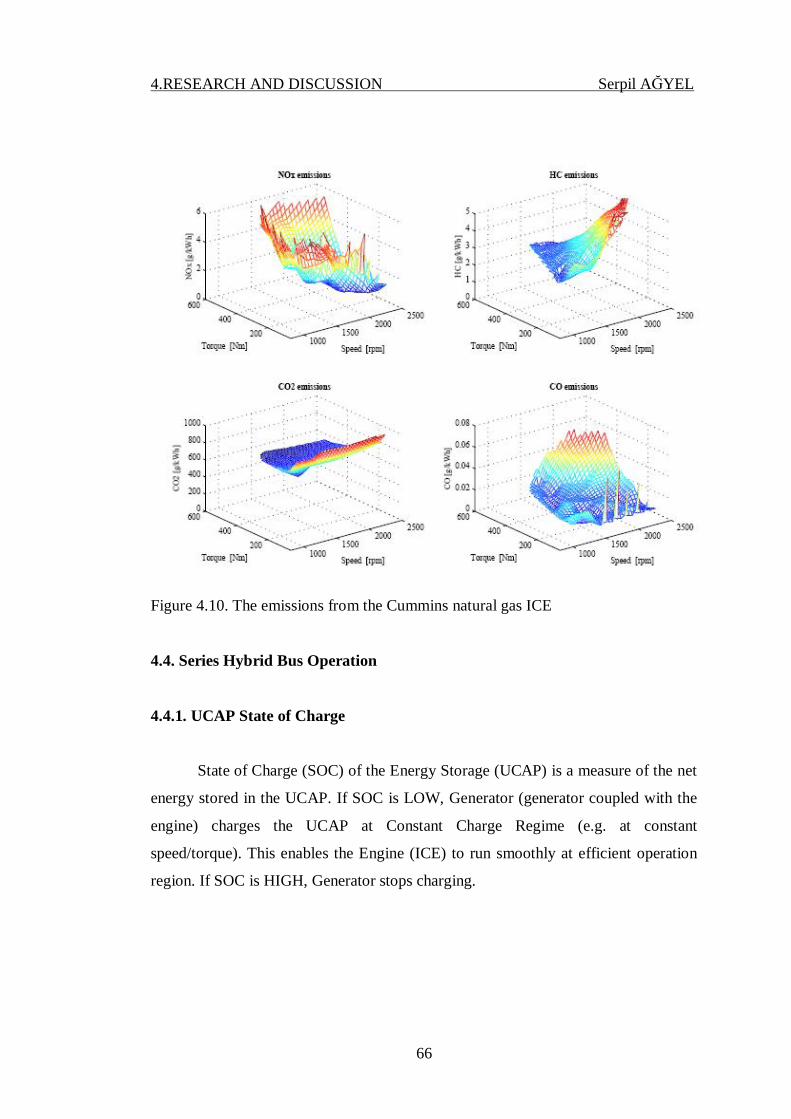
4.RESEARCH AND DISCUSSION Serpil AĞYEL
66
Figure 4.10. The emissions from the Cummins natural gas ICE
4.4. Series Hybrid Bus Operation
4.4.1. UCAP State of Charge
State of Charge (SOC) of the Energy Storage (UCAP) is a measure of the net
energy stored in the UCAP. If SOC is LOW, Generator (generator coupled with the
engine) charges the UCAP at Constant Charge Regime (e.g. at constant
speed/torque). This enables the Engine (ICE) to run smoothly at efficient operation
region. If SOC is HIGH, Generator stops charging.
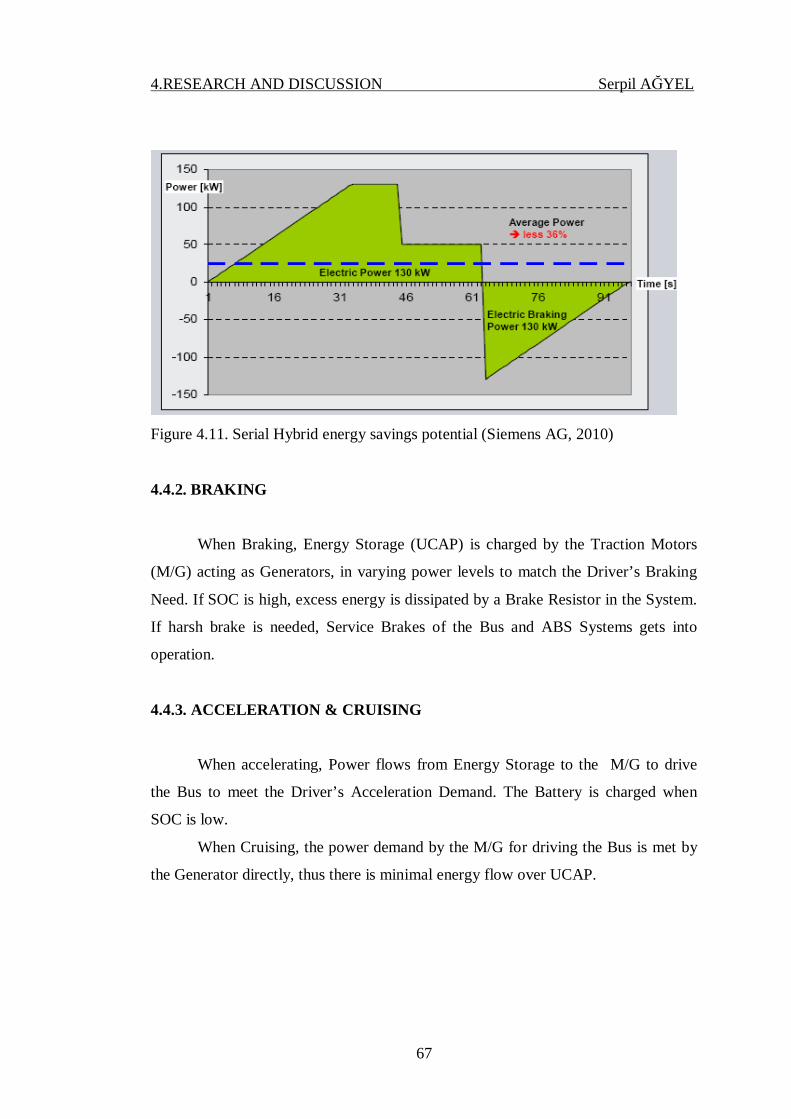
4.RESEARCH AND DISCUSSION Serpil AĞYEL
67
Figure 4.11. Serial Hybrid energy savings potential (Siemens AG, 2010)
4.4.2. BRAKING
When Braking, Energy Storage (UCAP) is charged by the Traction Motors
(M/G) acting as Generators, in varying power levels to match the Driver’s Braking
Need. If SOC is high, excess energy is dissipated by a Brake Resistor in the System.
If harsh brake is needed, Service Brakes of the Bus and ABS Systems gets into
operation.
4.4.3. ACCELERATION & CRUISING
When accelerating, Power flows from Energy Storage to the M/G to drive
the Bus to meet the Driver’s Acceleration Demand. The Battery is charged when
SOC is low.
When Cruising, the power demand by the M/G for driving the Bus is met by
the Generator directly, thus there is minimal energy flow over UCAP.
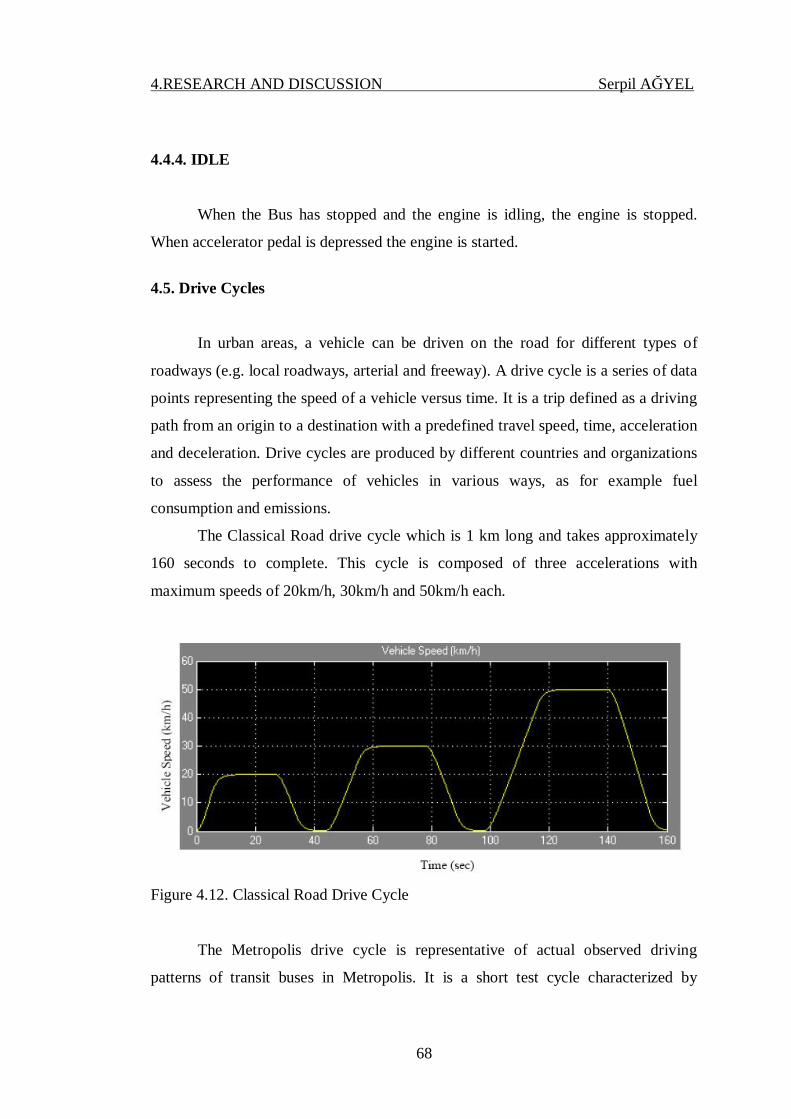
4.RESEARCH AND DISCUSSION Serpil AĞYEL
68
4.4.4. IDLE
When the Bus has stopped and the engine is idling, the engine is stopped.
When accelerator pedal is depressed the engine is started.
4.5. Drive Cycles
In urban areas, a vehicle can be driven on the road for different types of
roadways (e.g. local roadways, arterial and freeway). A drive cycle is a series of data
points representing the speed of a vehicle versus time. It is a trip defined as a driving
path from an origin to a destination with a predefined travel speed, time, acceleration
and deceleration. Drive cycles are produced by different countries and organizations
to assess the performance of vehicles in various ways, as for example fuel
consumption and emissions.
The Classical Road drive cycle which is 1 km long and takes approximately
160 seconds to complete. This cycle is composed of three accelerations with
maximum speeds of 20km/h, 30km/h and 50km/h each.
Figure 4.12. Classical Road Drive Cycle
The Metropolis drive cycle is representative of actual observed driving
patterns of transit buses in Metropolis. It is a short test cycle characterized by
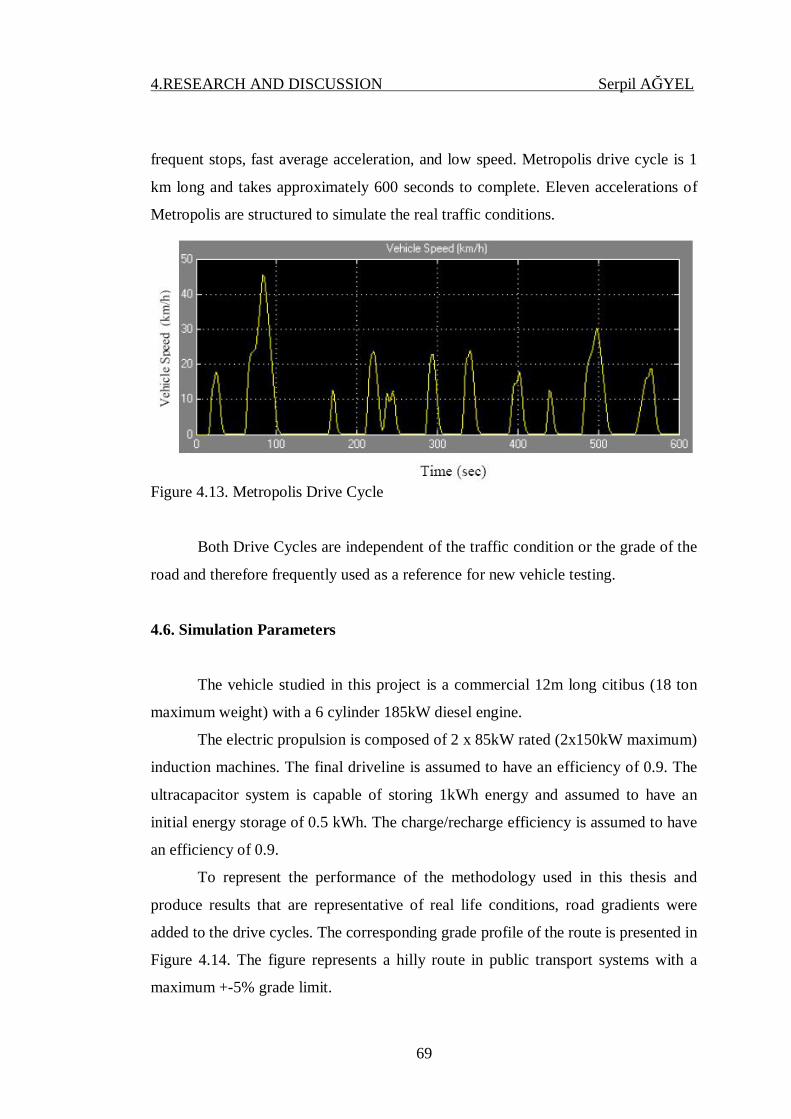
4.RESEARCH AND DISCUSSION Serpil AĞYEL
69
frequent stops, fast average acceleration, and low speed. Metropolis drive cycle is 1
km long and takes approximately 600 seconds to complete. Eleven accelerations of
Metropolis are structured to simulate the real traffic conditions.
Figure 4.13. Metropolis Drive Cycle
Both Drive Cycles are independent of the traffic condition or the grade of the
road and therefore frequently used as a reference for new vehicle testing.
4.6. Simulation Parameters
The vehicle studied in this project is a commercial 12m long citibus (18 ton
maximum weight) with a 6 cylinder 185kW diesel engine.
The electric propulsion is composed of 2 x 85kW rated (2x150kW maximum)
induction machines. The final driveline is assumed to have an efficiency of 0.9. The
ultracapacitor system is capable of storing 1kWh energy and assumed to have an
initial energy storage of 0.5 kWh. The charge/recharge efficiency is assumed to have
an efficiency of 0.9.
To represent the performance of the methodology used in this thesis and
produce results that are representative of real life conditions, road gradients were
added to the drive cycles. The corresponding grade profile of the route is presented in
Figure 4.14. The figure represents a hilly route in public transport systems with a
maximum +-5% grade limit.
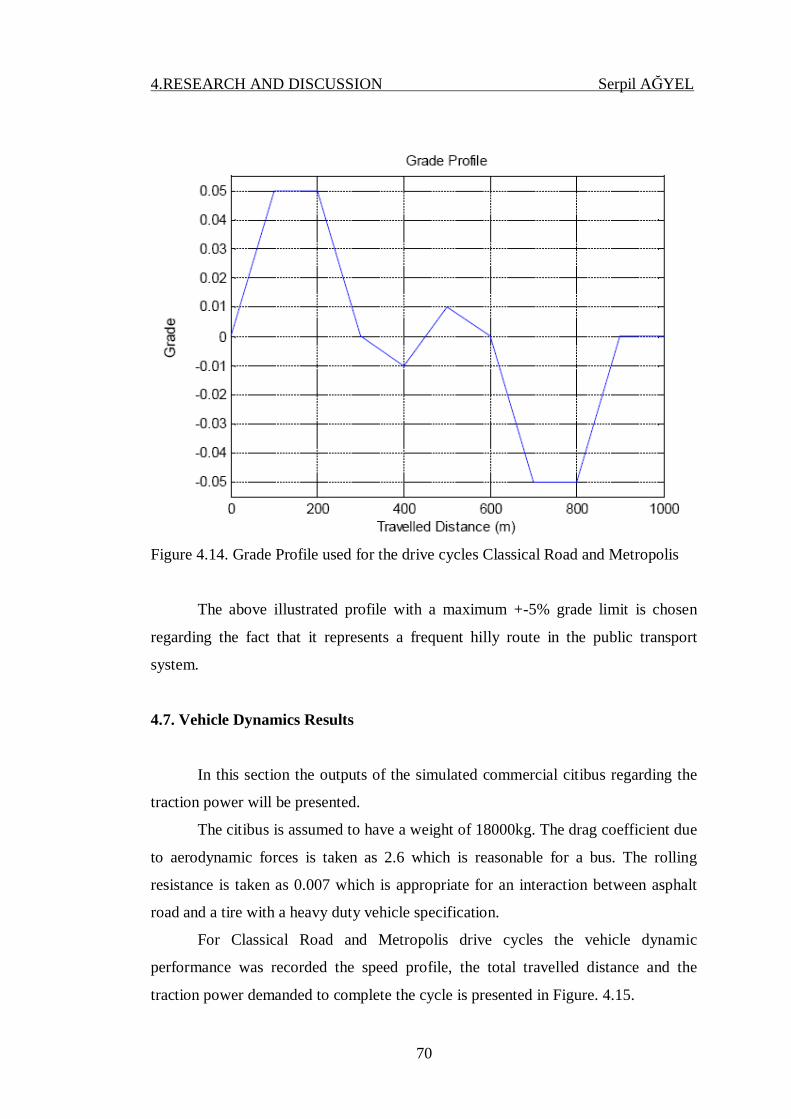
4.RESEARCH AND DISCUSSION Serpil AĞYEL
70
Figure 4.14. Grade Profile used for the drive cycles Classical Road and Metropolis
The above illustrated profile with a maximum +-5% grade limit is chosen
regarding the fact that it represents a frequent hilly route in the public transport
system.
4.7. Vehicle Dynamics Results
In this section the outputs of the simulated commercial citibus regarding the
traction power will be presented.
The citibus is assumed to have a weight of 18000kg. The drag coefficient due
to aerodynamic forces is taken as 2.6 which is reasonable for a bus. The rolling
resistance is taken as 0.007 which is appropriate for an interaction between asphalt
road and a tire with a heavy duty vehicle specification.
For Classical Road and Metropolis drive cycles the vehicle dynamic
performance was recorded the speed profile, the total travelled distance and the
traction power demanded to complete the cycle is presented in Figure. 4.15.
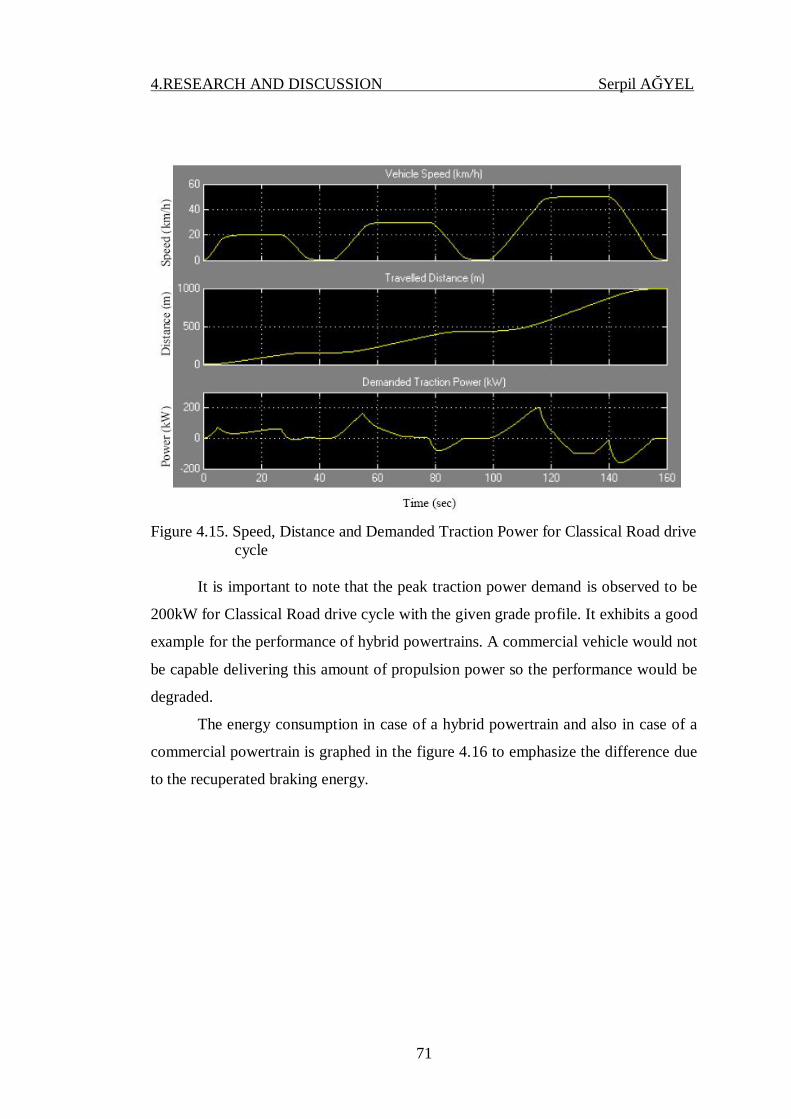
4.RESEARCH AND DISCUSSION Serpil AĞYEL
71
Figure 4.15. Speed, Distance and Demanded Traction Power for Classical Road drive cycle
It is important to note that the peak traction power demand is observed to be
200kW for Classical Road drive cycle with the given grade profile. It exhibits a good
example for the performance of hybrid powertrains. A commercial vehicle would not
be capable delivering this amount of propulsion power so the performance would be
degraded.
The energy consumption in case of a hybrid powertrain and also in case of a
commercial powertrain is graphed in the figure 4.16 to emphasize the difference due
to the recuperated braking energy.

4.RESEARCH AND DISCUSSION Serpil AĞYEL
72
Figure 4.16. Energy Consumption with / without Regenerative Braking
In Metropolis Drive Cycle the peak demanded traction power (300kW) is
even higher due to the fact that the second speed up with 50km/h maximum speed
has a relatively high acceleration of 8 m/s.
Figure 4.17. Speed, Distance and Demanded Traction Power for Metropolis drive cycle
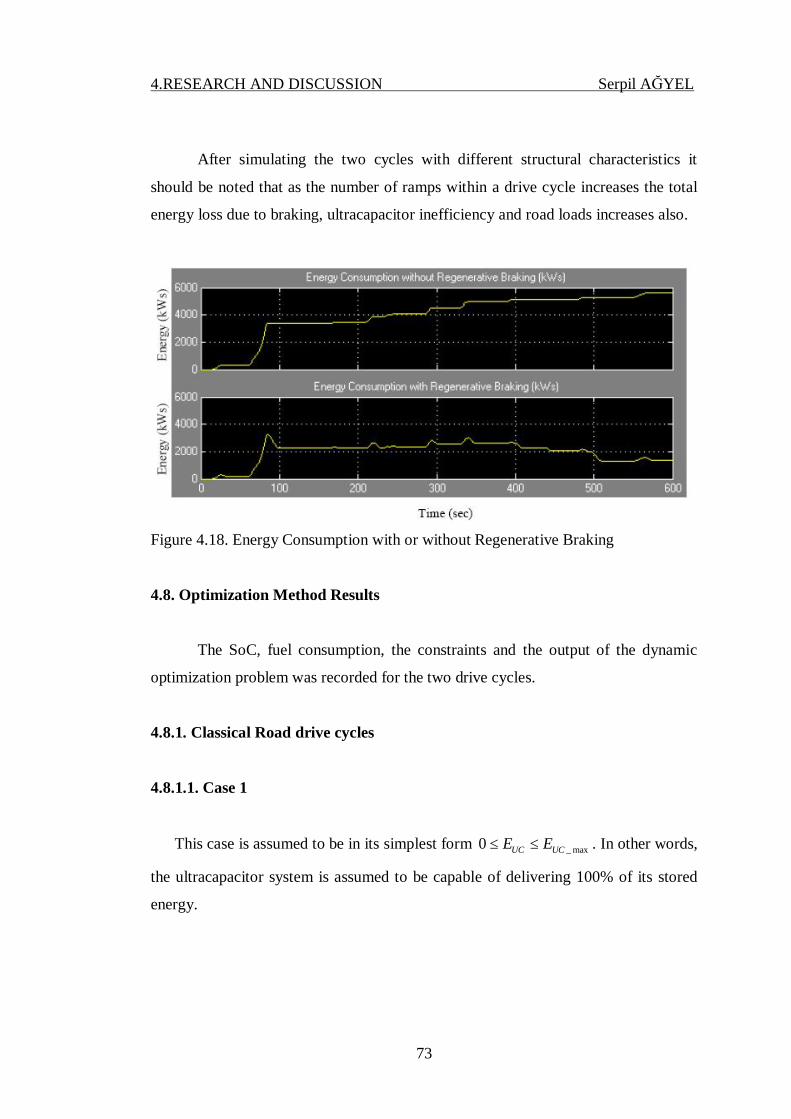
4.RESEARCH AND DISCUSSION Serpil AĞYEL
73
After simulating the two cycles with different structural characteristics it
should be noted that as the number of ramps within a drive cycle increases the total
energy loss due to braking, ultracapacitor inefficiency and road loads increases also.
Figure 4.18. Energy Consumption with or without Regenerative Braking
4.8. Optimization Method Results
The SoC, fuel consumption, the constraints and the output of the dynamic
optimization problem was recorded for the two drive cycles.
4.8.1. Classical Road drive cycles
4.8.1.1. Case 1
This case is assumed to be in its simplest form _ max0 UC UCE E≤ ≤ . In other words,
the ultracapacitor system is assumed to be capable of delivering 100% of its stored
energy.

4.RESEARCH AND DISCUSSION Serpil AĞYEL
74
Figure 4.19. SoC, fuel consumption and generator power for Classical Road drive cycle case 1
The first graph presents the ultracapacitor SoC which depletes after 55
seconds due to the second acceleration of the vehicle. The constraint can not fulfill
the requirement to follow the demanded speed profile. The second graph presents the
fuel consumption of the vehicle. The yellow curve in the last graph presents the
optimization output for generator power. As the ultracapacitor energy depletes, the
generator power is observed to be increasing exceeding its physical limits. Therefore
a saturated signal (magenta) represents the physical limitations of the generator
power. The blue curve is both low-pass-filtered and saturated output. It simulates the
time lag due to the fuel injection response and the dynamics of the ICE which is
named as the ”slew rate”.
Figure 4.20 exhibits the behavior of the upper bound (yellow curve) and
lower bound (magenta curve).
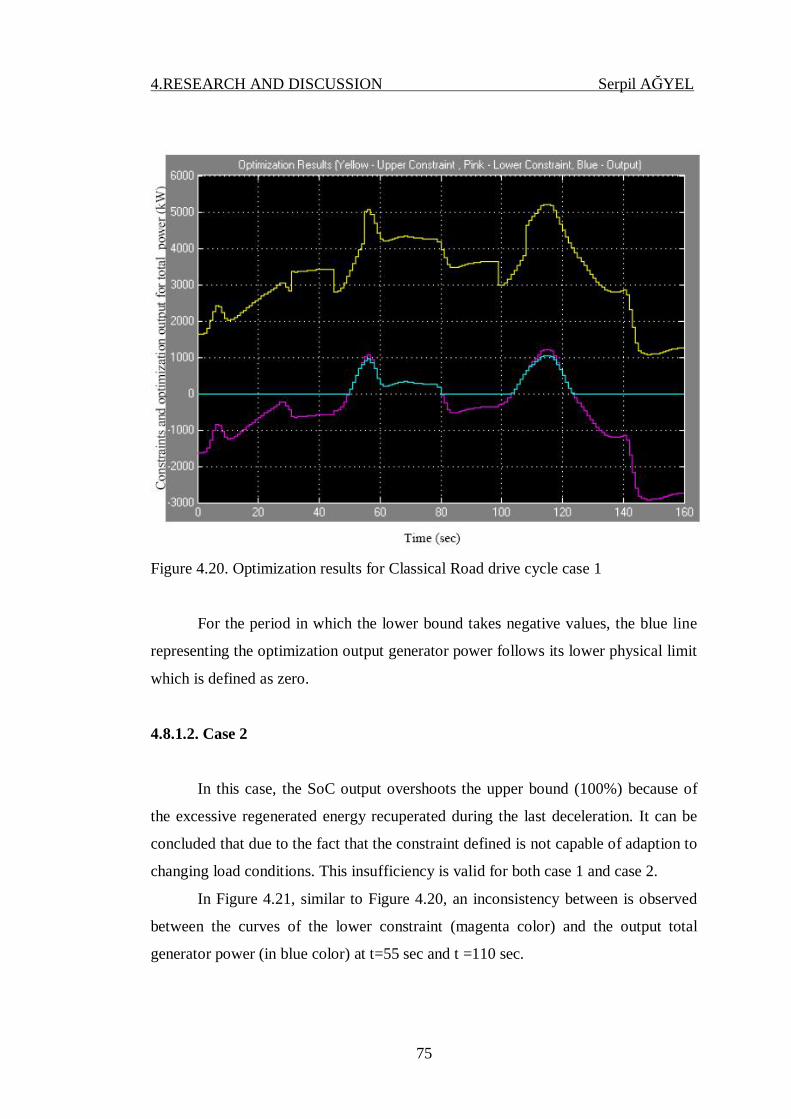
4.RESEARCH AND DISCUSSION Serpil AĞYEL
75
Figure 4.20. Optimization results for Classical Road drive cycle case 1
For the period in which the lower bound takes negative values, the blue line
representing the optimization output generator power follows its lower physical limit
which is defined as zero.
4.8.1.2. Case 2
In this case, the SoC output overshoots the upper bound (100%) because of
the excessive regenerated energy recuperated during the last deceleration. It can be
concluded that due to the fact that the constraint defined is not capable of adaption to
changing load conditions. This insufficiency is valid for both case 1 and case 2.
In Figure 4.21, similar to Figure 4.20, an inconsistency between is observed
between the curves of the lower constraint (magenta color) and the output total
generator power (in blue color) at t=55 sec and t =110 sec.
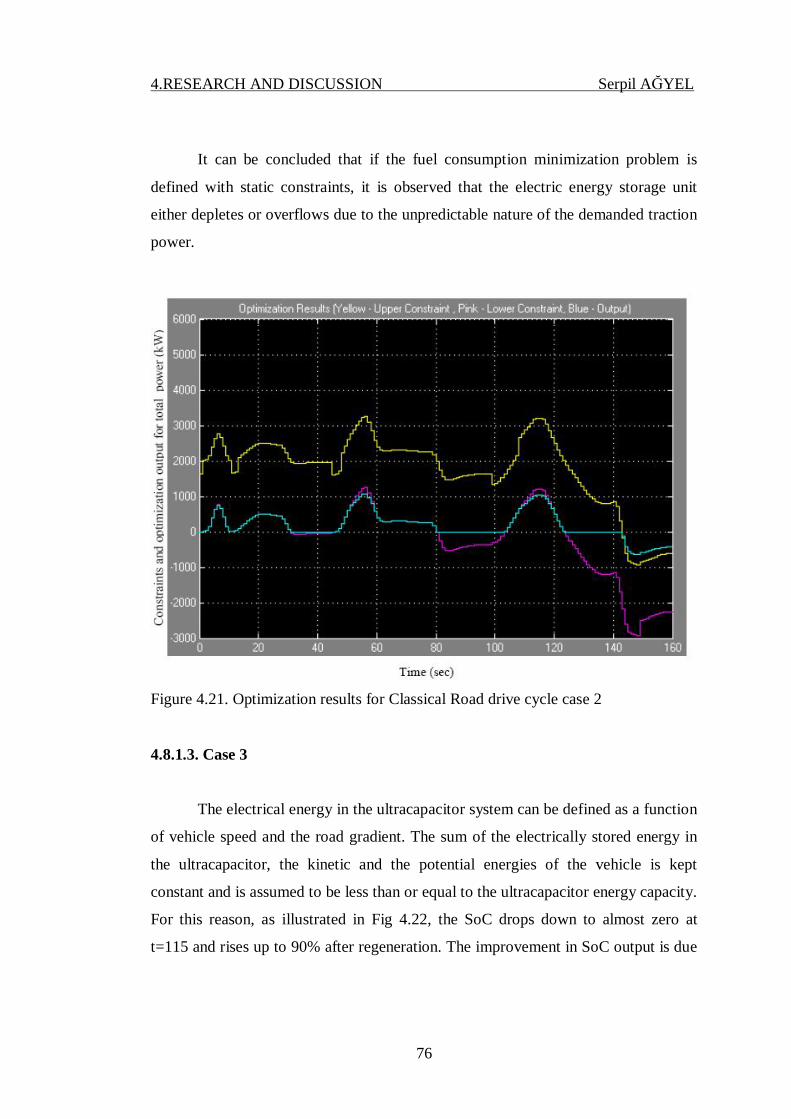
4.RESEARCH AND DISCUSSION Serpil AĞYEL
76
It can be concluded that if the fuel consumption minimization problem is
defined with static constraints, it is observed that the electric energy storage unit
either depletes or overflows due to the unpredictable nature of the demanded traction
power.
Figure 4.21. Optimization results for Classical Road drive cycle case 2
4.8.1.3. Case 3
The electrical energy in the ultracapacitor system can be defined as a function
of vehicle speed and the road gradient. The sum of the electrically stored energy in
the ultracapacitor, the kinetic and the potential energies of the vehicle is kept
constant and is assumed to be less than or equal to the ultracapacitor energy capacity.
For this reason, as illustrated in Fig 4.22, the SoC drops down to almost zero at
t=115 and rises up to 90% after regeneration. The improvement in SoC output is due
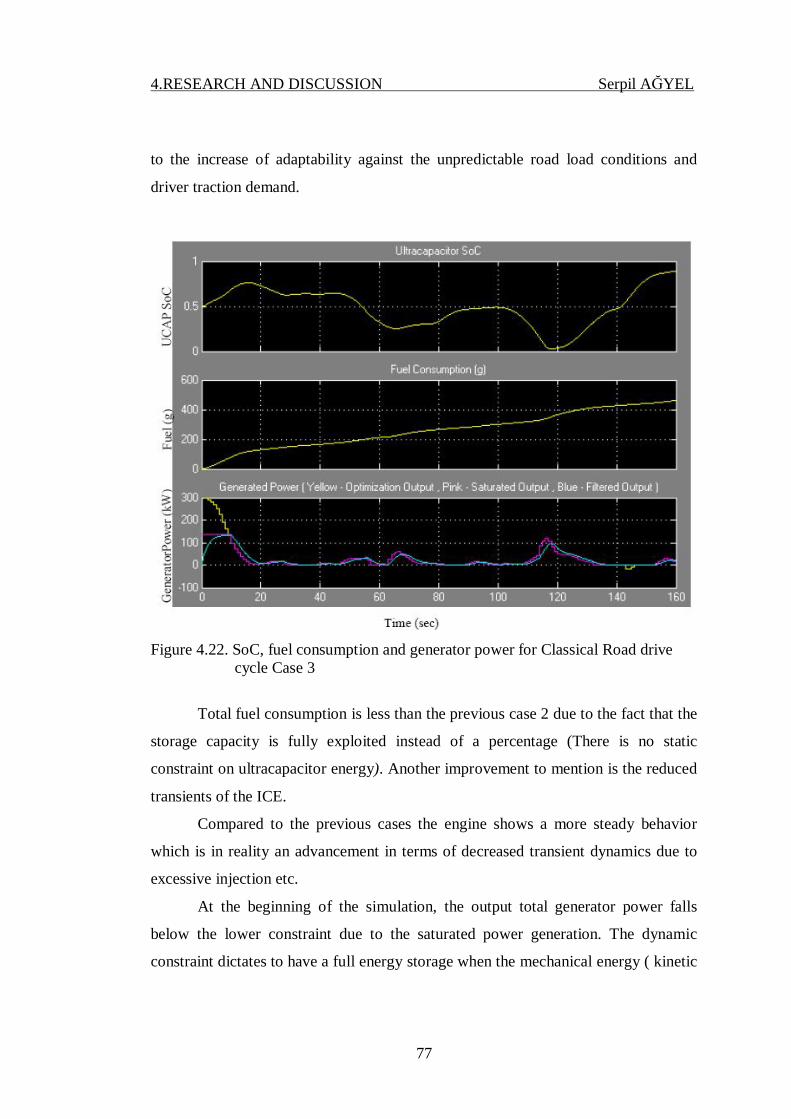
4.RESEARCH AND DISCUSSION Serpil AĞYEL
77
to the increase of adaptability against the unpredictable road load conditions and
driver traction demand.
Figure 4.22. SoC, fuel consumption and generator power for Classical Road drive cycle Case 3
Total fuel consumption is less than the previous case 2 due to the fact that the
storage capacity is fully exploited instead of a percentage (There is no static
constraint on ultracapacitor energy). Another improvement to mention is the reduced
transients of the ICE.
Compared to the previous cases the engine shows a more steady behavior
which is in reality an advancement in terms of decreased transient dynamics due to
excessive injection etc.
At the beginning of the simulation, the output total generator power falls
below the lower constraint due to the saturated power generation. The dynamic
constraint dictates to have a full energy storage when the mechanical energy ( kinetic
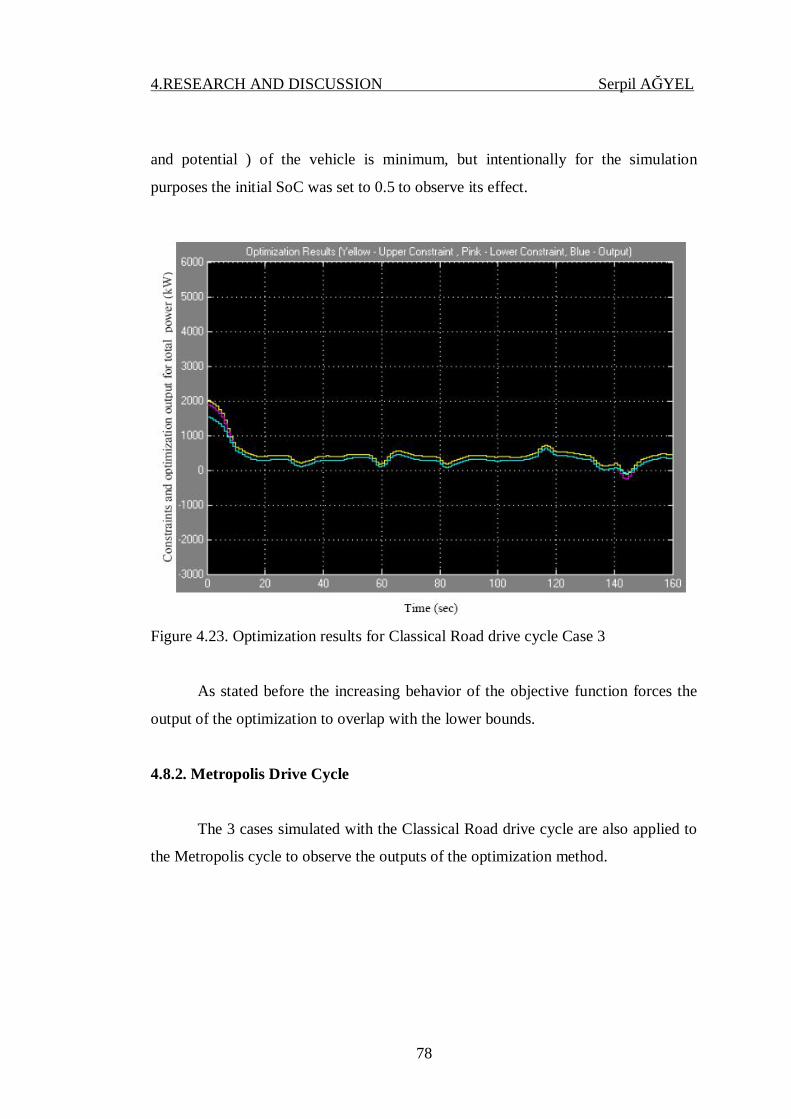
4.RESEARCH AND DISCUSSION Serpil AĞYEL
78
and potential ) of the vehicle is minimum, but intentionally for the simulation
purposes the initial SoC was set to 0.5 to observe its effect.
Figure 4.23. Optimization results for Classical Road drive cycle Case 3
As stated before the increasing behavior of the objective function forces the
output of the optimization to overlap with the lower bounds.
4.8.2. Metropolis Drive Cycle
The 3 cases simulated with the Classical Road drive cycle are also applied to
the Metropolis cycle to observe the outputs of the optimization method.
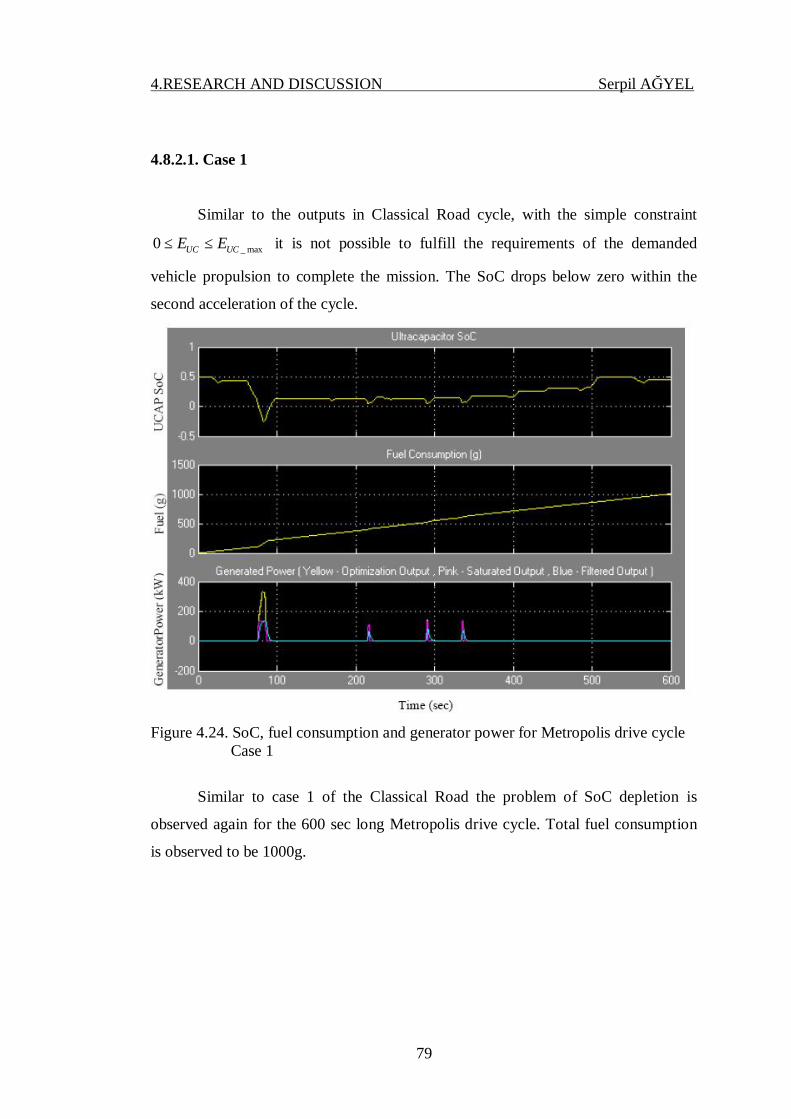
4.RESEARCH AND DISCUSSION Serpil AĞYEL
79
4.8.2.1. Case 1
Similar to the outputs in Classical Road cycle, with the simple constraint
_ max0 UC UCE E≤ ≤ it is not possible to fulfill the requirements of the demanded
vehicle propulsion to complete the mission. The SoC drops below zero within the
second acceleration of the cycle.
Figure 4.24. SoC, fuel consumption and generator power for Metropolis drive cycle Case 1
Similar to case 1 of the Classical Road the problem of SoC depletion is
observed again for the 600 sec long Metropolis drive cycle. Total fuel consumption
is observed to be 1000g.
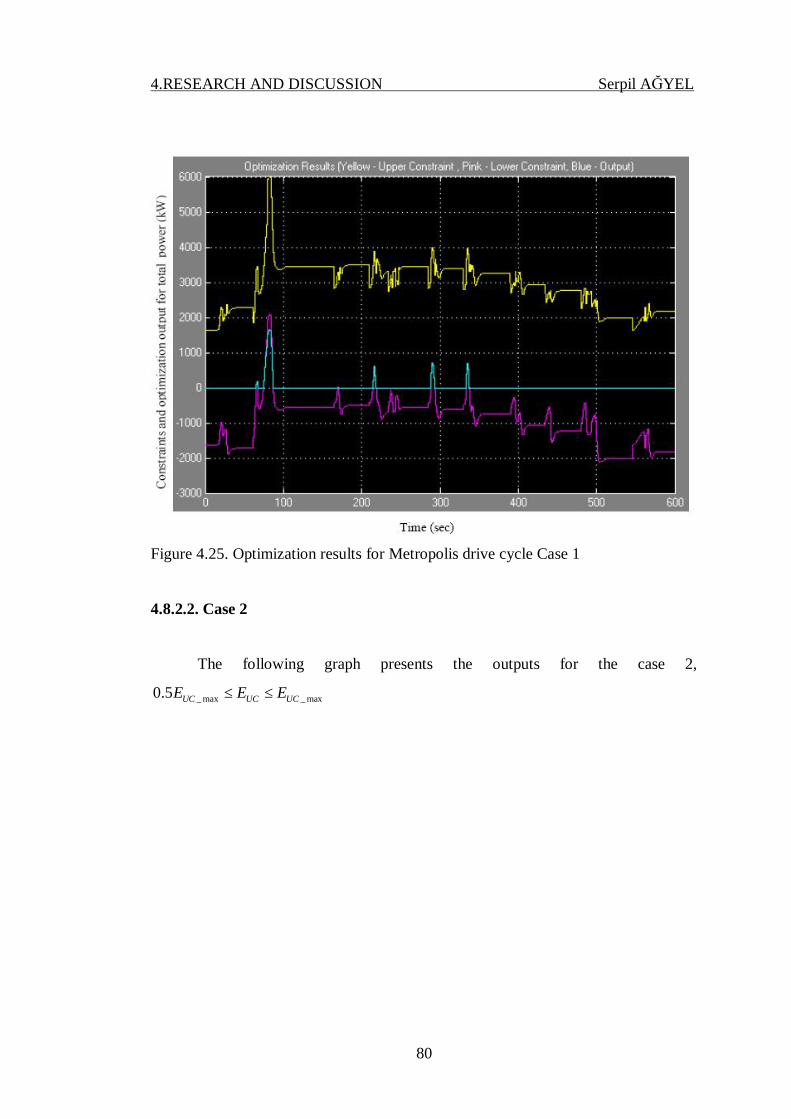
4.RESEARCH AND DISCUSSION Serpil AĞYEL
80
Figure 4.25. Optimization results for Metropolis drive cycle Case 1
4.8.2.2. Case 2
The following graph presents the outputs for the case 2,
_ max _ max0.5 UC UC UCE E E≤ ≤
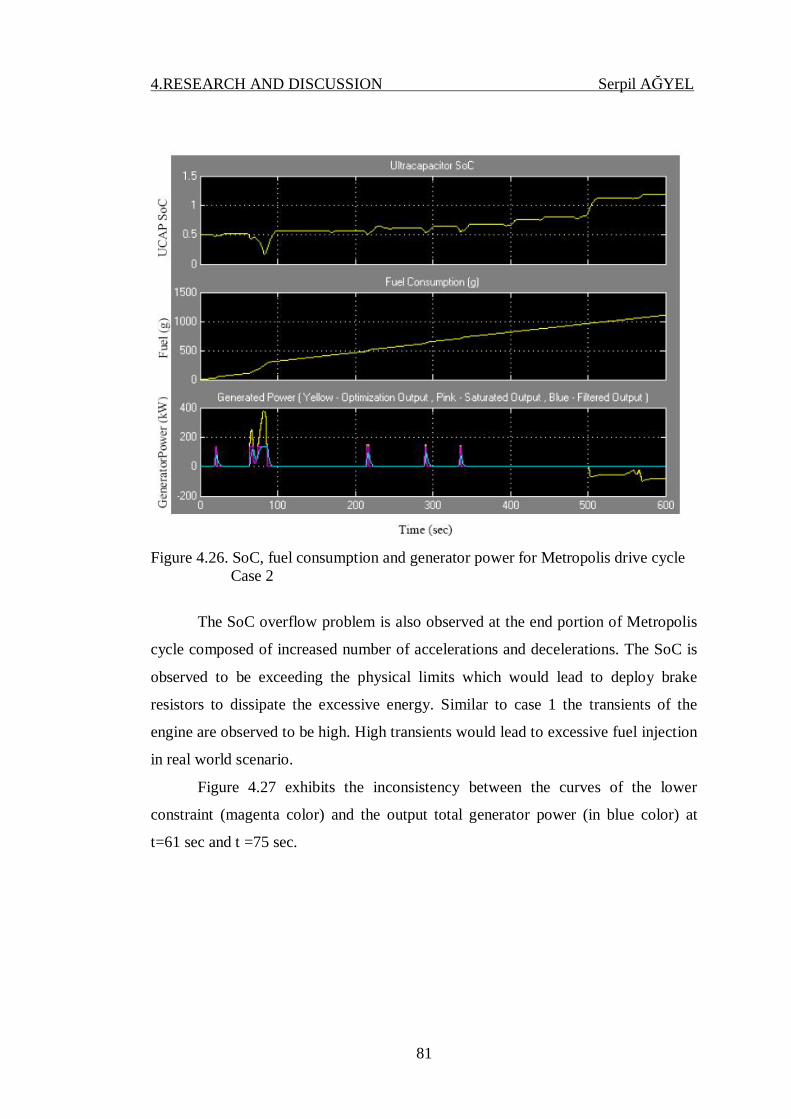
4.RESEARCH AND DISCUSSION Serpil AĞYEL
81
Figure 4.26. SoC, fuel consumption and generator power for Metropolis drive cycle Case 2
The SoC overflow problem is also observed at the end portion of Metropolis
cycle composed of increased number of accelerations and decelerations. The SoC is
observed to be exceeding the physical limits which would lead to deploy brake
resistors to dissipate the excessive energy. Similar to case 1 the transients of the
engine are observed to be high. High transients would lead to excessive fuel injection
in real world scenario.
Figure 4.27 exhibits the inconsistency between the curves of the lower
constraint (magenta color) and the output total generator power (in blue color) at
t=61 sec and t =75 sec.
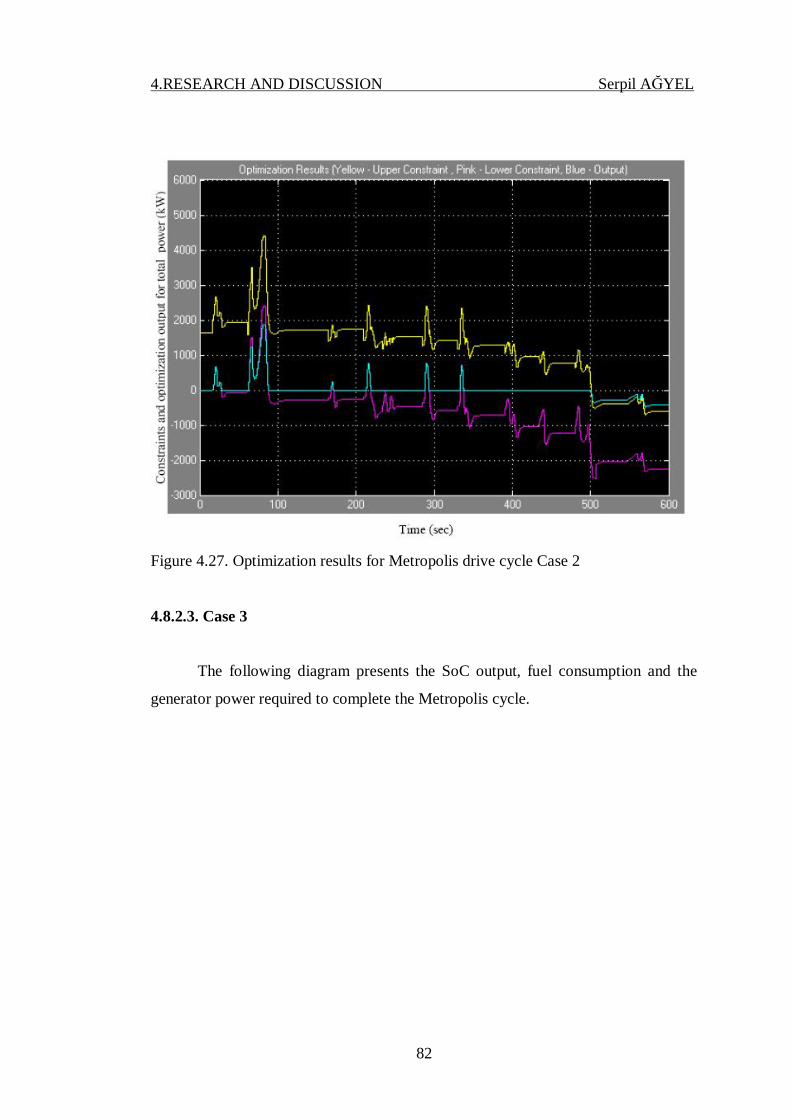
4.RESEARCH AND DISCUSSION Serpil AĞYEL
82
Figure 4.27. Optimization results for Metropolis drive cycle Case 2
4.8.2.3. Case 3
The following diagram presents the SoC output, fuel consumption and the
generator power required to complete the Metropolis cycle.
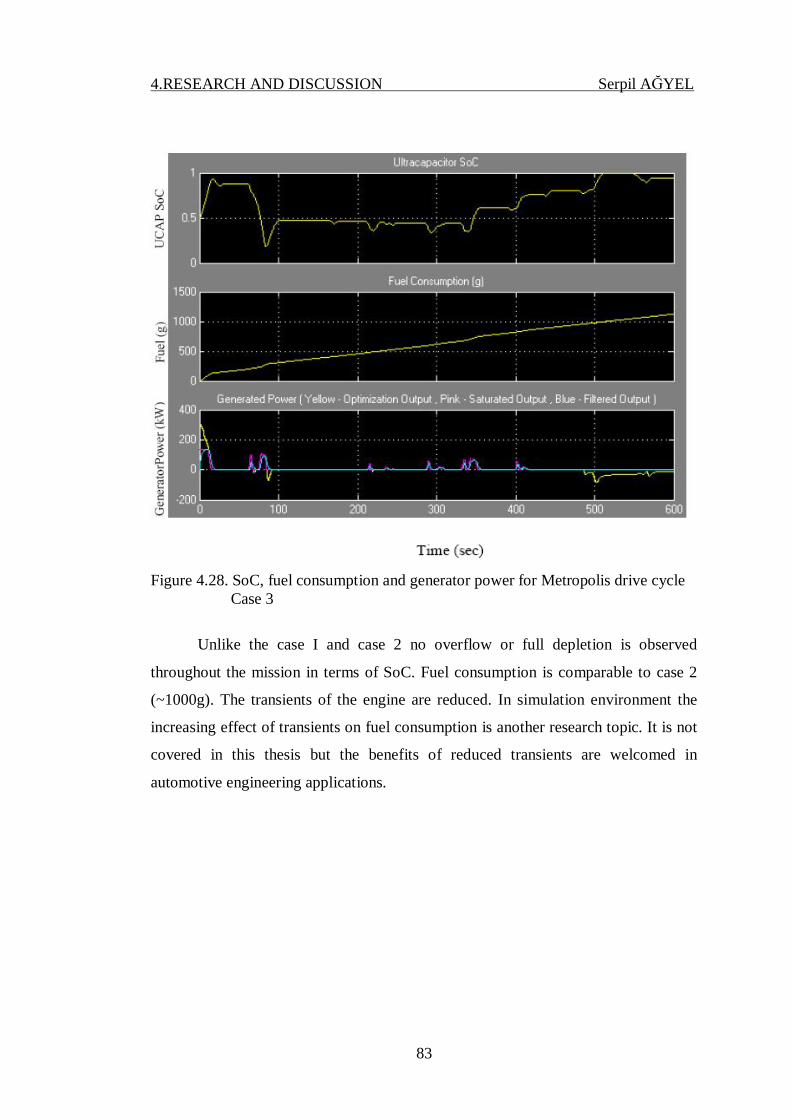
4.RESEARCH AND DISCUSSION Serpil AĞYEL
83
Figure 4.28. SoC, fuel consumption and generator power for Metropolis drive cycle Case 3
Unlike the case I and case 2 no overflow or full depletion is observed
throughout the mission in terms of SoC. Fuel consumption is comparable to case 2
(~1000g). The transients of the engine are reduced. In simulation environment the
increasing effect of transients on fuel consumption is another research topic. It is not
covered in this thesis but the benefits of reduced transients are welcomed in
automotive engineering applications.

4.RESEARCH AND DISCUSSION Serpil AĞYEL
84
Figure 4.29. Optimization results for Metropolis drive cycle Case 3
In this chapter, a simulation study was conducted to assess the performance of
a series hybrid vehicle configuration using two standard driving cycles, Classical
Road and Metropolis. Simulation parameters were introduced and the simulated
vehicle dynamical outputs were presented.
The results indicated that depending on the constraint type chosen, the SoC of
the storage unit can be fully or partially used to reduce the fuel consumption of a
series HEV in city cruising.
The problem is complicated due to the fact that the future driving demands
are largely unknown. This uncertainty of the future driving makes it difficult, from a
fuel efficiency viewpoint, to compare the cost of supplying the energy demand from
the buffer or the fuel tank. In this thesis this problem is handled by using a prediction
based information perspective. It allows utilization of a policy derived by Dynamic
Programming. Using a simple model of the power flows, energy levels and a
regression model of the future driving, the resulting policy minimizes the expected

4.RESEARCH AND DISCUSSION Serpil AĞYEL
85
fuel consumption with respect to the prediction model of the future driving
conditions.
Additional information from GPS and digital maps or cooperation with the
traffic infrastructure further enhances the optimization in terms of improved
predictions and constraints and can be used to better schedule the use of the buffer so
that further fuel consumption reductions are achieved.

4.RESEARCH AND DISCUSSION Serpil AĞYEL
86
5.CONCLUSION Serpil AĞYEL
87
5. CONCLUSION
The major conclusions are:
1. To be able to write “near optimal” specifications for a hybrid bus it is
important to know the driving cycles, what kind of traffic, how steep hills and how
many passengers the bus is expected to carry. Without such “a priori” knowledge, the
hybrid drive train is likely to be overpowered with significantly less than optimal
performance in terms of emissions, fuel consumption and battery losses. The ICE
must be selected and purposefully designed with regard to average and peak power
production. This in turn requires a well-defined charging strategy. The battery size
must be limited to a minimum with respect to either the charging strategy or the
minimum zero emission driving distance.
2. The charging strategy is important to minimize exhaust emissions and fuel
consumption. The goal should be to supply instantaneous power to the traction and
auxiliary systems, but without exceeding the limit for transient emission generation
with the ICE. With such a goal, the battery will be minimized with respect to the
charging strategy.
Since the driver's traction power demand depends the driving environment
which makes it difficult to know the driving pattern exactly, the proposed policy
minimizes the fuel consumption with respect to the predicted model of the future
driving conditions using a simple model of the power flow, energy levels and a
regression model of the future driving.
The solution methods were assembled for a detailed assessment of fuel
consumption in various drive cycles via Matlab/Simulink. In order to monitor
various strategies, a rather simple Classical Road drive cycle and a well known urban
Metropolis drive cycle were taken into consideration in the fuel efficiency
assessment. It can be concluded according to the detailed simulation results including
vehicle speed, electric motor power, ultracapacitor SoC and average fuel
consumption that HEVs have superior fuel consumption attributes if compared to the
conventional vehicle in the urban cycle. The study also showed that selection of
power management strategies in terms of optimization parameters and constraints

5.CONCLUSION Serpil AĞYEL
88
plays a key role in the fuel consumption dynamics as well as the state of charge of
the ultracapacitor. Three different constraint sets were presented for both drive
cycles. By analyzing the optimization results, an improved constraint based control
strategy was developed.
The simulation system does not only allow investigating the influence of
different energy management strategies, but could also be used to optimize the size
of the electric energy storage unit by investigating its influence on optimization and
power availability.
89
REFERENCES
ANDERSSON, C., 2001. Observations on Electric Hybrid Bus Design
ANSTROM, J.R., 2005. et al. Simulation and field-testing of hybrid
ultra-capacitor/battery energy storage systems for electric and hybrid-electric
transit vehicles.
ARULEPP, M., 2006. et al., The advanced carbide-derived carbon based
supercapacitor. Journal of Power Sources. 162(2 SPEC ISS): p. 1460-1466.
BALCH, R.C., BURKE, A. and FRANK, A.A., 2001. The affect of battery pack
technology and size choices on hybrid electric vehicle performance and fuel
economy. , Jan 9-12. Long Beach, CL: IEEE.
CARLSON, E., KOPF, P., and SINHA, J., 2005. Fuel Cell seminar. Cambridge MA
CONGRESS, G.C., 2007 [cited 2007 7.1]; Available from:
http://www.greencarcongress.com/2007/06/report_toyota_w.html.
DOUGLAS, H. and PILLAY, P., 2005. Sizing ultracapacitors for hybrid electric
vehicles. Raleigh, NC, United States: Institute of Electrical and Electronics
Engineers Computer Society, Piscataway, NJ 08855-1331, United States.
DRIVECLEAN.GOV., 2006. Webpage:
www.driveclean.ca.gov/en/gv/home/index.asp, driveclean.gov. Accessed on
September 15.
GILLESPIE, T.D., 1992. “Fundamentals of Vehicle Dynamics”, Society of
Automotive Engineers, Inc.
GUENTHER, M. and DONG, Z., 2005. Modelling, Testing and Design Optimization
of PEM Fuel Cell System for Low-speed Electric Vehicles. Department of
Mechanical Engineering and Institute for Integrated Energy Systems.
HE X, PARTEN M, MAXWELL T., 2005. Energy Management Strategies for a
Hybrid Electric Vehicles, Advanced Vehicle Engineering Laboratory, IEEE.
HORIBA, T., 2005. et al., Applications of high power density lithium ion batteries.
Journal of Power Sources. 146(1-2): p. 107-10.
ITO, K. and OHNISHI, M., 2003. Development of prismatic type nickel/metal-
hydride battery for HEV, in Proceedings of the 20 th Elec tric Vehicle

90
Symposium. Long Beach
JONG-SEOB, W., LANGARI, R. and EHSANI, M., 2005, An energy management
and charge sustaining strategy for a parallel hybrid vehicle with CVT. IEEE
Transactions on Control Systems Technology. 13(2): p. 313-20.
KARDEN, E., 2007. et al., Energy storage devices for future hybrid electric vehicles.
Journal of Power Sources. 168(1): p. 2-11.
KOTZ, R. and CARLEN, M., 2000. Principles and applications of electrochemical
capacitors. Electrochimica Acta. 45(15-16): p. 2483-2498.
MARKEL, T. and SIMPSON, A., 2005. Energy storage systems considerations for
grid-charged hybrid electric vehicles. Chicago, IL, United States: Institute of
Electrical and Electronics Engineers Computer Society, Piscataway, NJ
08855-1331, U.S.
MARKEL, T. and WIPKE, K., 2001. Modeling grid-connected hybrid electric
vehicles using ADVISOR. in 16th Annual Battery Conference on
Applications and Advances, Jan 9-12. Long Beach, CL: Institute of Electr ical
and Electronics Engineers Inc.
MARKEL, T., 2002 et al., ADVISOR: A systems analysis tool for advanced vehicle
modeling. Journal of Power Sources. 110(2): p. 255-266.
MAXWELL TECHNOLOGIES., 2008. Maxwell Ultracapacitors,
20080717_POWER_CHARTS_1.6.
2009. Product Guide – Maxwell Technologies BOOSTCAP Ultracapacitors–
Doc. No. 1014627.1
MICKLETHWAIT, J. E., 2006. More of everything. The Economist, September
16th-22nd, pp. 18-19.
2006. Roads to Somewhere. The Economist, June 24th-30th, pp. 36-37.
MILLER, J., 2004. Propulsion Systems for Hybrid Vehicles, . Institution of
Electrical Engineers: London, United Kingdom.
OKAN, R. Y., 2008. Energy and Power Managementin Series Hybrid Vehicles.
RUFER, A. and BARRADE, P., 2001. A supercapacitor-based energy storage
system for elevators with soft commutated interface Sep 30-Oct 4 2001.
Chicago, IL: Institute of Electrical and Electronics Engineers Inc.
91
SANTI, E., 2002. et al. A fuel cell based domestic uninterruptible power supply. in
17th Annual IEEE Applied Power Electronics Conference and Exposition,
Mar 10-14 2002. Dalas, TX: IEEE Inc.
SCHUPBACH, R.M., 2003. et al. Design methodology of a combined battery-
ultracapacitor energy storage unit for vehicle power management. Acapulco,
Mexico: IEEE.
SIEMENS AG., 2007. ELFA hybrid drive system brochure.
2010. http://www.automation.siemens.com/mcms/large-drives/en/hybrid-
drives/Pages/hybrid-drives.aspx
STAUNTON, R.H., 2006. et al., Evaluation of 2004 Toyota Prius Hybrid Electric
Drive System. United States. p. Size: 4 Mb.
STIENECKER, A.W., STUART, T. and ASHTIANI, C., 2006. An ultracapacitor
circuit for reducing sulfation in lead acid batteries for Mild Hybrid Electric
Vehicles. Journal of Power Sources. 156(2): p. 755-762.
SUPPLIERBUSINESS LTD., 2010. The Hybrid Commercial Vehicles Report. p: 28
TANIGUCHI, A., 2001. et al., Development of nickel/metal-hydride batteries for
EVs and HEVs. Journal of Power Sources. 100(1-2): p. 117-124.
VAHIDI, A., 2009. Ultracapacitor Assisted Powertrains, Capacitor Consortium
Planning Meeting
WESTBROOK, M., 2001. The Electric Car:Development and future of battery,
hybrid and fuel-cell cars. IEE Power and Energy Series 38, ed. A. Johns and
D. Warne., London, United Kingdom: Institution of Electrical Engineers.
WIPKE, K.B., CUDDY, M. R. and BURCH, S.D., 1999. ADVISOR 2.1: A user-
friendly Advanced powertrain simulation using a combined
backward/forward approach. IEEE Transactions on Vehicular Technology.
48(6): p. 1751-1761.
WISHART, J., 2008. Modelling, Simulation, Testing, and Optimization of Advanced
Hybrid Vehicle Powertrains.
ZHOU, Y. L., 2007. Modeling and Simulation of Hybrid Electric Vehicles

92

93
CURRICULUM VITAE
I was born on 10th of August, 1983 in Kars. I completed my high school
education in Kars Fen Lisesi. After high school I attend to Electrical and Electronics
Department of University of Çukurova in 2001. I graduated from the university in
2007. I worked at Fidancan Mühendislik A.Ş. between years 2007-2008. Later I
worked in International Customer Services Department of Temsa Global A.Ş
between years 2008-2010. And I continued Master of Science program at Electrical
and Electronics Engineering Department of University of Çukurova between years
2008-2011.
94
APPENDIX A:
MATLAB/SIMULINK (The MathWorks, Inc, 2011)
1. Introduction
Simulink® is an environment for multidomain simulation and Model-Based
Design for dynamic and embedded systems. It provides an interactive graphical
environment and a customizable set of block libraries that let you design, simulate,
implement, and test a variety of time-varying systems, including communications,
controls, signal processing, video processing, and image processing.
Add-on products extend Simulink software to multiple modeling domains, as
well as provide tools for design, implementation, and verification and validation
tasks.
Simulink is integrated with MATLAB®, providing immediate access to an
extensive range of tools that let you develop algorithms, analyze and visualize
simulations, create batch processing scripts, customize the modeling environment,
and define signal, parameter, and test data.
2. Key Features
• Extensive and expandable libraries of predefined blocks
• Interactive graphical editor for assembling and managing intuitive block
diagrams
• Ability to manage complex designs by segmenting models into hierarchies of
design components
• Model Explorer to navigate, create, configure, and search all signals,
parameters, properties, and generated code associated with your model
• Application programming interfaces (APIs) that let you connect with other
simulation programs and incorporate hand-written code
• Embedded MATLAB™ Function blocks for bringing MATLAB algorithms
into Simulink and embedded system implementations
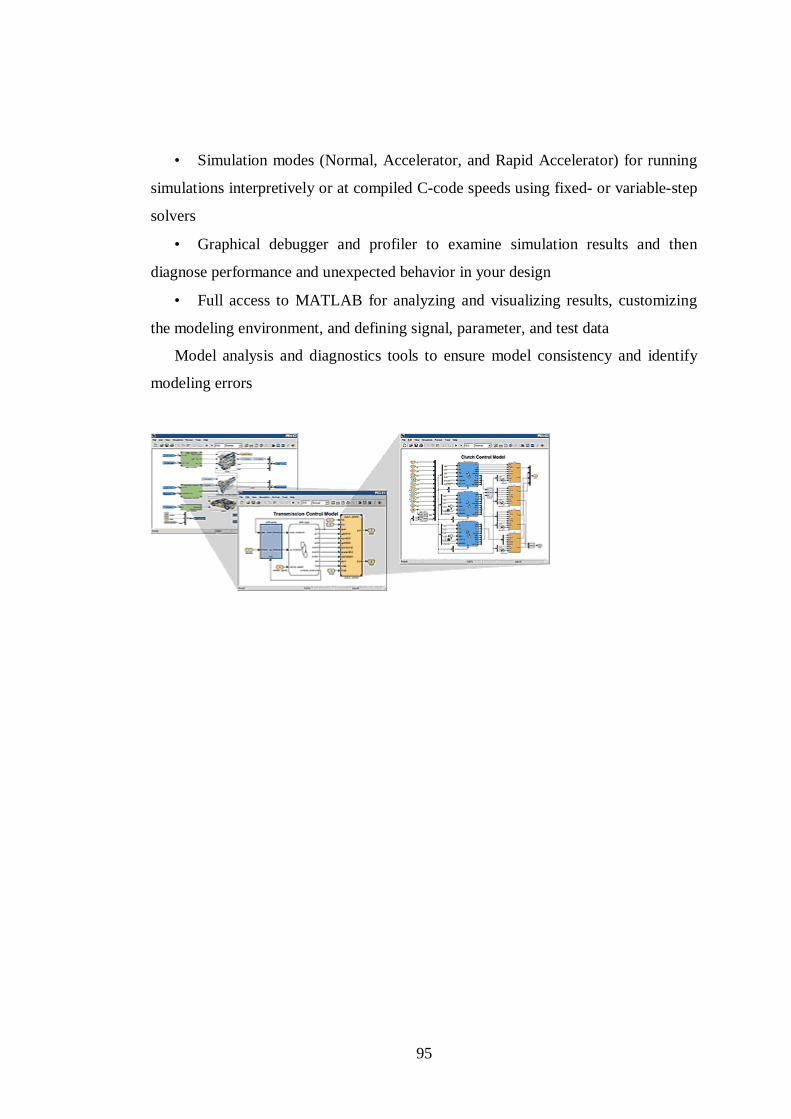
95
• Simulation modes (Normal, Accelerator, and Rapid Accelerator) for running
simulations interpretively or at compiled C-code speeds using fixed- or variable-step
solvers
• Graphical debugger and profiler to examine simulation results and then
diagnose performance and unexpected behavior in your design
• Full access to MATLAB for analyzing and visualizing results, customizing
the modeling environment, and defining signal, parameter, and test data
Model analysis and diagnostics tools to ensure model consistency and identify
modeling errors
96
APPENDIX B:
Ultracapacitors (Maxwell Technologies, 2009)
1. Description of Double Layer Capacitors
1.1. Theory
Electrochemical double layer capacitors (EDLCs) are similarly known as
supercapacitors or ultracapacitors. An ultracapacitor stores energy electrostatically
by polarizing an electrolytic solution. Though it is an electrochemical device there
are no chemical reactions involved in its energy storage mechanism. This mechanism
is highly reversible, allowing the ultracapacitor to be charged and discharged
hundreds of thousands to even millions of times.
An ultracapacitor can be viewed as two non-reactive porous plates suspended
within an electrolyte with an applied voltage across the plates. The applied potential
on the positive plate attracts the negative ions in the electrolyte, while the potential
on the negative plate attracts the positive ions. This effectively creates two layers of
capacitive storage, one where the charges are separated at the positive plate, and
another at the negative plate.
Conventional electrolytic capacitors storage area is derived from thin plates of
flat, conductive material. High capacitance is achieved by winding great lengths of
material. Further increases are possible through texturing on its surface, increasing its
surface area. A conventional capacitor separates its charged plates with a dielectric
material: plastic, paper or ceramic films. The thinner the dielectric the more area can
be created within a specified volume. The limitations of the thickness of the
dielectric define the surface area achievable.
An ultracapacitor derives its area from a porous carbon-based electrode material.
The porous structure of this material allows its surface area to approach 2000 square
meters per gram, much greater than can be accomplished using flat or textured films
and plates. An ultracapacitors charge separation distance is determined by the size of
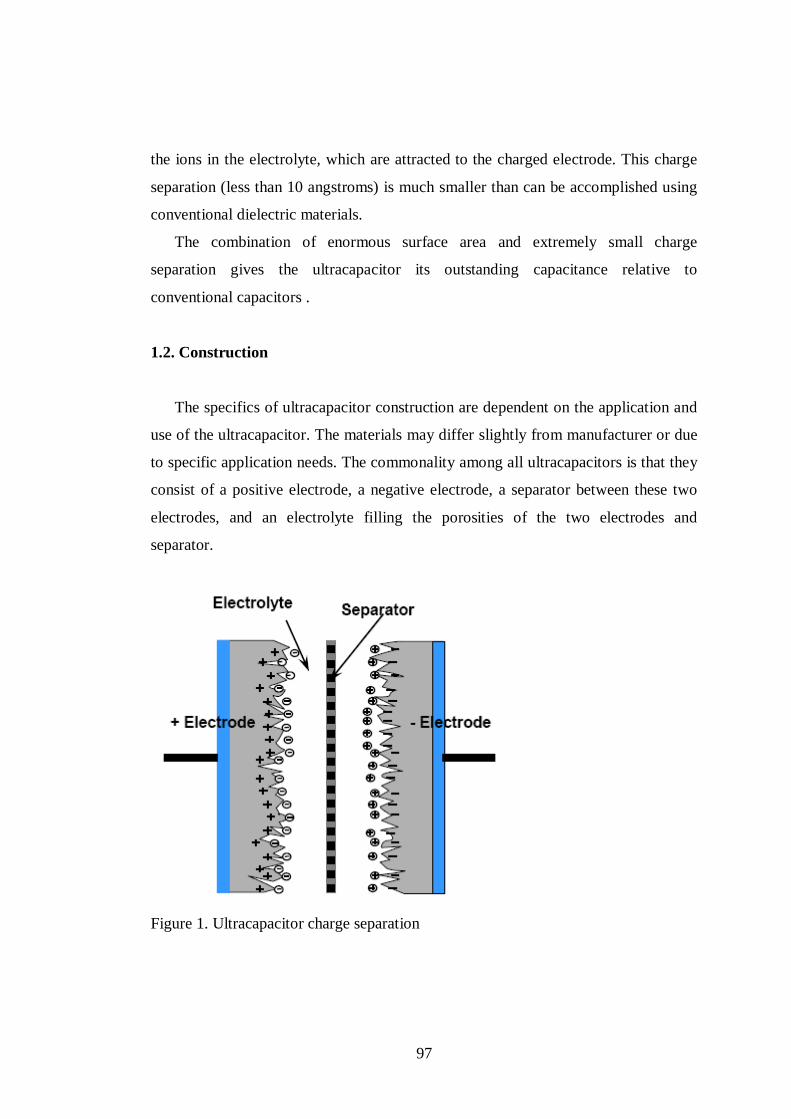
97
the ions in the electrolyte, which are attracted to the charged electrode. This charge
separation (less than 10 angstroms) is much smaller than can be accomplished using
conventional dielectric materials.
The combination of enormous surface area and extremely small charge
separation gives the ultracapacitor its outstanding capacitance relative to
conventional capacitors .
1.2. Construction
The specifics of ultracapacitor construction are dependent on the application and
use of the ultracapacitor. The materials may differ slightly from manufacturer or due
to specific application needs. The commonality among all ultracapacitors is that they
consist of a positive electrode, a negative electrode, a separator between these two
electrodes, and an electrolyte filling the porosities of the two electrodes and
separator.
Figure 1. Ultracapacitor charge separation
98
The assembly of the ultracapacitors can vary from product to product. This is
due in part to the geometry of the ultracapacitor packaging. For products having a
prismatic or square packaging arrangement, the internal construction is based upon a
stacking assembly arrangement with internal collector paddles extruding from each
electrode stack. These current collector paddles are then welded to the terminals to
enable a current path outside the capacitor.
For products with round or cylindrical packaging, the electrodes are wound
into a jellyroll configuration. The electrodes have foil extensions that are then welded
to the terminals to enable a current path outside the capacitor.
1.3. Typical Applications
Maxwell BOOSTCAP® ultracapacitors products are offered in a full range of
sizes. This enables utilization of ultracapacitors in a variety of industries for many
power requirement needs. These applications span from milliamps current or
milliwatt power to several hundred amps current or several hundred kilowatts power
needs. Industries employing ultracapacitors have included: consumer electronics,
traction, automotive, and industrial. Examples within each industry are numerous
[44].
Automotive – 42 V vehicle supply networks, power steering, electromagnetic
valve controls, starter generators, electrical door opening, regenerative braking,
hybrid electric drive, active seat belt restraints.
Transportation – Diesel engine starting, train tilting, security door opening,
tram power supply, voltage drop compensation, regenerative braking, hybrid electric
drive.
Industrial – uninterrupted power supply (UPS), wind turbine pitch systems,
power transient buffering, automated meter reading (AMR), elevator micro-
controller power backup, security doors, forklifts, cranes, and telecommunications.
Consumer – digital cameras, lap top computers, PDA’s, GPS, hand held devices,
toys, flashlights, solar accent lighting, and restaurant paging devices.
99
Consideration for the various industries listed, and for many others, is typically
attributed to the specific needs of the application the ultracapacitor technology can
satisfy. Applications ideally suited for ultracapacitors include pulse power, bridge
power, main power and memory backup.
1.4. Pulse Power
Ultracapacitors are ideally suited for pulse power applications. As mentioned in
the theory section, due to the fact the energy storage is not a chemical reaction, the
charge/discharge behavior of the capacitors is efficient.
Since ultracapacitors have low internal impedance they are capable of delivering
high currents and are often times placed in parallel with batteries to load level the
batteries, extending battery life. The ultracapacitor buffers the battery from seeing
the high peak currents experienced in the application. This methodology is employed
for devices such as digital cameras, hybrid drive systems and regenerative braking
(for energy recapture).
1.5. Bridge Power
Ultracapacitors are utilized as temporary energy sources in many applications
where immediate power availability may be difficult. This includes UPS systems
utilizing generators, fuel cells or flywheels as the main power backup. All of these
systems require short start up times enabling momentary power interruptions.
Ultracapacitor systems are sized to provide the appropriate amount of ride through
time until the primary backup power source becomes available.
1.5. Main Power
For applications requiring power for only short periods of time or is
acceptable to allow short charging time before use, ultracapacitors can be used as the
primary power source. Examples of this utilization include toys, emergency
100
flashlights, restaurant paging devices, solar charged accent lighting, and emergency
door power.
1.6. Determining the correct Ultracapacitor for the application
Determination of the proper capacitor and number of capacitors is dependant
on the intended application. For sizing the system correctly a number of factors
should be known. These factors include the maximum and minimum operating
voltage of the application, the average current or power, the peak current or power,
the operating environment temperature, the run time required for the application, and
the required life of the application. All of these issues will be covered in detail in the
“Performance Characteristics” section of this guide. For now, a general approach is
described.
Each of the products has a rated voltage (VR). Since ultracapacitors are low
voltage devices, this rated voltage is generally less than the application voltage
required. Knowing the maximum application voltage (Vmax) will determine how
many capacitor cells are required to be series connected. The number of series
connected cells is determined by:
max# _R
Vseries cellsV
=
Next, by knowing the average current (I) in amps, the required run time (dt)
in seconds and the minimum working voltage (Vmin), an approximate system
capacitance can be calculated.
( )max min
. .dt dtCsys I IdV V V
= =−
101
The total system capacitance is comprised of the capacitance of all the series
connected capacitors for achieving Vmax. For capacitors connected in series the
capacitance of the individual cells is determined by:
1 2
1 1 1 1...nCsys C C C
= + + +
where n = # series connected capacitors.
For C1=C2=…=Cn and rearranging equation 3, the cell capacitance (C) is
determined by:
.sysC C n=
This capacitance value can then be compared to the product data sheets to
determine the appropriate capacitor for the application. If the capacitance calculated
is not achievable by a single capacitor it will be necessary to place one or more
capacitors in parallel to obtain the necessary energy. For capacitors connected in
parallel the capacitance is determined by:
1 2 ... nC C C C= + + +
Therefore, take the calculated capacitance and divide by the capacitance
available from the data sheet and round up to the next whole number. This will be the
number of capacitors required in parallel.
There are many other items to consider for properly sizing the application.
This includes the internal resistance of the capacitor to account for the instantaneous
voltage drop associated with an applied current, the ambient operating temperature
which affects the internal resistance and the capacitor life, and the life of the
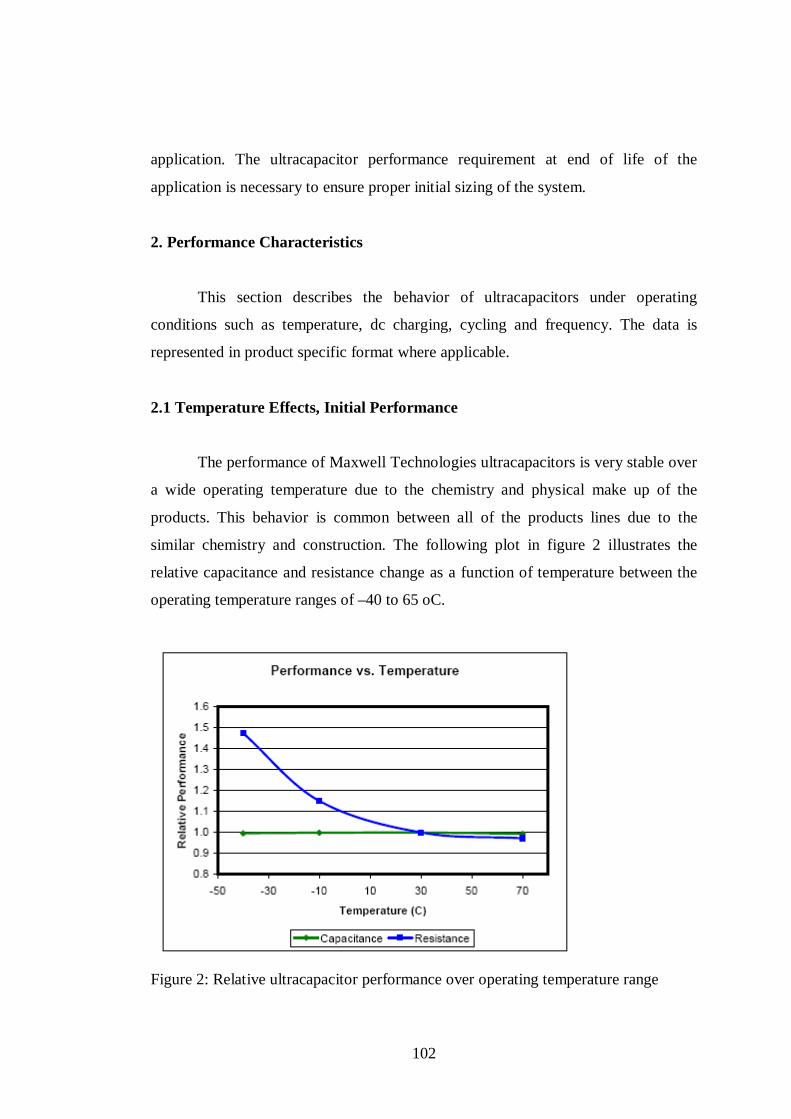
102
application. The ultracapacitor performance requirement at end of life of the
application is necessary to ensure proper initial sizing of the system.
2. Performance Characteristics
This section describes the behavior of ultracapacitors under operating
conditions such as temperature, dc charging, cycling and frequency. The data is
represented in product specific format where applicable.
2.1 Temperature Effects, Initial Performance
The performance of Maxwell Technologies ultracapacitors is very stable over
a wide operating temperature due to the chemistry and physical make up of the
products. This behavior is common between all of the products lines due to the
similar chemistry and construction. The following plot in figure 2 illustrates the
relative capacitance and resistance change as a function of temperature between the
operating temperature ranges of –40 to 65 oC.
Figure 2: Relative ultracapacitor performance over operating temperature range

103
2.2 Voltage and Temperature Effects on Life
A common utilization of the ultracapacitors such as UPS applications is to
maintain the ultracapacitors at working voltage until needed for the application. The
following figures illustrate the influence of voltage on performance of the products
when held at rated voltage and a lower voltage at its maximum rated environmental
temperature.
Figure 3: MC Cell Capacitance degradation at 2.7 V and 2.5 V at 65oC
Figure 3 represents the expected capacitance degradation relative to the product
specification. The plot, along with the fact that the influence of temperature has a
doubling effect for every 10 oC, can be used to predict the expected performance
change for a variety of conditions. From this plot it is expected that a: 30% reduction
in rated capacitance may occur for an ultracapacitor held at 2.7 V after

104
Figure 4: MC Cell Resistance degradation at 2.7 V and 2.5 V at 65oC
Figure 4 represents the expected resistance degradation relative to the product
specification. The plot, along with the fact that the influence of temperature has a
doubling effect for every 10 oC, can be used to predict the expected performance
change for a variety of conditions. From this plot it is expected that a:
140% increase in rated resistance may occur for an ultracapacitor held at 2.7 V after
2.3 Cycling
Cycle testing is performed on the products to determine the degradation of
ultracapacitor performance over cycling events. The cycle testing is performed at
ambient temperature with no forced convective cooling. The cycles are performed at
a continuous current as indicated on the data sheet from the rated voltage to half
rated voltage. A 15 second rest is allowed between each charge/discharge cycle. The
resulting duty cycle for this test is initially 70% reducing to approximately 50% at
the product ages.
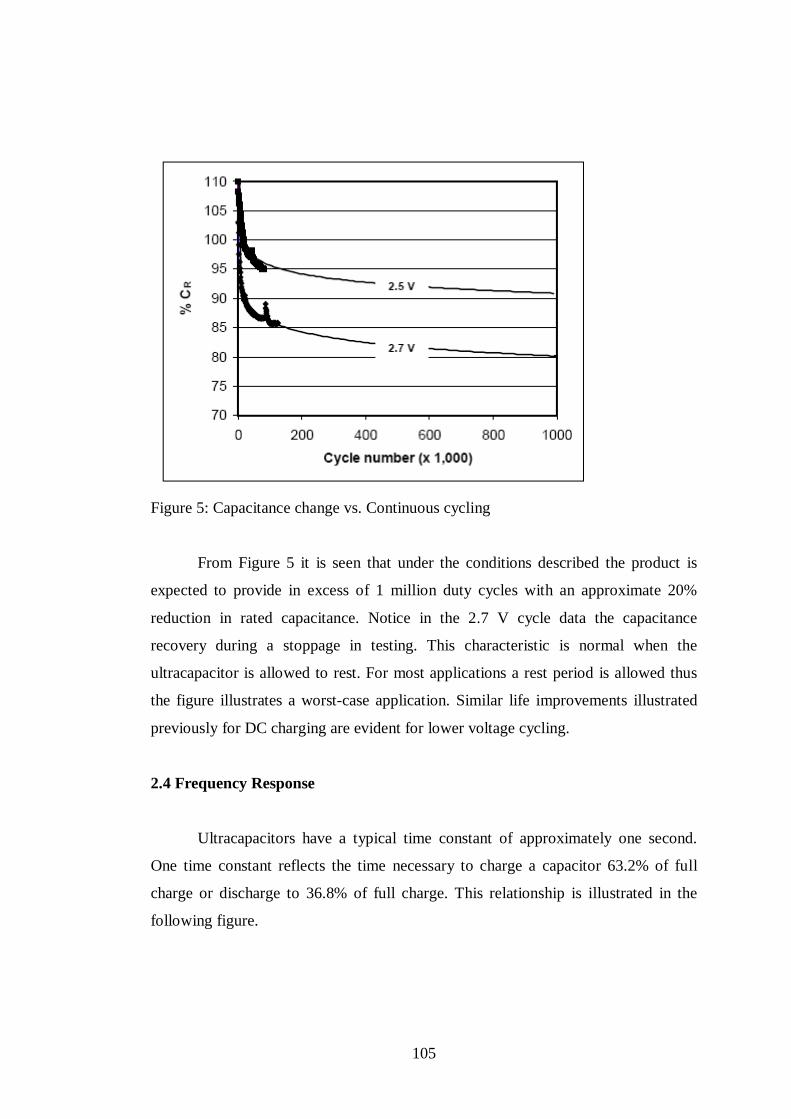
105
Figure 5: Capacitance change vs. Continuous cycling
From Figure 5 it is seen that under the conditions described the product is
expected to provide in excess of 1 million duty cycles with an approximate 20%
reduction in rated capacitance. Notice in the 2.7 V cycle data the capacitance
recovery during a stoppage in testing. This characteristic is normal when the
ultracapacitor is allowed to rest. For most applications a rest period is allowed thus
the figure illustrates a worst-case application. Similar life improvements illustrated
previously for DC charging are evident for lower voltage cycling.
2.4 Frequency Response
Ultracapacitors have a typical time constant of approximately one second.
One time constant reflects the time necessary to charge a capacitor 63.2% of full
charge or discharge to 36.8% of full charge. This relationship is illustrated in the
following figure.
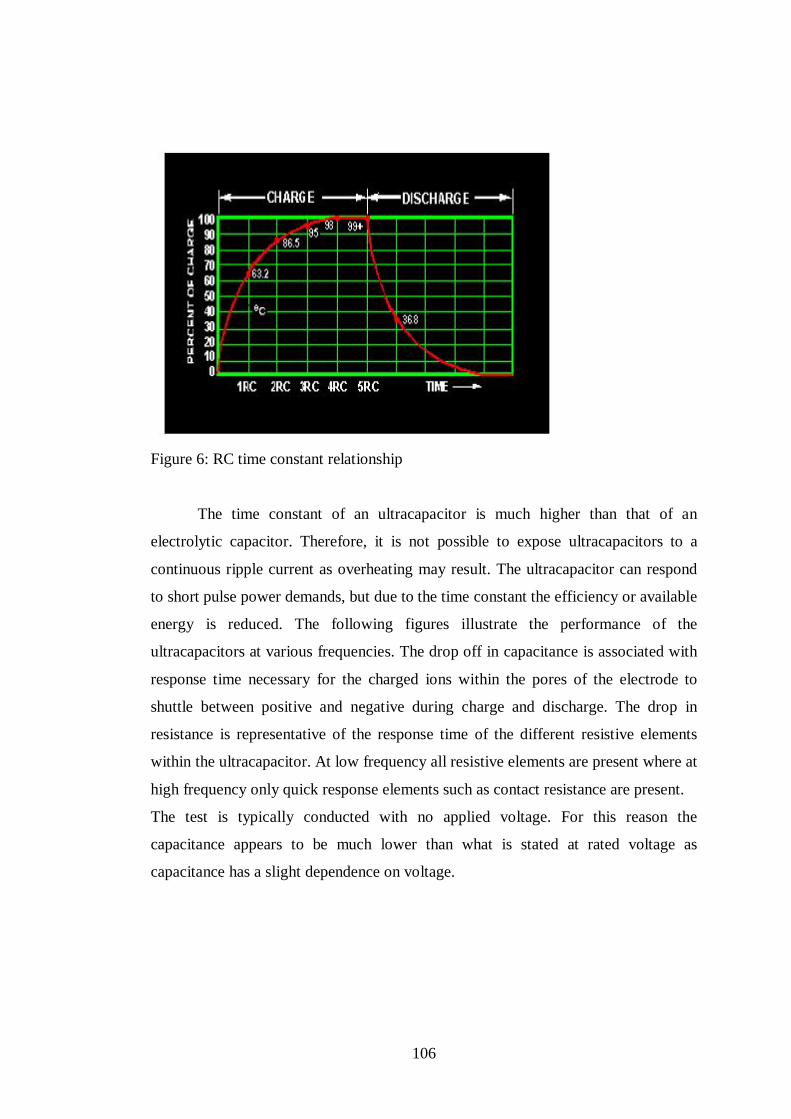
106
Figure 6: RC time constant relationship
The time constant of an ultracapacitor is much higher than that of an
electrolytic capacitor. Therefore, it is not possible to expose ultracapacitors to a
continuous ripple current as overheating may result. The ultracapacitor can respond
to short pulse power demands, but due to the time constant the efficiency or available
energy is reduced. The following figures illustrate the performance of the
ultracapacitors at various frequencies. The drop off in capacitance is associated with
response time necessary for the charged ions within the pores of the electrode to
shuttle between positive and negative during charge and discharge. The drop in
resistance is representative of the response time of the different resistive elements
within the ultracapacitor. At low frequency all resistive elements are present where at
high frequency only quick response elements such as contact resistance are present.
The test is typically conducted with no applied voltage. For this reason the
capacitance appears to be much lower than what is stated at rated voltage as
capacitance has a slight dependence on voltage.
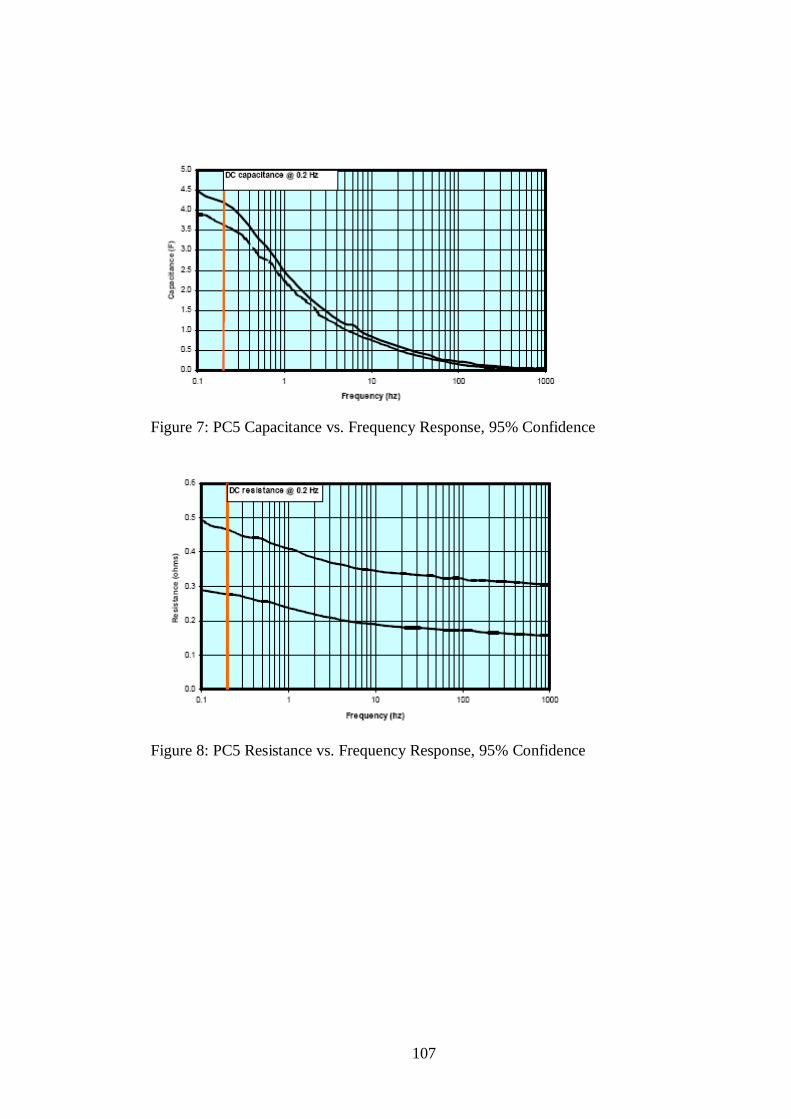
107
Figure 7: PC5 Capacitance vs. Frequency Response, 95% Confidence
Figure 8: PC5 Resistance vs. Frequency Response, 95% Confidence
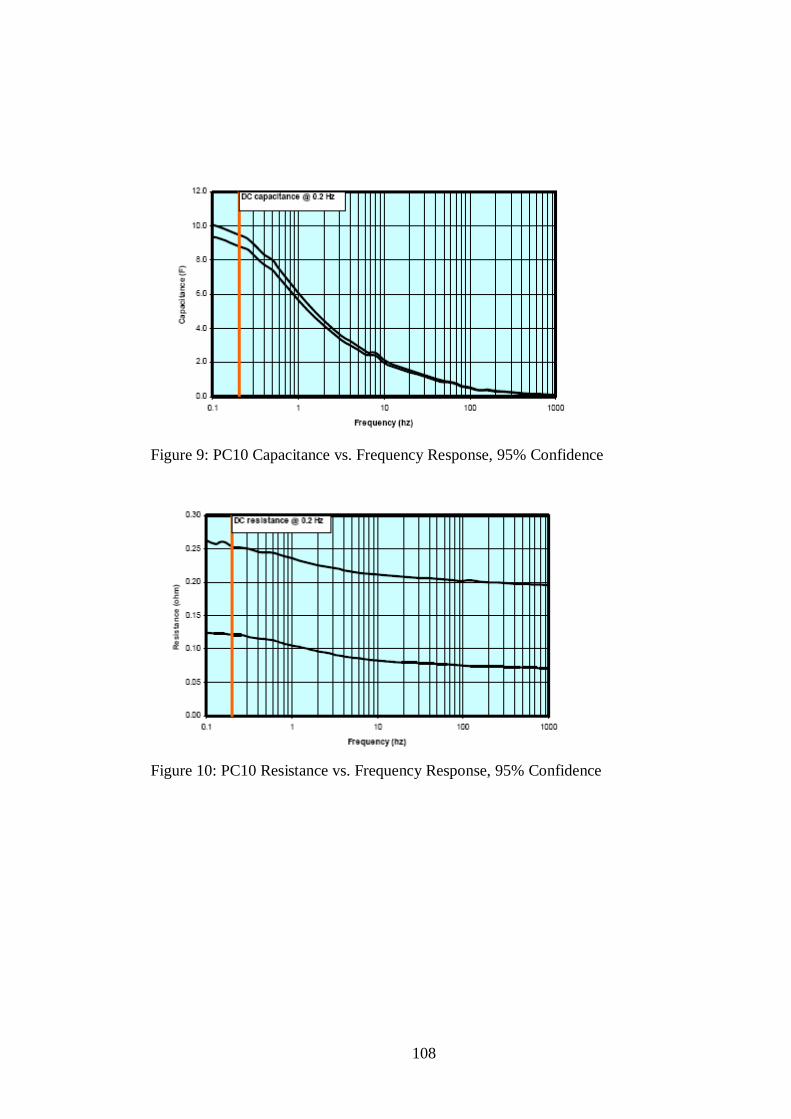
108
Figure 9: PC10 Capacitance vs. Frequency Response, 95% Confidence
Figure 10: PC10 Resistance vs. Frequency Response, 95% Confidence
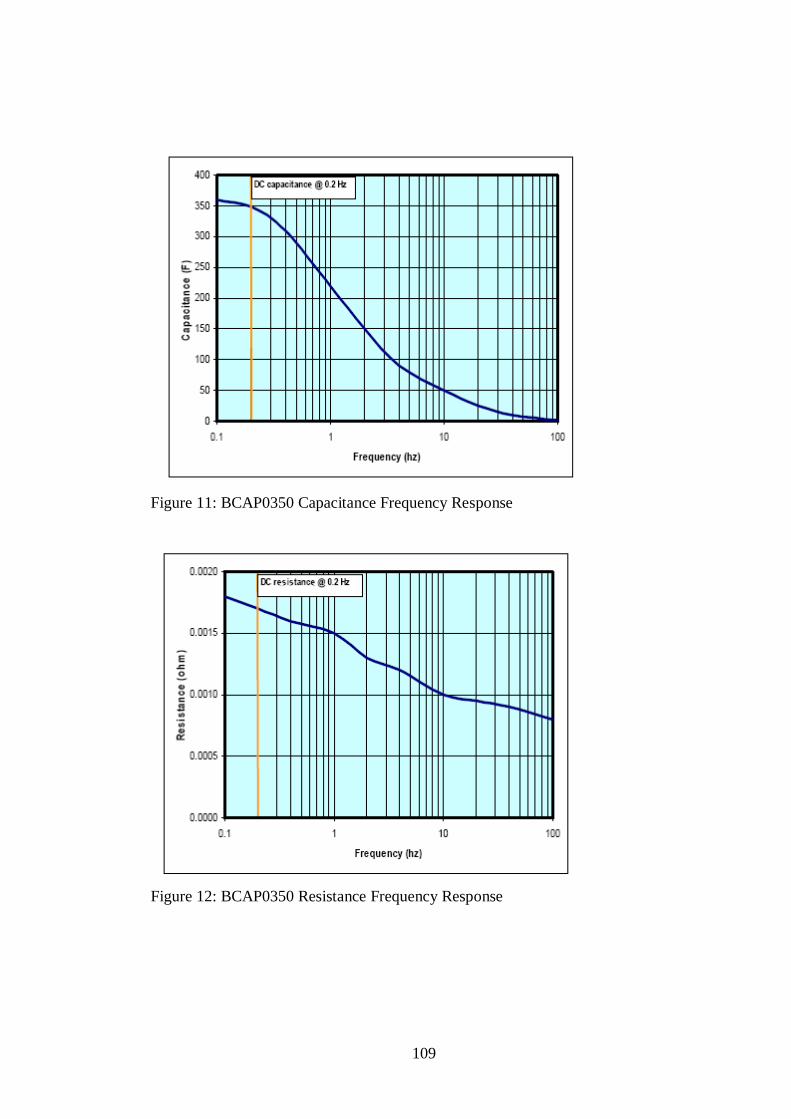
109
Figure 11: BCAP0350 Capacitance Frequency Response
Figure 12: BCAP0350 Resistance Frequency Response
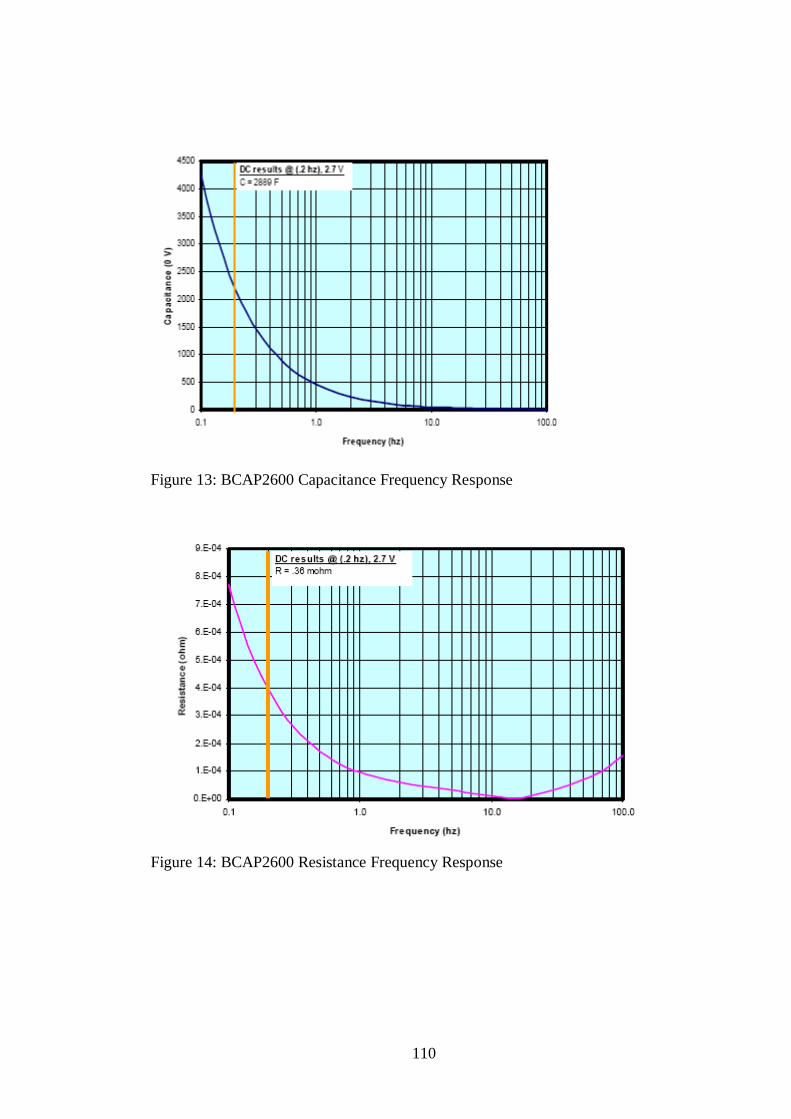
110
Figure 13: BCAP2600 Capacitance Frequency Response
Figure 14: BCAP2600 Resistance Frequency Response
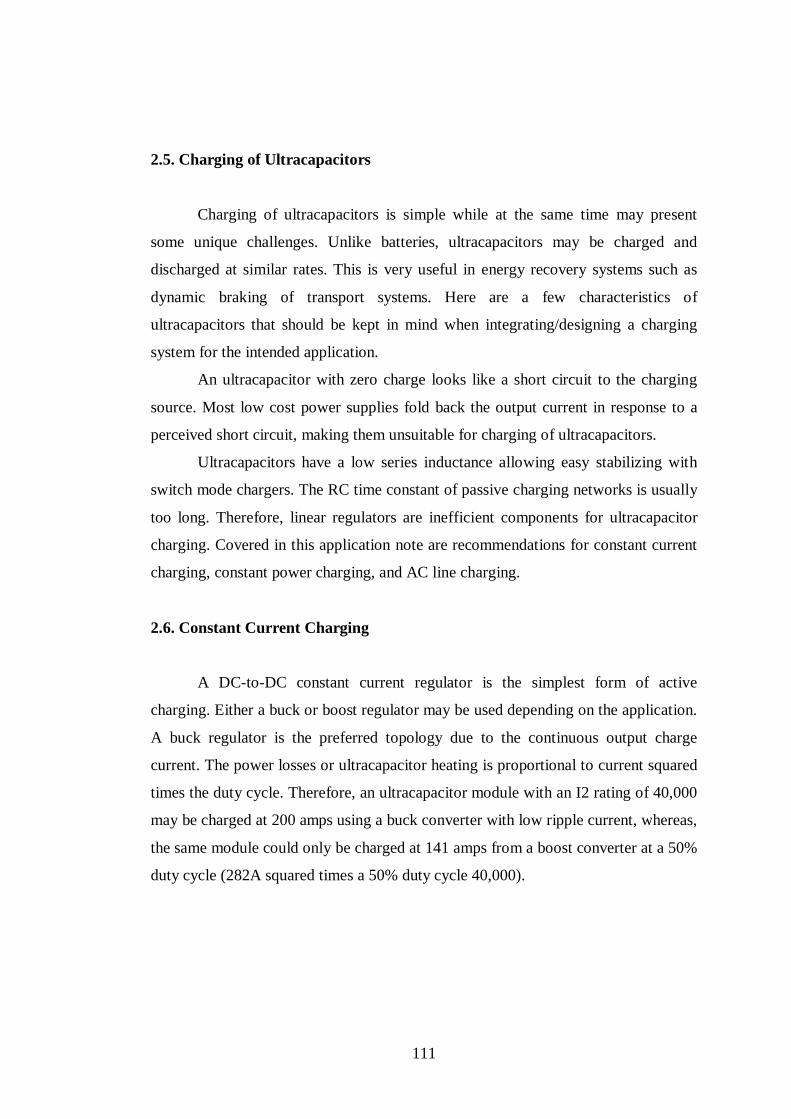
111
2.5. Charging of Ultracapacitors
Charging of ultracapacitors is simple while at the same time may present
some unique challenges. Unlike batteries, ultracapacitors may be charged and
discharged at similar rates. This is very useful in energy recovery systems such as
dynamic braking of transport systems. Here are a few characteristics of
ultracapacitors that should be kept in mind when integrating/designing a charging
system for the intended application.
An ultracapacitor with zero charge looks like a short circuit to the charging
source. Most low cost power supplies fold back the output current in response to a
perceived short circuit, making them unsuitable for charging of ultracapacitors.
Ultracapacitors have a low series inductance allowing easy stabilizing with
switch mode chargers. The RC time constant of passive charging networks is usually
too long. Therefore, linear regulators are inefficient components for ultracapacitor
charging. Covered in this application note are recommendations for constant current
charging, constant power charging, and AC line charging.
2.6. Constant Current Charging
A DC-to-DC constant current regulator is the simplest form of active
charging. Either a buck or boost regulator may be used depending on the application.
A buck regulator is the preferred topology due to the continuous output charge
current. The power losses or ultracapacitor heating is proportional to current squared
times the duty cycle. Therefore, an ultracapacitor module with an I2 rating of 40,000
may be charged at 200 amps using a buck converter with low ripple current, whereas,
the same module could only be charged at 141 amps from a boost converter at a 50%
duty cycle (282A squared times a 50% duty cycle 40,000).
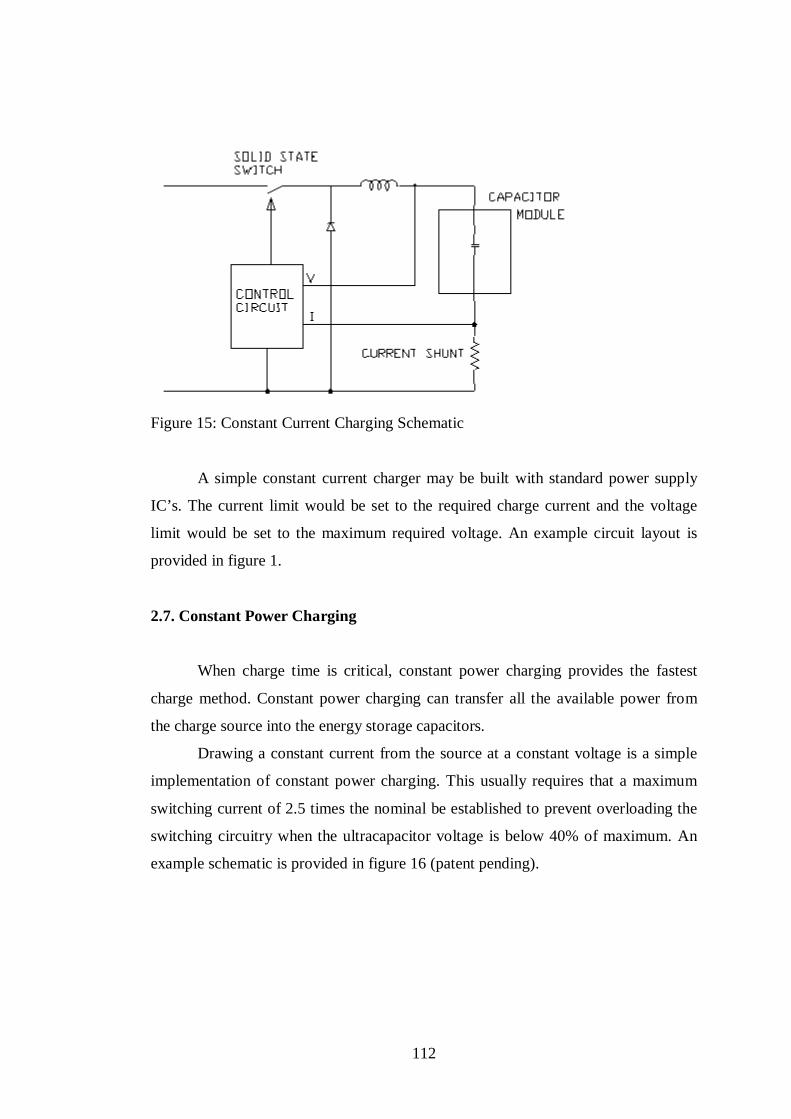
112
Figure 15: Constant Current Charging Schematic
A simple constant current charger may be built with standard power supply
IC’s. The current limit would be set to the required charge current and the voltage
limit would be set to the maximum required voltage. An example circuit layout is
provided in figure 1.
2.7. Constant Power Charging
When charge time is critical, constant power charging provides the fastest
charge method. Constant power charging can transfer all the available power from
the charge source into the energy storage capacitors.
Drawing a constant current from the source at a constant voltage is a simple
implementation of constant power charging. This usually requires that a maximum
switching current of 2.5 times the nominal be established to prevent overloading the
switching circuitry when the ultracapacitor voltage is below 40% of maximum. An
example schematic is provided in figure 16 (patent pending).
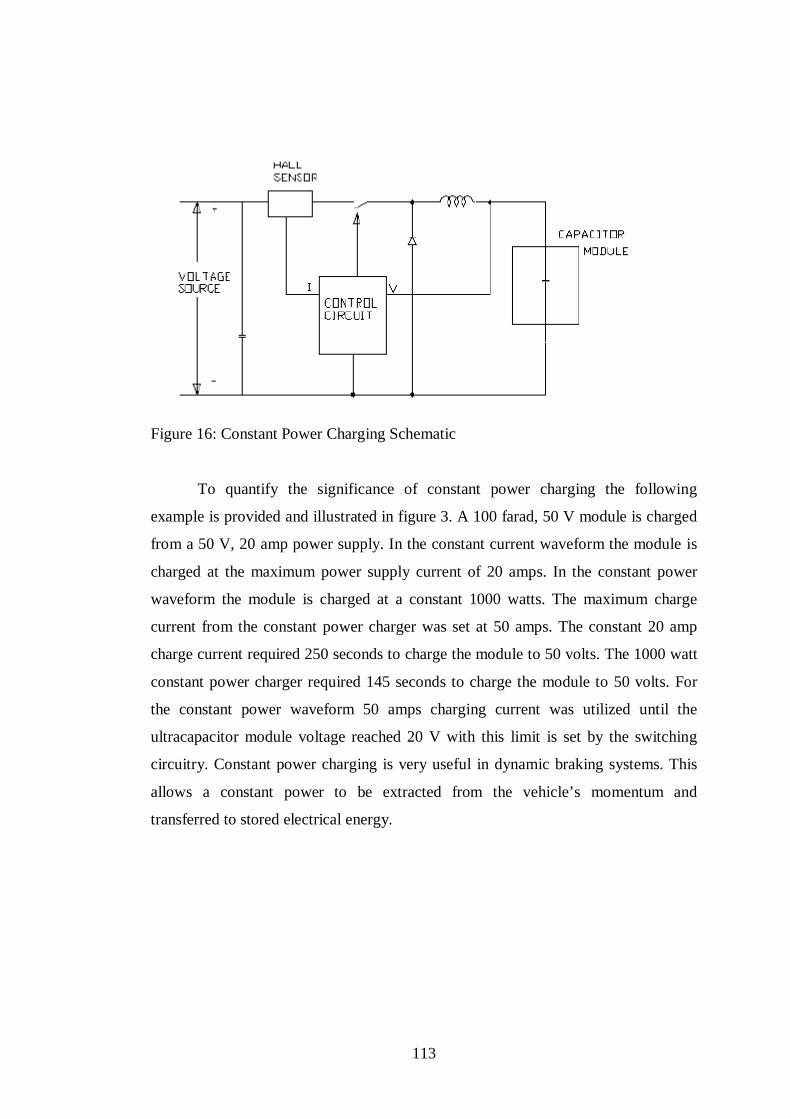
113
Figure 16: Constant Power Charging Schematic
To quantify the significance of constant power charging the following
example is provided and illustrated in figure 3. A 100 farad, 50 V module is charged
from a 50 V, 20 amp power supply. In the constant current waveform the module is
charged at the maximum power supply current of 20 amps. In the constant power
waveform the module is charged at a constant 1000 watts. The maximum charge
current from the constant power charger was set at 50 amps. The constant 20 amp
charge current required 250 seconds to charge the module to 50 volts. The 1000 watt
constant power charger required 145 seconds to charge the module to 50 volts. For
the constant power waveform 50 amps charging current was utilized until the
ultracapacitor module voltage reached 20 V with this limit is set by the switching
circuitry. Constant power charging is very useful in dynamic braking systems. This
allows a constant power to be extracted from the vehicle’s momentum and
transferred to stored electrical energy.

114
Figure 17: Constant Current vs. Constant Power Charging Time
2.8. Isolated AC Line Charging (U.S Patent 6,912,136 – Thrap)
It is often difficult to cover the wide dynamic range requirements for charging
ultracapacitors from a varying AC power line. The circuit illustrated in figure 4 uses
the L/V characteristics of the switching transformer to set the switching frequency
permitting the circuit to provide full output current at zero volts with no risk of
saturating the magnetics.
The switch Q1 turns on, charging the primary of T1 to a preset current limit.
The switch Q1 then turns off permitting the energy stored in T1 to discharge through
D1 into the ultracapacitor module, C1. When the secondary current has discharged to
a preset lower limit then Q1 will turn on again repeating the cycle. The time required
to charge T1 is inversely proportional to the instantaneous line voltage while the time
required to discharge T1 is inversely proportional to the ultracapacitor voltage at C1.
The combination of low line voltage and low ultracapacitor voltage will produce the
lowest switching frequency. The highest switching frequency occurs at the peak of
the AC power line at maximum voltage and full charge voltage on the ultracapacitor.
Depending on the application the switching frequency can cover a range of
20:1. When C1 reaches its maximum voltage then the voltage sensor will drive the
control circuit into discontinuous operation.

115
Figure 18: AC Charging Schematic