uk population trends in the last 10 years - experian · uk population trends in the last 10 years...
TRANSCRIPT

UK Population Trends in the Last 10
Years
Ann Berrington
ESRC Centre for Population Change
University of Southampton, UK
Experian Launch Event, 1st April 2014, London

Overview
1. Key trends in UK population
A growing population
An ageing population
An increasingly diverse population
Changing family structures
2. Trends in Living Alone
What are the drivers of the increase in living alone?
Typologies of people living alone in mid-life
3. The Boomerang Generation
How has the societal context changed?
Which young adults are more likely to be living with their parent(s)?
4. Implications of Demographic Change
2

1. Key trends in UK population
3

The drivers of population change
The size, composition and distribution of a population are determined by fertility, mortality and migration
Pt2 = Pt1 + B - D + I - E Where:
Pt2 Population at time t2
Pt1 Population at time t1
B Births
D Deaths
I In-migration
E Out-migration
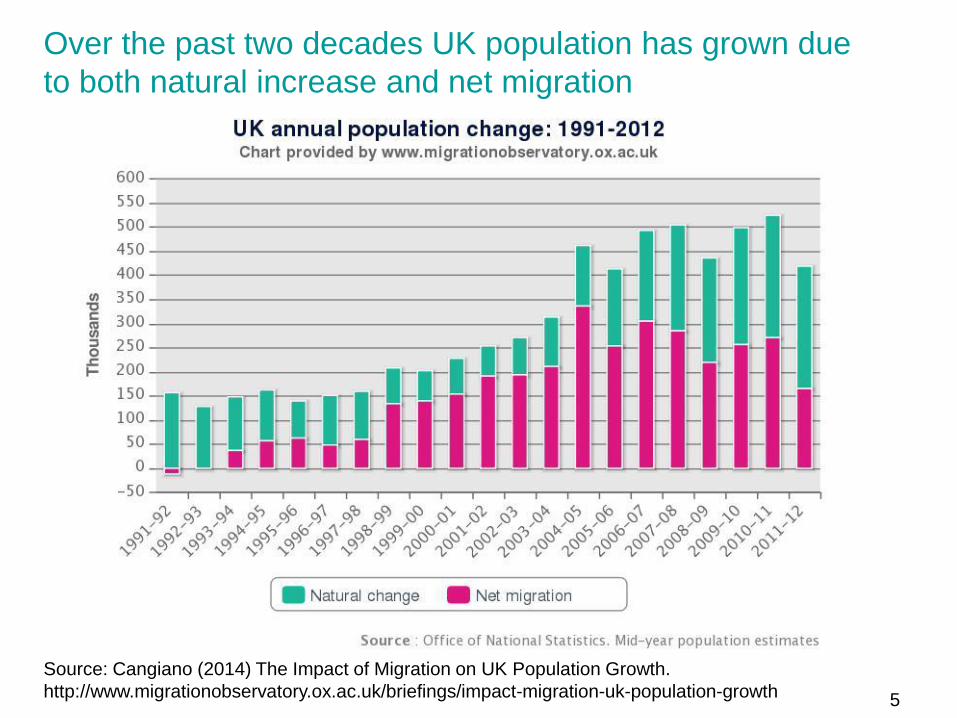
Over the past two decades UK population has grown due
to both natural increase and net migration
5
Source: Cangiano (2014) The Impact of Migration on UK Population Growth.
http://www.migrationobservatory.ox.ac.uk/briefings/impact-migration-uk-population-growth

Future growth in UK population will come from both
natural increase and net migration
6
Source: Cangiano (2014) The Impact of Migration on UK Population Growth.
http://www.migrationobservatory.ox.ac.uk/briefings/impact-migration-uk-population-growth

An ageing population
7
UK Age, sex pyramid 2014 (line) & 2034 (shaded)
Source: ONS, 2012-based,
population projection
The size of population
aged 90+ will triple, 2014-
2034
Post WW2 baby boomers in 2014
1960s baby boomers in 2014
The 1960s baby boomers
will have retired by 2034

An increasingly diverse population
Growth in ethnic minority group population, Eng & Wales
8
Source: ESRC Centre on Dynamics of Ethnicity (CoDE) (2012) Briefing Paper: Dynamics of
Diversity: Evidence from the 2011 Census. http://www.ethnicity.ac.uk/
Note : No Mixed category in 1991. No Arab category in 1991 and 2001.

Changing Family Structures
• Decline in marriage, increase in
cohabitation
• Postponement of family formation,
increased childlessness
• Partnership turnover and complex family
structures
9

Decline in marriage, increase in cohabitation
10
Source: Beaujouan, E. and Ní Bhrolcháin, M. (2011) Cohabitation and marriage in Britain since the 1970s,
Population Trends 145: 35-59. http://www.palgrave-journals.com/pt/journal/v145/n1/pdf/pt201116a.pdf

Postponement of childbearing / increased
childlessness
11
Source: ONS (2013) Cohort Fertility, England and Wales, 2012
Percentage of women who remain childless, Eng & Wales

Increased partnership dissolution
12 Source: ONS, 2011 Census
% households that are
lone parent households

2. Trends in Living Alone
13

The chances of men living alone have declined at
young ages but increased in mid-life
Source: Demey et al’s analysis of GHS/GLS
1985-2008
0
10
20
30
40
50
60
70
16-2425-3435-4445-5455-6465-74 75+
2000
2005
2008
Percentage men living in one person HH
by age, Britain 2000-2008 The Drivers of Living Alone
At younger ages: increased cost of
renting / buying separate residence;
benefit changes; greater
experience of HE
In middle age: Increase in living
alone, especially for men due to
increased partnership dissolution,
plus significant minority men who
never partner
See: Demey, D., Berrington, A., Evandrou,
M. and Falkingham, J. (2011) The changing
demography of mid-life, from the 1980s to
the 2000s. Population Trends, 145, 16-34.
http://www.palgrave-
journals.com/pt/journal/v145/n1/abs/pt2011
15a.html

Partnership trajectories into living alone
15
0%
10%
20%
30%
40%
50%
60%
70%
80%
90%
100%
Males Females Males Females Males Females
35-44 45-54 55-64
Never partnered Ever cohabited but never married Ever married
Source: Demey, D., Berrington, A., Evandrou, M. and Falkingham, J. (2013) Pathways into living
alone in mid-life: diversity and policy implications. Advances in Life Course Research, 18, (3),
161-174. http://www.sciencedirect.com/science/article/pii/S104026081300004X
Distribution of those currently living alone, according to age and
partnership history. UK men and women aged 35-64.

The socio-economic characteristics of those living
alone differ by age & partnership history
16
0%
10%
20%
30%
40%
50%
60%
70%
80%
90%
100%
Never Ever Never Ever Never Ever
35-44 45-54 55-64
Higher education Some qualifications No qualifications
Educational distribution of UK men aged 35-64 living alone,
according to age and whether ever had a co-residential partner.
Source: Demey, D., Berrington, A., Evandrou, M. and Falkingham, J. (2013) Pathways into living
alone in mid-life: diversity and policy implications. Advances in Life Course Research, 18, (3), 161-
174. http://www.sciencedirect.com/science/article/pii/S104026081300004X

3. The “Boomerang Generation”
17

Changing context of young adults’ household
formation
• Increased enrolment in Higher Education, especially
among females
• Youth unemployment and economic precariousness for
those in work
• Decreasing availability and affordability of housing
• Welfare retrenchment
• Increased international migration
See: Berrington, A. and Stone, J. (2013) Outlining a Future Research Agenda
for Studies of Young Adults' Transitions to Residential Independence, CPC
Working Paper 38,
http://www.cpc.ac.uk/publications/cpc_working_papers.php
18

Increase in co-residence of UK young adults
living with their parent(s)
Males Females
Source: Authors’ analysis of LFS, Oct-Dec quarter, 2008 and 2012
19
Percentage living with parent(s), 1998, 2008 and 2012
Source: Berrington, A. and Stone, J. (Forthcoming 2014) ‘Young adults’ transitions to residential
independence in Britain: the role of social and housing policy’, In: Hamilton, M., Antonucci, L. & Roberts,
S. (eds.) Young People and Social Policy in Europe. Palgrave Macmillan.

Factors associated with returning home
• Longitudinal analyses following up young adults
• Turning points in the life course associated with
“boomeranging” to parental home
– Experiencing a partnership dissolution,
• Especially for men
– Finishing full time studies
• Both men and women
See Stone, J., Berrington, A. and Falkingham, J. (2013) Gender, turning-points and
boomerangs: returning home in the UK. Demography, 50, (5), 1 – 20.
http://link.springer.com/article/10.1007%2Fs13524-013-0247-8#page-1
20

Summary of household formation trends in
young adulthood
• Decreasing headship rates due to postponement of
leaving / more returning to the parental home and the
postponement of partnership formation
• As young adults increasingly leave home for reasons
other than family formation they are more likely to return
home
• As a result of increased HE enrolment young women
have become more like young men in their leaving and
returning home behaviour
• At older ages (e.g. early 30s) remaining living with
parents associated with economic precariousness
21
4. Implications of Demographic Change
22

Implications of Demographic Change (1)
• Growth, diversity population – New, expanding opportunities
• Ageing of the baby boomers – But, increased economic dependency young adults
– Obligations for caring
– Future elderly may have less kin availability
23
Implications of Demographic Change (2)
• Young adults boomeranging, renting – Choice or constraint?
– Implications for spending
• Heterogeneity in groups living alone – A higher proportion of high flyers, especially at young
ages
– Disadvantaged (men especially) face less positive
future as reach old age
24

Questions?
Please contact:
Ann Berrington
ESRC Centre for Population Change
University of Southampton
Email: [email protected]
Website: http://www.cpc.ac.uk/
Twitter: @CPC_population
25
Acknowledgements
This research is funded by ESRC Grant numbers RES-625-28-0001 and
ES/K003453/1. The Centre for Population Change is a joint initiative between
the University of Southampton and a consortium of Scottish Universities in
partnership with ONS and NRS. The findings, interpretations, and conclusions
expressed in this paper are entirely those of the authors and should not be
attributed in any manner to ONS or NRS.
The General Household Survey/General Lifestyle Survey and the Labour Force
Survey are carried out by the Office for National Statistics. Analyses were
made with the assistance of Juliet Stone, Peter Tammes and Deiter Demey.
Understanding Society is carried out by the Institute for Social and Economic
Research at the University of Essex. Access to all data is provided by the UK
Data Archive. The original data creators, depositors or copyright holders, the
funders of the Data Collections (if different) and the UK Data Archive bear no
responsibility for their further analysis or interpretation.
26