uk population stature - unece · hr-4-14 uk population stature 1993-2003 4th gtr head restraint...
TRANSCRIPT
HR-4-14
UK population stature 1993-2003
4th GTR Head Restraint Informal Working Group
Dr Bob Moran
07-09 September 2005
4th GTR Head Restraint Informal Working Group
Dr Bob Moran
07-09 September 2005
HR-4-14
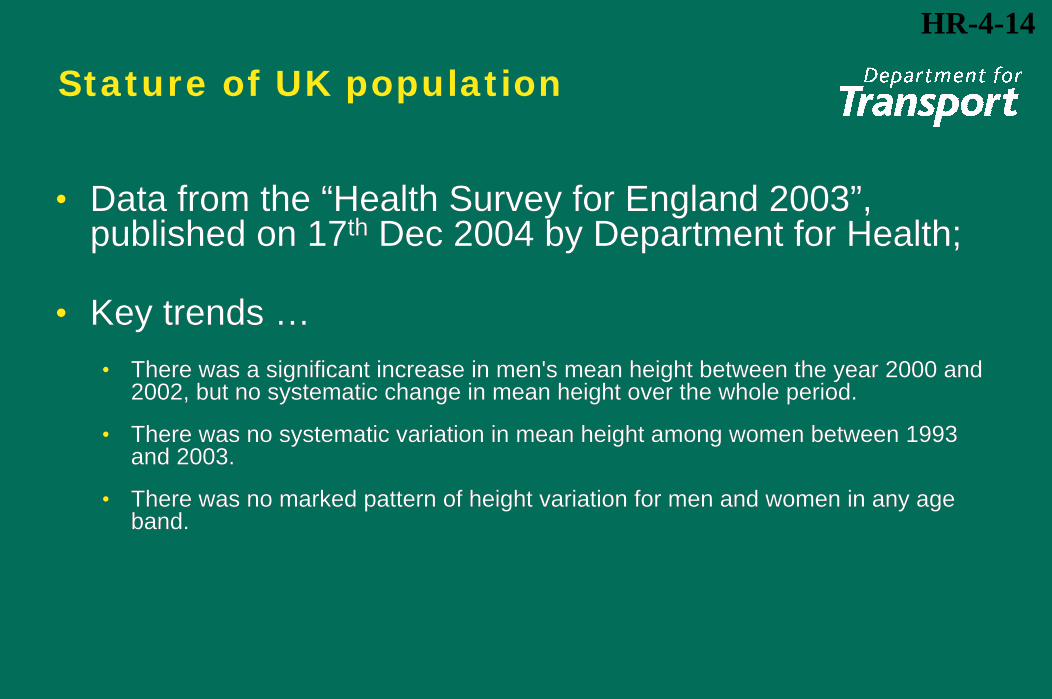
Stature of UK population
• Data from the “Health Survey for England 2003”, published on 17th Dec 2004 by Department for Health;
• Key trends …• There was a significant increase in men's mean height between the year 2000 and
2002, but no systematic change in mean height over the whole period.
• There was no systematic variation in mean height among women between 1993 and 2003.
• There was no marked pattern of height variation for men and women in any age band.

HR-4-14
Stature of UK population – (Men)
MEN AGE
Year Mean SE 16-24 25-34 35-44 45-54 55-64 65-74 75+
1993 174.4 0.08 176.6 176.4 175.9 174.5 173.1 170.5 168.6
1994 174.6 0.09 176.6 176.7 176.2 174.8 173.1 170.9 168.7
1995 174.5 0.09 176.8 176.6 175.8 174.7 173.2 170.9 168.2
1996 174.4 0.09 176.3 176.6 175.7 174.4 173.2 170.9 168.0
1997 174.5 0.12 176.7 176.4 175.8 174.7 172.9 170.9 168.5
1998 174.4 0.09 176.6 176.6 175.6 174.8 173.1 171.2 168.4
1999 174.4 0.13 176.8 177.0 175.1 174.6 173.2 171.3 168.8
2000 174.4 0.13 176.4 176.9 175.8 174.3 173.0 171.4 168.2
2001 174.6 0.09 176.9 176.7 176.2 174.9 173.1 171.9 168.2
2002 174.8 0.13 177.0 176.6 176.1 175.0 173.6 171.5 169.3
2003 175.0 0.11 177.2 176.9 175.9 175.0 173.5 171.5 169.6

HR-4-14
Stature of UK population – (Women)
WOMEN AGE
Year Mean SE 16-24 25-34 35-44 45-54 55-64 65-74 75+
1993 161.1 0.07 163.1 163.0 162.4 161.7 160.2 158.1 154.3
1994 161.1 0.08 163.0 163.3 162.3 161.9 160.4 158.4 154.6
1995 160.9 0.07 163.1 162.8 162.1 161.3 159.9 158.1 154.6
1996 161.0 0.07 163.1 163.2 162.2 161.4 159.9 157.8 154.7
1997 160.9 0.10 162.9 163.1 162.4 161.4 159.4 158.2 154.3
1998 161.0 0.07 163.4 163.0 162.5 161.4 160.2 157.8 154.7
1999 161.0 0.11 163.6 162.6 162.2 161.3 159.8 158.2 154.7
2000 161.0 0.11 162.8 162.9 162.8 161.5 160.1 157.9 154.4
2001 161.1 0.08 163.5 163.2 162.3 161.5 160.6 158.2 154.5
2002 161.3 0.11 163.3 163.1 162.6 161.8 160.4 158.6 155.4
2003 161.4 0.09 163.7 163.1 162.7 161.7 160.3 158.5 155.4

HR-4-14
Stature of UK population
UK Population Mean Height (cm) by year
160
162
164
166
168
170
172
174
176
178
180
1993 1994 1995 1996 1997 1998 1999 2000 2001 2002 2003
Year
Mea
n H
eigh
t, cm
Men
Women

HR-4-14
Conclusions
• The UK population has seen no systematic change in mean height over the period 1993 to 2003.
• The UK population has no pattern of varying mean height and age.
• The UK population has seen no systematic change in mean height over the period 1993 to 2003.
• The UK population has no pattern of varying mean height and age.
HR-4-14
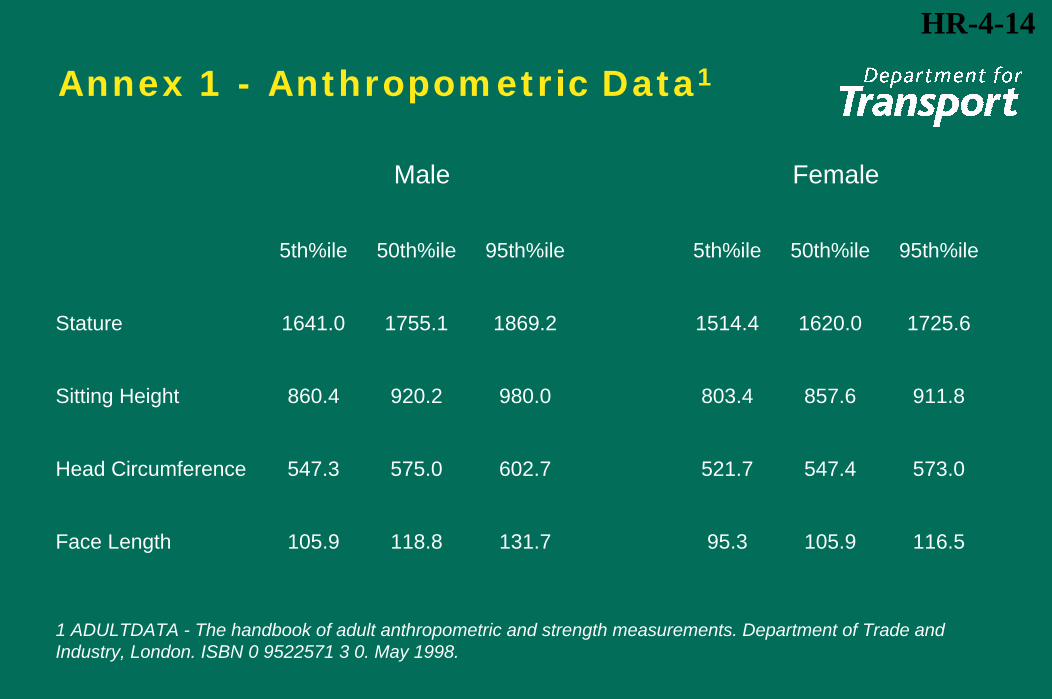
Annex 1 - Anthropometric Data1
Male Female
5th%ile 50th%ile 95th%ile 5th%ile 50th%ile 95th%ile
Stature 1641.0 1755.1 1869.2 1514.4 1620.0 1725.6
Sitting Height 860.4 920.2 980.0 803.4 857.6 911.8
Head Circumference 547.3 575.0 602.7 521.7 547.4 573.0
Face Length 105.9 118.8 131.7 95.3 105.9 116.5
1 ADULTDATA - The handbook of adult anthropometric and strength measurements. Department of Trade and Industry, London. ISBN 0 9522571 3 0. May 1998.