uk hydrocarbon network - uk-air, air quality … · uk hydrocarbon network ... uses a method...
TRANSCRIPT
UK Hydrocarbon Network
Annual Report for 2012
Report for Defra and the Devolved Administrations
Ricardo-AEA/R/ED47833 and ED46645 Issue Number 1 Date 25/06/2013
i Ref: Ricardo-AEA/R/ED47833 and ED46645/Issue Number 1
Customer: Contact:
Defra and the Devolved Administrations James Dernie
Ricardo-AEA Ltd
Gemini Building, Harwell, Didcot, OX11 0QR
t: 01235 75 6434
Ricardo-AEA is certificated to ISO9001 and ISO14001
Customer reference:
RMP 5504/5505
Confidentiality, copyright & reproduction:
This report is the Copyright of Defra and the Devolved Administrations and has been prepared by Ricardo-AEA Ltd under contract to Defra. The contents of this report may not be reproduced in whole or in part, nor passed to any organisation or person without the specific prior written permission of Defra. Ricardo-AEA Ltd accepts no liability whatsoever to any third party for any loss or damage arising from any interpretation or use of the information contained in this report, or reliance on any views expressed therein.
Author:
James Dernie, Peter Dumitrean
Approved By:
Steve Telling
Date:
25 June 2013
Signed:
Ricardo-AEA reference:
Ref: ED47833 and ED46645- Issue Number 1
ii Ref: Ricardo-AEA/R/ED47833 and ED46645/Issue Number 1
Executive summary
This report provides a summary of the site management and data produced in 2012 by the UK Hydrocarbon monitoring network.
This network comprises automatic and non-automatic systems to measure benzene. 1,3-butadiene and 29 ozone precursor substances are also measured using the automatic system. Since August 2012, formaldehyde and acetaldehyde have been measured at 5 sites as part of a two year pilot study.
The report includes an introduction to the network, the history of monitoring and the reasons for monitoring these pollutants. Section 2 provides detailed information on the sites currently operating and changes to the network during 2012. In section 3 and Appendix 2, summary data is presented and analysed, including a review of the long-term trends and a description of issues that have affected data capture or data quality. The report also includes a summary of the quality assurance and quality control procedures in sections 2 and 4 and an update on future changes in section 5.
The mean data capture for benzene measured by the non-automatic hydrocarbon sites in 2012 was 82.7%. It is important to note that some sites were removed and others installed during the calendar year. The data capture for sites running between January and December 2012 was 94.8%. The annual mean concentration across all non-automatic measurement
sites in the UK was 0.82 g m-3 and the highest annual mean concentration for a single site
was 1.97 g m-3 measured at Grangemouth. The mean data capture for benzene measured by the automatic hydrocarbon network in 2012 was 89.9% and the highest annual mean measurement for a single site was 1.4 µg.m-3 at London Marylebone Road. The annual mean across all automatic measurement sites in the UK was 0.65 µg.m-3.
In 2012 none of the automatic and non-automatic monitoring sites in the UK exceeded the 5 µg m-3 annual mean Limit Value for benzene set out in Directive 2008/50/EC1, hereafter referred to as ‘the Directive’. All sites measured an annual mean that was less than the Lower Assessment Threshold of 2 µg m-3 defined within the directive.
1 EC(2008). Directive 2008/50/EC The European Parliament and the Council of May 2008 on ambient air quality and cleaner air for Europe.
iii Ref: Ricardo-AEA/R/ED47833 and ED46645/Issue Number 1
Table of contents
1 Introduction ................................................................................................................ 1 1.1 Pollutant Sources and Impacts ........................................................................... 1 1.2 Network background and methods ..................................................................... 2 Regulatory background ................................................................................................ 4
2 Site Management ........................................................................................................ 5 2.1 Network sites during 2012 .................................................................................. 5 2.1 Additional Sites in 2012 ...................................................................................... 9 2.2 Equipment Maintenance and Audits ..................................................................13
3 Data and Data capture for 2012 ................................................................................14 3.1 Comparison with Limit Values and Objectives ...................................................14 3.2 Concentration trends .........................................................................................18
4 Data Quality ...............................................................................................................22 4.1 Intercomparisons...............................................................................................22 4.2 Estimation of Uncertainty ..................................................................................23 4.3 Standard Methods .............................................................................................24 4.4 Limit of Detection ..............................................................................................25
5 Developments and Recommendations ....................................................................26 5.1 EN14662-3:2005 ...............................................................................................26 5.2 Acetaldehyde and Formaldehyde ......................................................................26
Appendices
Appendix 1: 2012 Audit Schedule
Appendix 2: Data capture, maximum and annual mean values from the Automatic Hydrocarbon Network
Appendix 3 Current Non automatic flow audit certificate
Appendix 4: Benzene and 1, 3-Butadiene Timeseries plots, Automatic and Non automatic data
1 Ref: Ricardo-AEA/R/ED47833 and ED46645/Issue Number 1
1 Introduction
This report provides a summary of the site management and data produced in 2012 by the UK Hydrocarbon monitoring network.
This network comprises automatic and non-automatic systems to measure benzene. 1,3-butadiene and 29 ozone precursor substances are also measured using the automatic system. Since August 2012, formaldehyde and acetaldehyde have been measured at 5 sites as part of a two year pilot study.
The network has been managed and quality controlled by AEA until 8th November 2012, from 9th November 2012, Ricardo-AEA.
All hydrocarbon network instruments are collocated at AURN (Automatic Urban and Rural Network) sites with the exception of Bury Roadside, this site was de-affiliated from the AURN on 6th September 2012 and is currently due to be relocated during 2013. The 40 non automatic sites have all been assessed with respect to the macroscale and microscale siting criteria in the Directive. The initial assessment indicates that all of the hydrocarbon network sites comply with the Directive, with the exception of Bury Roadside, Bristol Old Market and Leicester Centre. Bury Roadside and Bristol Old Market are believed to be too close to major road junctions to be representative of the local area, and additionally, the Bury Roadside site is too far from the carriageway to be a ‘traffic’ site. Leicester centre is surrounded by tall buildings in close proximity to the inlet.
The number and location of sites in the network are based upon a preliminary assessment against the sampling requirements in Annex V of the Air Quality Directive, undertaken in 20062. A monitoring regime assessment of the number and location of monitoring sites in each Member State is required to be undertaken every 5 years, the UK carried out this reassessment for the hydrocarbons network in 2011. The automatic instruments will remain at their current locations. Changes to the location of non-automatic samplers are detailed in Section 2.1.
The information and data presented in this report are correct at the time of publication, however, it is possible that data may be rescaled or deleted from the dataset if future audits and calibrations identify a need to change the data. Latest data can always be accessed at http://uk-air.defra.gov.uk/.
1.1 Pollutant Sources and Impacts
Benzene has a variety of sources3, but primarily arises from domestic and industrial combustion and road transport. It is a recognised human carcinogen that attacks the genetic material and, as such, no absolutely safe level can be specified in ambient air. Studies in workers exposed to high levels have shown an excessive risk of leukaemia.
1,3-butadiene is emitted from combustion of petrol. Motor vehicles and other machinery are the dominant sources, but it is also emitted from some processes, such as production of synthetic rubber for tyres. 1,3-butadiene is also a recognised genotoxic human carcinogen, as such, no absolutely safe level can be specified in ambient air. The health effect of most
2 Defra (2013) UK Air Quality Monitoring Strategy. Compliance Assessment under the Ambient Air Quality Directive 2008/50/EC. Department of
the Environment, Food Rural Affairs in partnership with the Scottish Executive, the Welsh Assembly Government and the Department of the Environment Northern Ireland. The Stationery Office, London.(under preparation). 3 The Air Quality Strategy for England, Scotland, Wales and Northern Ireland (Volume 1), Department for Environment, Food and Rural Affairs in
partnership with the Scottish Executive, Welsh Assembly Government and Department of the Environment Northern Ireland, July 2007
2 Ref: Ricardo-AEA/R/ED47833 and ED46645/Issue Number 1
concern is the induction of cancer of the lymphoid system and blood–forming tissues, lymphoma and leukaemia.
1.2 Network background and methods
The UK Hydrocarbon Network exists within the framework of Defra’s Atmosphere and Local Environment Programme. This aims to determine the magnitude of sources and effects of air pollutants on human health and the environment, and to comply with national and EU legislation.
1.2.1 Non-Automatic Hydrocarbon Sites
The Non-Automatic Hydrocarbon Sites started operation in 2001, measuring benzene and 1,3-butadiene. It currently produces measurements as nominal fortnightly averages at 34 sites. The network was reviewed in 2007 and 1,3-butadiene monitoring was discontinued due to the measurement of very low concentrations. During 2012 measurements have been made at 41 sites as a result of changes to the network (Appendix 1).
The benzene monitoring method involves drawing ambient air at a controlled rate (nominally 10 ml/min) alternately through two tubes (A and B) containing a carbon based sorbent (Carbopack X). Each tube samples alternately at 10 ml/min for 8 minute periods for a nominal two week period. A designated local site operator manually changes the tubes and returns these to Ricardo-AEA, on completion of the sampling period. The tubes are then sent to the laboratory for subsequent analysis for benzene by gas chromatography-mass spectrometry. The sampling period and sample flow rate are important such that enough benzene is captured onto the sorbent to enable fully quantifiable analysis, but not too much that there is breakthrough of the sample. This dual sample tube controlled flow pump unit uses a method described in EN 14662:2005, ‘Ambient air quality – Standard method for measurement of benzene concentrations’ by Martin et al4, and validated by Quincey et al5.
1.2.2 Automatic Hydrocarbon Sites
Automated thermal desorption with in situ gas chromatography and FID detection is used to measure hourly hydrocarbon concentrations. During 2012, hydrocarbons at all sites were measured using automatic Perkin Elmer Ozone Precursor Analysers. A known volume of air is dried and drawn through a cold trap, which contains adsorbent material. The cold trap is held at about -30oC to ensure that all the ozone precursor target analytes are retained. Following a 40 minute period of sampling, components are desorbed from the cold trap and are transferred to the capillary column where they are separated using gas-chromatography and subsequently detected by a flame ionising detector. The analyser is calibrated using an on-site multi-component gas mixture.
Automatic hourly measurements of speciated hydrocarbons, made using advanced automatic gas chromatography, started in the UK in 1991. By 1995, monitoring had expanded considerably with the formation of a 13-site dedicated network measuring 26 species continuously at urban, industrial and rural locations. Over the following years, the number of sites was reduced. In 2012 there were four sites, measuring the following species by automatic gas chromatographs:
4 Martin et al, 2003. Studies using the sorbent Carbopack X for measuring environmental benzene with Perkin-Elmer-type pumped and diffusive
samplers. Atmospheric Environment, 37, (7), 871-879 5 http://www.airquality.co.uk/archive/reports/cat05/0407061411_btex_npl_pilot_final.pdf
3 Ref: Ricardo-AEA/R/ED47833 and ED46645/Issue Number 1
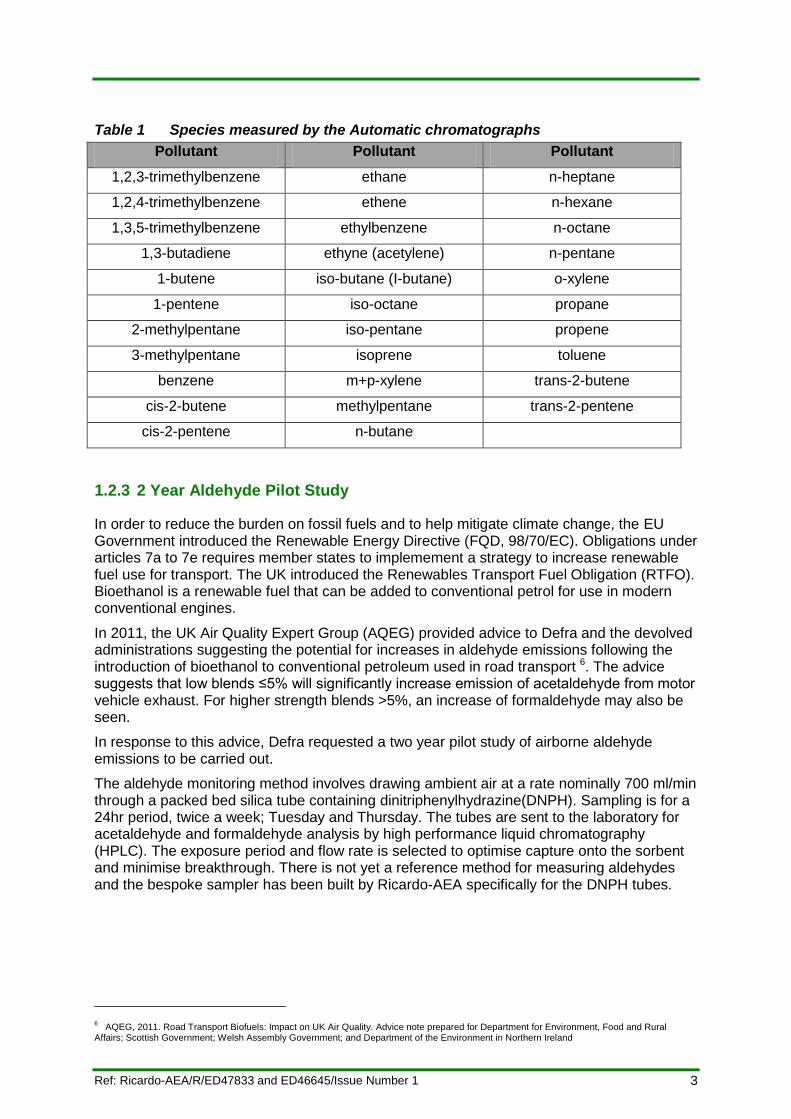
Table 1 Species measured by the Automatic chromatographs
Pollutant Pollutant Pollutant
1,2,3-trimethylbenzene ethane n-heptane
1,2,4-trimethylbenzene ethene n-hexane
1,3,5-trimethylbenzene ethylbenzene n-octane
1,3-butadiene ethyne (acetylene) n-pentane
1-butene iso-butane (I-butane) o-xylene
1-pentene iso-octane propane
2-methylpentane iso-pentane propene
3-methylpentane isoprene toluene
benzene m+p-xylene trans-2-butene
cis-2-butene methylpentane trans-2-pentene
cis-2-pentene n-butane
1.2.3 2 Year Aldehyde Pilot Study
In order to reduce the burden on fossil fuels and to help mitigate climate change, the EU Government introduced the Renewable Energy Directive (FQD, 98/70/EC). Obligations under articles 7a to 7e requires member states to implemement a strategy to increase renewable fuel use for transport. The UK introduced the Renewables Transport Fuel Obligation (RTFO). Bioethanol is a renewable fuel that can be added to conventional petrol for use in modern conventional engines.
In 2011, the UK Air Quality Expert Group (AQEG) provided advice to Defra and the devolved administrations suggesting the potential for increases in aldehyde emissions following the introduction of bioethanol to conventional petroleum used in road transport 6. The advice suggests that low blends ≤5% will significantly increase emission of acetaldehyde from motor vehicle exhaust. For higher strength blends >5%, an increase of formaldehyde may also be seen.
In response to this advice, Defra requested a two year pilot study of airborne aldehyde emissions to be carried out.
The aldehyde monitoring method involves drawing ambient air at a rate nominally 700 ml/min through a packed bed silica tube containing dinitriphenylhydrazine(DNPH). Sampling is for a 24hr period, twice a week; Tuesday and Thursday. The tubes are sent to the laboratory for acetaldehyde and formaldehyde analysis by high performance liquid chromatography (HPLC). The exposure period and flow rate is selected to optimise capture onto the sorbent and minimise breakthrough. There is not yet a reference method for measuring aldehydes and the bespoke sampler has been built by Ricardo-AEA specifically for the DNPH tubes.
6 AQEG, 2011. Road Transport Biofuels: Impact on UK Air Quality. Advice note prepared for Department for Environment, Food and Rural
Affairs; Scottish Government; Welsh Assembly Government; and Department of the Environment in Northern Ireland
4 Ref: Ricardo-AEA/R/ED47833 and ED46645/Issue Number 1
Regulatory background
1.2.4 UK Air Quality Objectives
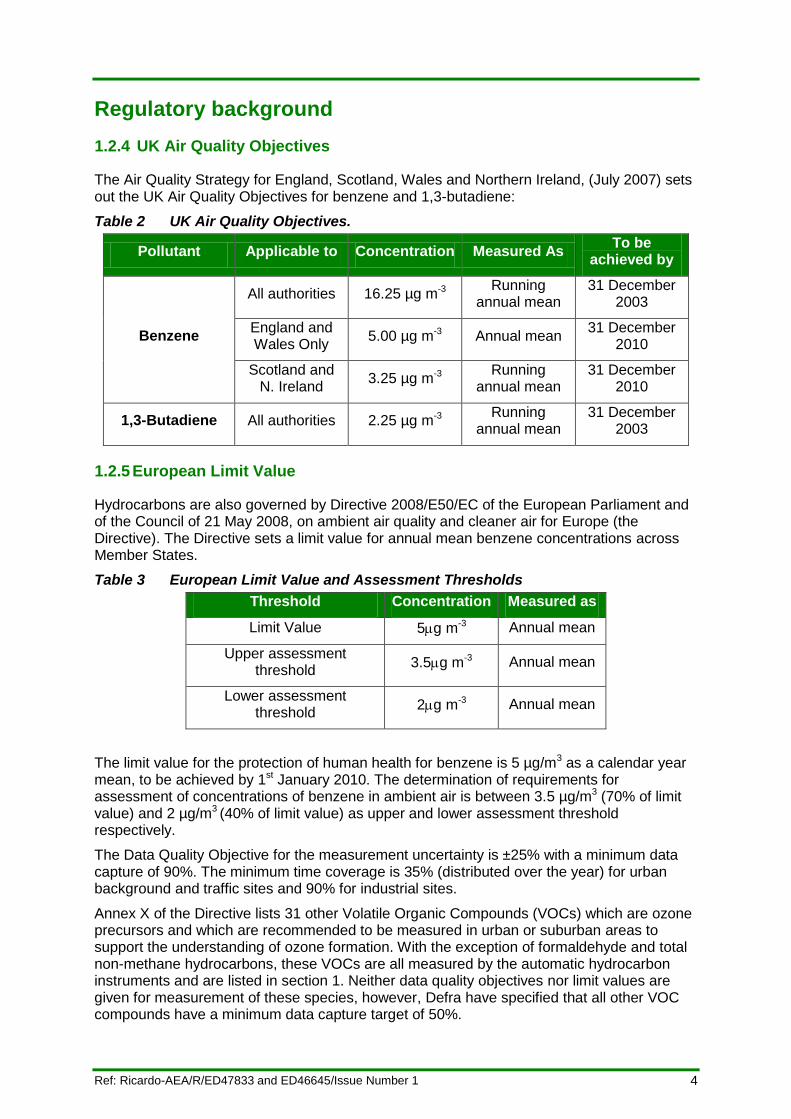
The Air Quality Strategy for England, Scotland, Wales and Northern Ireland, (July 2007) sets out the UK Air Quality Objectives for benzene and 1,3-butadiene:
Table 2 UK Air Quality Objectives.
Pollutant Applicable to Concentration Measured As To be
achieved by
Benzene
All authorities 16.25 µg m-3 Running
annual mean 31 December
2003
England and Wales Only
5.00 µg m-3 Annual mean 31 December
2010
Scotland and N. Ireland
3.25 µg m-3 Running
annual mean 31 December
2010
1,3-Butadiene All authorities 2.25 µg m-3 Running
annual mean 31 December
2003
1.2.5 European Limit Value
Hydrocarbons are also governed by Directive 2008/E50/EC of the European Parliament and of the Council of 21 May 2008, on ambient air quality and cleaner air for Europe (the Directive). The Directive sets a limit value for annual mean benzene concentrations across Member States.
Table 3 European Limit Value and Assessment Thresholds
Threshold Concentration Measured as
Limit Value 5g m-3 Annual mean
Upper assessment threshold
3.5g m-3 Annual mean
Lower assessment threshold
2g m-3 Annual mean
The limit value for the protection of human health for benzene is 5 µg/m3 as a calendar year mean, to be achieved by 1st January 2010. The determination of requirements for assessment of concentrations of benzene in ambient air is between 3.5 µg/m3 (70% of limit value) and 2 µg/m3 (40% of limit value) as upper and lower assessment threshold respectively.
The Data Quality Objective for the measurement uncertainty is ±25% with a minimum data capture of 90%. The minimum time coverage is 35% (distributed over the year) for urban background and traffic sites and 90% for industrial sites.
Annex X of the Directive lists 31 other Volatile Organic Compounds (VOCs) which are ozone precursors and which are recommended to be measured in urban or suburban areas to support the understanding of ozone formation. With the exception of formaldehyde and total non-methane hydrocarbons, these VOCs are all measured by the automatic hydrocarbon instruments and are listed in section 1. Neither data quality objectives nor limit values are given for measurement of these species, however, Defra have specified that all other VOC compounds have a minimum data capture target of 50%.
5 Ref: Ricardo-AEA/R/ED47833 and ED46645/Issue Number 1
2 Site Management
2.1 Network sites during 2012
2.1.1 Non-Automatic Hydrocarbon Network
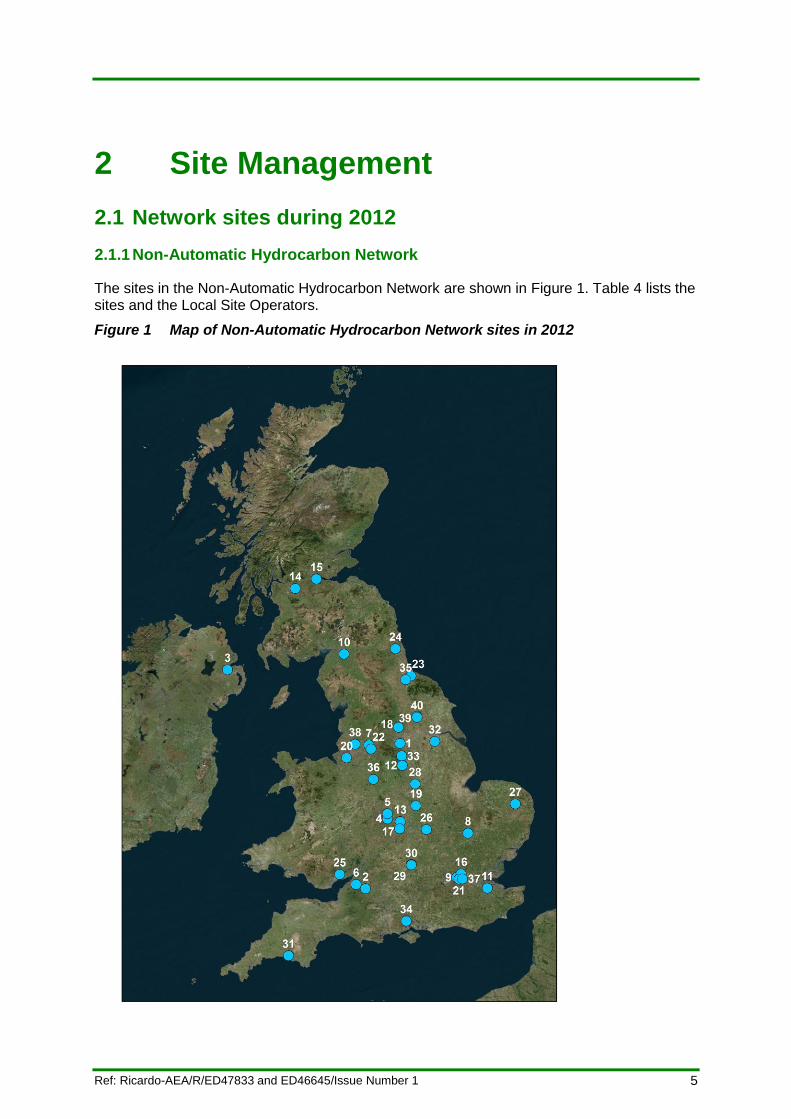
The sites in the Non-Automatic Hydrocarbon Network are shown in Figure 1. Table 4 lists the sites and the Local Site Operators.
Figure 1 Map of Non-Automatic Hydrocarbon Network sites in 2012
6 Ref: Ricardo-AEA/R/ED47833 and ED46645/Issue Number 1
Table 4 Non-Automatic Hydrocarbon Network sites in 2012.
Site Classification Zone
Grid Ref Easting / Northing
Local Site Operator
1 Barnsley Gawber
Urban Background
Yorkshire & Humberside
432529, 407472
Barnsley Council
2 Bath Roadside Urban Traffic South West
375882, 166096
Bath & North Somerset Council
3 Belfast Centre
Urban Background
Belfast Urban Area 333900, 374400
Belfast City Council
4 Birmingham Acocks Green
Urban Background
West Midlands Urban Area
411654, 282146
Birmingham City Council
5 Birmingham Tyburn Roadside
Urban Traffic West Midlands Urban Area
411556, 290456
AECOM
6 Bristol Old Market
Urban Traffic Bristol Urban Area 359570, 173173
Bristol City Council
7 Bury Roadside Urban Traffic
Greater Manchester Urban Area
380922, 404772
Bury Metropolitan Council
8 Cambridge Roadside
Urban Traffic Eastern 545248, 258155
Cambridge Council
9 Camden Kerbside
Urban Traffic Greater London Urban Area
526640, 184433
AEA / Ricardo-AEA
10 Carlisle Roadside
Urban Traffic North West & Merseyside
339442, 555956
Carlisle Council
11 Chatham Centre Roadside
Urban Traffic South East 577435, 166993
Medway Council
12 Chesterfield
Urban Background
East Midlands 436351, 370682
Chesterfield Council
13 Coventry Memorial Park
Urban Background
Coventry/Bedworth 432801, 277340
Coventry City Council
14 Glasgow Kerbside
Urban Traffic Glasgow Urban Area
258708, 665200
AEA / Ricardo-AEA
15 Grangemouth
Urban Industrial
Central Scotland 293837, 681035
Falkirk Council
16 Haringey Roadside
Urban Traffic Greater London Urban Area
533885, 190669
KCL / Ricardo-AEA
17 Leamington Spa
Urban Background
West Midlands 431932, 265743
Warwick District Council
18 Leeds Centre
Urban Background
West Yorkshire Urban Area
429976, 434268
Leeds City Council
19 Leicester Centre
Urban Background
Leicester Urban Area
458767, 304083
Leicester City Council
20 Liverpool Speke
Urban Background
Liverpool Urban Area
343860, 383598
Fabermaunsell/AECOM
21 London Bloomsbury
Urban Background
Greater London Urban Area
530107, 182041
Bureau Veritas / AEA / Ricardo AEA
22 Manchester Piccadilly
Urban Background
Greater Manchester Urban Area
384310, 398325
Manchester City Council
23 Middlesbrough
Urban Background
Teesside Urban Area
450480, 519632
Middlesbrough BC
24 Newcastle Centre
Urban Background
Tyneside 425016, 564940
Newcastle City Council
25 Newport
Urban Background
South Wales 33410, 189604
Newport City Council
26 Northampton*
Urban Background
East Midlands 476111, 264524
Northampton BC

7 Ref: Ricardo-AEA/R/ED47833 and ED46645/Issue Number 1
Site Classification Zone
Grid Ref Easting / Northing
Local Site Operator
27 Norwich Lakenfields
Urban Background
Eastern 623637, 306940
Mark Leach
28 Nottingham Centre
Urban Background
Nottingham Urban Area
457420, 340050
Nottingham City Council
29 Oxford Centre Roadside
Urban Traffic South East 451366, 206152
Oxford City Council
30 Oxford St Ebbes
Urban Background
South East 451225, 206009
Oxford City Council
31 Plymouth Centre
Urban Background
South West 247742, 54610
Plymouth City Council
32 Scunthorpe Town
Urban Industrial
Yorkshire & Humberside
490338, 410836
North Lincs CBC
33 Sheffield Centre
Urban Background
Sheffield Urban Area
435134, 386885
Sheffield City Council
34 Southampton Centre
Urban Background
Southampton Urban Area
442565, 112255
Southampton City Council
35 Stockton-on-Tees - Eaglescliffe
Urban Traffic North East 441620, 513673
Stockton on Tees BC
36 Stoke-on-Trent Centre
Urban Background
The Potteries 388348, 347894
City of Stoke on Trent Council
37 Tower Hamlets Roadside
Urban Traffic Greater London 535927, 182218
Kings College, London
38 Wigan Centre
Urban Background
North West & Merseyside
357825, 406025
Wigan Metropolitan BC
39 York Bootham
Urban Backgorund
Yorkshire & Humberside
460024, 452768
City of York Council
40 York Fishergate
Urban Traffic Yorkshire & Humberside
460744, 451033
City of York Council
*This site was temporarily moved to Northampton Kingsthorpe a few weeks before the sampler was removed.
As part of an ongoing investigation, there were also pumped samplers operating at Marylebone Road from 2007 to January 2013, and at London Eltham from 2011until June 2012. These pumped samplers are not part of the Non-Automatic Network.
Further details on the sites can be found on the UK Automatic Urban and Rural Network Site Information Archive at http://uk-air.defra.gov.uk/
8 Ref: Ricardo-AEA/R/ED47833 and ED46645/Issue Number 1
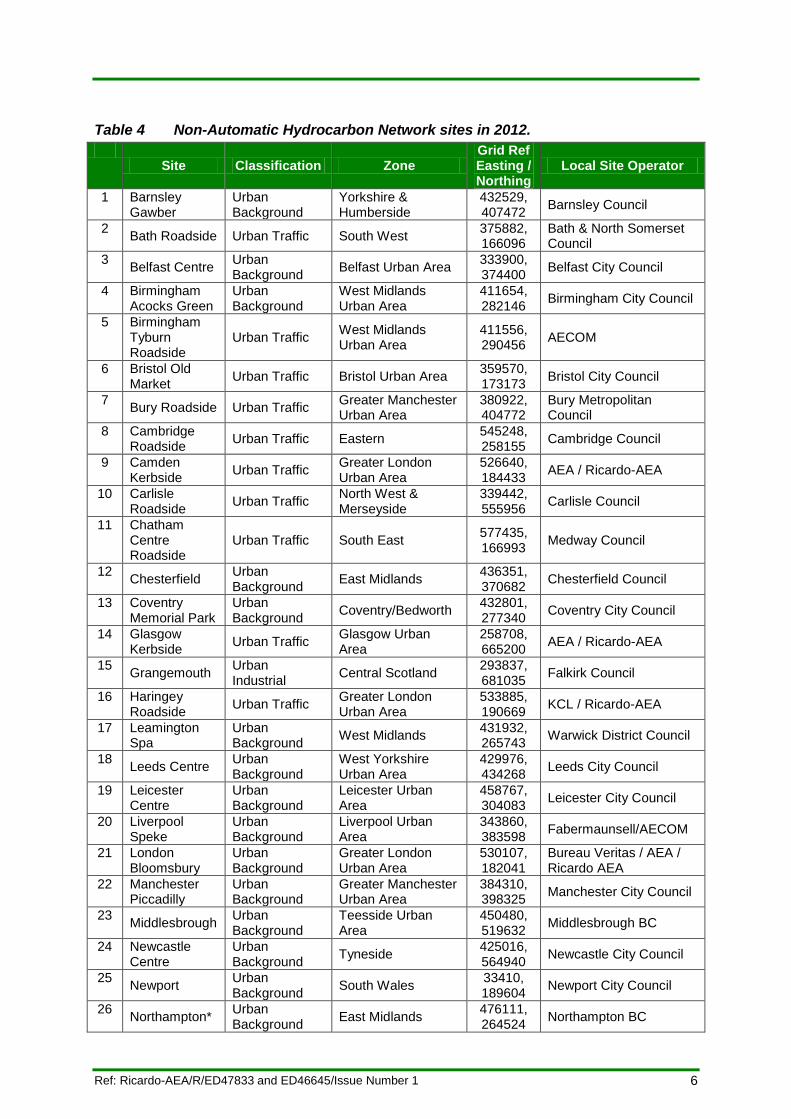
2.1.1 Automatic Hydrocarbon Network
The sites in the Automatic Hydrocarbon Network are shown in Figure 2.
Figure 2 Map of Automatic Network sites in 2012
Table 5 Automatic Hydrocarbon Network sites in 2012.
Site Classification Zone
Grid Ref Easting / Northing
Local Site Operator
1 Harwell
Rural Background
South West 446772, 186020
AEA/ Ricardo-AEA
2 Marylebone
Road Urban Traffic
Greater London Urban
Area
528120, 182000
KCL
3 Auchencorth Moss
Rural Background
Scotland 322050, 656250
CEH
4 London Eltham
Suburban Background
Greater London Urban
Area
543978, 174668
Greenwich Borough Council

9 Ref: Ricardo-AEA/R/ED47833 and ED46645/Issue Number 1
2.1 Additional Sites in 2012
2.1.1 Newport
The monitoring regime assessment7 identified that the Plymouth Centre monitoring site was not required for either compliance reporting or for the purposes of modelling. The report also identified that an additional site in South Wales was required for compliance with the directive. The Newport AURN site at St Julians School (Figure 3) was identified as an ideal location for the additional site and the benzene sampler from Plymouth Centre was relocated on 1st October 2012 and installed at Newport on 31st November 2012.
Figure 3 Photograph and Location of Newport (map images courtesy of Google).
7 Defra (2013) UK Air Quality Monitoring Strategy. Compliance Assessment under the Ambient Air Quality Directive 2008/50/EC. Department of
the Environment, Food Rural Affairs in partnership with the Scottish Executive, the Welsh Assembly Government and the Department of the Environment Northern Ireland. The Stationery Office, London.(under preparation).
10 Ref: Ricardo-AEA/R/ED47833 and ED46645/Issue Number 1
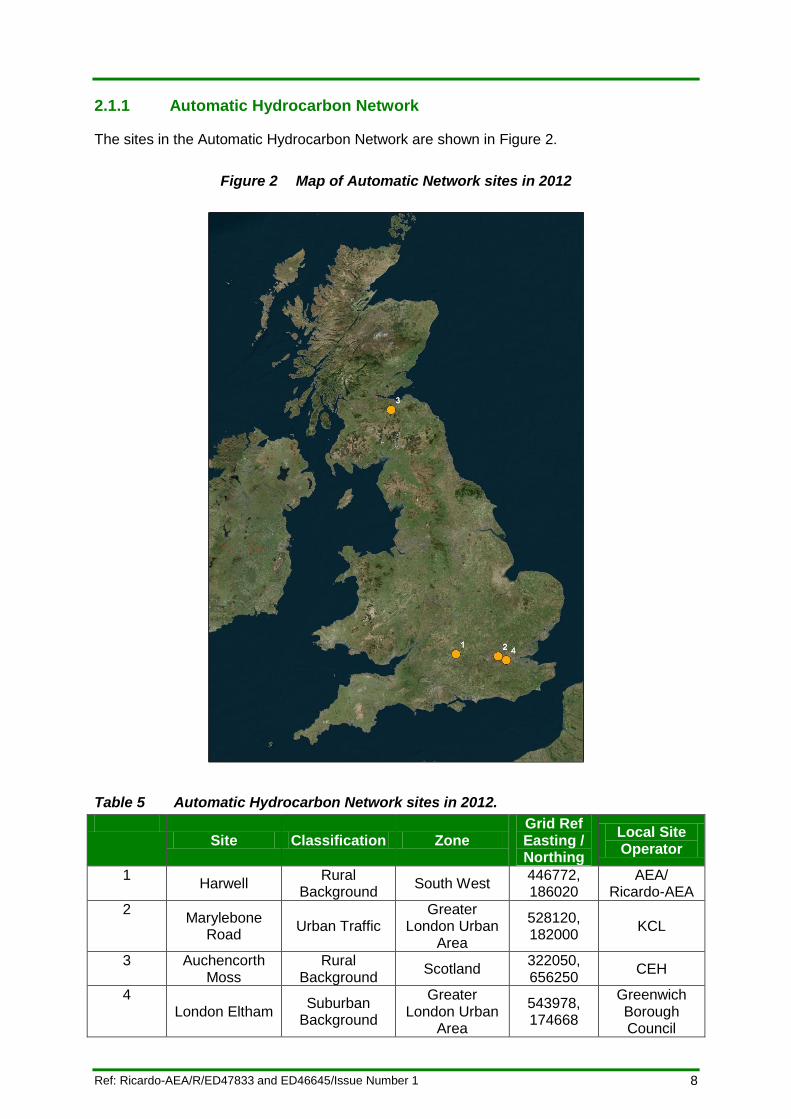
2.1.2 Tower Hamlets Roadside
The review of the network recommended that the Bristol Old Market site was not required for either compliance or modelling and identified that an additional roadside site in London was required for modelling. The Tower Hamlets Roadside AURN site (Figure 4) was identified as an ideal location and the sampler was removed from Bristol Old Market on 3rd October 2012 and installed at Tower Hamlets Roadside 13th November 2012.
Figure 4 Photograph and location of Tower Hamlets Roadside (images courtesy of google)
11 Ref: Ricardo-AEA/R/ED47833 and ED46645/Issue Number 1
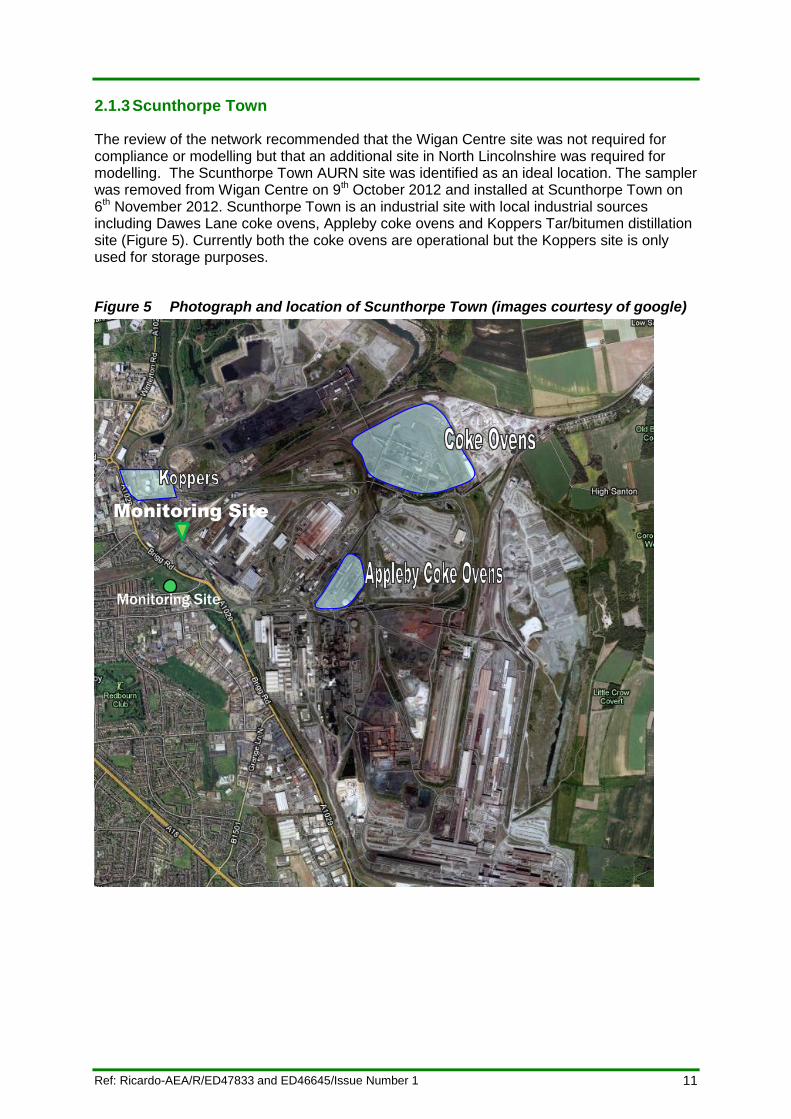
2.1.3 Scunthorpe Town
The review of the network recommended that the Wigan Centre site was not required for compliance or modelling but that an additional site in North Lincolnshire was required for modelling. The Scunthorpe Town AURN site was identified as an ideal location. The sampler was removed from Wigan Centre on 9th October 2012 and installed at Scunthorpe Town on 6th November 2012. Scunthorpe Town is an industrial site with local industrial sources including Dawes Lane coke ovens, Appleby coke ovens and Koppers Tar/bitumen distillation site (Figure 5). Currently both the coke ovens are operational but the Koppers site is only used for storage purposes.
Figure 5 Photograph and location of Scunthorpe Town (images courtesy of google)
Monitoring Site
Monitoring Site
12 Ref: Ricardo-AEA/R/ED47833 and ED46645/Issue Number 1
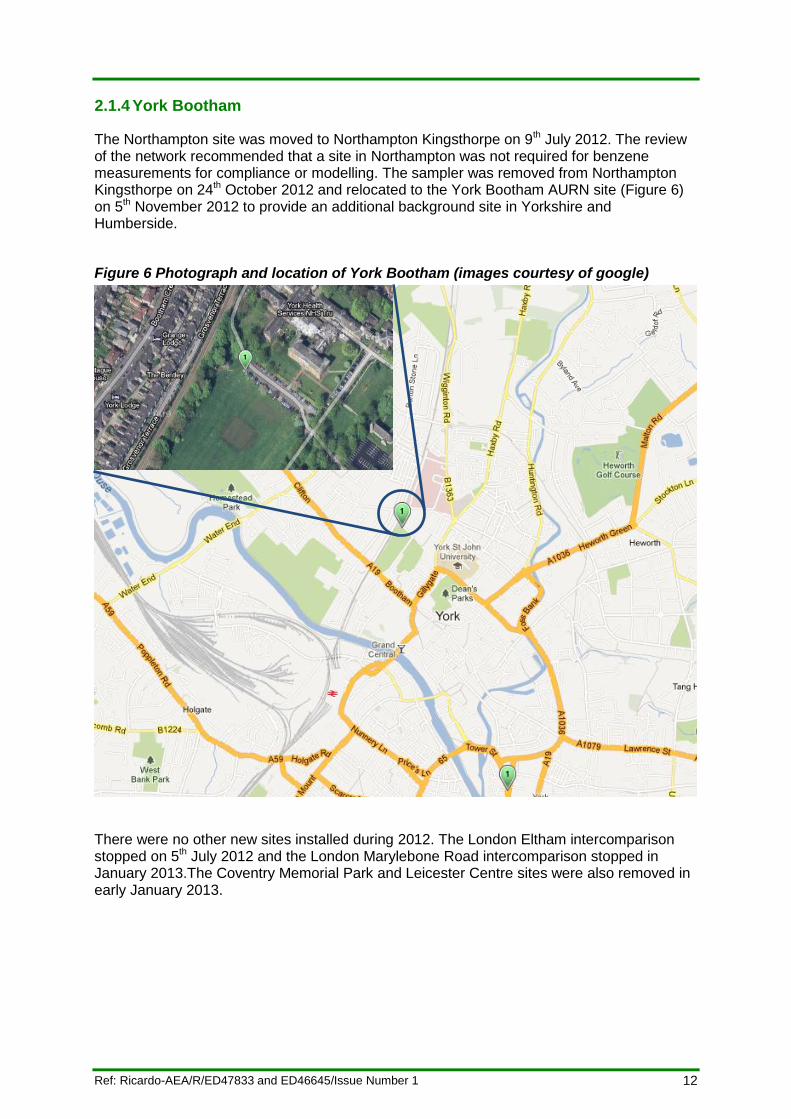
2.1.4 York Bootham
The Northampton site was moved to Northampton Kingsthorpe on 9th July 2012. The review of the network recommended that a site in Northampton was not required for benzene measurements for compliance or modelling. The sampler was removed from Northampton Kingsthorpe on 24th October 2012 and relocated to the York Bootham AURN site (Figure 6) on 5th November 2012 to provide an additional background site in Yorkshire and Humberside.
Figure 6 Photograph and location of York Bootham (images courtesy of google)
There were no other new sites installed during 2012. The London Eltham intercomparison stopped on 5th July 2012 and the London Marylebone Road intercomparison stopped in January 2013.The Coventry Memorial Park and Leicester Centre sites were also removed in early January 2013.

13 Ref: Ricardo-AEA/R/ED47833 and ED46645/Issue Number 1
2.2 Equipment Maintenance and Audits
All non-automatic monitoring sites are visited by field engineers on a 6 monthly basis to calibrate the sampling flows and carry out routine maintenance of the equipment. The purpose of the audit and maintenance visits are to:
Carry out a flow measurement and calibration using a low flow BIOS instrument (UKAS accredited)
Ensure no blockages or leaks in the system
Clean or replace dirty filters and inspect/replace the sample inlet
Replace o-rings and leak test all connections
Carry out electrical Portable Appliance Testing (annually)
Review the site infrastructure and surroundings
Review health and safety risks at the site
Replace or refurbish non automatic sampler pumps
Non-Automatic Hydrocarbon benzene samplers were audited in October 2011, April 2012, October 2012 and April 2013. All of these measurements are used to calculate sample volumes for the 2012 data set by means of interpolation. The schedule and results of these visits can be seen in Appendix 1. The calibration data from these audits have been used to rescale the benzene concentrations during the ratification process. A copy of the certificate of accredited measurements is available in Appendix 3.
Automatic Hydrocarbon Network analysers are audited once each year, and in 2012 the audits took place between March and May:
Auchencorth Moss 28th March 2012
Harwell 16th April 2012
London Marylebone Road 20th March 2012
London Eltham 22nd March 2012
Following the audits the automatic monitoring sites are serviced by the Equipment Support Unit (Perkin Elmer) where the following routine tasks are undertaken:-
Change automatic GC cold trap and clean the gas generators and detectors
Carry out a gas calibration for the automatic analysers
14 Ref: Ricardo-AEA/R/ED47833 and ED46645/Issue Number 1
3 Data and Data capture for 2012
3.1 Comparison with Limit Values and Objectives
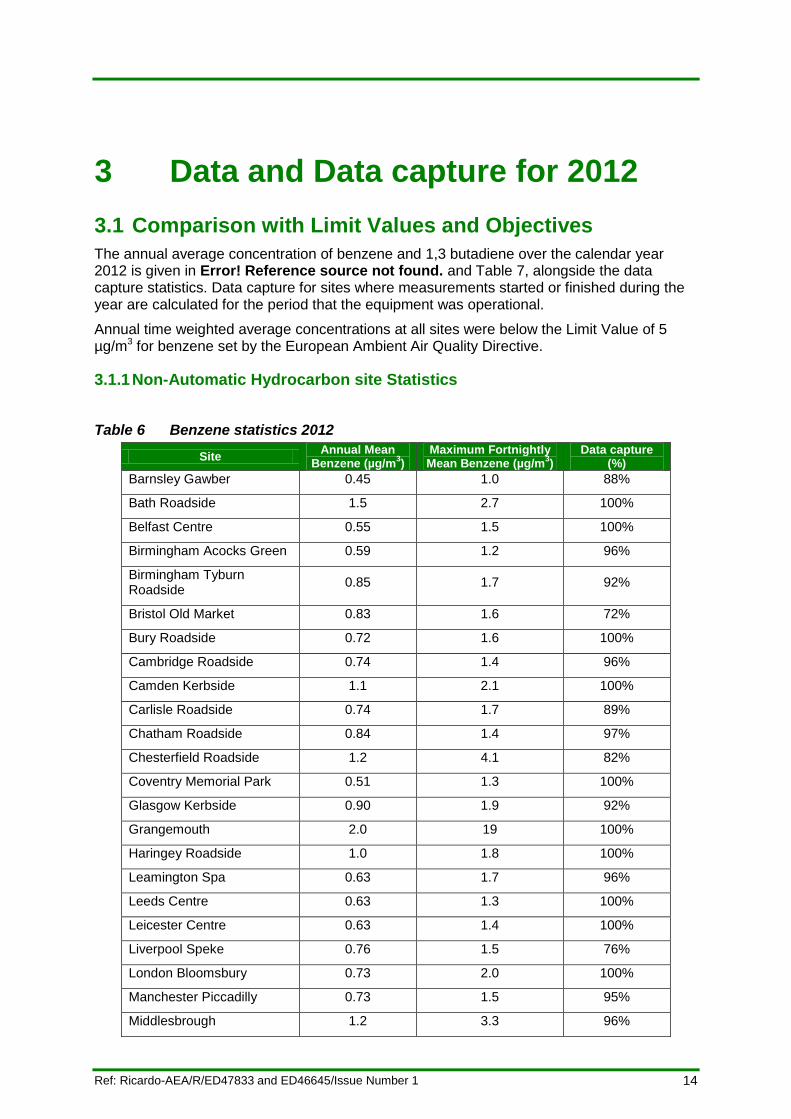
The annual average concentration of benzene and 1,3 butadiene over the calendar year 2012 is given in Error! Reference source not found. and Table 7, alongside the data capture statistics. Data capture for sites where measurements started or finished during the year are calculated for the period that the equipment was operational.
Annual time weighted average concentrations at all sites were below the Limit Value of 5 µg/m3 for benzene set by the European Ambient Air Quality Directive.
3.1.1 Non-Automatic Hydrocarbon site Statistics
Table 6 Benzene statistics 2012
Site Annual Mean
Benzene (µg/m3)
Maximum Fortnightly Mean Benzene (µg/m
3)
Data capture (%)
Barnsley Gawber 0.45 1.0 88%
Bath Roadside 1.5 2.7 100%
Belfast Centre 0.55 1.5 100%
Birmingham Acocks Green 0.59 1.2 96%
Birmingham Tyburn Roadside
0.85 1.7 92%
Bristol Old Market 0.83 1.6 72%
Bury Roadside 0.72 1.6 100%
Cambridge Roadside 0.74 1.4 96%
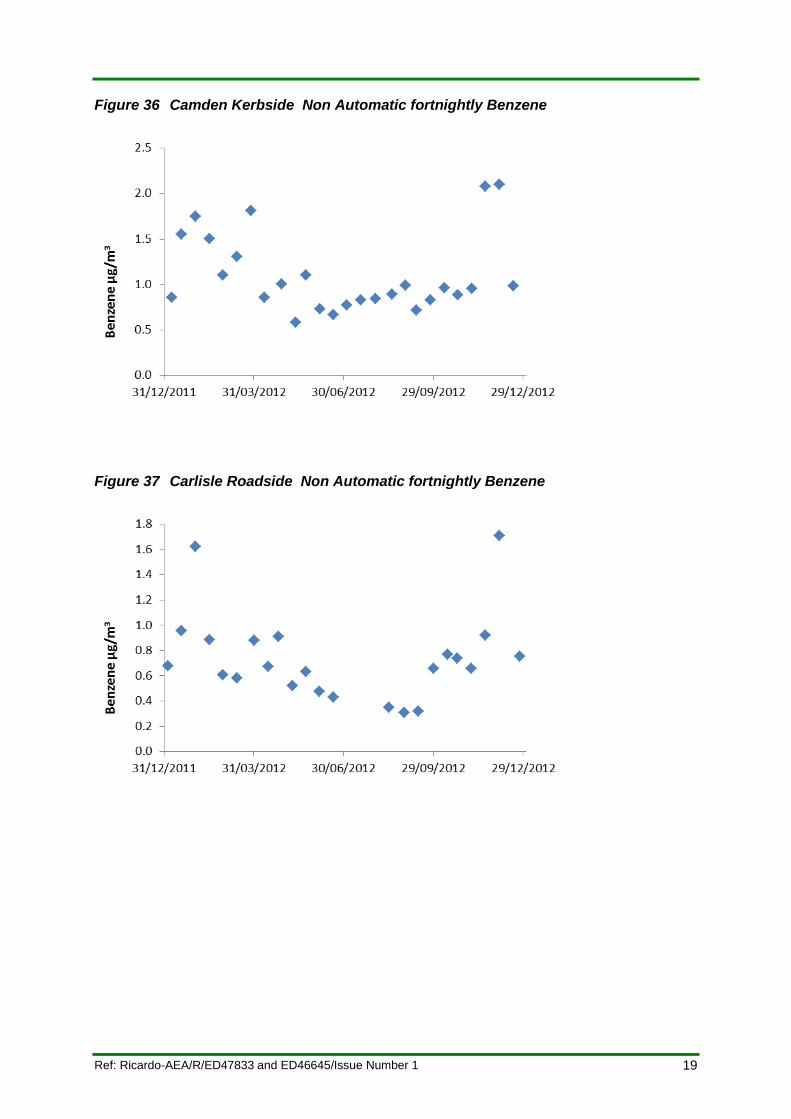
Camden Kerbside 1.1 2.1 100%
Carlisle Roadside 0.74 1.7 89%
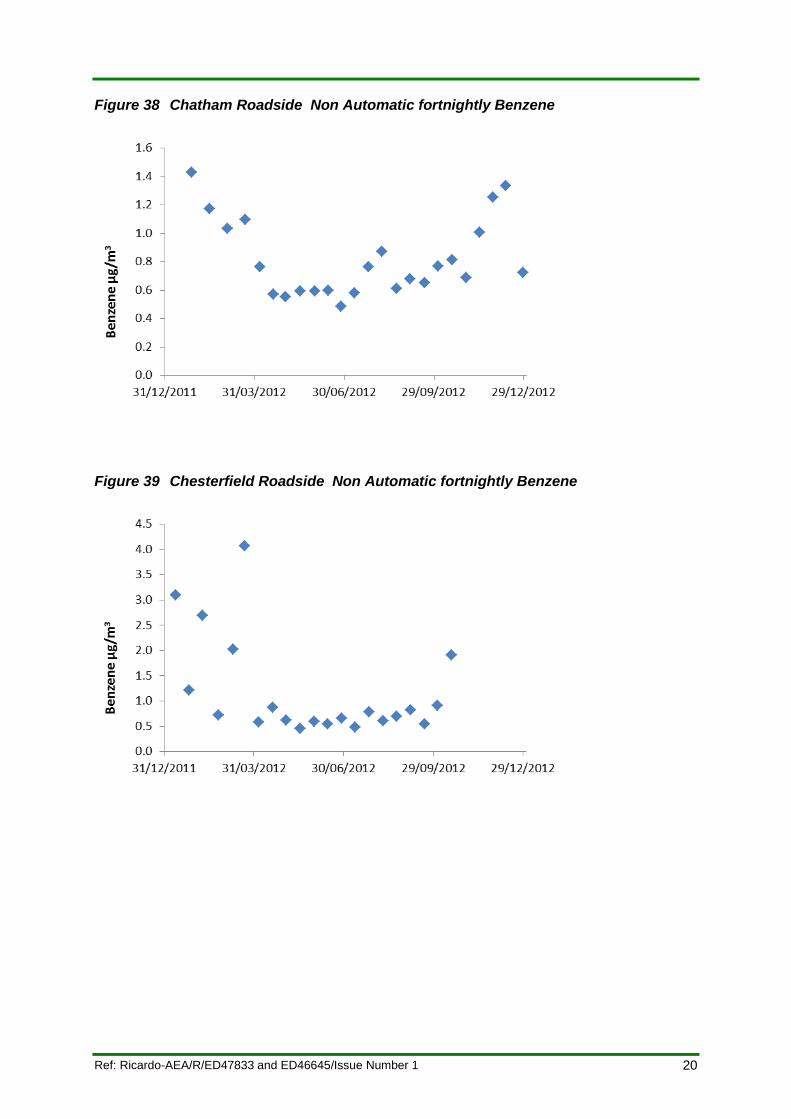
Chatham Roadside 0.84 1.4 97%
Chesterfield Roadside 1.2 4.1 82%
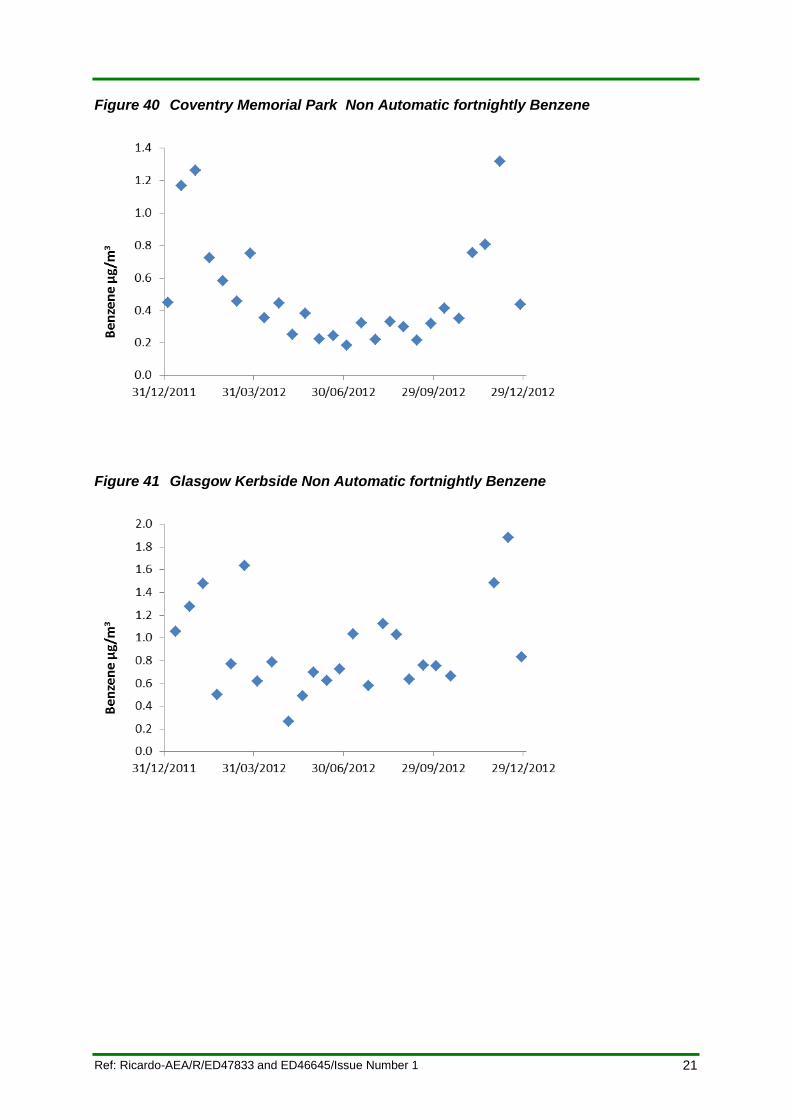
Coventry Memorial Park 0.51 1.3 100%
Glasgow Kerbside 0.90 1.9 92%
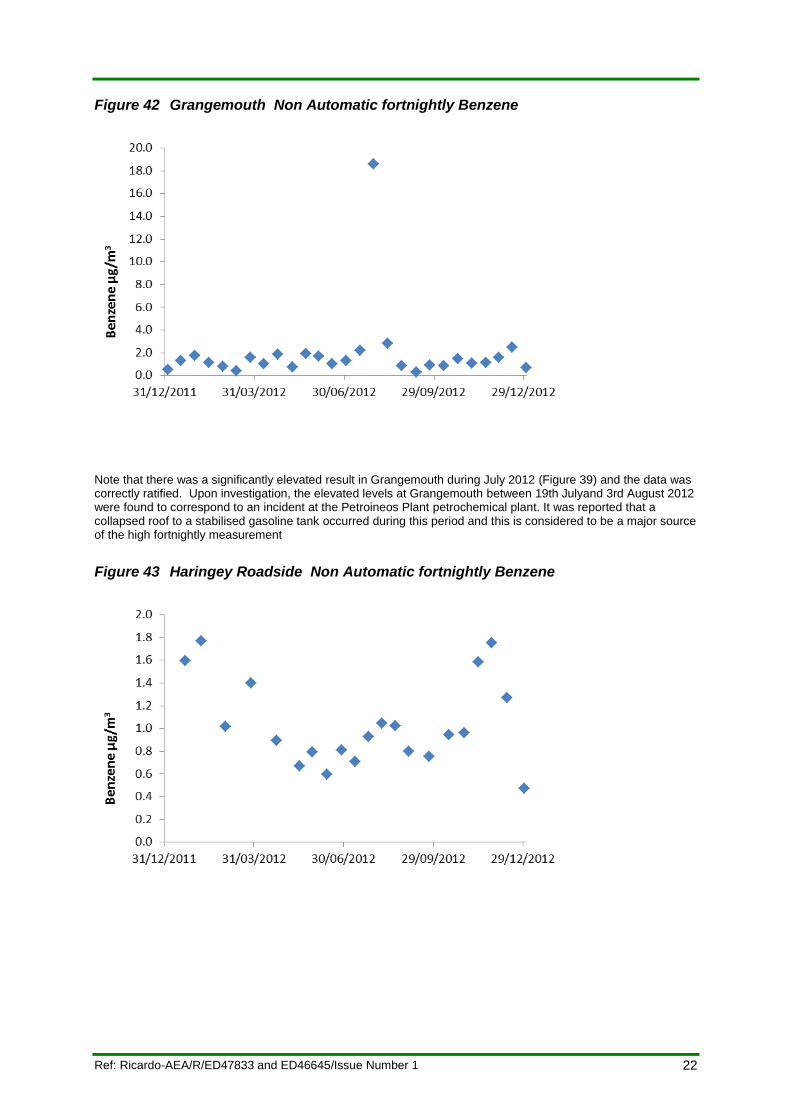
Grangemouth 2.0 19 100%
Haringey Roadside 1.0 1.8 100%
Leamington Spa 0.63 1.7 96%
Leeds Centre 0.63 1.3 100%
Leicester Centre 0.63 1.4 100%
Liverpool Speke 0.76 1.5 76%
London Bloomsbury 0.73 2.0 100%
Manchester Piccadilly 0.73 1.5 95%
Middlesbrough 1.2 3.3 96%
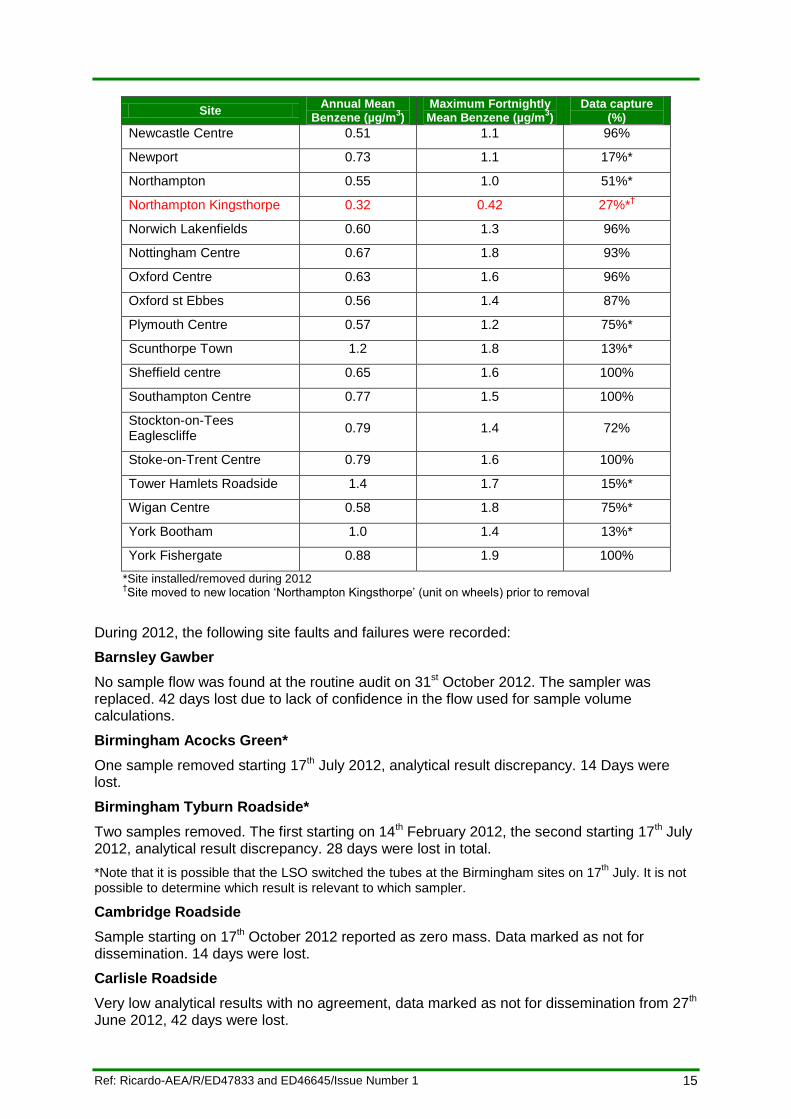
15 Ref: Ricardo-AEA/R/ED47833 and ED46645/Issue Number 1
Site Annual Mean
Benzene (µg/m3)
Maximum Fortnightly Mean Benzene (µg/m
3)
Data capture (%)
Newcastle Centre 0.51 1.1 96%
Newport 0.73 1.1 17%*
Northampton 0.55 1.0 51%*
Northampton Kingsthorpe 0.32 0.42 27%*†
Norwich Lakenfields 0.60 1.3 96%
Nottingham Centre 0.67 1.8 93%
Oxford Centre 0.63 1.6 96%
Oxford st Ebbes 0.56 1.4 87%
Plymouth Centre 0.57 1.2 75%*
Scunthorpe Town 1.2 1.8 13%*
Sheffield centre 0.65 1.6 100%
Southampton Centre 0.77 1.5 100%
Stockton-on-Tees Eaglescliffe
0.79 1.4 72%
Stoke-on-Trent Centre 0.79 1.6 100%
Tower Hamlets Roadside 1.4 1.7 15%*
Wigan Centre 0.58 1.8 75%*
York Bootham 1.0 1.4 13%*
York Fishergate 0.88 1.9 100%
*Site installed/removed during 2012 †Site moved to new location ‘Northampton Kingsthorpe’ (unit on wheels) prior to removal
During 2012, the following site faults and failures were recorded:
Barnsley Gawber
No sample flow was found at the routine audit on 31st October 2012. The sampler was replaced. 42 days lost due to lack of confidence in the flow used for sample volume calculations.
Birmingham Acocks Green*
One sample removed starting 17th July 2012, analytical result discrepancy. 14 Days were lost.
Birmingham Tyburn Roadside*
Two samples removed. The first starting on 14th February 2012, the second starting 17th July 2012, analytical result discrepancy. 28 days were lost in total.
*Note that it is possible that the LSO switched the tubes at the Birmingham sites on 17th July. It is not
possible to determine which result is relevant to which sampler.
Cambridge Roadside
Sample starting on 17th October 2012 reported as zero mass. Data marked as not for dissemination. 14 days were lost.
Carlisle Roadside
Very low analytical results with no agreement, data marked as not for dissemination from 27th June 2012, 42 days were lost.

16 Ref: Ricardo-AEA/R/ED47833 and ED46645/Issue Number 1
Chatham Centre Roadside
Low data from 5th January, Tube A and B discrepancy. Data marked as not for dissemination. 12 days were lost.
Chesterfield Roadside
Data from 25th October 2012 marked as not for dissemination following poor data, a site visit on 20th December 2012 showed a low flow error from the previous audit. 70 days were lost.
Glasgow Kerbside
Power cut resulting in loss of data from 26th October 2012. 28 Days were lost.
Leamington Spa
Data from 26th January 2012 removed, large discrepancy between tube results. 14 days lost.
Liverpool Speke
Data from 4th January large discrepancy between tube results. 15 days lost. Data from 15th February large discrepancy between tube results. 15 days lost. Sampler stuck on Tube A from 13th March, sampler replaced. 70 Days lost.
Manchester Piccadilly
Sampler removed on 13th December 2011, new sampler not installed until 11th January 2012. 11.5 Days lost. It had not been possible to replace the sampler before Christmans/New Year.
Middlesbrough
An analytical discrepancy between Tube A and B, the sample beginning 17th April 2012 was removed, 14 days data lost.
Newcastle Centre
Data for the sample beginning 8th February 2012 was removed, Tube mass unusually low, considered erroneous, 15 days lost.
Norwich Lakenfields
An analytical discrepancy between Tube A and B for the sample starting 18th April 2012, 14 days was lost.
Nottingham Centre
Removed data relevant to the sample from 28th November 2012. Discrepant analytical result and unusually high, considered erroneous. 15 days lost.
Oxford Centre Roadside
Data for 15th February 2012 onwards was lost, sampling tubes lost in the post from site.
Oxford St Ebbes
Data for 15th February 2012 onwards was lost, sampling tubes lost in the post from site. Data on 13th November 2012 removed, sample tube results unusually low, especially for a longer sampling period, this was considered erroneous. 21 days was lost.
Stockton-on-Tees Eaglescliffe
Data from 24th May 2012 removed, sampler partially stuck on one tube. Sample volume cannot be verified, 103 days were lost.
17 Ref: Ricardo-AEA/R/ED47833 and ED46645/Issue Number 1
3.1.1 Automatic Hydrocarbon Network site Statistics
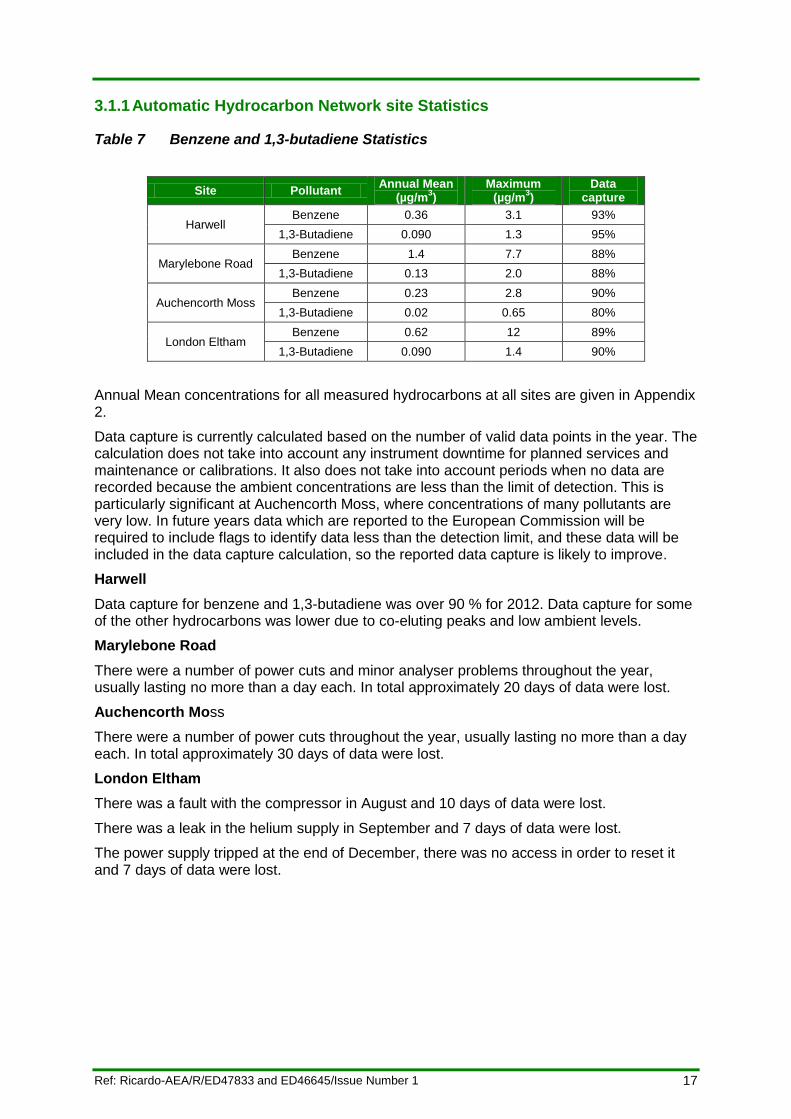
Table 7 Benzene and 1,3-butadiene Statistics
Site Pollutant Annual Mean
(µg/m3)
Maximum (µg/m
3)
Data capture
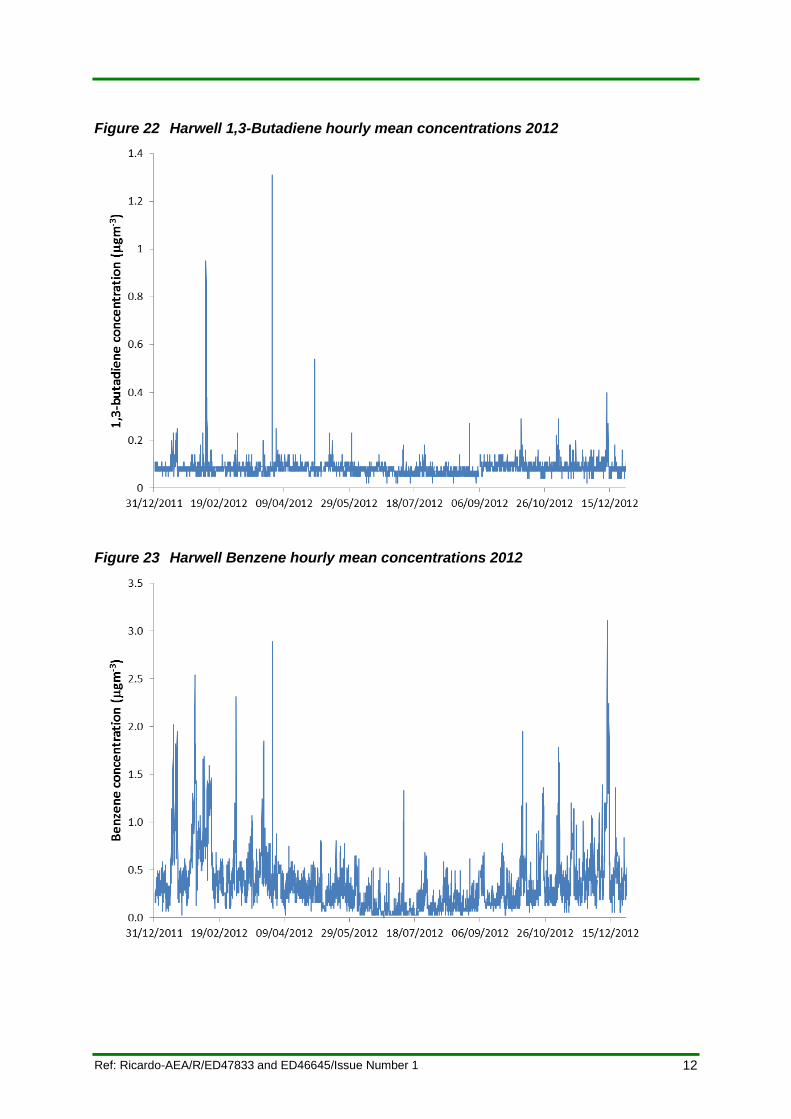
Harwell Benzene 0.36 3.1 93%
1,3-Butadiene 0.090 1.3 95%
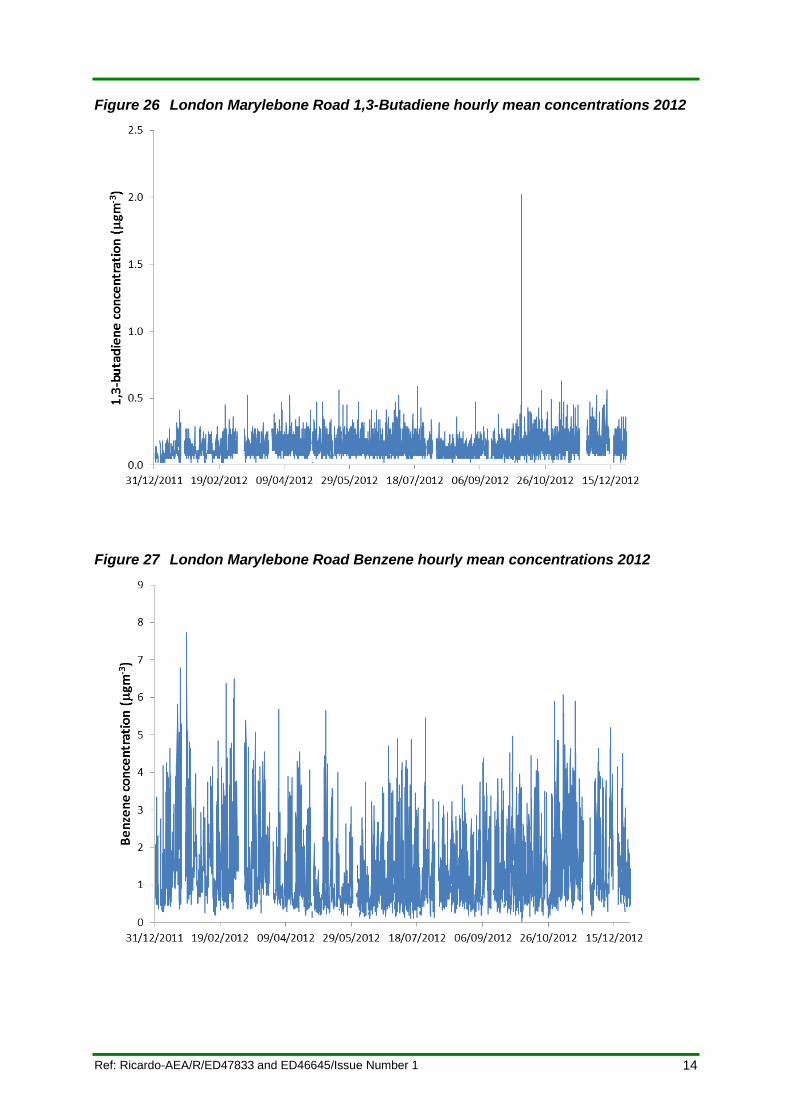
Marylebone Road Benzene 1.4 7.7 88%
1,3-Butadiene 0.13 2.0 88%
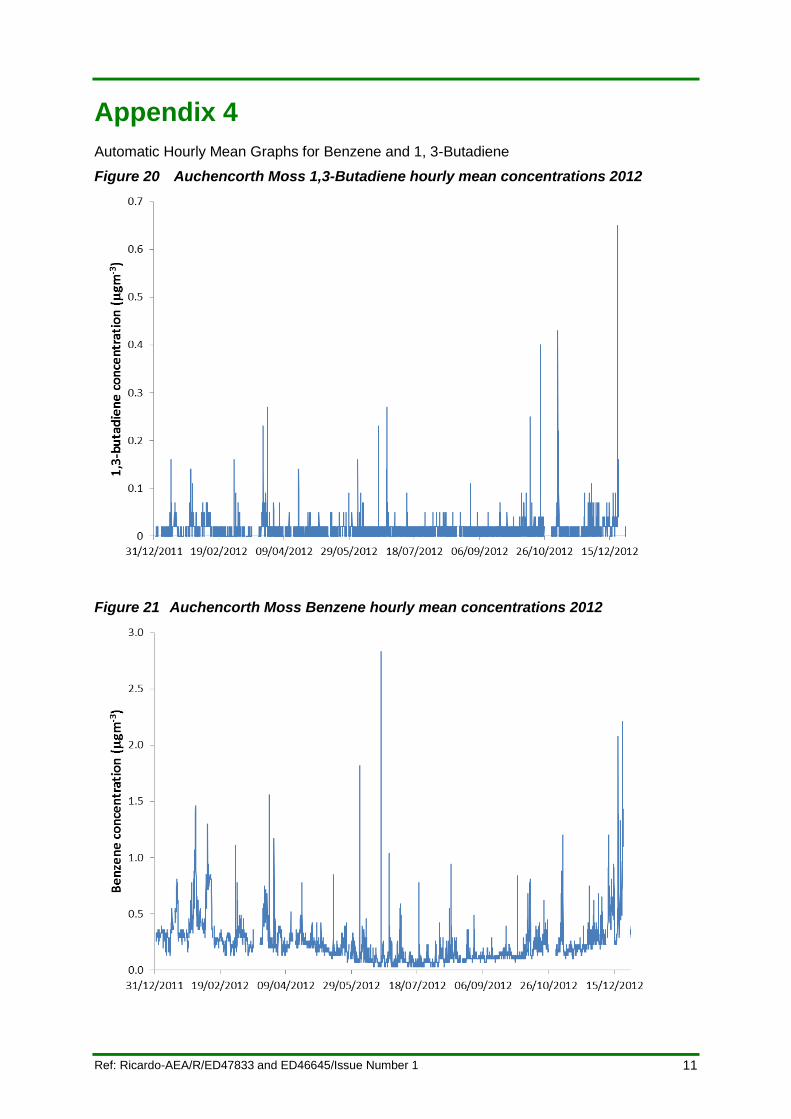
Auchencorth Moss Benzene 0.23 2.8 90%
1,3-Butadiene 0.02 0.65 80%
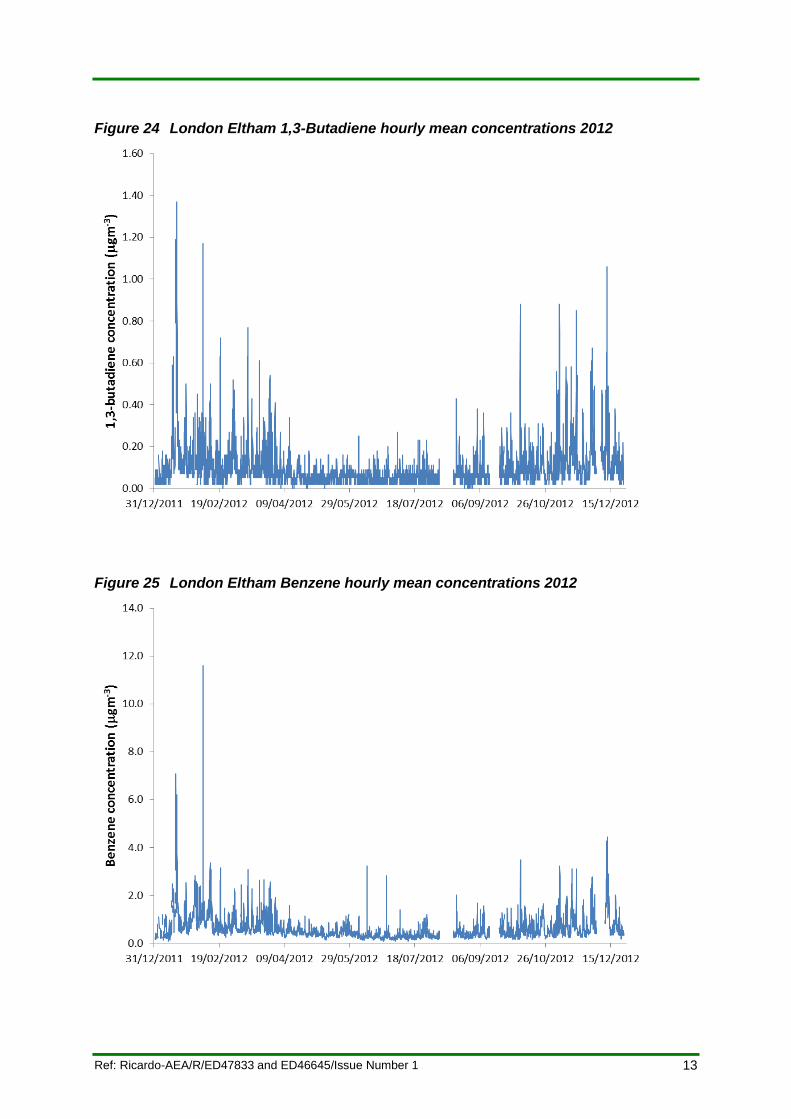
London Eltham Benzene 0.62 12 89%
1,3-Butadiene 0.090 1.4 90%
Annual Mean concentrations for all measured hydrocarbons at all sites are given in Appendix 2.
Data capture is currently calculated based on the number of valid data points in the year. The calculation does not take into account any instrument downtime for planned services and maintenance or calibrations. It also does not take into account periods when no data are recorded because the ambient concentrations are less than the limit of detection. This is particularly significant at Auchencorth Moss, where concentrations of many pollutants are very low. In future years data which are reported to the European Commission will be required to include flags to identify data less than the detection limit, and these data will be included in the data capture calculation, so the reported data capture is likely to improve.
Harwell
Data capture for benzene and 1,3-butadiene was over 90 % for 2012. Data capture for some of the other hydrocarbons was lower due to co-eluting peaks and low ambient levels.
Marylebone Road
There were a number of power cuts and minor analyser problems throughout the year, usually lasting no more than a day each. In total approximately 20 days of data were lost.
Auchencorth Moss
There were a number of power cuts throughout the year, usually lasting no more than a day each. In total approximately 30 days of data were lost.
London Eltham
There was a fault with the compressor in August and 10 days of data were lost.
There was a leak in the helium supply in September and 7 days of data were lost.
The power supply tripped at the end of December, there was no access in order to reset it and 7 days of data were lost.
18
Ref: Ricardo-AEA/R/ED47833 and ED46645/Issue Number 1
3.2 Concentration trends
3.2.1 Trends in 2012
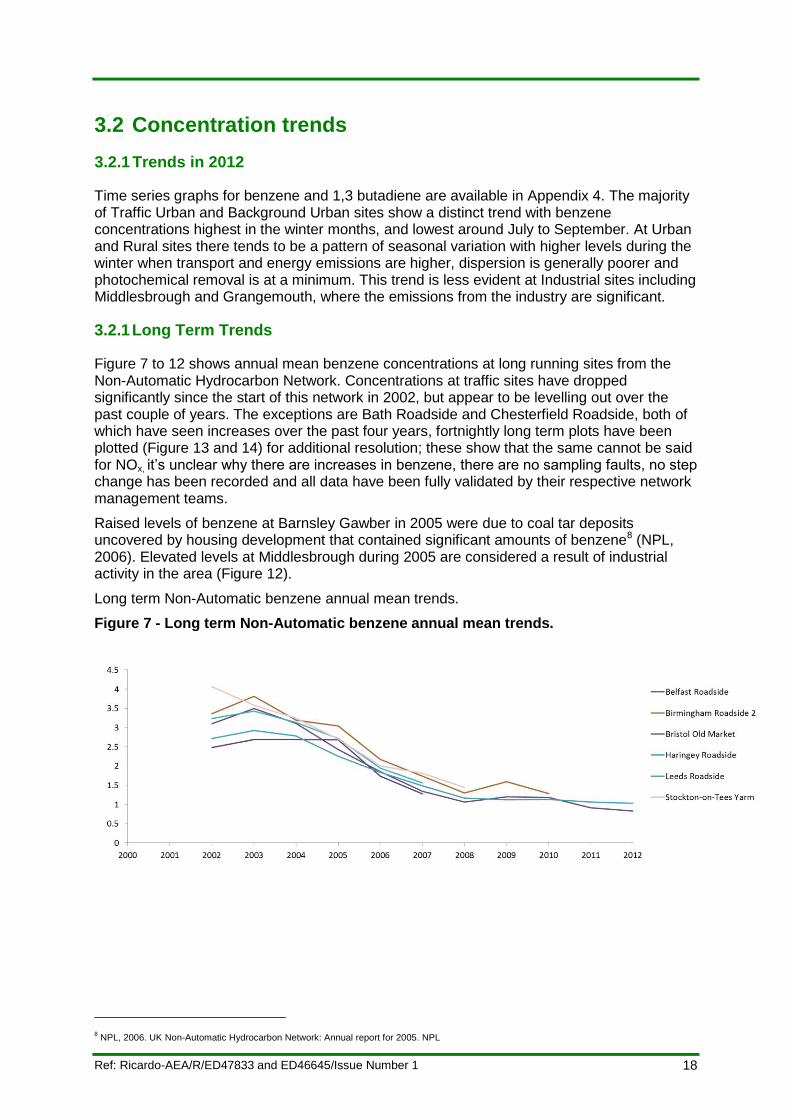
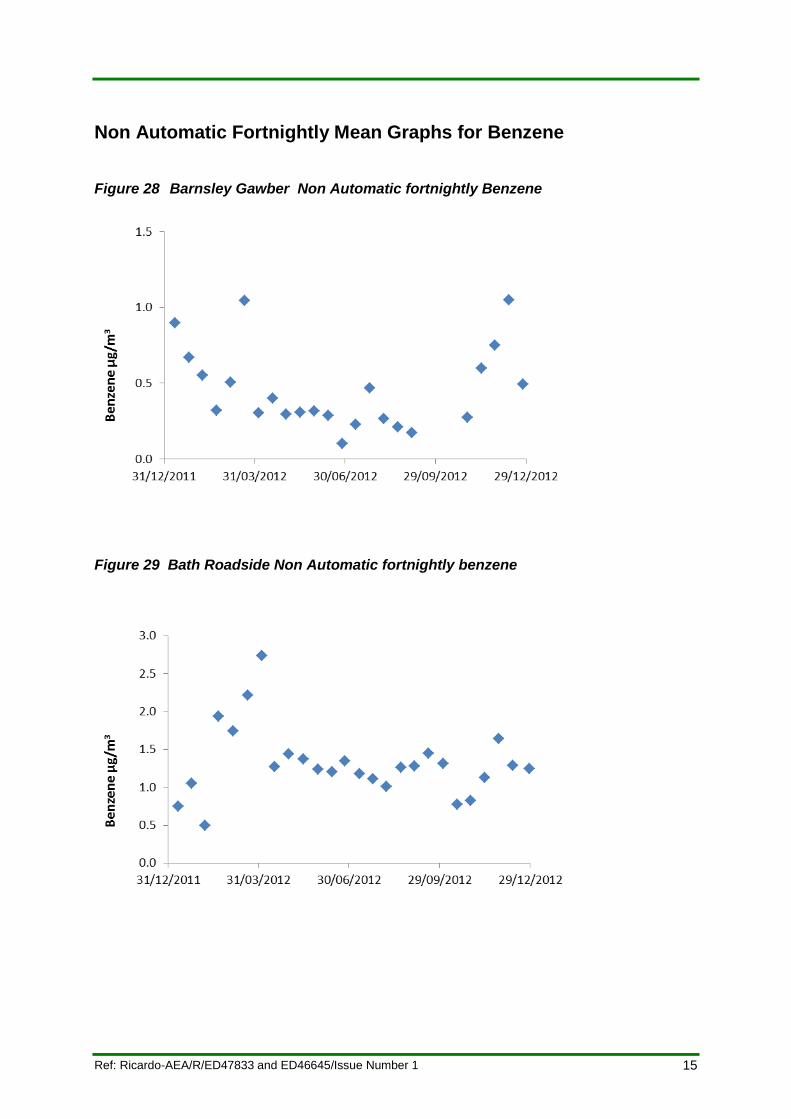
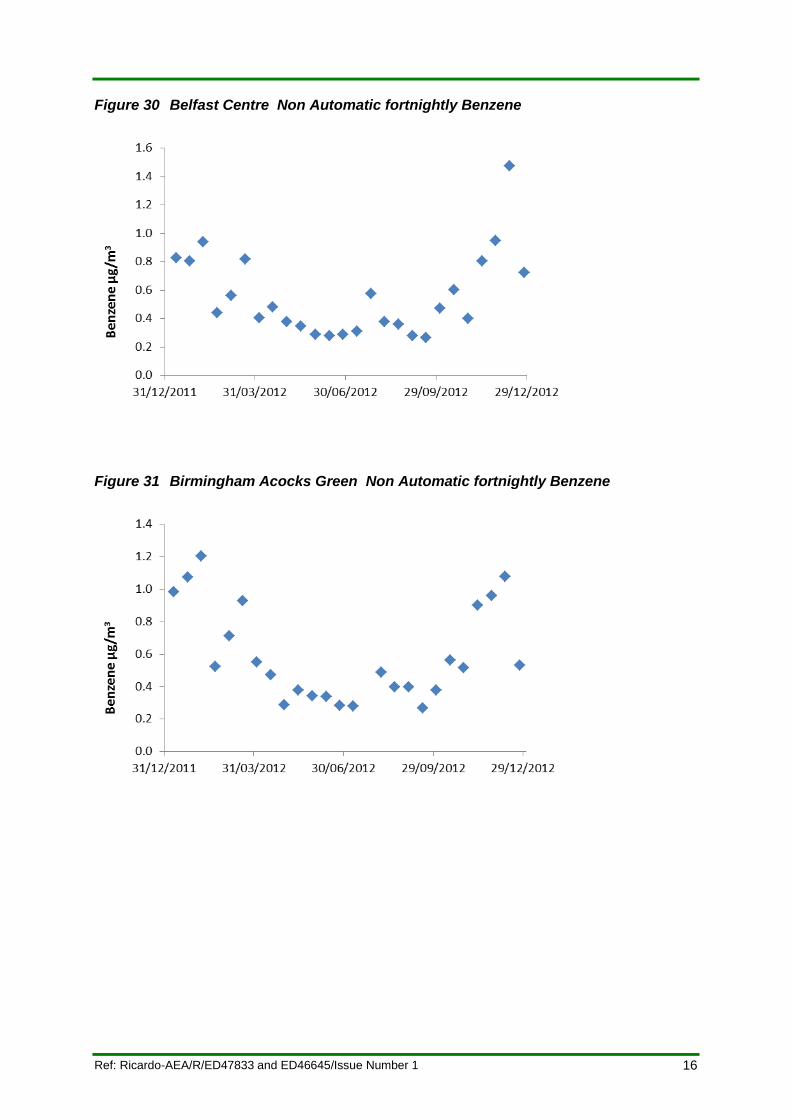
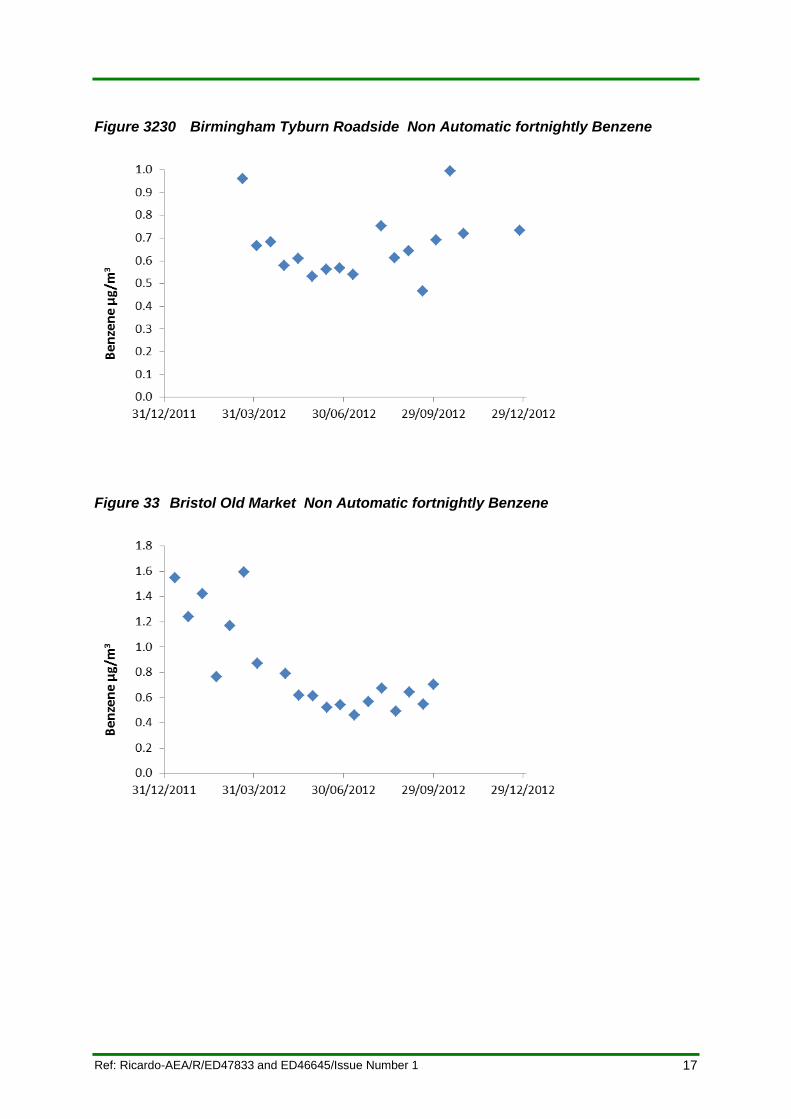
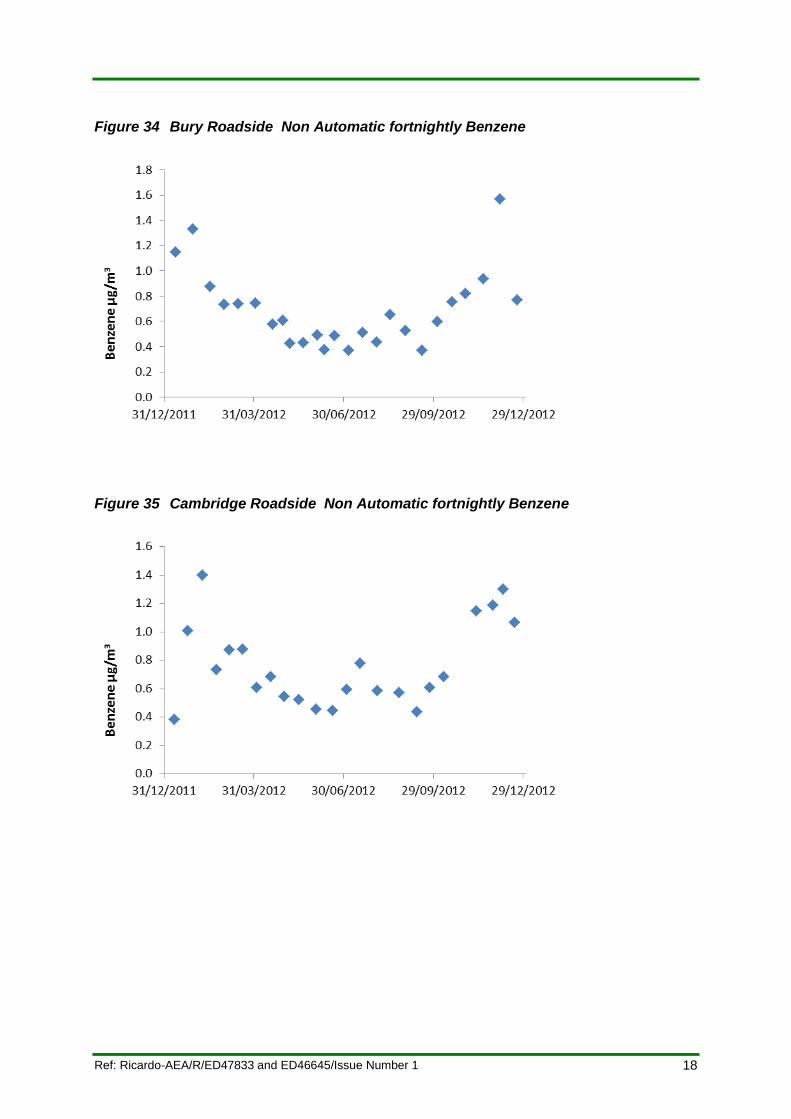
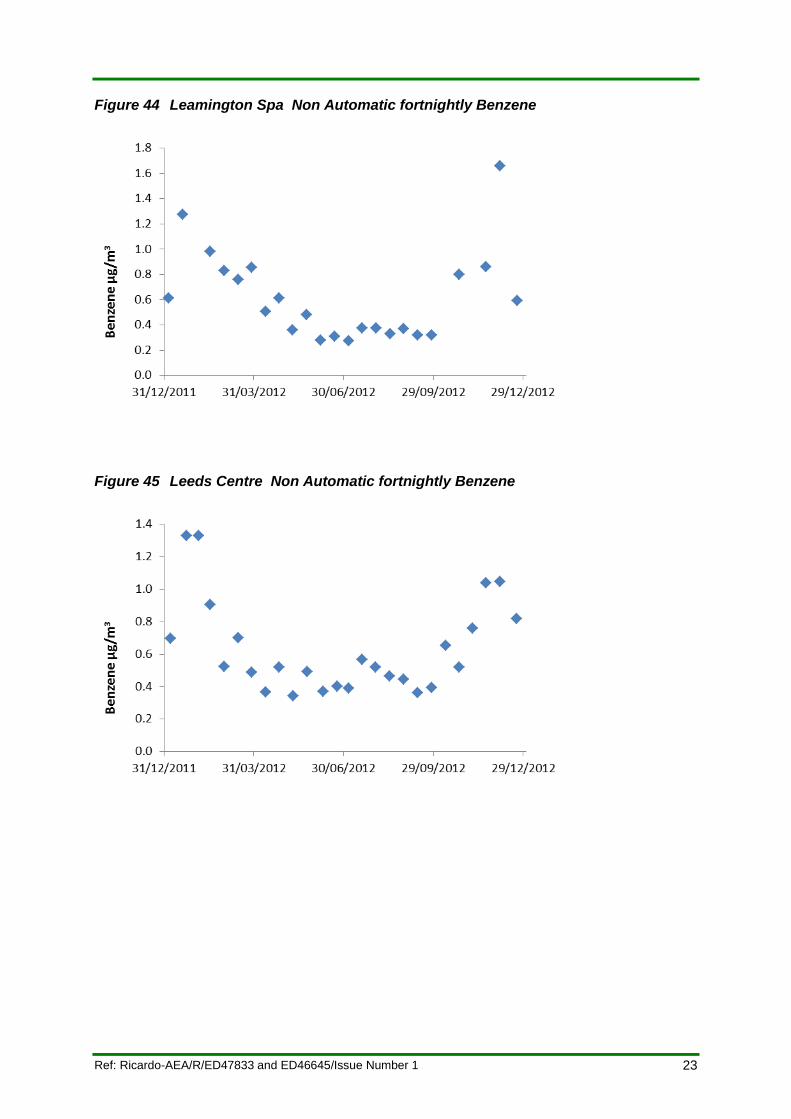
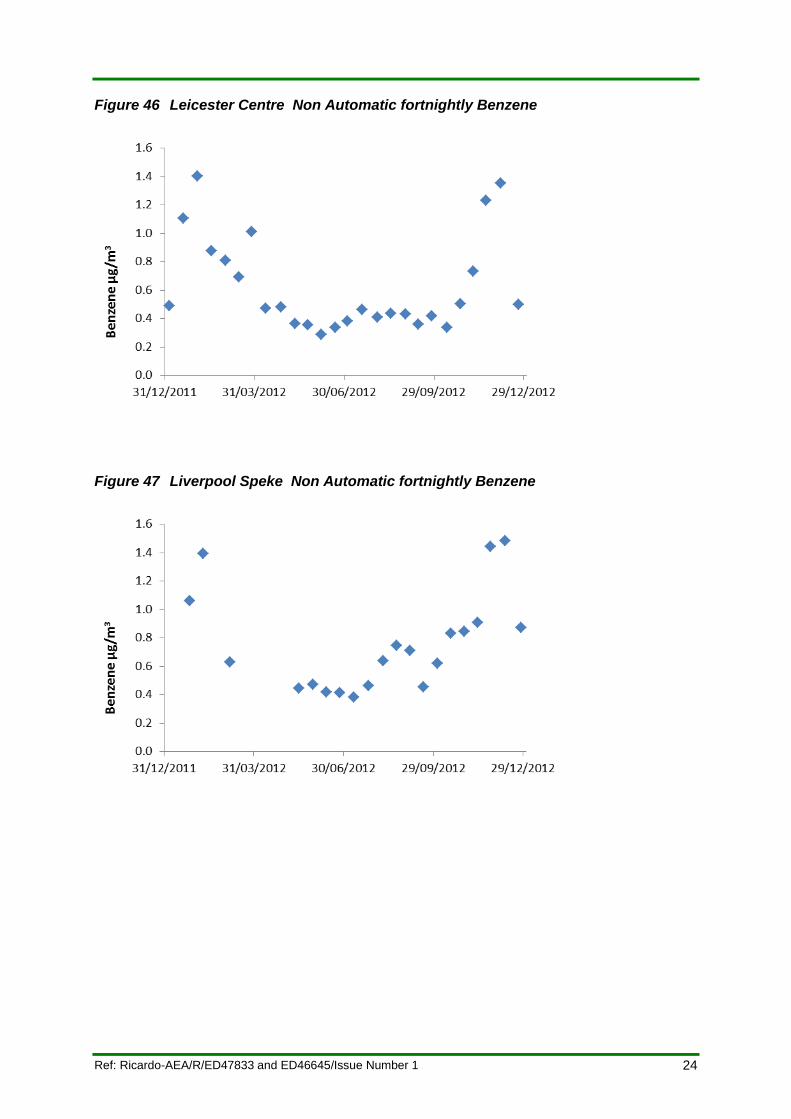
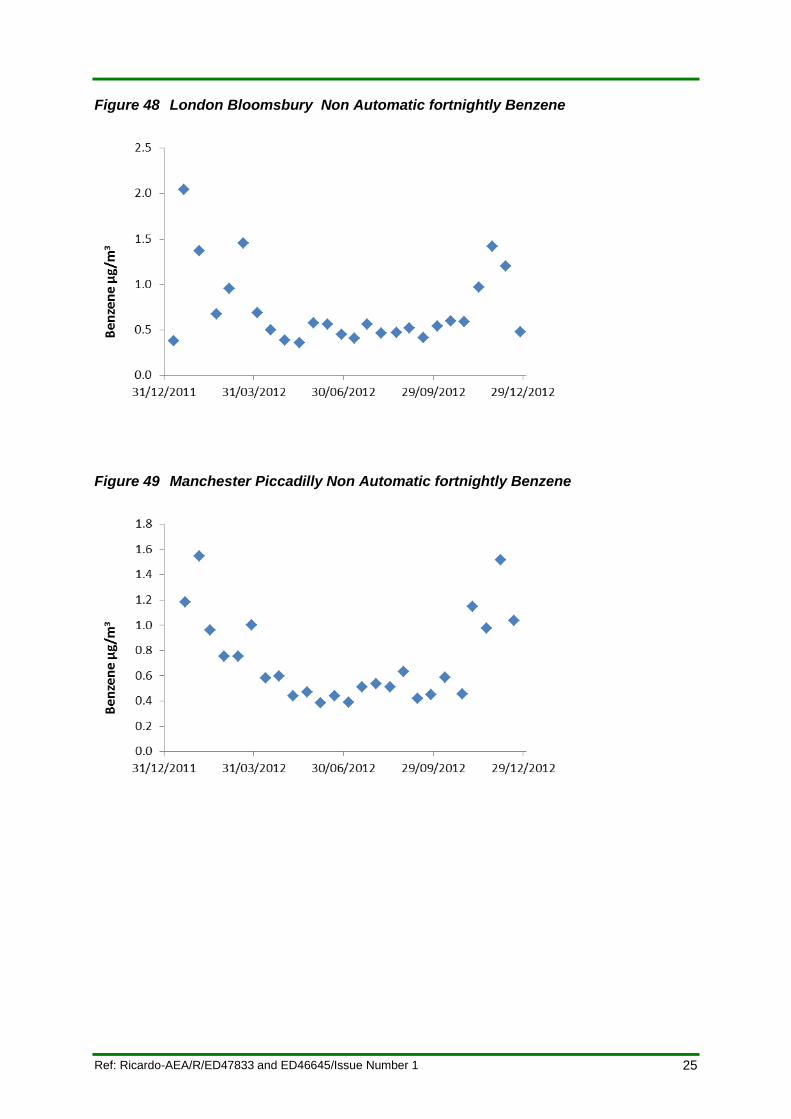
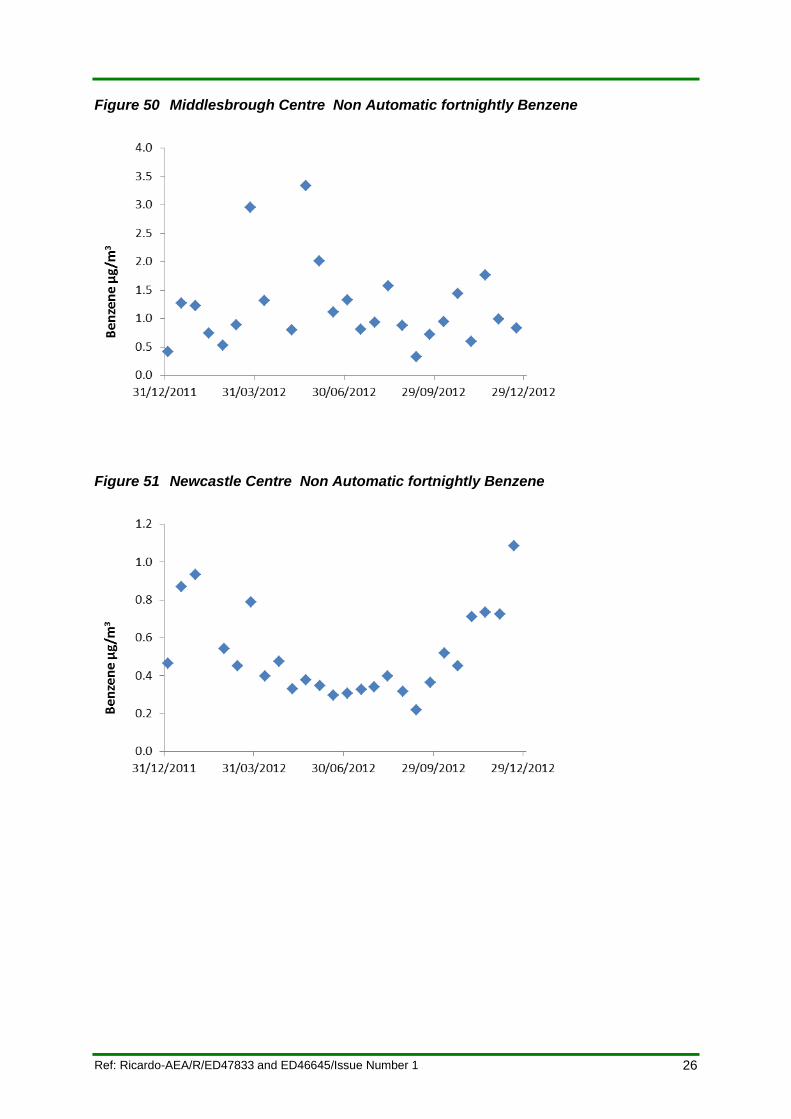
Time series graphs for benzene and 1,3 butadiene are available in Appendix 4. The majority of Traffic Urban and Background Urban sites show a distinct trend with benzene concentrations highest in the winter months, and lowest around July to September. At Urban and Rural sites there tends to be a pattern of seasonal variation with higher levels during the winter when transport and energy emissions are higher, dispersion is generally poorer and photochemical removal is at a minimum. This trend is less evident at Industrial sites including Middlesbrough and Grangemouth, where the emissions from the industry are significant.
3.2.1 Long Term Trends
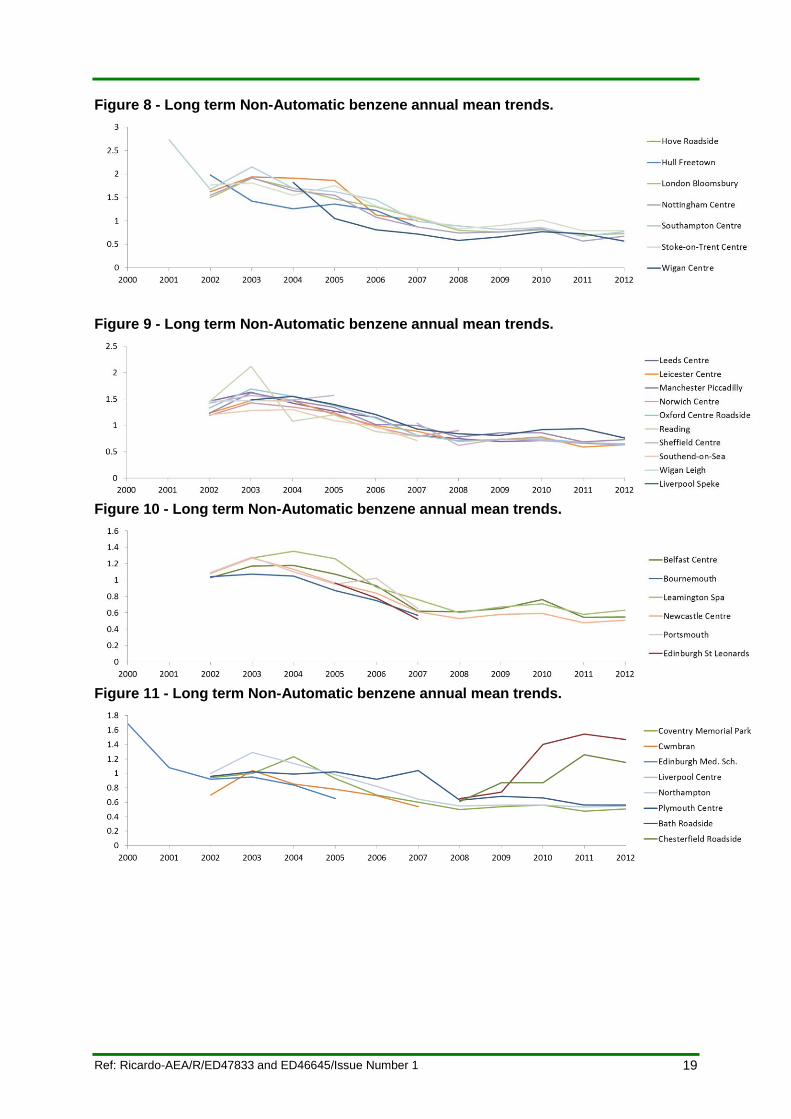
Figure 7 to 12 shows annual mean benzene concentrations at long running sites from the Non-Automatic Hydrocarbon Network. Concentrations at traffic sites have dropped significantly since the start of this network in 2002, but appear to be levelling out over the past couple of years. The exceptions are Bath Roadside and Chesterfield Roadside, both of which have seen increases over the past four years, fortnightly long term plots have been plotted (Figure 13 and 14) for additional resolution; these show that the same cannot be said for NOx, it’s unclear why there are increases in benzene, there are no sampling faults, no step change has been recorded and all data have been fully validated by their respective network management teams.
Raised levels of benzene at Barnsley Gawber in 2005 were due to coal tar deposits uncovered by housing development that contained significant amounts of benzene8 (NPL, 2006). Elevated levels at Middlesbrough during 2005 are considered a result of industrial activity in the area (Figure 12).
Long term Non-Automatic benzene annual mean trends.
Figure 7 - Long term Non-Automatic benzene annual mean trends.
8 NPL, 2006. UK Non-Automatic Hydrocarbon Network: Annual report for 2005. NPL
19
Ref: Ricardo-AEA/R/ED47833 and ED46645/Issue Number 1
Figure 8 - Long term Non-Automatic benzene annual mean trends.
Figure 9 - Long term Non-Automatic benzene annual mean trends.
Figure 10 - Long term Non-Automatic benzene annual mean trends.
Figure 11 - Long term Non-Automatic benzene annual mean trends.

20
Ref: Ricardo-AEA/R/ED47833 and ED46645/Issue Number 1
Figure 12 - Long term Non-Automatic benzene annual mean trends.
Figure 13 - Bath Roadside long term fortnightly measurements vs AURN NOx
Figure 14 - Chesterfield Roadside long term fortnightly measurements vs AURN NOx
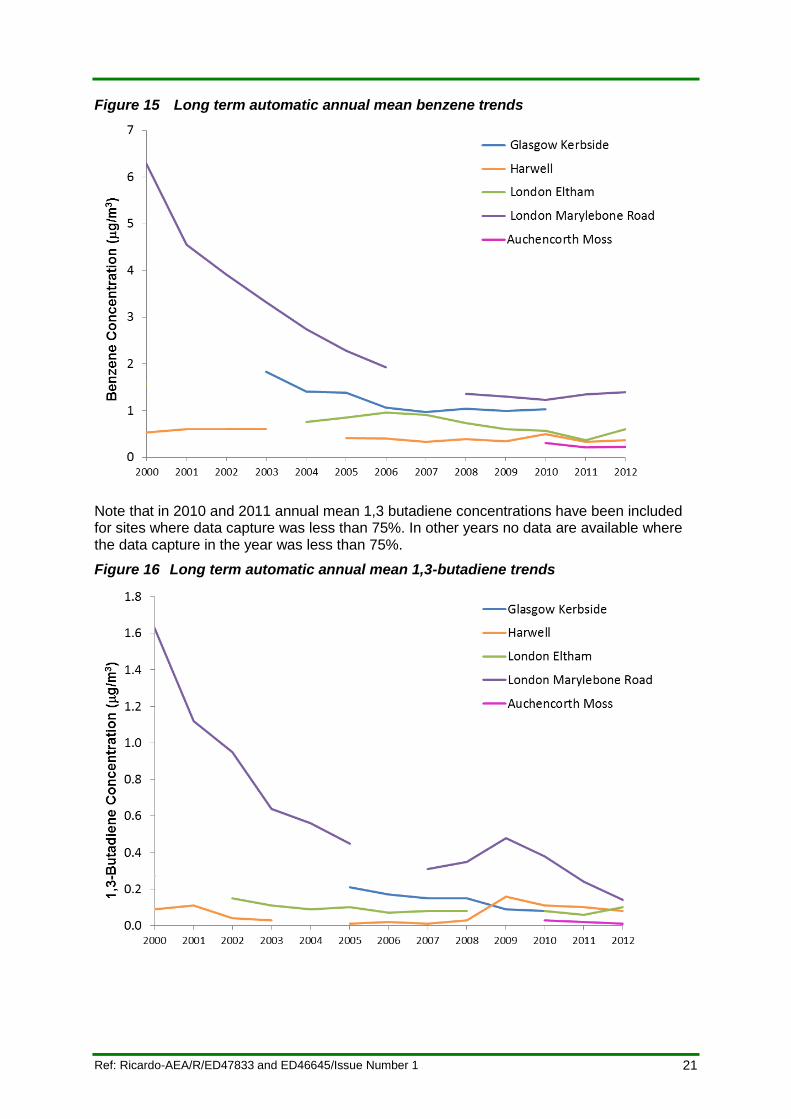
Figure 15 and 16 show the long-term trends of the annual mean concentrations of benzene and 1,3-butadiene at the four sites with long running datasets within the Automatic Hydrocarbon Network, and Auchencorth Moss. Note that in 2010 and 2011 annual mean benzene concentrations have been included for sites where data capture was less than 75%. In other years no data are available where the data capture in the year was less than 75%.
21
Ref: Ricardo-AEA/R/ED47833 and ED46645/Issue Number 1
Figure 15 Long term automatic annual mean benzene trends
Note that in 2010 and 2011 annual mean 1,3 butadiene concentrations have been included for sites where data capture was less than 75%. In other years no data are available where the data capture in the year was less than 75%.
Figure 16 Long term automatic annual mean 1,3-butadiene trends
22
Ref: Ricardo-AEA/R/ED47833 and ED46645/Issue Number 1
4 Data Quality
4.1 Intercomparisons
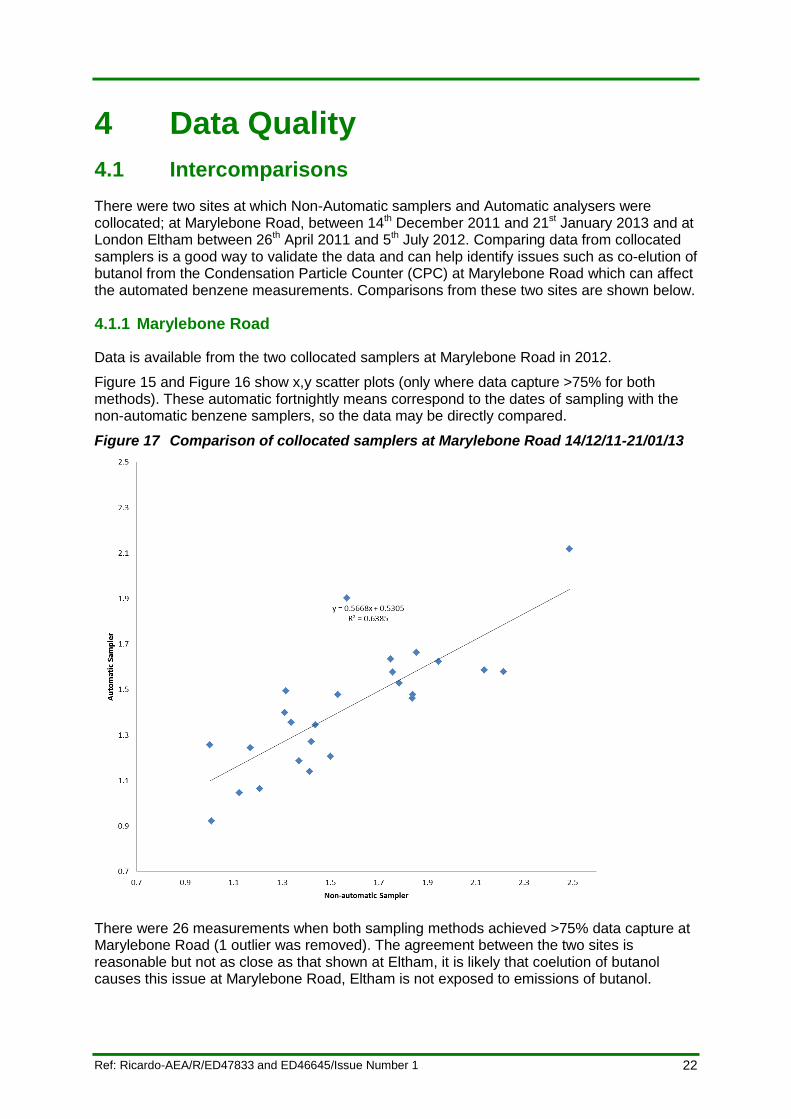
There were two sites at which Non-Automatic samplers and Automatic analysers were collocated; at Marylebone Road, between 14th December 2011 and 21st January 2013 and at London Eltham between 26th April 2011 and 5th July 2012. Comparing data from collocated samplers is a good way to validate the data and can help identify issues such as co-elution of butanol from the Condensation Particle Counter (CPC) at Marylebone Road which can affect the automated benzene measurements. Comparisons from these two sites are shown below.
4.1.1 Marylebone Road
Data is available from the two collocated samplers at Marylebone Road in 2012.
Figure 15 and Figure 16 show x,y scatter plots (only where data capture >75% for both methods). These automatic fortnightly means correspond to the dates of sampling with the non-automatic benzene samplers, so the data may be directly compared.
Figure 17 Comparison of collocated samplers at Marylebone Road 14/12/11-21/01/13
There were 26 measurements when both sampling methods achieved >75% data capture at Marylebone Road (1 outlier was removed). The agreement between the two sites is reasonable but not as close as that shown at Eltham, it is likely that coelution of butanol causes this issue at Marylebone Road, Eltham is not exposed to emissions of butanol.
23
Ref: Ricardo-AEA/R/ED47833 and ED46645/Issue Number 1
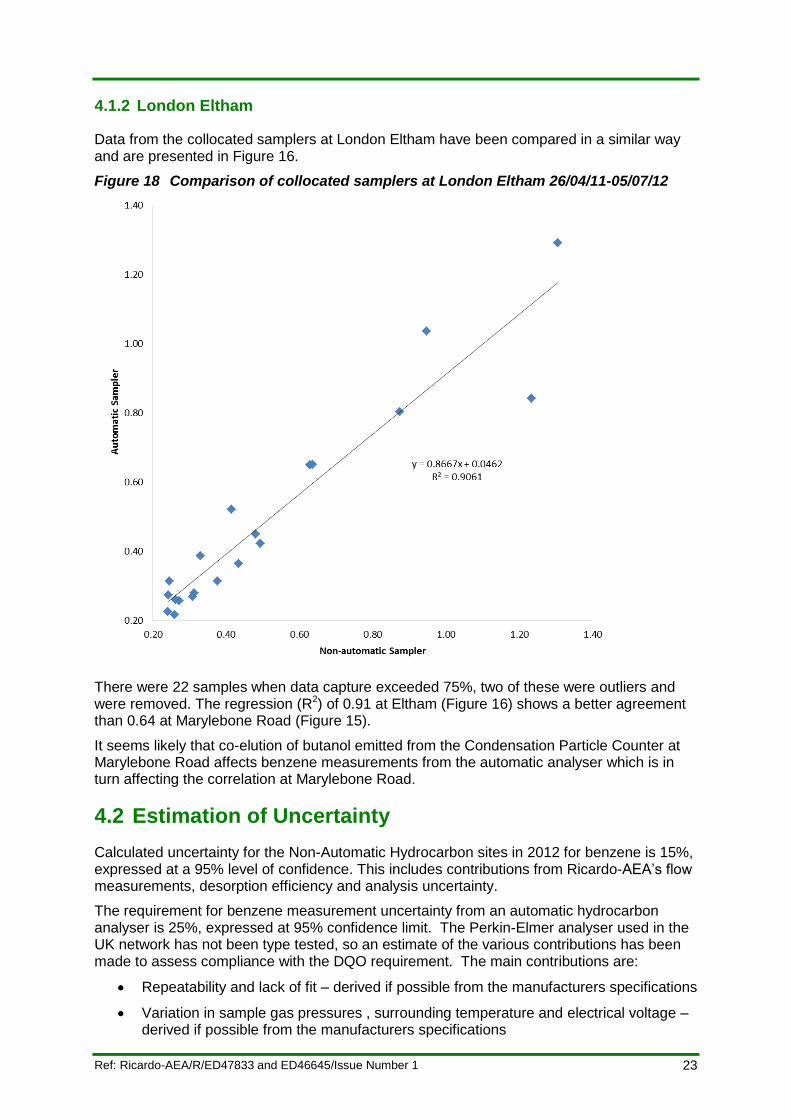
4.1.2 London Eltham
Data from the collocated samplers at London Eltham have been compared in a similar way and are presented in Figure 16.
Figure 18 Comparison of collocated samplers at London Eltham 26/04/11-05/07/12
There were 22 samples when data capture exceeded 75%, two of these were outliers and were removed. The regression (R2) of 0.91 at Eltham (Figure 16) shows a better agreement than 0.64 at Marylebone Road (Figure 15).
It seems likely that co-elution of butanol emitted from the Condensation Particle Counter at Marylebone Road affects benzene measurements from the automatic analyser which is in turn affecting the correlation at Marylebone Road.
4.2 Estimation of Uncertainty
Calculated uncertainty for the Non-Automatic Hydrocarbon sites in 2012 for benzene is 15%, expressed at a 95% level of confidence. This includes contributions from Ricardo-AEA’s flow measurements, desorption efficiency and analysis uncertainty.
The requirement for benzene measurement uncertainty from an automatic hydrocarbon analyser is 25%, expressed at 95% confidence limit. The Perkin-Elmer analyser used in the UK network has not been type tested, so an estimate of the various contributions has been made to assess compliance with the DQO requirement. The main contributions are:
Repeatability and lack of fit – derived if possible from the manufacturers specifications
Variation in sample gas pressures , surrounding temperature and electrical voltage – derived if possible from the manufacturers specifications
24
Ref: Ricardo-AEA/R/ED47833 and ED46645/Issue Number 1
Interference from ozone – derived if possible from the manufacturers specifications
Memory effects – derived if possible from the manufacturers specifications
Differences between the sample and calibration port – these differences are negligible, the sample and calibration port are in contact with 90% of the same valve. Removing the calibration cylinder to evaluate this will disturb the system and affect sample measurements for some considerable time afterwards.
Uncertainty in calibration gas – from NPL cylinder certificate
Reproducibility under field conditions – this could be estimated from the manufacturers specifications
Long term drift – corrections are made such that this is not applicable to the expanded uncertainty.
By far the largest components in the uncertainty budget are lack of fit and calibration gas uncertainty. In the absence of data from type testing, the maximum permissible values stated in the EN Standard have been used. Using these values and the known values from the calibration cylinder the uncertainty budget has been calculated. The uncertainty of benzene measurements using a Perkin-Elmer analyser is estimated to be less than 24%.
Reliability and intercomparability of UK benzene measurements is regularly assessed through international intercomparisons. (Quote the last ACTRIS result Harwell +6.5%, AM -7.6% from reference value). R-AEA will be attending the next intercomparison at JRC in November 2013.
The Standard Method for measurement of benzene with an automatic analyser is in the process of review by CEN Working Group 12.
4.3 Standard Methods
European Standard EN14662-3:2005 is the Ambient Air Quality Standard method for the measurements of benzene concentrations – Part 3: Automated pumped sampling with in-situ gas chromatography. This Standard is for the determination of benzene in ambient air for the purpose of comparing measurement results with annual mean limit values. It describes guidelines for measurements with automated gas chromatographs, between 0 and 50 µg/m3. Measurements undertaken by the Automatic Hydrocarbon Network are carried out in accordance with this Standard.
European Standard EN14662-1:2005 is the Ambient Air Quality Standard method for measurement of benzene concentrations – Part 1: Pumped sampling followed by thermal desorption and gas chromatography. This Standard gives general guidance for the sampling and analysis of benzene in air by pumped sampling, thermal desorption and capillary gas chromatography. The pumped sampler was developed by NPL in compliance with this standard. Ricardo-AEA contract Environmental Scientifics Groups (ESG) to analyse the samples in accordance with this standard.
There is no standard method for aldehyde measurements. The system used has been constructed broadly in-line with the benzene method in EN14662-1:2005 and using the relevant analysis method suggested by the DNPH tube manufacturers (Waters Inc.)9. This method follows the guidance of the EMEP manual for aldehyde measurements10. The flow rate and sample time have been adjusted to achieve a volume within the upper and lower limit of the DNPH tube limits as specified by the manufacturer.
9 Sep-Pak XPoSure Aldehyde Sampler Care and Use manual http://www.waters.com/webassets/cms/support/docs/wat047204.pdf
10 Nilu, 2001. EMEP Co-operative Programme for Monitoring and Evaluation of the Long-range Transmission of Air Pollutants in Europe EMEP
manual for sampling and chemical analysis
25
Ref: Ricardo-AEA/R/ED47833 and ED46645/Issue Number 1
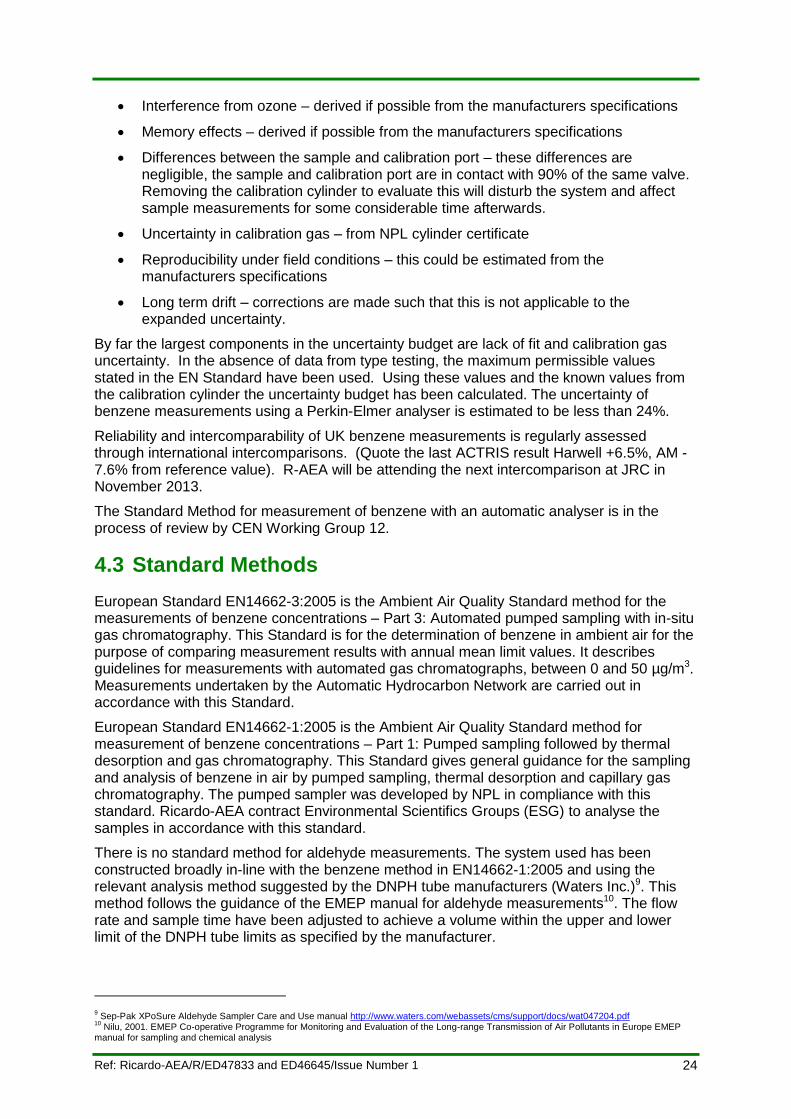
4.4 Limit of Detection
The Limit of Detection for the mass of benzene on a desorption tube from the Non-Automatic Hydrocarbon Network is approximately 2ng. This is equivalent to about 0.02 µg/m3from a 14 day sample period.
The Limit of Detection for each species measured by the Perkin Elmer Ozone Precursor Analysers used by the Automatic Hydrocarbon Network is shown in Table 8.
Table 8 Automatic Analyser Limits of Detection
Compound
Limit of Detection (µg/m3)
Compound
Limit of Detection (µg/m3)
Ethane 0.10 2-Methylpentane 0.04
Ethene 0.01 Isoprene 0.03
Propane 0.02 n-Hexane 0.04
Propene 0.02 Benzene 0.03
Ethyne 0.01 i-Octane 0.05
i-Butane 0.02 n-Heptane 0.04
n-Butane 0.02 n-Octane 0.05
trans-2-Butene 0.02 Toluene 0.04
1-Butene 0.02 Ethylbenzene 0.04
cis-2-Butene 0.02 (m+p)-Xylene 0.04
i-Pentane 0.03 o-Xylene 0.04
n-Pentane 0.03 1,3,5-Trimethylbenzene 0.05
1,3-Butadiene 0.02 1,2,4-Trimethylbenzene 0.05
trans-2-Pentene 0.03 1,2,3-Trimethylbenzene 0.05
1-Pentene 0.03
26
Ref: Ricardo-AEA/R/ED47833 and ED46645/Issue Number 1
5 Developments and Recommendations
5.1 EN14662-3:2005
European Standard EN14662-3:2005 is currently under review by Working Group 12, to bring it in line with the other gaseous pollutants’ standards. R-AEA are involved in the review through a representative on the Working Group, and are providing appropriate contributions and feedback to Defra and the Devolved Administrations regarding the potential implications for the Automatic Hydrocarbon Network.
5.2 Acetaldehyde and Formaldehyde
In 2011 the UK Air Quality Expert Group (AQEG) published an advice note on road transport biofuels and their impact on UK air quality for Defra and the Devolved Administrations. The AQEG note can be found at
http://uk-air.defra.gov.uk/documents/110322_AQEG_Biofuels_advice_note.pdf
The note accepts that results from research studies on the effects of biofuels on vehicle emission are inconclusive and show a high degree of variability, but concludes that any increased use of bioethanol and biodiesel are likely to significantly increase acetaldehyde and formaldehyde emissions. The note goes on to say that ‘the likely continued growth in biofuel consumption in the UK means that evidence for any atmospheric change in pollutant concentrations should be monitored in parallel with direct measurements of biofuel emissions from road vehicles’.
Starting in 2012, R-AEA started a pilot study monitoring for acetaldehyde and formaldehyde at a small number of roadside and background sites. This will help the UK to prepare for potential legislative change in the future and will start a dataset useful for long term trend analysis.
Use of biofuels in the UK
Biodiesel is a generic term for a product which has variable chemical composition, whereas bioethanol is a specific chemical. Over the past 2-3 years bioethanol and biodiesel consumption has grown, driven by domestic targets and EU Directives. The UK still uses relatively small amounts of low strength bioethanol and biodiesel, but consumption is expected to continue to increase over the next decade as a result of the EU Directive 2009/28/EC which raised the target set for the share of biofuels as a % of energy content by 2020 to 10%.
Most bioethanol in the UK is likely to be consumed as weak (<5%) blends in fossil fuel petrol sold at regular filling stations. Research by Ricardo-AEA, undertaken for the Department for Transport in 2011, indicated that in 2008 176 ktonnes of bioethanol were used in road transport. In 2009 361 ktonnes were used (compared to over 900 ktonnes of biodiesel used each year). Data from HM Revenue and Customs, used for the National Atmospheric Emissions Inventory (NAEI), indicate that bioethanol consumption in the UK was about 3% of total petrol consumption in 2010.
Currently 100% of the UK fleet of passenger cars and light commercial vehicles (both new and older models) can use low ethanol blends, up to 5%. Only 84% of the current fleet can run on 10% bioethanol and less than 1% of the fleet can operate with a high 85% bioethanol/petrol blend. The uptake of high concentration blends of bioethanol (E85) may
27
Ref: Ricardo-AEA/R/ED47833 and ED46645/Issue Number 1
increase in future if the fuel supply infrastructure develops and the population of vehicles capable of running on this fuel increases.
Bioethanol is mainly added to petrol at refineries and main fuel distribution centres so there is unlikely to be any regional consumption hot spot, rather it is used by all petrol vehicles without motorists being aware. High strength bioethanol (E85) is a niche fuel which can only be used by petrol vehicles that have undergone a conversion, engine re-tuning or flexi-fuelled vehicles able to run on regular unleaded or E85. There may be some dedicated fleets using this fuel in some areas, but these are not believed to be common in the UK.
Effect of bioethanol on acetaldehyde and formaldehyde
The Air Quality Expert Group’s report on Road Transport Biofuels (2011) suggests that overall, low strength blends of bioethanol reduce or have little effect on emissions of air quality pollutants. But, even at low strength blends of bioethanol, literature studies show that consumption of bioethanol leads to the significant increase in acetaldehyde and formaldehyde emissions from vehicles compared to petrol consumption. Other VOCs may be increased if a high proportion of bioethanol is used due to its effect on increasing fuel volatility.
Geography of bioethanol consumption
In the UK, consumption is likely to be well dispersed across the country, with no particular hot spots. This is likely to continue, although there may be localised use of some biofuels by captive fleets in areas close to where they are produced, but it is unlikely that consumption would be high enough to observe any changes in ambient concentrations. Currently there is very limited information relating to UK airborne aldehyde emissions. This study will provide us with the basis to monitor aldehyde trends over time such that comparisons can be made when transport fuels contain higher quantities of biofuel in the future.
The UK NAEI uses HM Revenue and Customs (HMRC) national statistics on the consumption of biofuels in the UK. The HMRC produces monthly national statistics on the volume of bioethanol and biodiesel released for consumption. However, this information does not split the bioethanol consumption by region. For the report, ‘Improving the Greenhouse Gas Inventories for Road Transport in Scotland, Wales and Northern Ireland’ (Murrells et al. 2011), Devolved Administration contacts and biofuel experts within AEA were consulted regarding data on regional biofuel consumption; however, this information does not seem to be available. Information on the location of the major biofuel producers in the UK is available, however, this does not necessarily represent where the biofuels are consumed. Any variation will also only be a matter of whether the fuel sold is a 0% blend (no bioethanol in petrol) or 5% bioethanol blend and any differences between filling stations in this respect are likely to be random, not with any regional bias. Most large scale biofuel production is used to produce 5% biofuel blends which are expected to be sold uniformly around the UK.
Selection of monitoring sites
The likely continued growth in biofuel consumption in the UK means that evidence for any atmospheric changes in pollutant concentrations should be monitored in parallel with estimates of biofuel emissions from road vehicles. The pilot monitoring project delivers this and monitors the roadside effect of bioethanol use within the UK fleet.
Given that the pattern of consumption of bioethanol relative to petrol consumption is likely to be quite uniform, the strongest signature for ambient concentrations of acetaldehyde and formaldehyde derived from bioethanol consumption will be where petrol vehicle emissions are highest. The places where these emissions will be relatively high will be at roads where:
The traffic flow is high
There is a high proportion of petrol car activity – this would favour an urban roadside site rather than a rural or motorway site where there is generally more diesel activity
28
Ref: Ricardo-AEA/R/ED47833 and ED46645/Issue Number 1
The petrol car fleet is relatively old, hence there will be a higher proportion of older Euro standards with higher VOC emissions
The traffic flow is slow and congested. This enhances vehicle emissions of VOCs.
The following indicators have therefore been used to select the monitoring sites to be used for the study:
The type of road the monitoring station is located by
Traffic flow per day
Proportion of diesel and petrol vehicles which drive by the monitoring site (since the focus of this study is only bioethanol).
To ensure that the results of the monitoring showed the difference in bioethanol consumption specifically, it is also important that the roadside monitoring sites are located at similar heights and are similar distances away from the road.
Ricardo-AEA’s work using Automatic Number Plate Recognition (ANPR) data for the NAEI confirmed the mix of petrol cars is highest on urban roads. Previous work analysing ANPR and licensing data suggested the age of the car fleet on the same type of road was fairly uniform in the UK, but there were certain areas of the country which had a consistently older car fleet registered. One of these was the south-west of England.
Acetaldehyde and formaldehyde are types of VOCs that are formed in the atmosphere from the photochemical degradation of other VOCs. In fact, the majority of these aldehydes detected at a given location will be from this secondary background source rather than direct emissions. It will therefore be important to do paired measurements at a reasonably close background site to determine the photochemically produced background. This background concentration will vary by region around the UK and be strongest during photochemically active periods in the spring and summer, but there should be little difference between an urban roadside and urban background site in the same region (e.g. county). The difference (delta) between the two measurements will be a measure of the direct traffic emissions. The delta will vary with time of day and time of year and should be strongest when there is least photochemical activity (e.g. during the winter). The delta should increase over the campaign if the national bioethanol consumption increases by increasing the strength of bioethanol/petrol mix.
Two paired sites are used:
Chesterfield urban roadside and Chesterfield urban background.
Exeter roadside and Honiton urban background
The Honiton and Exeter sites should be sufficiently close to have the same photochemical background contribution. The Exeter roadside site is also in an area where the petrol car fleet is known to be slightly older than the national average.
A fifth location is recommended at the rural Yarner Wood (Devon) site. This will provide further evidence on the photochemical background and its seasonal variation and would be a useful indicator of this contribution in its own right for regional scale photochemical air pollution modelling.

1
Ref: Ricardo-AEA/R/ED47833 and ED46645/Issue Number 1
Appendices
Appendix 1: 2012 Audit Schedule
Appendix 2: Data capture, maximum and annual mean values from the Automatic Hydrocarbon Network
Appendix 3 Current Non automatic flow audit certificate
Appendix 4: Benzene and 1, 3-Butadiene Timeseries plots, Automatic and Non automatic data
2
Ref: Ricardo-AEA/R/ED47833 and ED46645/Issue Number 1
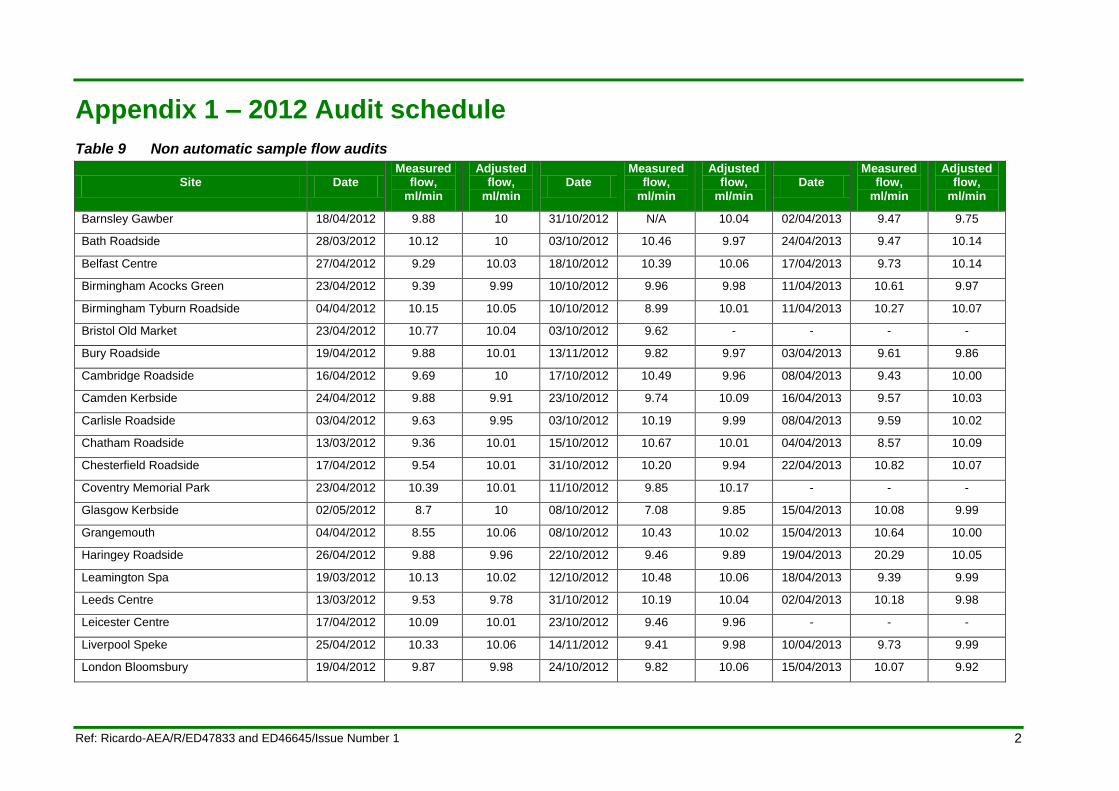
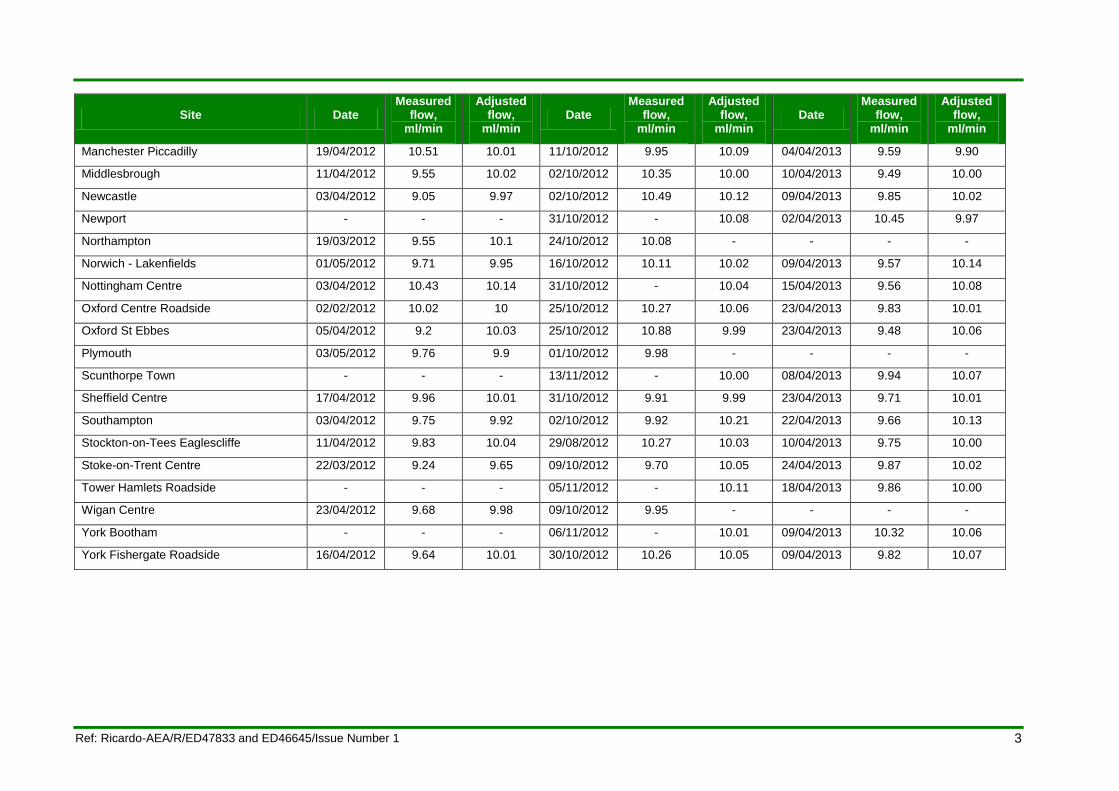
Appendix 1 – 2012 Audit schedule
Table 9 Non automatic sample flow audits
Site Date Measured
flow, ml/min
Adjusted flow,
ml/min Date
Measured flow,
ml/min
Adjusted flow,
ml/min Date
Measured flow,
ml/min
Adjusted flow,
ml/min
Barnsley Gawber 18/04/2012 9.88 10 31/10/2012 N/A 10.04 02/04/2013 9.47 9.75
Bath Roadside 28/03/2012 10.12 10 03/10/2012 10.46 9.97 24/04/2013 9.47 10.14
Belfast Centre 27/04/2012 9.29 10.03 18/10/2012 10.39 10.06 17/04/2013 9.73 10.14
Birmingham Acocks Green 23/04/2012 9.39 9.99 10/10/2012 9.96 9.98 11/04/2013 10.61 9.97
Birmingham Tyburn Roadside 04/04/2012 10.15 10.05 10/10/2012 8.99 10.01 11/04/2013 10.27 10.07
Bristol Old Market 23/04/2012 10.77 10.04 03/10/2012 9.62 - - - -
Bury Roadside 19/04/2012 9.88 10.01 13/11/2012 9.82 9.97 03/04/2013 9.61 9.86
Cambridge Roadside 16/04/2012 9.69 10 17/10/2012 10.49 9.96 08/04/2013 9.43 10.00
Camden Kerbside 24/04/2012 9.88 9.91 23/10/2012 9.74 10.09 16/04/2013 9.57 10.03
Carlisle Roadside 03/04/2012 9.63 9.95 03/10/2012 10.19 9.99 08/04/2013 9.59 10.02
Chatham Roadside 13/03/2012 9.36 10.01 15/10/2012 10.67 10.01 04/04/2013 8.57 10.09
Chesterfield Roadside 17/04/2012 9.54 10.01 31/10/2012 10.20 9.94 22/04/2013 10.82 10.07
Coventry Memorial Park 23/04/2012 10.39 10.01 11/10/2012 9.85 10.17 - - -
Glasgow Kerbside 02/05/2012 8.7 10 08/10/2012 7.08 9.85 15/04/2013 10.08 9.99
Grangemouth 04/04/2012 8.55 10.06 08/10/2012 10.43 10.02 15/04/2013 10.64 10.00
Haringey Roadside 26/04/2012 9.88 9.96 22/10/2012 9.46 9.89 19/04/2013 20.29 10.05
Leamington Spa 19/03/2012 10.13 10.02 12/10/2012 10.48 10.06 18/04/2013 9.39 9.99
Leeds Centre 13/03/2012 9.53 9.78 31/10/2012 10.19 10.04 02/04/2013 10.18 9.98
Leicester Centre 17/04/2012 10.09 10.01 23/10/2012 9.46 9.96 - - -
Liverpool Speke 25/04/2012 10.33 10.06 14/11/2012 9.41 9.98 10/04/2013 9.73 9.99
London Bloomsbury 19/04/2012 9.87 9.98 24/10/2012 9.82 10.06 15/04/2013 10.07 9.92
3
Ref: Ricardo-AEA/R/ED47833 and ED46645/Issue Number 1
Site Date Measured
flow, ml/min
Adjusted flow,
ml/min Date
Measured flow,
ml/min
Adjusted flow,
ml/min Date
Measured flow,
ml/min
Adjusted flow,
ml/min
Manchester Piccadilly 19/04/2012 10.51 10.01 11/10/2012 9.95 10.09 04/04/2013 9.59 9.90
Middlesbrough 11/04/2012 9.55 10.02 02/10/2012 10.35 10.00 10/04/2013 9.49 10.00
Newcastle 03/04/2012 9.05 9.97 02/10/2012 10.49 10.12 09/04/2013 9.85 10.02
Newport - - - 31/10/2012 - 10.08 02/04/2013 10.45 9.97
Northampton 19/03/2012 9.55 10.1 24/10/2012 10.08 - - - -
Norwich - Lakenfields 01/05/2012 9.71 9.95 16/10/2012 10.11 10.02 09/04/2013 9.57 10.14
Nottingham Centre 03/04/2012 10.43 10.14 31/10/2012 - 10.04 15/04/2013 9.56 10.08
Oxford Centre Roadside 02/02/2012 10.02 10 25/10/2012 10.27 10.06 23/04/2013 9.83 10.01
Oxford St Ebbes 05/04/2012 9.2 10.03 25/10/2012 10.88 9.99 23/04/2013 9.48 10.06
Plymouth 03/05/2012 9.76 9.9 01/10/2012 9.98 - - - -
Scunthorpe Town - - - 13/11/2012 - 10.00 08/04/2013 9.94 10.07
Sheffield Centre 17/04/2012 9.96 10.01 31/10/2012 9.91 9.99 23/04/2013 9.71 10.01
Southampton 03/04/2012 9.75 9.92 02/10/2012 9.92 10.21 22/04/2013 9.66 10.13
Stockton-on-Tees Eaglescliffe 11/04/2012 9.83 10.04 29/08/2012 10.27 10.03 10/04/2013 9.75 10.00
Stoke-on-Trent Centre 22/03/2012 9.24 9.65 09/10/2012 9.70 10.05 24/04/2013 9.87 10.02
Tower Hamlets Roadside - - - 05/11/2012 - 10.11 18/04/2013 9.86 10.00
Wigan Centre 23/04/2012 9.68 9.98 09/10/2012 9.95 - - - -
York Bootham - - - 06/11/2012 - 10.01 09/04/2013 10.32 10.06
York Fishergate Roadside 16/04/2012 9.64 10.01 30/10/2012 10.26 10.05 09/04/2013 9.82 10.07
4
Ref: Ricardo-AEA/R/ED47833 and ED46645/Issue Number 1
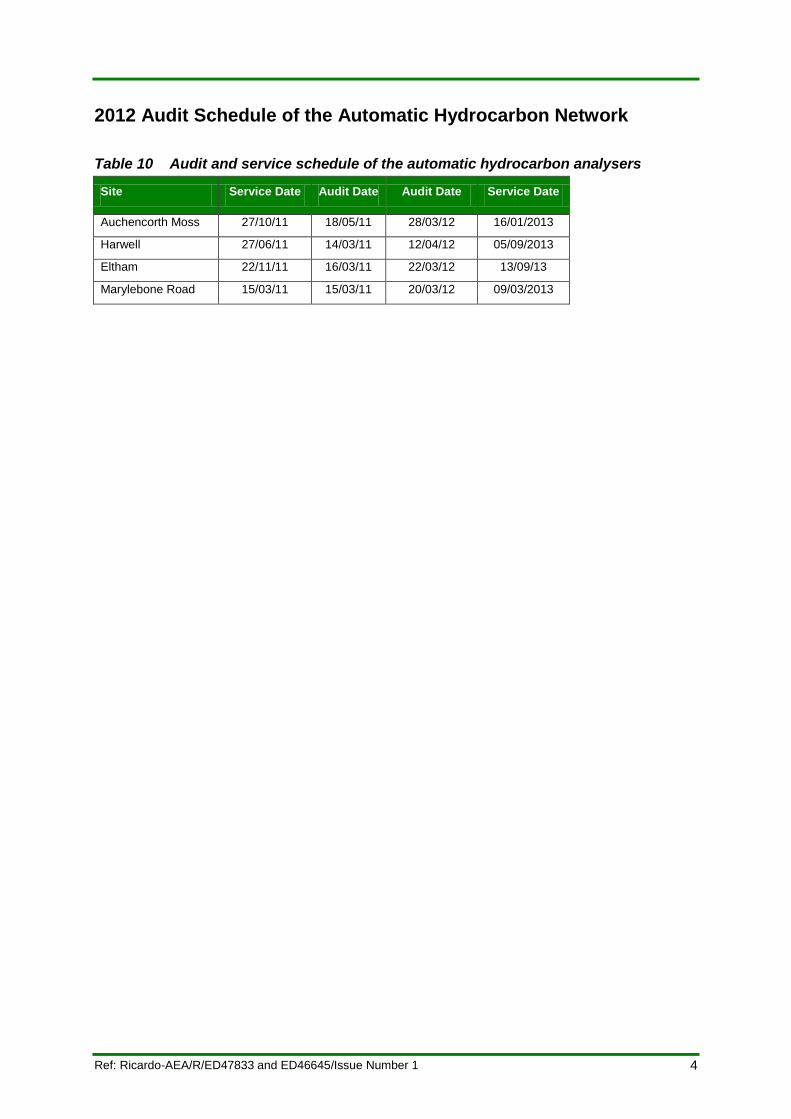
2012 Audit Schedule of the Automatic Hydrocarbon Network
Table 10 Audit and service schedule of the automatic hydrocarbon analysers
Site Service Date Audit Date Audit Date Service Date
Auchencorth Moss 27/10/11 18/05/11 28/03/12 16/01/2013
Harwell 27/06/11 14/03/11 12/04/12 05/09/2013
Eltham 22/11/11 16/03/11 22/03/12 13/09/13
Marylebone Road 15/03/11 15/03/11 20/03/12 09/03/2013
5
Ref: Ricardo-AEA/R/ED47833 and ED46645/Issue Number 1
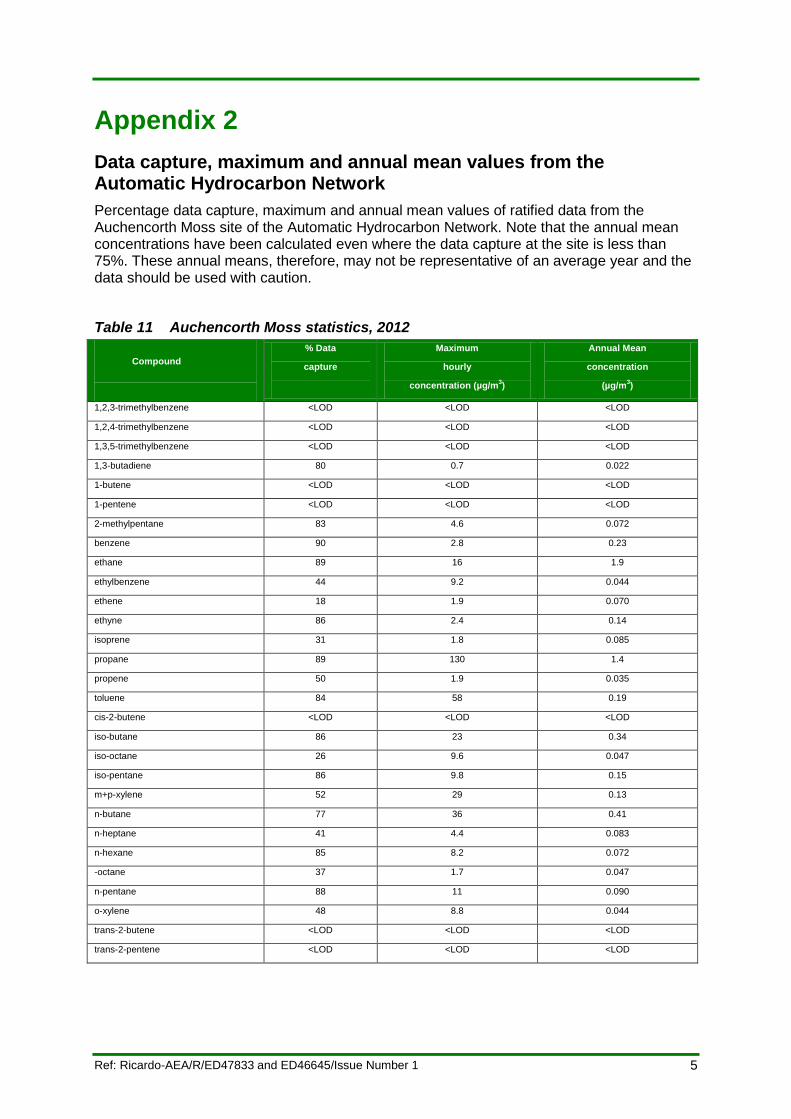
Appendix 2
Data capture, maximum and annual mean values from the Automatic Hydrocarbon Network
Percentage data capture, maximum and annual mean values of ratified data from the Auchencorth Moss site of the Automatic Hydrocarbon Network. Note that the annual mean concentrations have been calculated even where the data capture at the site is less than 75%. These annual means, therefore, may not be representative of an average year and the data should be used with caution.
Table 11 Auchencorth Moss statistics, 2012
Compound
% Data
capture
Maximum
hourly
concentration (µg/m3)
Annual Mean
concentration
(µg/m3)
1,2,3-trimethylbenzene <LOD <LOD <LOD
1,2,4-trimethylbenzene <LOD <LOD <LOD
1,3,5-trimethylbenzene <LOD <LOD <LOD
1,3-butadiene 80 0.7 0.022
1-butene <LOD <LOD <LOD
1-pentene <LOD <LOD <LOD
2-methylpentane 83 4.6 0.072
benzene 90 2.8 0.23
ethane 89 16 1.9
ethylbenzene 44 9.2 0.044
ethene 18 1.9 0.070
ethyne 86 2.4 0.14
isoprene 31 1.8 0.085
propane 89 130 1.4
propene 50 1.9 0.035
toluene 84 58 0.19
cis-2-butene <LOD <LOD <LOD
iso-butane 86 23 0.34
iso-octane 26 9.6 0.047
iso-pentane 86 9.8 0.15
m+p-xylene 52 29 0.13
n-butane 77 36 0.41
n-heptane 41 4.4 0.083
n-hexane 85 8.2 0.072
-octane 37 1.7 0.047
n-pentane 88 11 0.090
o-xylene 48 8.8 0.044
trans-2-butene <LOD <LOD <LOD
trans-2-pentene <LOD <LOD <LOD
6
Ref: Ricardo-AEA/R/ED47833 and ED46645/Issue Number 1
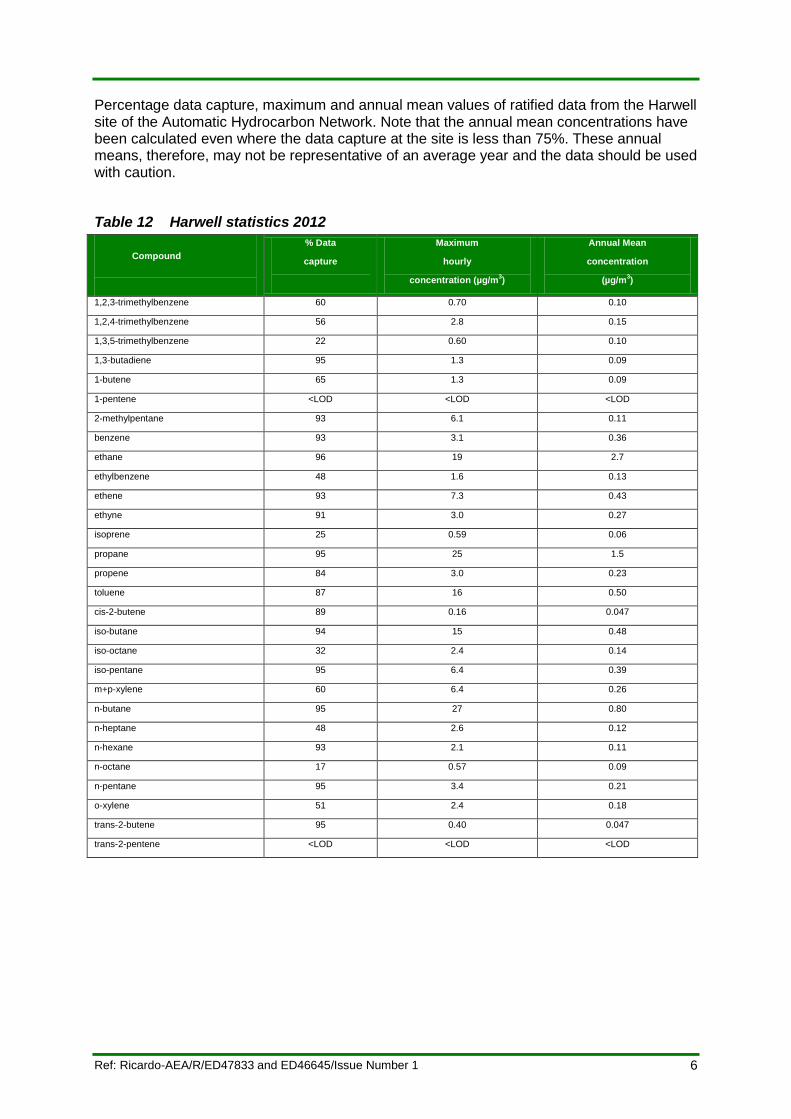
Percentage data capture, maximum and annual mean values of ratified data from the Harwell site of the Automatic Hydrocarbon Network. Note that the annual mean concentrations have been calculated even where the data capture at the site is less than 75%. These annual means, therefore, may not be representative of an average year and the data should be used with caution.
Table 12 Harwell statistics 2012
Compound
% Data
capture
Maximum
hourly
concentration (µg/m3)
Annual Mean
concentration
(µg/m3)
1,2,3-trimethylbenzene 60 0.70 0.10
1,2,4-trimethylbenzene 56 2.8 0.15
1,3,5-trimethylbenzene 22 0.60 0.10
1,3-butadiene 95 1.3 0.09
1-butene 65 1.3 0.09
1-pentene <LOD <LOD <LOD
2-methylpentane 93 6.1 0.11
benzene 93 3.1 0.36
ethane 96 19 2.7
ethylbenzene 48 1.6 0.13
ethene 93 7.3 0.43
ethyne 91 3.0 0.27
isoprene 25 0.59 0.06
propane 95 25 1.5
propene 84 3.0 0.23
toluene 87 16 0.50
cis-2-butene 89 0.16 0.047
iso-butane 94 15 0.48
iso-octane 32 2.4 0.14
iso-pentane 95 6.4 0.39
m+p-xylene 60 6.4 0.26
n-butane 95 27 0.80
n-heptane 48 2.6 0.12
n-hexane 93 2.1 0.11
n-octane 17 0.57 0.09
n-pentane 95 3.4 0.21
o-xylene 51 2.4 0.18
trans-2-butene 95 0.40 0.047
trans-2-pentene <LOD <LOD <LOD
7
Ref: Ricardo-AEA/R/ED47833 and ED46645/Issue Number 1
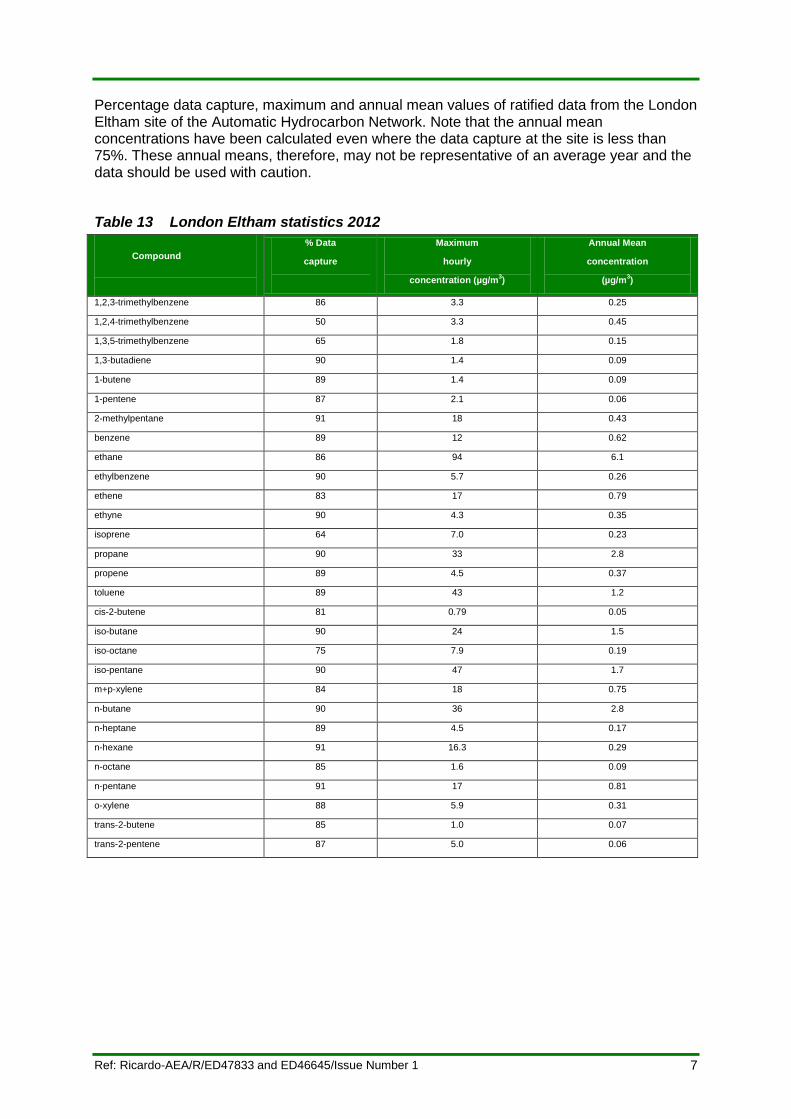
Percentage data capture, maximum and annual mean values of ratified data from the London Eltham site of the Automatic Hydrocarbon Network. Note that the annual mean concentrations have been calculated even where the data capture at the site is less than 75%. These annual means, therefore, may not be representative of an average year and the data should be used with caution.
Table 13 London Eltham statistics 2012
Compound
% Data
capture
Maximum
hourly
concentration (µg/m3)
Annual Mean
concentration
(µg/m3)
1,2,3-trimethylbenzene 86 3.3 0.25
1,2,4-trimethylbenzene 50 3.3 0.45
1,3,5-trimethylbenzene 65 1.8 0.15
1,3-butadiene 90 1.4 0.09
1-butene 89 1.4 0.09
1-pentene 87 2.1 0.06
2-methylpentane 91 18 0.43
benzene 89 12 0.62
ethane 86 94 6.1
ethylbenzene 90 5.7 0.26
ethene 83 17 0.79
ethyne 90 4.3 0.35
isoprene 64 7.0 0.23
propane 90 33 2.8
propene 89 4.5 0.37
toluene 89 43 1.2
cis-2-butene 81 0.79 0.05
iso-butane 90 24 1.5
iso-octane 75 7.9 0.19
iso-pentane 90 47 1.7
m+p-xylene 84 18 0.75
n-butane 90 36 2.8
n-heptane 89 4.5 0.17
n-hexane 91 16.3 0.29
n-octane 85 1.6 0.09
n-pentane 91 17 0.81
o-xylene 88 5.9 0.31
trans-2-butene 85 1.0 0.07
trans-2-pentene 87 5.0 0.06
8
Ref: Ricardo-AEA/R/ED47833 and ED46645/Issue Number 1
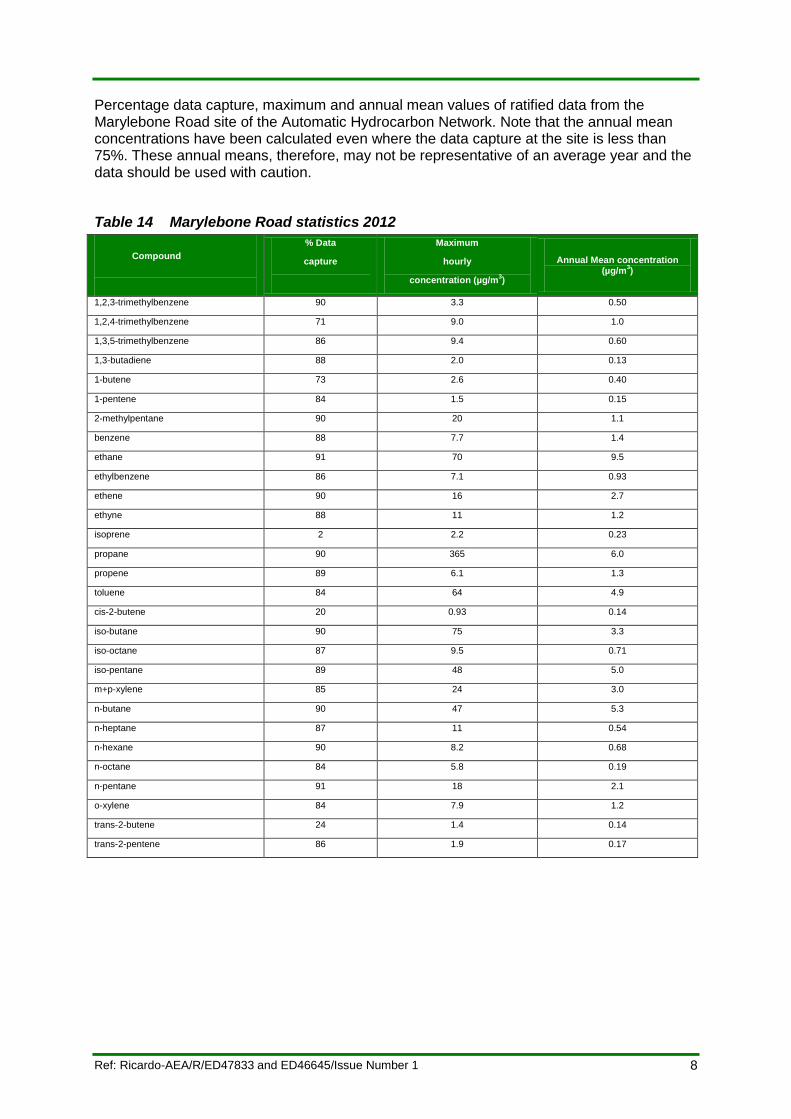
Percentage data capture, maximum and annual mean values of ratified data from the Marylebone Road site of the Automatic Hydrocarbon Network. Note that the annual mean concentrations have been calculated even where the data capture at the site is less than 75%. These annual means, therefore, may not be representative of an average year and the data should be used with caution.
Table 14 Marylebone Road statistics 2012
Compound
% Data
capture
Maximum
hourly
concentration (µg/m3)
Annual Mean concentration (µg/m
3)
1,2,3-trimethylbenzene 90 3.3 0.50
1,2,4-trimethylbenzene 71 9.0 1.0
1,3,5-trimethylbenzene 86 9.4 0.60
1,3-butadiene 88 2.0 0.13
1-butene 73 2.6 0.40
1-pentene 84 1.5 0.15
2-methylpentane 90 20 1.1
benzene 88 7.7 1.4
ethane 91 70 9.5
ethylbenzene 86 7.1 0.93
ethene 90 16 2.7
ethyne 88 11 1.2
isoprene 2 2.2 0.23
propane 90 365 6.0
propene 89 6.1 1.3
toluene 84 64 4.9
cis-2-butene 20 0.93 0.14
iso-butane 90 75 3.3
iso-octane 87 9.5 0.71
iso-pentane 89 48 5.0
m+p-xylene 85 24 3.0
n-butane 90 47 5.3
n-heptane 87 11 0.54
n-hexane 90 8.2 0.68
n-octane 84 5.8 0.19
n-pentane 91 18 2.1
o-xylene 84 7.9 1.2
trans-2-butene 24 1.4 0.14
trans-2-pentene 86 1.9 0.17
9
Ref: Ricardo-AEA/R/ED47833 and ED46645/Issue Number 1
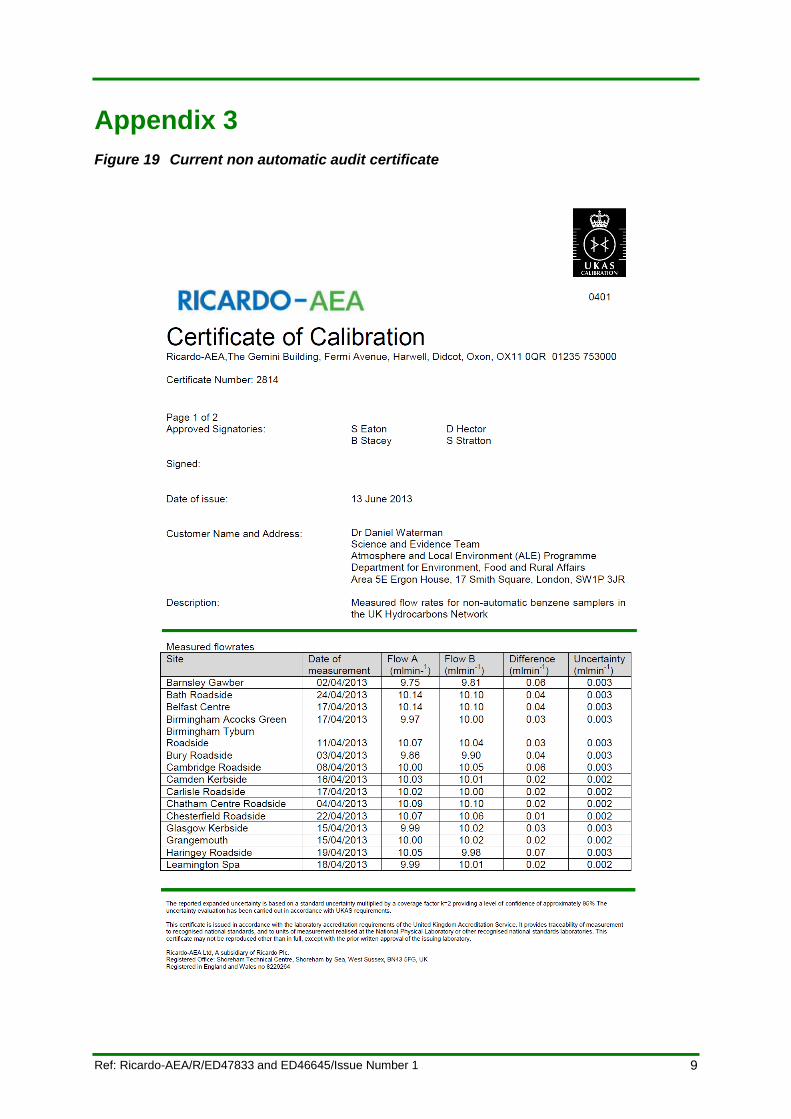
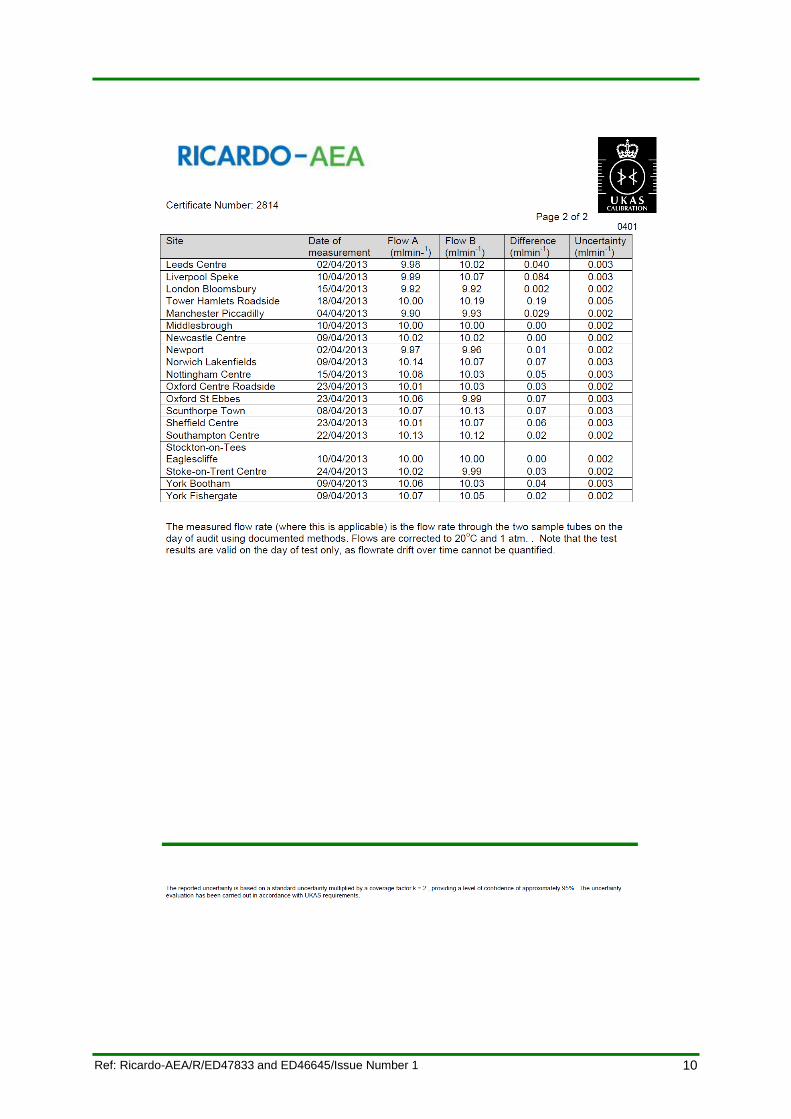
Appendix 3
Figure 19 Current non automatic audit certificate
10
Ref: Ricardo-AEA/R/ED47833 and ED46645/Issue Number 1
11
Ref: Ricardo-AEA/R/ED47833 and ED46645/Issue Number 1
Appendix 4
Automatic Hourly Mean Graphs for Benzene and 1, 3-Butadiene
Figure 20 Auchencorth Moss 1,3-Butadiene hourly mean concentrations 2012
Figure 21 Auchencorth Moss Benzene hourly mean concentrations 2012
12
Ref: Ricardo-AEA/R/ED47833 and ED46645/Issue Number 1
Figure 22 Harwell 1,3-Butadiene hourly mean concentrations 2012
Figure 23 Harwell Benzene hourly mean concentrations 2012
13
Ref: Ricardo-AEA/R/ED47833 and ED46645/Issue Number 1
Figure 24 London Eltham 1,3-Butadiene hourly mean concentrations 2012
Figure 25 London Eltham Benzene hourly mean concentrations 2012
14
Ref: Ricardo-AEA/R/ED47833 and ED46645/Issue Number 1
Figure 26 London Marylebone Road 1,3-Butadiene hourly mean concentrations 2012
Figure 27 London Marylebone Road Benzene hourly mean concentrations 2012
15
Ref: Ricardo-AEA/R/ED47833 and ED46645/Issue Number 1
Non Automatic Fortnightly Mean Graphs for Benzene
Figure 28 Barnsley Gawber Non Automatic fortnightly Benzene
Figure 29 Bath Roadside Non Automatic fortnightly benzene
16
Ref: Ricardo-AEA/R/ED47833 and ED46645/Issue Number 1
Figure 30 Belfast Centre Non Automatic fortnightly Benzene
Figure 31 Birmingham Acocks Green Non Automatic fortnightly Benzene
17
Ref: Ricardo-AEA/R/ED47833 and ED46645/Issue Number 1
Figure 3230 Birmingham Tyburn Roadside Non Automatic fortnightly Benzene
Figure 33 Bristol Old Market Non Automatic fortnightly Benzene
18
Ref: Ricardo-AEA/R/ED47833 and ED46645/Issue Number 1
Figure 34 Bury Roadside Non Automatic fortnightly Benzene
Figure 35 Cambridge Roadside Non Automatic fortnightly Benzene
19
Ref: Ricardo-AEA/R/ED47833 and ED46645/Issue Number 1
Figure 36 Camden Kerbside Non Automatic fortnightly Benzene
Figure 37 Carlisle Roadside Non Automatic fortnightly Benzene
20
Ref: Ricardo-AEA/R/ED47833 and ED46645/Issue Number 1
Figure 38 Chatham Roadside Non Automatic fortnightly Benzene
Figure 39 Chesterfield Roadside Non Automatic fortnightly Benzene
21
Ref: Ricardo-AEA/R/ED47833 and ED46645/Issue Number 1
Figure 40 Coventry Memorial Park Non Automatic fortnightly Benzene
Figure 41 Glasgow Kerbside Non Automatic fortnightly Benzene
22
Ref: Ricardo-AEA/R/ED47833 and ED46645/Issue Number 1
Figure 42 Grangemouth Non Automatic fortnightly Benzene
Note that there was a significantly elevated result in Grangemouth during July 2012 (Figure 39) and the data was correctly ratified. Upon investigation, the elevated levels at Grangemouth between 19th Julyand 3rd August 2012 were found to correspond to an incident at the Petroineos Plant petrochemical plant. It was reported that a collapsed roof to a stabilised gasoline tank occurred during this period and this is considered to be a major source of the high fortnightly measurement
Figure 43 Haringey Roadside Non Automatic fortnightly Benzene
23
Ref: Ricardo-AEA/R/ED47833 and ED46645/Issue Number 1
Figure 44 Leamington Spa Non Automatic fortnightly Benzene
Figure 45 Leeds Centre Non Automatic fortnightly Benzene
24
Ref: Ricardo-AEA/R/ED47833 and ED46645/Issue Number 1
Figure 46 Leicester Centre Non Automatic fortnightly Benzene
Figure 47 Liverpool Speke Non Automatic fortnightly Benzene
25
Ref: Ricardo-AEA/R/ED47833 and ED46645/Issue Number 1
Figure 48 London Bloomsbury Non Automatic fortnightly Benzene
Figure 49 Manchester Piccadilly Non Automatic fortnightly Benzene
26
Ref: Ricardo-AEA/R/ED47833 and ED46645/Issue Number 1
Figure 50 Middlesbrough Centre Non Automatic fortnightly Benzene
Figure 51 Newcastle Centre Non Automatic fortnightly Benzene
27
Ref: Ricardo-AEA/R/ED47833 and ED46645/Issue Number 1
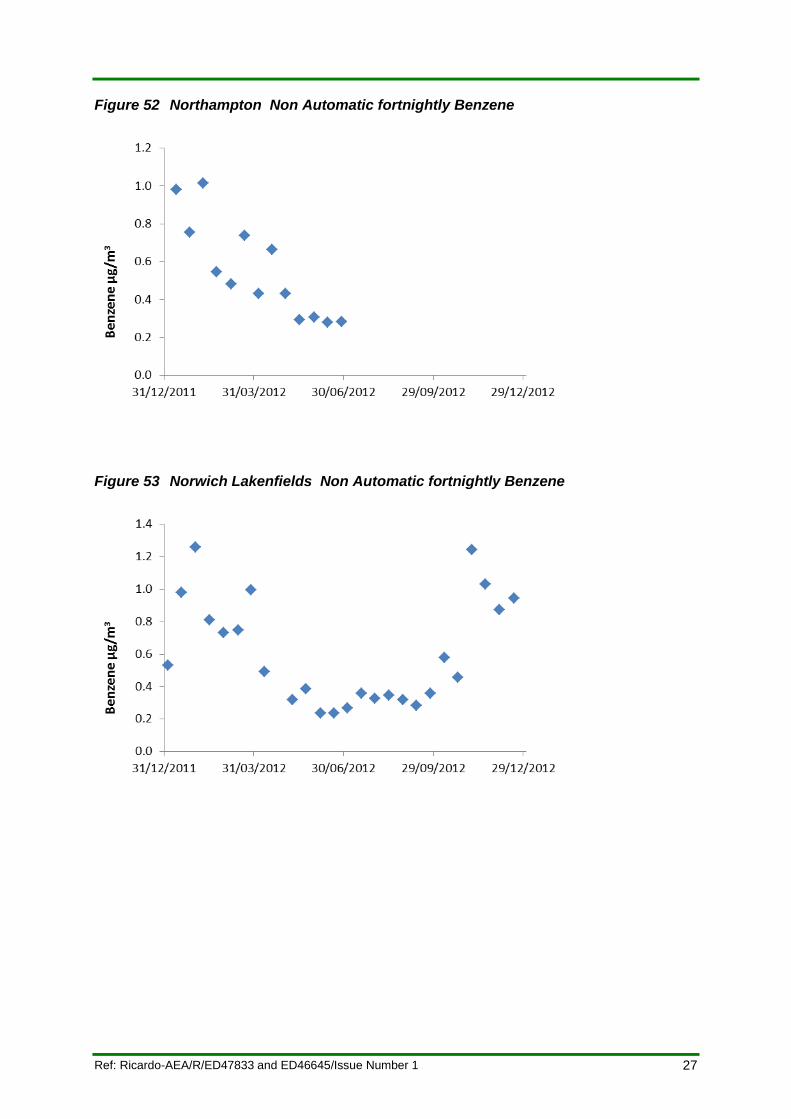
Figure 52 Northampton Non Automatic fortnightly Benzene
Figure 53 Norwich Lakenfields Non Automatic fortnightly Benzene
28
Ref: Ricardo-AEA/R/ED47833 and ED46645/Issue Number 1
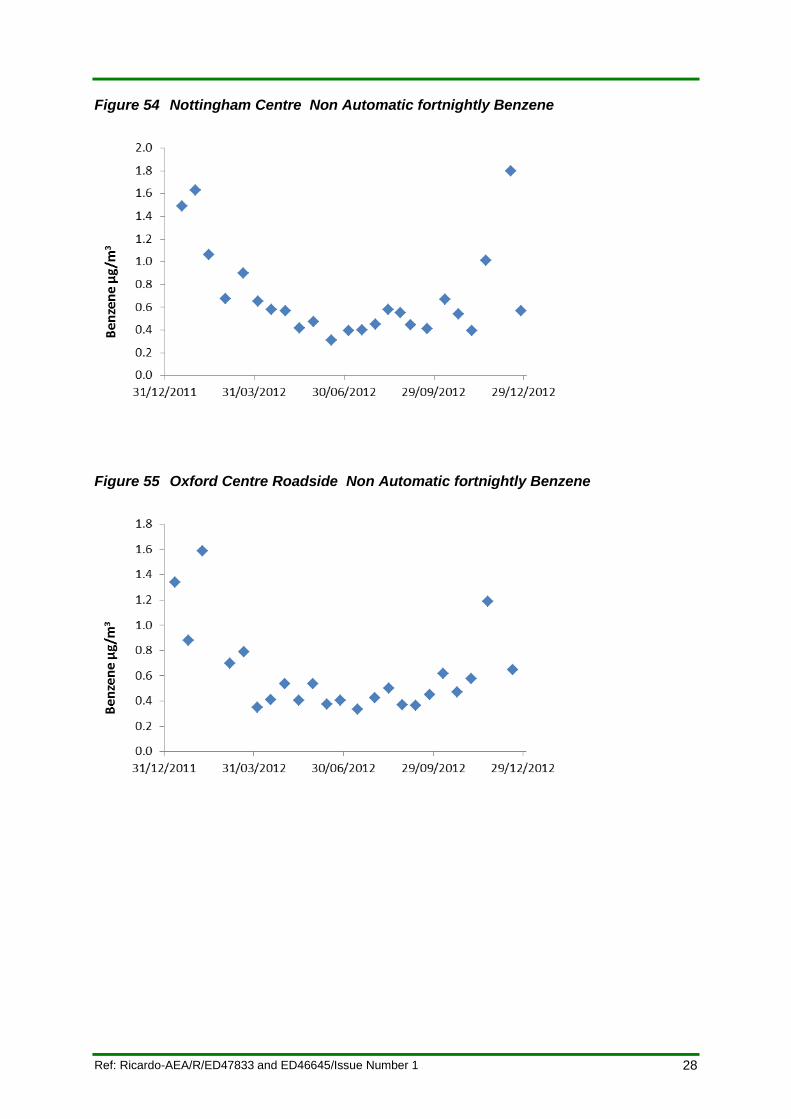
Figure 54 Nottingham Centre Non Automatic fortnightly Benzene
Figure 55 Oxford Centre Roadside Non Automatic fortnightly Benzene
29
Ref: Ricardo-AEA/R/ED47833 and ED46645/Issue Number 1
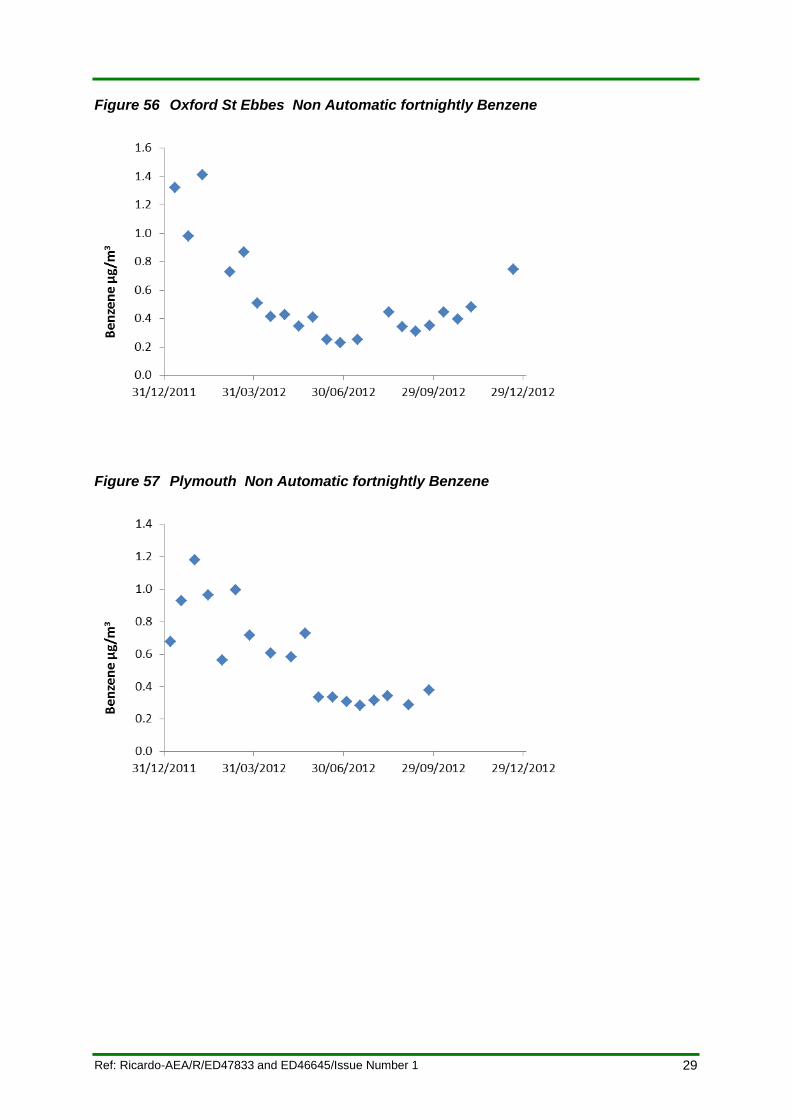
Figure 56 Oxford St Ebbes Non Automatic fortnightly Benzene
Figure 57 Plymouth Non Automatic fortnightly Benzene
30
Ref: Ricardo-AEA/R/ED47833 and ED46645/Issue Number 1
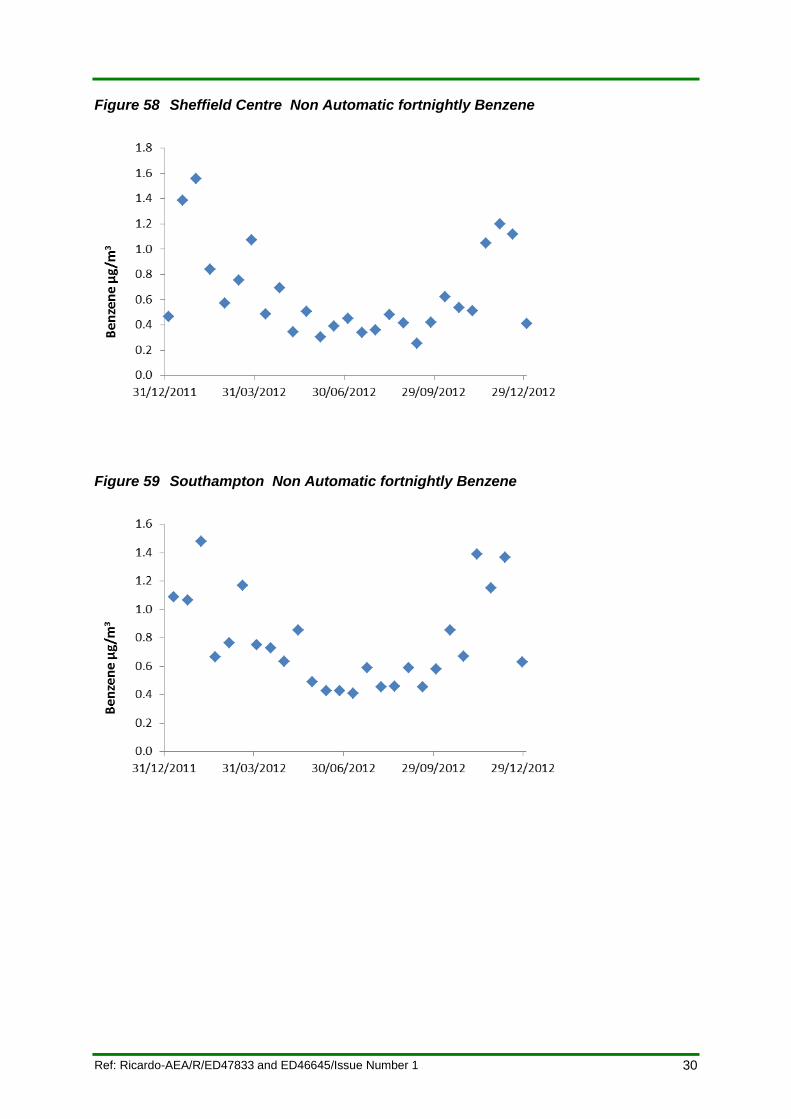
Figure 58 Sheffield Centre Non Automatic fortnightly Benzene
Figure 59 Southampton Non Automatic fortnightly Benzene
31
Ref: Ricardo-AEA/R/ED47833 and ED46645/Issue Number 1
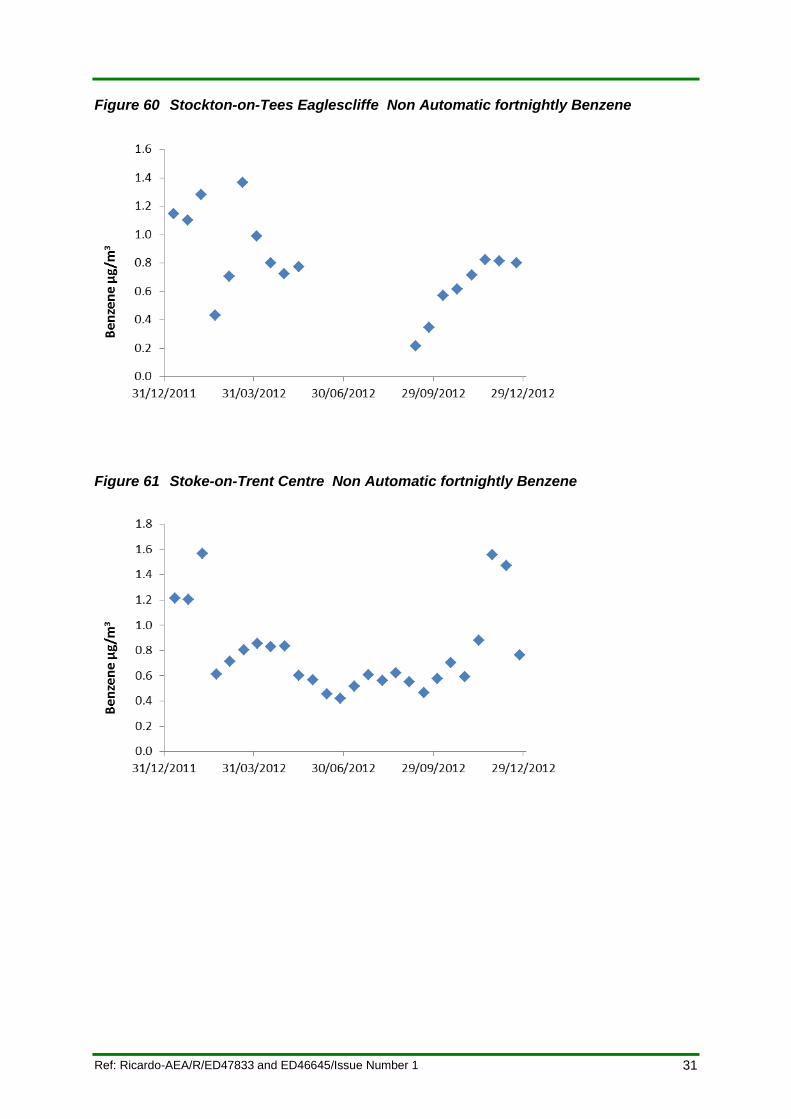
Figure 60 Stockton-on-Tees Eaglescliffe Non Automatic fortnightly Benzene
Figure 61 Stoke-on-Trent Centre Non Automatic fortnightly Benzene
32
Ref: Ricardo-AEA/R/ED47833 and ED46645/Issue Number 1
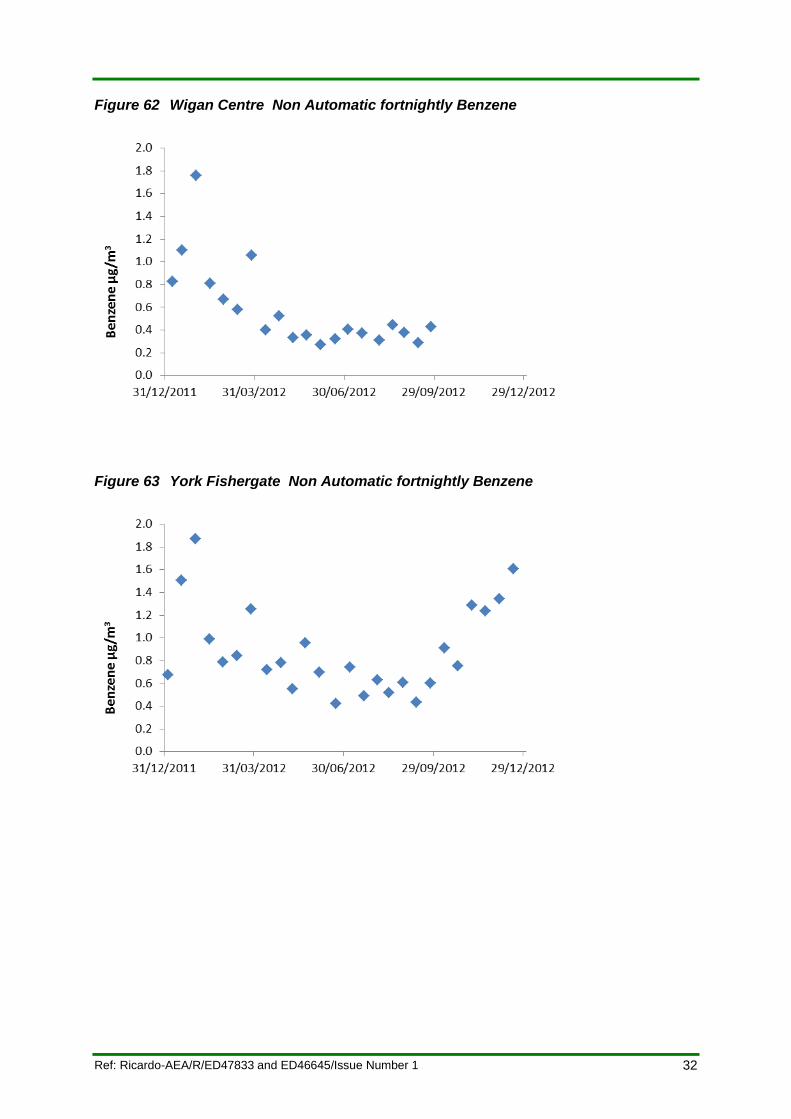
Figure 62 Wigan Centre Non Automatic fortnightly Benzene
Figure 63 York Fishergate Non Automatic fortnightly Benzene


The Gemini Building Fermi Avenue Harwell Didcot Oxfordshire OX11 0QR
Tel: 0870 190 1900 Fax: 0870 190 6318
www.ricardo-aea.com